 Fatma A. Al-Malki
 Zahra S. Al-Kharousi
 Nejib Guizani
 Ismail M. Al-Bulushi
 Abdullah M. Al-Sadi
95% of researchers rate our articles as excellent or good
Learn more about the work of our research integrity team to safeguard the quality of each article we publish.
Find out more
ORIGINAL RESEARCH article
Front. Sustain. Food Syst. , 13 July 2023
Sec. Sustainable Food Processing
Volume 7 - 2023 | https://doi.org/10.3389/fsufs.2023.1142152
This article is part of the Research Topic Fermentation and Enzymatic Processes for the Production of Functional Food View all 6 articles
Introduction: The indigenous microbiota of traditional date vinegar is inadequately reported in the literature, yet its understanding is necessary for the industrial development of this product. This study aimed to perform microbiological and chemical analyses of traditional date vinegar.
Methods: Forty home-made samples (HMS) and laboratory-made samples (LMS) of date vinegar were analyzed. Escherichia coli, coliforms, and Enterobacteriaceae were enumerated using conventional plate methods to evaluate the hygienic quality. Bacteria and yeasts were identified by polymerase chain reaction. Acetic acid, ethanol, and methanol contents were analyzed by headspace gas chromatography.
Results and Discussion: Escherichia coli was not detected in any sample. Coliforms and Enterobacteriaceae occurred in 75 and 67% of HMS, respectively, and in 3.6% (both groups) of LMS. The LMS had better hygienic quality and supported better growth of yeasts and AAB than the HMS. Thirty-five yeasts belonged to 6 genera and 55 acetic acid bacteria (AAB) to 5 Gluconobacter species. The highest content of ethanol correlated with the presence of Saccharomyces cerevisiae. Gluconobacter japonicus and Gluconobacter oxydans tolerated 7.5% ethanol. Gluconobacter frateurii survived at pH 2.59. The percentage of acetic acid was less than the international recommended standard levels and ranged from 0.09% to 3.38%, and 0.03% to 3.46% in HMS, and LMS, respectively. The content of ethanol ranged from 0.14% to 2.17%, and 0.07% to 7.81% in HMS, and LMS, respectively. Methanol was less in LMS (≤ 0.06%) than in HMS (≤ 0.17%). Utilizing the traditional method for producing date vinegar does not assure the production of true and safe vinegar that contains the specified levels of acetic acid and ethanol. It may also contain unacceptable levels of the toxic chemical methanol. However, a high microbial diversity of yeasts and Gluconobacter spp. was identified which indicates the potential of producing a high-quality and safe product by modifying the production process possibly by using the isolated yeasts and AAB as starter cultures.
One of the earliest cultivated plants in the world is the date palm (Phoenix dactylifera L.) that had been cultivated for 5,000 years (Hamden et al., 2022) in arid and semi-arid regions of the world and is considered one of the most important fruits in the Arabian Peninsula (Al-Bulushi et al., 2017). The main producer countries in the world include Egypt, Iran, Saudi Arabia, Algeria, Iraq, Pakistan, Oman, and the United Arab Emirates (Maqsood et al., 2020). In the late 1800s, the United States introduced some of the best verities of dates to Texas, Arizona, and Sothern California (Baliga et al., 2011). Oman is ranked the eighth-largest country in date’s production with an average production of 260,000 metric tons per year (Al-Yahyai and Khan, 2015). The fruit of the date palm (Phoenix dactylifera L.) contains carbohydrates, proteins, fibers, fats, minerals, vitamins, and polyphenols (Matloob and Balakita, 2016). Although a low-quality date that is dark in color or black, small, bruised with undesirable flavor (see Sarraf et al., 2021 for date fruit quality) is unmarketable, its high content of sugars potentiates its use as a raw material for manufacturing several value-added products, such as date syrup, date paste, liquid sugar, and vinegar (Mohamed and Fennir, 2017). Vinegar is a liquid product that contains alcohols, acids, esters, aldehydes, and ketones, in which acetic acid is the main volatile component that gives vinegar its sour flavor and identifies it as vinegar (Ho et al., 2017). It is obtained from carbohydrate sources by alcoholic and subsequent acetous fermentation. In alcoholic fermentation, yeasts convert sugars to alcohol, while acetic acid bacteria (AAB) are involved in the second process of the acetous fermentation in which alcohol is oxidized to acetic acid. The AAB can also oxidize carbohydrates, sugar alcohols, and alcohols into organic acids, aldehydes, or ketones (Komagata et al., 2014).
The main groups of fermenting yeasts that produce the alcoholic substrate from carbohydrates are the yeasts belonging to the genus Saccharomyces, apiculate yeasts of the genera Hanseniaspora and Kloeckera, lactose-fermenting yeasts of the genus Kluyveromyces, and osmophilic yeasts of the genus Zygosaccharomyces (Solieri and Giudici, 2009; Villarreal et al., 2022). The most common five genera of AAB are Acetobacter, Gluconobacter, Gluconacetobacter, Asaia, and Komagataeibacter. The main three genera of AAB responsible for acetic fermentation in vinegar are Acetobacter, Gluconacetobacter, and Komagataeibacter (Yetiman and Kesmen, 2015). Throughout the oxidation process, AAB grow on the surface of the liquid and form a non-toxic film composed of AAB and cellulose which accumulate on the surface of the vinegar. This film is known as the “mother of vinegar”. It plays an important role in the production of vinegar and can be reused in the back-slopping practice as a starter culture to trigger the acetification required for vinegar production (Hidalgo et al., 2012). Gluconobacter strains prefer sugar-enriched environments while Acetobacter strains prefer alcohol-enriched and acidic environments such as vinegar, wine, and beer. Some genera of AAB oxidize the produced acetic acid to CO2 and H2O while Gluconobacter does not (Gomes et al., 2018).
Date vinegar is prepared from fermented dried date fruit and is commonly used as a condiment due to its nutritional and health benefits, ability to act as an antimicrobial agent, and to flavor foods (Mohamed and Fennir, 2017). Despite dates are produced in many countries and that the date vinegar has been consumed since ancient times, few studies are available on the date vinegar (Matloob, 2014; Halladj et al., 2016; Matloob and Balakita, 2016; Mohamed and Fennir, 2017) and none of them focused on the microbiological aspects of the date vinegar, especially its indigenous microflora.
In Oman, traditional homemade date vinegar is the major ingredient in marinated meat recipes. It is prepared by mixing water and dried dates and leaving the mixture for 10–40 days during which the spontaneous fermentation is assumed to take place. The product of this process may be considered an herbal-flavored vinegar (Solieri and Giudici, 2009) in which garlic, peppers, dried lemon, and other herbs are commonly added at the start of the fermentation process. It is important to emphasize that although the product throughout this paper is called date vinegar, as it is locally named, however, this term does not necessarily imply that the product meets the international standards used to identify the product as vinegar. This is because the production process is not controlled, the quality of the product remains undetermined, and no scientific standards exist for this product in Oman. It was hypothesized that the date vinegar contains yeasts and acetic acid bacteria capable of producing ethanol and acetic acid, respectively, at levels acceptable by the international standards. The aim of this study was to test the efficiency of the traditional method used for the production of “date vinegar” by examining homemade and lab-made samples prepared using the same traditional method. In particular, the objectives of this work were to analyze the samples at different stages of the production process for ethanol, methanol, acetic acid, and pH, to study the hygienic condition of the products by enumerating Escherichia coli, coliforms, and Enterobacteriaceae, and to isolate and identify AAB and yeasts isolated from the samples. This work can give an insight into the quality and safety of date vinegar produced using the traditional method.
According to their availability, 12 traditional date vinegar samples were collected from different regions in Oman (Al-Batinah, Al-Dakhlya, Muscat, and A’Sharqiyah). They included 6 samples that were fermented for 10 days and 6 other samples in which each two of them were fermented for 20, 30, and 40 days. Additional information about these samples are provided in Supplementary Table S1. The samples were prepared from various varieties of dates; mainly “Khalas, Fardh, and Um al Sila” and sometimes with the addition of dried lemon, red pepper, and salt. The samples were stored in closed food buckets and fermented for about 10–40 days. The traditional method of production of date vinegar in Oman is described in Supplementary Figure S1.
The dried date (Phoenix dactylifera L.) was collected from a local farm in Al-Batinah Governorate. The same variety of low-quality date “Um al Sila” was used in the experiment. The procedures were similar to the homemade method (spontaneous fermentation) but with some modifications. Dried dates with seeds were homogenized with sterile mineral water (Oasis, Oman) in a stomacher (BAGMIXER 100 MiniMix, Interscience, Bois Arpents, France) for 1 min. The mixture was put in closed jars. The ratio of the date to water was 1:4 (w/v); 375 g of date fruit and 1,500 mL of water (Mohamed and Fennir, 2017). All of the 28 prepared samples were kept at 30°C in an incubator (Gallen Kamp, United Kingdom) in which every six samples were incubated for a specific duration 10, 20, 30, 40, or 50 days (four samples were prepared for 50 days incubation period). Samples were kept closed during the incubation period, as the traditional date vinegar is prepared in Oman. However, it is worth mentioning that the containers had spaces with trapped air above the mixture and beneath the lids.
The samples were analyzed aseptically in a biosafety cabinet (Purifier class II, Labconco, Kansas, United States). The AAB were isolated and the yeasts, Enterobacteriaceae, coliforms, and E. coli were counted on appropriate selective media. All chemicals and media were from Oxoid, United Kingdom except the specified ones.
AAB were first enriched in an enrichment broth that contained 1% D-Glucose (w/v), 0.5% ethanol (v/v), 1.5% peptone (w/v), 0.8% yeast extract (w/v), 0.3% acetic acid (v/v), and 0.01% cycloheximide (w/v) and the pH was adjusted to 3.5 using 4% HCl (ThermoFisher Scientific, United States) (Yamada et al., 1999). The addition of cycloheximide was necessary to inhibit the overgrowth of yeasts especially in the early stage of fermentation. One mL of the sample was mixed with 5 mL of the enrichment medium and incubated at 30°C for 5–7 days. A modified medium of “Glucose Yeast Extract Peptone Ethanol Calcium carbonate; GYPEC” was used for the isolation of AAB (Yamada et al., 1999; Lisdiyanti et al., 2003; Mounir et al., 2016). This medium contained 2.0% D-glucose (w/v), 0.8% yeast extract (w/v), 0.5% peptone (w/v), 0.5% ethanol (v/v), 0.3% CaCO3 (w/v), 1.5% agar (w/v), and bromocresol green 0.022 g/L. A loopful of each enrichment sample was streaked on the isolation medium and incubated at 30°C for 3–5 days. Bacteria that produced a clear halo on the medium and changed the green color of bromocresol to yellow, as an indicator of the production of acetic acid, were presumptively identified as AAB. Gram staining and Gram reaction were performed for these bacteria, and they were tested for the presence of catalase and oxidase (Al-Bulushi, 2018, p. 21). In total, 55 isolates of presumptively identified AAB were preserved in cryogenic vials with beads (Viabank, United Kingdom) at −80°C. In addition, the presence of lactic acid bacteria (LAB) was checked by preparing dilutions from vinegar samples (see Section 2.3.2) and plating 0.1 mL of different dilutions on MRS agar (De MAN Rogosa and Sharp) and incubating the plates for 72 h at 30°C (Al-Bulushi, 2018, p. 52).
Yeasts and molds were counted on Potato Dextrose Agar (PDA) using the spread plate method (Hassan et al., 2011). The vinegar samples were diluted by transferring 1 mL of the sample to 9 mL of Maximum Recovery Diluent (MRD) to yield 10−1 dilution. Other serial dilutions were prepared as required. Then, 0.1 mL of the test sample and the dilutions were spread on PDA plates and incubated at 25°C for 3–4 days. Then, the yeasts and molds were enumerated and the recovered yeasts (35 isolates) were purified and preserved on PDA slants and kept at 4°C for identification.
Enterobacteriaceae and coliforms were counted on Violet Red Bile Glucose (VRBG) agar and Violet Red Bile Lactose (VRBL) agar, respectively using the pour plate method (Nguz et al., 2005) and incubated at 35°C for 24 h. Escherichia coli was counted on Tryptone Bile X-Glucuronide (TBX) medium using the spread plate method (Hassan et al., 2011) and incubated at 35°C for 24 h.
Bacteria and yeasts were identified by amplifying and sequencing the 16S rRNA gene and the rRNA gene internal transcribed spacer (ITS1-5.8S-ITS2; the full ITS region), respectively (Arbefeville et al., 2017). DNA was extracted using “foodproof®StarPrep Two Kit” (Biotecon Diagnostics GmbH, Potsdam, Germany) for both bacteria and yeasts according to manufacturer’s guidelines. NanoDrop™ 2000 (Thermoscientific, United States) was used to check the quality and quantity of the DNA. PCR for acetic acid bacteria was done as previously described elsewhere (Al-Kharousi et al., 2016). In short, 1 𝜇L of each primer (27F and 1492R; DNA sequences: 5′-AGAGTTTGATCMTGGCTCAG-3′ and 5′-TACGGYTACCTTGTTACGACTT-3′, respectively), 22 𝜇L of sterile milliQ water, and 1 𝜇L of the DNA sample were transferred to PCR reaction tubes containing PCR beads (puReTaq Ready-To-Go PCR beads, GE Healthcare, United Kingdom). The thermal profile (Veriti 96-well Thermal cycler, Applied Biosystems, Singapore) for PCR reaction was as follows: denaturation at 95°C for 2 min, followed by 35 cycles of denaturation at 95°C for 30 s, annealing at 54°C for 30 s, and extension at 72°C for 1 min. The final extension was at 72°C for 10 min and then kept at 4°C. A similar PCR procedure was performed for the identification of yeasts except using different primers and thermal profile. The primers were ITS4 (5’-TCCTCCGCTTATTGATATGC-3′) and ITS5 (5’-GGAAGTAAAAGTCGTAACAAGG-3′). The thermal profile of the PCR procedure was as follows: stage 1; denaturation at 94°C for 3 min, stage 2; denaturation at 94°C for 1 min, annealing at 50°C for 1 min, extension at 72°C for 3 min (30 cycles), and stage 3; final extension at 72°C for 10 min (Landeweert et al., 2003) and then kept at 4°C.
For both bacteria and yeasts, five-microliter aliquots of PCR products were checked by gel electrophoresis with 1.5% agarose gel and 0.5 μg/mL ethidium bromide (Sigma-Aldrich, United States). Gels were visualized by UV using GelDoc (GeneFlash, Syngene, United States). The PCR products were sequenced using the same primers as used for amplification (Macrogen, South Korea). DNA sequences were analyzed through “ChromasPro” program (version 2.1.5, 2017, Technelysium Pty Ltd., South Brisbane, Queensland, Australia.). Briefly, sequences of the products of both primers were assembled into a contiguous consensus. The sequences as displayed in the chromatogram were edited using the sequence editor. The low quality sequences in the left and right trim locations were cleared. The sequences were aligned and compared online with those found in the “National Centre for Biotechnology Information” (NCBI) using the ‘Basic Local Alignment Search Tool’ (BLAST) program.1 The sequences of AAB and yeasts were submitted to the GenBank to be given accession numbers.
Phylogenetic analysis was performed based on the 16S rRNA gene sequences of AAB and the rRNA gene internal transcribed spacer (ITS1-5.8S-ITS2) of yeasts. MUSCLE was used for the alignment of sequences. The phylogenetic trees were constructed in MEGA11 (Tamura et al., 2021) using the Neighbor-Joining method. The evolutionary distances were computed using the Jukes-Cantor method for AAB and the Kimura 2-parameter method for yeasts (1,000 replicates) after testing the best method in Mega 11.
The pH of the samples was measured using a pH meter (Metrohm, 744 pH meter) after calibration. The acetic acid (CH3COOH), methanol (CH3OH), and ethanol (C2H6O) contents were analyzed by Headspace (HS-20 Loop Model), Gas Chromatography (AGILENT-7890A, United States) with Flame Ionization Detection (HS-GC-FID). The samples were filtered first using filter paper (185 mm, Whatman). Agilent 7890A-GC-Agilent-7697A HSS Loop headspace sampler was used in the static-loop headspace mode for sample introduction. Injection volume was 1 μL, inlet temperature was 100°C, and the split ratio was 5:1. Effluent from the HS-20 was split 20-to-1 and then divided into two identical columns using a 3-way “T” fitting. The column type was Supelco-23473.0—325°C, 30 m × 250 μm × 0.5 μm. The mobile phase flow rate (He) was 1 mL/min. The oven temperature was set at 60°C, then it was hold for 1 min. The temperature ramp was 10°C per min until 150°C, then it was hold at 150°C for 10 min and the run time was 150 min. The outlet ends of the two columns were connected to the FID detectors. The detector temperature was 250°C and the detector hydrogen flow was 30 mL/min. The zero air was 400 mL/min. The Software “Chemstation” was used for the analysis.
Analysis of different parameters was done three times and the averages were calculated. The data were subjected to statistical analysis using SAS statistical software package (JMP® SAS 12.2.0, United States). One-way analysis of variance (ANOVA) was used to study if the duration of fermentation significantly affected the chemical parameters and the microbial counts for all samples. Tukey–Kramer HSD test was used to determine the groups that contributed to the significant differences when detected by ANOVA. A Pearson’s correlation test was used to study if there was a significant statistical correlation between the yeast count and the chemical parameters. In addition, the data were analyzed utilizing a multivariate analysis approach using XLSTAT 2023 statistical software (Vidal et al., 2020) to perform Principal Component Analysis (PCA) to find any correlation patterns between the chemical parameters and the microbiological counts.
The results of the microbial analysis for HMS and LMS are shown in Tables 1, 2, respectively. Escherichia coli was not detected in any sample. Coliforms and Enterobacteriaceae were found in 75% and 66.7% of HMS, respectively but generally, their number decreased with the duration of the fermentation process, particularly in the samples fermented for 30 and 40 days that had higher acidity (pH ≤ 3.35, Table 1). The maximum counts for coliforms and Enterobacteriaceae were 3.9 and 3.1 log CFU mL−1, respectively in HMS but both counts were less than 2.0 log CFU mL−1 in LMS. Coliforms and Enterobacteriaceae were detected only in one (3.6%) of LMS. The AAB were distinguished by producing clear haloes around bacterial colonies on GYPEC medium due to the production of the acid (Gullo et al., 2016), as shown in Figures 1, 2. According to the duration of fermentation, the count of AAB differed significantly between HMS and LMS (p = 0.00012, α = 0.05). The AAB were not detected in any HMS (Table 1), but they occurred in all LMS (Table 2). The difference in the intensity of growth of AAB between different durations of fermentation for LMS was significant [Chi-Square (χ2) = 0.4525, p = 0.0057, α = 0.05] and generally the intensity of growth decreased with time.
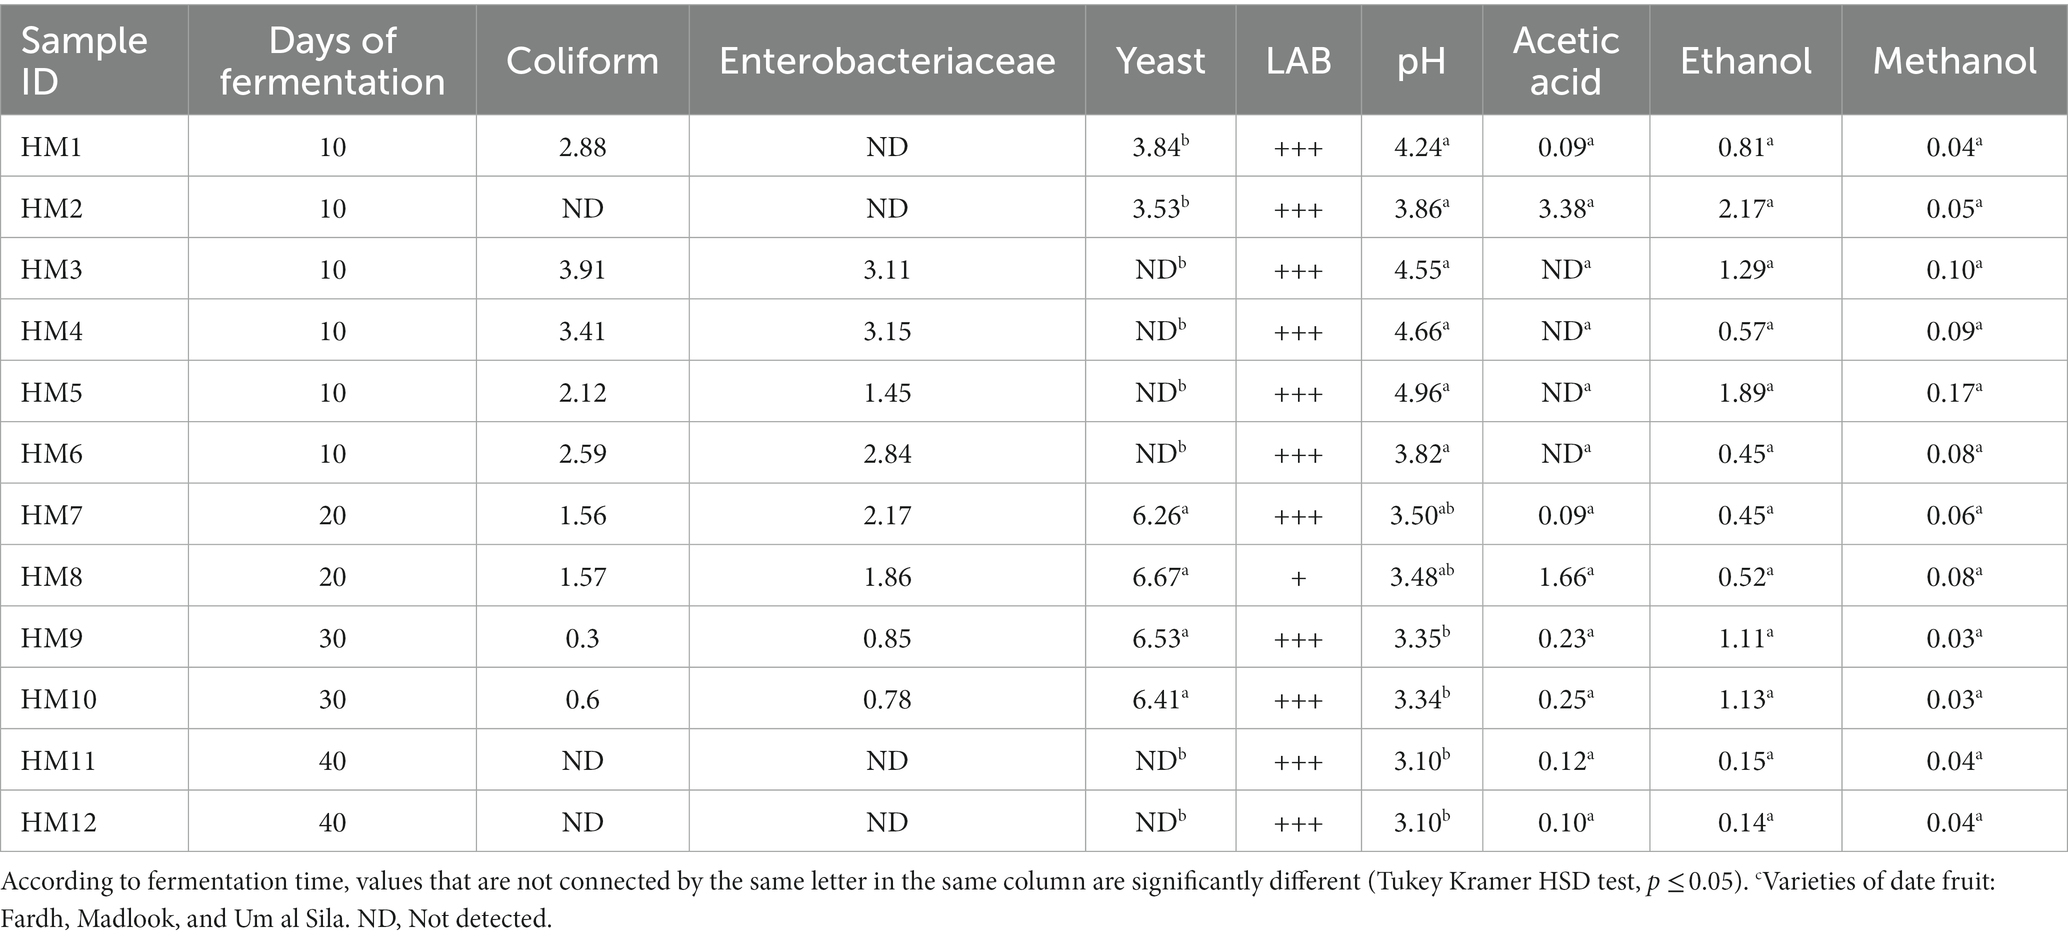
Table 1. Microbial counts (log CFU mL−1) and chemical parameters [pH, acetic acid (%), ethanol (%), and methanol (%)] in home-made samplesc (HMS).
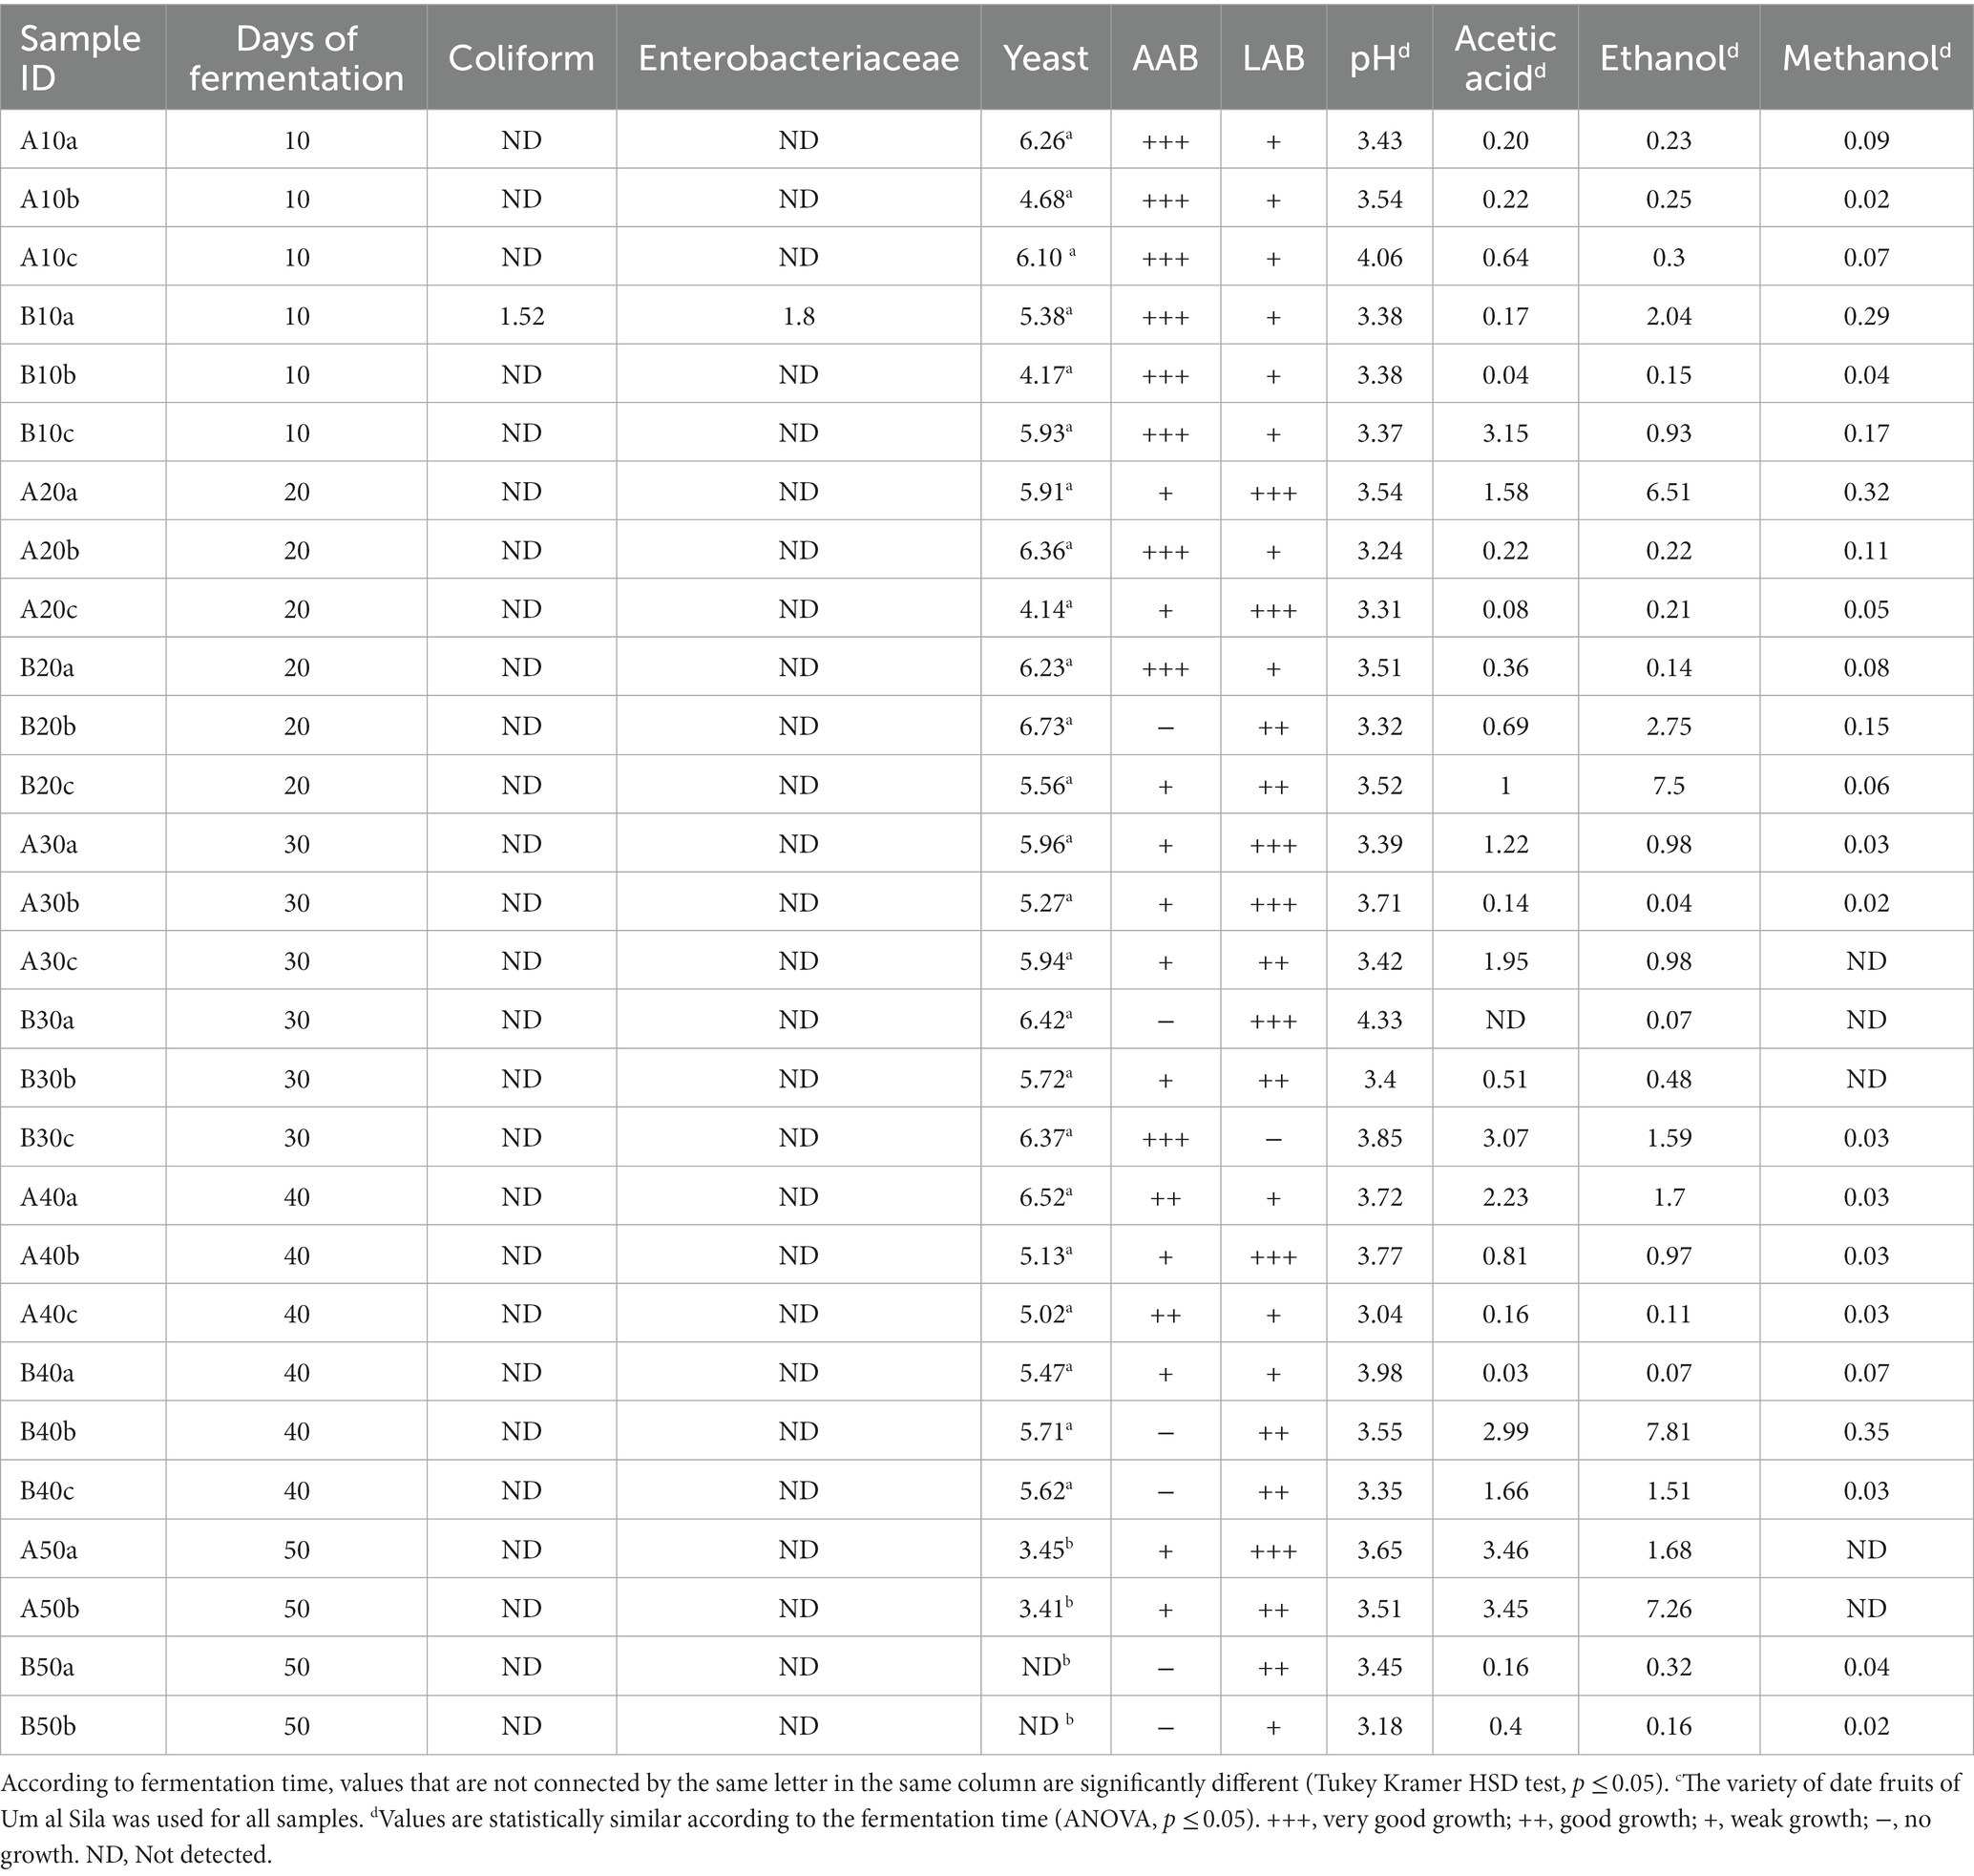
Table 2. Microbial counts (log CFU mL−1) and chemical parameters [pH, acetic acid (%), ethanol (%), and methanol (%)] of lab-made samplesc (LMS).
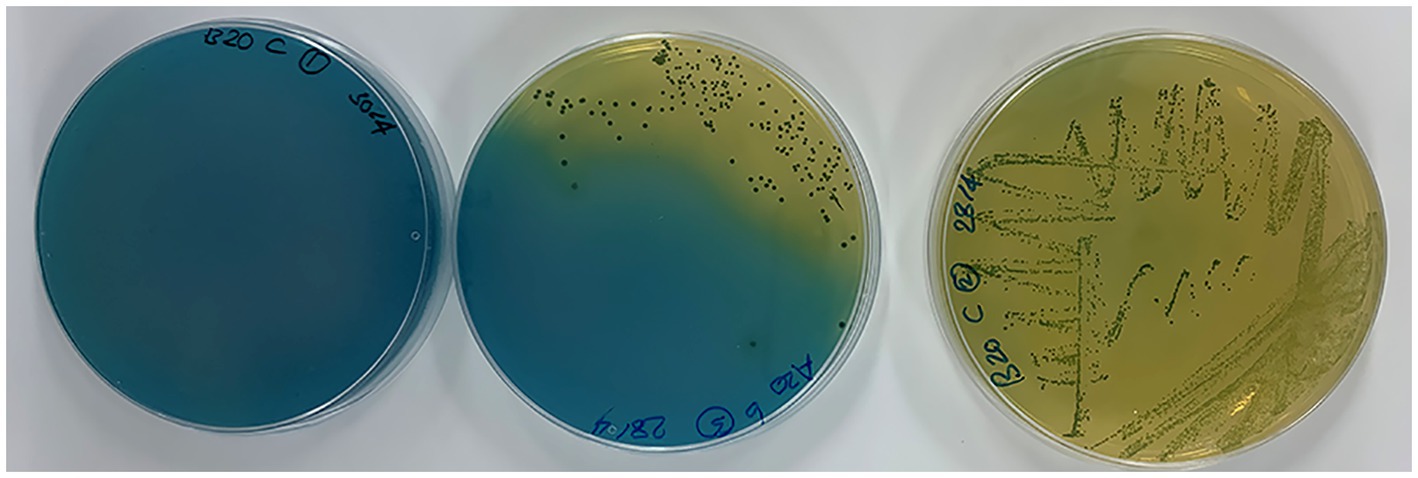
Figure 1. From left to right: progressive growth of Gluconobacter spp. on GYPEC medium (with bromocresol green) and conversion of its original green color to yellow.
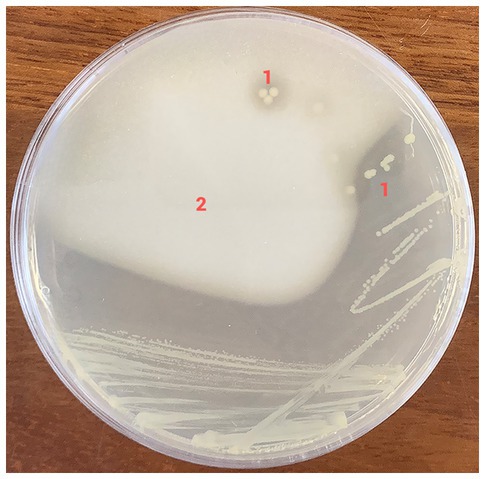
Figure 2. Growth of Gluconobacter kanchanaburiensis on GYPEC medium (prepared without bromocresol green) shows clear halos around bacterial colonies due to acid production and digestion of calcium carbonate incorporated in the medium. 1: clear halos. 2: areas with calcium carbonate precipitate in the medium.
Yeasts were isolated from 50, and 92.9% of HMS and LMS, respectively (Tables 1, 2). The highest number of yeasts was noted in the samples HM8 and HM9; 6.67 and 6.53 log CFU mL−1, respectively. In LMS, the number of yeasts ranged from 4.14 to 6.73 log CFU mL−1 in the durations of 10 to 40 days of the fermentation process; however, yeast’s count dropped to ≤3.4 log CFU mL−1 in the samples of 50 days of fermentation (Table 2). Statically, the count of yeasts differed significantly according to the duration of fermentation for HMS (ANOVA, p = 0.0023, α = 0.05) and LMS (ANOVA, p < 0.0001, α = 0.05). Yeasts were not detected in some HMS (Table 1) that were fermented for 10 days (HM3, HM4, HM5, and HM6) or 40 days (HM11, and HM12). According to the duration of fermentation, there was no significant difference between HMS and LMS regarding the yeast count (p = 0.1364, 0.14778, α = 0.05). Both AAB and yeasts were absent in two LMS (B50a and B50b; Table 2) that were fermented for 50 days.
Using the PCA biplot (Supplementary Figure S4), LMS samples were found to better correlate with the variables acetic acid, ethanol, methanol, yeast, and AAB than the HMS. The AAB negatively correlated (Person’s correlation: −0.808, α = 0.05) with the LAB. The PCA also showed a negative correlation between the duration of fermentation and the presence of AAB (Person’s correlation: 0.354, α = 0.05).
The pH, and the content of ethanol, methanol, and acetic acid in HMS, and LMS are presented in Tables 1, 2, respectively. For HMS, the highest pH value was recorded for a 10 days fermentation HMS and was 4.96 while the lowest value was 3.10 recorded for 40 days fermentation samples (Table 1). Statistically, the duration of fermentation significantly affected the pH (ANOVA, p = 0.0068, α = 0.05) and split it into 3 groups; pH of 10 days, 20 days, and 30 and 40 days of fermentation; thus, the pH decreased with increasing fermentation time and was statistically similar over the last 2 periods of fermentation (Table 1). The highest amount of acetic acid was 3.38% in a 10 days sample (HM2) and it was not detected in four samples (HM3, HM4, HM5, and HM6), all of them were 10 days fermentation samples. The highest percentage of ethanol (2.17%) was also in a sample (HM2) of 10 days of fermentation. The percentage of methanol was ≤0.17% in all HMS. The percentages of acetic acid, ethanol, and methanol were not significantly affected by the duration of fermentation (ANOVA, p = 0.8998, 0.1638, and 0.2570 respectively, α = 0.05).
For LMS, the pH ranged from 3.04 to 4.33 (Table 2). The highest percentage of acetic acid was 3.46% and was found in a 50 days (A50) sample while the highest amount of ethanol (7.81%) was detected in a 40 days (B40b) sample. The percentages of methanol were lower than 0.36% in all samples. The duration of fermentation did not significantly affect the pH, acetic acid, ethanol, or methanol (ANOVA, p = 0.5059, 0.5340, 0.4323, 0.1299 respectively, α = 0.05). The percentages of methanol in HMS and LMS varied between 0.03%–0.17%, and 0.00%–0.35%, respectively. According to the duration of fermentation, only the pH differed significantly between HMS and LMS (p = 0.04901, α = 0.05). The statistical tests did not detect significant differences between HMS and LMS regarding the contents of acetic acid, ethanol, and methanol (p = 0.20059, 0.63597, 0.07763, α = 0.05).
Identification was performed for 55 isolates of AAB and 35 isolates of yeasts (Table 3) (GenBank accession no. MN888812 to MN888866 for AAB; Supplementary Table S2 and MN888778 to MN888809 for yeasts; Supplementary Table S3). Five species of Gluconobacter were identified (Table 3). The most encountered species was Gluconobacter frateurii (26 isolates) followed by Gluconobacter japonicus (14 isolates), Gluconobacter oxidans (eight isolates), Gluconobacter kanchanaburiensis (six isolates), and lastly Gluconobacter thailandicus (one isolate). According to a qualitative measurement, G. kanchanaburiensis exhibited a high potential to produce acid in the culture media as it was observed from their heavy and fast growth and the quick conversion of the color of agar medium from green to yellow due to acid production. G. japonicus and G. oxydans tolerated a high percentage of ethanol of 7.5%. G. frateurii could tolerate 3.07% acetic acid. G. japonicus showed the slowest growth rate in culture media among the isolates. G. frateurii could survive at a low pH of 2.59.
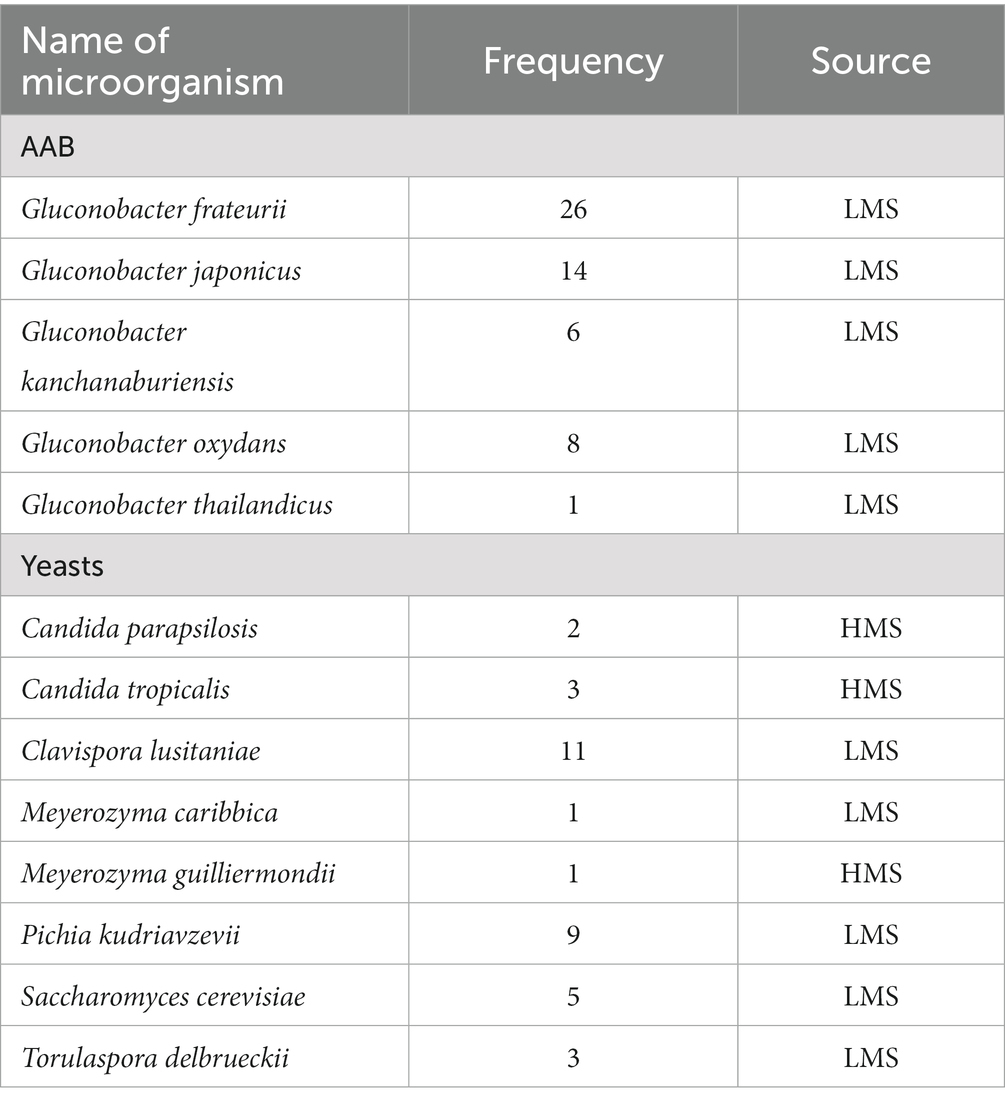
Table 3. Frequency of Gluconobacter and yeasts isolated from home-made samples (HMS), and lab-made samples (LMS) of date vinegar.
Six genera and eight species of yeasts were identified (Table 3). The most detected one was Clavispora lusitaniae (11 isolates) followed by Pichia kudriavzevii (nine isolates), Saccharomyces cerevisiae (five isolates), Candida tropicalis and Torulaspora delbrueckii (three isolates each), Candida parapsilosis (two isolates), and lastly, Meyerozyma caribbica and Meyerozyma guilliermondii (one isolate each). S. cerevisiae exhibited strong fermentative metabolism and tolerance to high ethanol concentration up to 7.81%. P. kudriavzevii showed the ability to survive at a low pH of 2.9.
The phylogenetic analyses of AAB and yeasts are shown in the Supplementary Figures S2, S3, respectively. G. kanchanaburiensis made a distinct clear cluster (a bootstrap value of 61). G. thailandicus, G. oxydans, G. frateurii and G. japonicus clustered together with a low bootstrap value (25%–50%). For yeasts, there was a very well separation of all isolates into distinct clusters based on their genus/species with strong bootstrap values (84%–100%) for all clusters. These included clusters of C. tropicalis, C. parapsilosis, M. guilliermondii and M. caribbica (in one cluster), S. cerevisiae, T. delbrueckii, C. lusitaniae, and P. kudriavzevii.
The absence of E. coli in all samples indicates a good hygienic status of the products throughout handling and processing (Nguz et al., 2005; Ema et al., 2022). Vinegar is a natural antimicrobial system that can inactivate E. coli (Medina et al., 2007). Generally, the number of coliforms and Enterobacteriaceae decreased with the duration of the fermentation process particularly in the HMS fermented for 30 and 40 days and this could be because of the increased acidity of these samples (Table 1). Coliforms and Enterobacteriaceae were detected only in one (3.6%) LMS which indicates a better sanitary condition in these samples as compared with HMS in which these indicator bacterial groups were more prevalent (75% and 67%, respectively). The hygienic condition of HMS or the presence of coliforms or Enterobacteriaceae in the raw material might have played a role in their presence in the final product. Moreover, the counts of coliforms and Enterobacteriaceae were greater in HMS (maximum counts of 3.9 and 3.1 log CFU mL−1, respectively) than in LMS (less than 2.0 log CFU mL−1; detection limit: 1.0 log CFU mL−1). No specific standard limits are available for the number of coliforms and Enterobacteriaceae in vinegar. However, The Health Protection Agency (2009) reported some limits for vegetables preserved in vinegar and according to it, only four samples (HM1, HM3, HM4, and HM6) had counts of coliforms and Enterobacteriaceae in the borderline between 2 and 4 log CFU mL−1. All other samples maintained a satisfactory level with values lower than 2 log CFU mL−1.
Acetic acid bacteria are part of the natural microbiota of fruits, and they can survive the adverse conditions of alcoholic fermentation (Du Toit and Pretorius, 2002) and carry on the acetous fermentation in vinegar (Hidalgo et al., 2012). The AAB were not detected in any HMS but they occurred in all LMS. Some factors might have led to inhibiting the growth of AAB such as using old date fruit that might have no viable indigenous AAB, poor handling and storage of date fruit, the inappropriate storage temperature of the fermented product, or adding high concentrations of sodium chloride and garlic to some HMS. Moreover, the growth of AAB might get halted because of the reduced amount of oxygen as containers are usually kept tightly closed throughout the traditional fermentation process and they may remain viable but not culturable (Hidalgo et al., 2012; Mas et al., 2014) or because the samples received a heat treatment in the final step of their production that might have affected the viability and recovery of AAB.
Acetic acid was present in some HMS in which AAB were not detected; this may indicate that other AAB genera or species were present but were not detected using the described culturing technique. The AAB are fastidious in their growth and many strains lose some characteristics after they grow in culture media such as the ability to produce enough amount of acetic acid. Acetic acid can also be produced by microorganisms other than AAB such as lactic acid bacteria (Mas et al., 2014) that were isolated from all HMS. In fact, the PCA showed a negative correlation between LAB and AAB (Person’s correlation: −0.808, α = 0.05) which may indicate a role of LAB in acetic acid production when AAB were absent from the samples. The significant statistical differences that were detected in the intensity of growth of AAB between different durations of fermentation in LMS could be attributed to various factors such as availability of oxygen, the type of strain, sensitivity to ethanol, acidity, and competition with other microorganisms (e.g., lactic acid bacteria). This statistical result was also supported by the PCA analysis that showed negative correlation between the duration of fermentation and the AAB presence (Person’s correlation: −0.354, α = 0.05).”
Yeasts play an important role in producing ethanol required for acetous fermentation and using different strains of yeasts could influence the final vinegar product (Ho et al., 2017). The yeast count was as high as 6.73 and 6.67 in LMS B20b and HM8, respectively, and generally decreased as the period of fermentation approached 40 and 50 days (Table 2). These results are supported by the statistical tests that showed significant differences in the counts of yeasts according to the duration of fermentation for both HMS and LMS. Similar results were reported by Song et al. (2016) in black raspberry vinegar and Hidalgo et al. (2012) in studying spontaneous alcoholic fermentation of persimmon and strawberry in which the yeast population reached 7 log CFU mL−1 and then it gradually declined. This has been attributed to the low pH values of about 3.0 as the optimum pH for yeast growth is 4.0–4.5 (Song et al., 2016). A quick decline in the growth of some strains of yeasts may happen at the beginning of the fermentation process, while others may disappear in the middle stage of fermentation (Lin et al., 2010). This might be related to different factors such as the strains of the yeasts, their sensitivity to ethanol (Aguilera et al., 2006), acidity tolerance, utilization of specific sugars, oxygen tolerance, depletion of nutrients, and competition with other microorganisms (Lin et al., 2010). The absence of yeasts in some HMS that were fermented for 10 days (HM3, HM4, HM5, and HM6) or 40 days (HM11 and HM12) could be because they were prepared from old date fruits or because the samples received heat treatment in the final step of their production that might have affected the viability of some strains. According to the duration of fermentation, there was no significant difference between HMS and LMS regarding the yeast count which may generally indicate the capability of the yeasts to survive in various environmental conditions, as HMS contained various ingredients such as salt, spices, and herbs other than dates and water. The absence of AAB and yeasts in two LMS (B50a and B50b; Table 2) that were fermented for 50 days could be due to the reasons that were mentioned previously that could affect the survival and growth of AAB and yeasts as well as to the accumulation of waste produced from microbial metabolism and the decay of the date organic material with time. Filtering the date juice used for the fermentation process may give better results and permit longer aging of date vinegar if it is required.
The HMS showed a decrease in the pH with increasing the fermentation time and ranged from 4.96 in a 10 days fermentation sample to 3.10 in a 40 days fermentation sample. Statistically, the duration of fermentation significantly affected the pH and split it into 3 groups; pH of 10 days, 20 days, and pH of 30 and 40 days of fermentation (Table 1). The decrease in pH over time could be due to the accumulation of acetic acid or other acids secreted by AAB, yeasts, and lactic acid bacteria (Gullo and Giudici, 2008). However, the pH that ranged from 4.33 to 3.04 for LMS (Table 2) was not statistically different according to the duration of fermentation. Low pH values that ranged from 3.26 to 2.99 were found by Matloob and Balakita (2016) in homemade and commercial date vinegar samples. The highest amounts of acetic acid were nearly similar in HMS (3.38% in a 10 days sample; HM2) and LMS (3.46% in a 50 days sample; A50) but they were lower than what was attained by Matloob (2014) in date vinegar (6.62%) produced by inoculation with S. cerevisiae at the first stage and AAB from old vinegar at the second stage of the acidification process and by Halladj et al. (2016) (6.0%) in traditional date vinegar produced using an improved method. However, our results are slightly larger than what was found (3.18%) in some commercial date vinegar samples consumed in Iraq (Matloob and Balakita, 2016). Thus, the amount of acetic acid in this investigation was less than the standard recommended level; not less than 4% (Food Regulations, 1985; Ho et al., 2017). The highest amount of ethanol was 7.81% found in 40 days of fermentation LMS (B40b) but it was much lower in HMS (2.17% in HM2 fermented for 10 days) which was, in turn, less than the highest concentration of ethanol (2.53%) in commercial date samples analyzed by Matloob and Balakita (2016). Thus in some samples, the amount of ethanol in this study was greater than the recommended level; less than 0.5% (Food Regulations, 1985; Ho et al., 2017).
Fermentation errors may lead to epidemic methanol poisoning due to the production of high levels of methanol (Ashurst and Nappe, 2023). Methanol is a toxic substance that can cause death when ingested in excess and several food poisoning events due to methanol contamination have been reported previously (Ohimain, 2016). Methanol is absorbed quickly and directly to the total body water compartment when ingested, as it is not a protein-bound compound. Liver is the main organ for metabolizing methanol through serial reactions that achieve a zero-order elimination of approximately 8–9 mg/dL/h for levels between 100 and 200 mg/dL (0.1%–0.2%) methanol. The main product of these reactions is formic acid which is difficult to be eliminated and mostly accumulates. Unmetabolized methanol is difficult to be cleared through the lungs and the kidneys. Formic acid can damage the body organs and the retina because of formic acid’s oxidative stress (Ashurst and Nappe, 2023). Formaldehyde which is a carcinogen is also produced from methanol metabolism and can cause age-related damage to neurons. The European Union (EU) general limit for naturally occurring methanol is 10 g methanol/L ethanol or 0.4% (v/v) methanol at 40% alcohol volume (Botelho et al., 2020). In this study, the percentages of methanol in HMS and LMS varied between 0.03%–0.17%, and 0.00%–0.35% respectively; thus, in some samples, it was outside the acceptable range of methanol in wine vinegar (0.002%–0.009%), and in cider vinegar (0.004%–0.038%) (Bourgeois et al., 2006). However, more studies are needed to determine the safe standard level of methanol in date vinegar. Methanol production results from the partial hydrolysis of pectin to pectic acid and methanol, due to the activities of pectinesterase from yeasts, fungi, and bacteria. Some strains of S. cerevisiae also produce methanol. It would be important to keep the level of methanol in date vinegar to a minimum. This may be achieved by selecting the type of raw material that contains a lesser amount of pectin and by selecting a starter culture or mother of vinegar that contain microbial strains that do not produce methanol (Ohimain, 2016). Other investigations will be necessary to determine the safety of date vinegar regarding the presence and levels of methanol or other toxic chemicals.
The statistical similarity of the contents of acetic acid, ethanol, and methanol in HMS and LMS could be due to the large variation of the parameters within each group (LMS or HMS) as compared to the variation between these two groups which can be attributed to factors related to controlling the process of fermentation and the raw material; for instance, controlling the degrees of Brix in the mixture of dates with water and the amount of oxygen throughout the process. Thus, the statistical tests demonstrate the necessity to monitor, modify, and control the traditional method for producing consistently good quality date vinegar. However, the PCA (Supplementary Figure S4) showed that the LMS correlated better with the variables acetic acid, ethanol, methanol, yeast, and acetic acid (all clustered in the fourth quadrant of the biplot) than the HMS which indicates that standardizing and improving the method of date vinegar production can improve the product homogeneity. The use of the back-slopping in which AAB are transferred from a successful previously made vinegar to a new batch and the utilization of starter cultures can be considered in future research.
This study reports for the first time identification of five species of Gluconobacter in date vinegar (Table 3); G. frateurii (26 isolates), G. japonicus (14 isolates), G. oxidans (eight isolates), G. kanchanaburiensis (six isolates), and G. thailandicus (one isolate). The Gluconobacter genus involves bacteria that prefer to live in fruits, flowers, and sugar-enriched environments while the main three genera of AAB reported being responsible for acetous fermentation in vinegar are Acetobacter, Gluconacetobacter, and Komagataeibacter which prefer to live in acidic environments such as vinegar and alcohol-enriched products (Yetiman and Kesmen, 2015). Gluconobacter spp. are known to have more oxidative capability of sugars to produce acetic acid than Acetobacter which produces acetic acid from ethanol efficiently (Deppenmeier et al., 2002). Nevertheless, the raw materials used in vinegar production can significantly determine the species of AAB present in the fermentation medium (Gomes et al., 2018). Lisdiyanti et al. (2003) isolated Acetobacter and Gluconacetobacter from fermented foods while Gluconobacter was found in fruits and flowers. G. oxydans and G. frateurii were the only detected species. However, our results showed the ability of the isolated five Gluconobacter species to thrive in date vinegar. Bacteria belonging to the genus Gluconobacter have many biotechnological uses (Supplementary Table S4) and the ability to grow in extreme conditions (Deppenmeier et al., 2002). In this study, G. kanchanaburiensis showed heavy and fast growth and quick conversion of the color of the GYPEC medium from green to yellow due to acid production. G. japonicus and G. oxydans tolerated a high concentration of ethanol of 7.5%. G. frateurii could tolerate 3.07% acetic acid. G. japonicus showed the slowest growth rate in culture media among the isolates. Interestingly, G. frateurii could survive at low pH of 2.59 though the optimum pH for the growth of AAB ranges from 5.5 to 6.3 (Raspor and Goranovič, 2008).
A wide diversity of yeasts, represented by six genera and eight species were identified (Table 3). These yeasts have many biotechnological applications (Supplementary Table S4). S. cerevisiae exhibited strong fermentative metabolism and tolerance to high ethanol concentrations of up to 7.81%, which can give this yeast a good competitive capability over other non-Saccharomyces yeasts. This can lead to an increase in the levels of alcohol and the progressive imposition of S. cerevisiae during alcoholic fermentation (Andorrà et al., 2010). P. kudriavzevii showed the ability to survive at a low pH of 2.9. Song et al. (2016) isolated non-Saccharomyces species including Issatchenkia spp., and Candida spp. at the initial fermentation stage that nearly disappeared at the end of fermentation when S. cerevisiae dominated. Similarly, in this study, Candida spp. was isolated from samples fermented for 10, 20, and 30 days but not from 50 days fermentation samples while S. cerevisiae was also isolated from samples fermented for 50 days (Supplementary Table S2).
In this study, the phylogenetic analysis of 16S rRNA gene sequences of Gluconobacter enabled separation of G. kanchanaburiensis into a distinct clear cluster (all isolated from LMS fermented for 10 days) from the other species, supported by a bootstrap value of 61%. Difficulties in separating different species of Gluconobacter into distinct single genospecies based on 16S rRNA sequences have been previously reported (Li et al., 2017). Using 16S r DNA and 16S-23S rDNA ITS analyses, Takahashi et al. (2006) found G. thailandicus, G. oxydans, and G. frateurii to cluster together and suggested using phenotypic and DNA–DNA hybridization studies to resolve the unambiguity in their classification. Likewise, in this study, G. thailandicus, G. oxydans, G. frateurii, and G. japonicus clustered together with a low bootstrap value (25%–50%) which suggests that these species are closely related (Takahashi et al., 2006). Phylogenetic analysis of enzymes involved in metabolism may also help improve the phylogenetic resolution of the closely related species of AAB (Matsutani et al., 2011).
According to the phylogenetic analysis of yeasts, there was a very well separation of all isolates into distinct clusters based on their genus/species with strong bootstrap values for all clusters. This is regardless of the type of sample and the fermentation time. For example, P. kudriavzevii Y36 was isolated from a homemade sample (HM8) fermented for 20 days, clustered (bootstrap value of 99%) with all other P. kudriavzevii that were isolated from LMS fermented for 10, 40, and 50 days. Similarly, C. parapsilosis Y4 and C. parapsilosis Y6 that were isolated from homemade samples (HM2 and HM6, respectively) prepared using different varieties of dates (Fardh and Madlook, respectively) and different ingredients (Supplementary Table S1), clustered together supported with a bootstrap value of 99% which may indicate a flow of yeasts between different types of dates in Oman.
This study demonstrated that using the traditional method in Oman to produce date vinegar does not guarantee the production of good quality date vinegar, particularly, since the concentration of acetic acid was lower than the international recommended standard level (4%). The safety of this product will remain questionable as it might contain toxic levels of methanol. Nevertheless, it was possible to isolate five species of Gluconobacter from date vinegar in which G. frateurii was the most abundant species. Six genera of yeasts were identified with which C. lusitaniae was the most detected one. The isolated AAB and yeasts demonstrated their ability to survive the harsh conditions of dried dates processing and to thrive in date vinegar and they might be exploited in many biotechnological applications. Gluconobacter frateurii survived at pH 2.59 and the highest content of ethanol correlated with the presence of S. cerevisiae. The phylogenetic analysis based on the 16S rRNA gene sequences revealed that G. thailandicus, G. oxydans, G. frateurii, and G. japonicus are closely related species in the genus Gluconobacter and phenotypic or other genotypic methods might be necessary for their discrimination while G. kanchanaburiensis was well separated from the other Gluconobacter species. The yeasts C. tropicalis, C. parapsilosis, M. guilliermondii and M. caribbica, S. cerevisiae, T. delbrueckii, C. lusitaniae, and P. kudriavzevii were very well separated according to their genus/species level. This work is on continuation to study the role and efficiency of the isolated yeasts and AAB in producing good quality date vinegar. More genetic studies will be performed to investigate the presence of unculturable AAB in date vinegar. Selecting specific type of raw material, using the mother of vinegar, or formulating a starter culture that contains microbial strains that do not produce methanol might be considered in future research.
The datasets presented in this study can be found in online repositories. The names of the repository/repositories and accession number(s) can be found in the article/Supplementary material.
NG, FA, and ZA designed the study. FA performed the practical work under the supervision of NG and ZA. NG managed financial support. IA provided suggestions for the work. FA, ZA, and AA handled the genetic analysis. FA and ZA performed the statistical analysis. All authors contributed to the article and approved the submitted version.
This research was supported by Sultan Qaboos University, College of Agricultural and Marine Sciences, grant number IG/AGR/FOOD/19/03.
The authors acknowledge Sultan Qaboos University for providing financial support for this study through the grant IG/AGR/FOOD/19/03.
The authors declare that the research was conducted in the absence of any commercial or financial relationships that could be construed as a potential conflict of interest.
All claims expressed in this article are solely those of the authors and do not necessarily represent those of their affiliated organizations, or those of the publisher, the editors and the reviewers. Any product that may be evaluated in this article, or claim that may be made by its manufacturer, is not guaranteed or endorsed by the publisher.
The Supplementary material for this article can be found online at: https://www.frontiersin.org/articles/10.3389/fsufs.2023.1142152/full#supplementary-material
Aguilera, F., Peinado, R. A., Millan, C., Ortega, J. M., and Mauricio, J. C. (2006). Relationship between ethanol tolerance, Hþ-ATPase activity and the lipid composition of the plasma membrane in different wine yeast strains. Int. J. Food Microbiol. 110, 34–42. doi: 10.1016/j.ijfoodmicro.2006.02.002
Al-Bulushi, I. M., Bani-Uraba, M. S., Guizani, N. S., Al-Khusaibi, M. K., and Al-Sadi, A. M. (2017). Illumina MiSeq sequencing analysis of fungal diversity in stored dates. BMC Microbiol. 17:72. doi: 10.1186/s12866-017-0985-7
Al-Bulushi, I. M. (2018). The handbook of food microbiological analytical methods. New York: Nova Science.
Al-Kharousi, Z. S., Guizani, N., Al-Sadi, A. M., Al-Bulushi, I. M., and Shaharoona, B. (2016). Hiding in fresh fruits and vegetables: opportunistic pathogens may cross geographical barriers. Int. J. Microbiol. 2016:4292417. doi: 10.1155/2016/4292417
Al-Yahyai, R., and Khan, M. M. (2015). “Date palm status and perspective in Oman” in Date: Palm genetic resources and utilization. eds. J. Al-Khayri, S. Jain, and D. Johnson (Dordrecht: Springer), 207–240.
Andorrà, I., Landi, S., Mas, A., Esteve-Zarzoso, B., and Guillamón, J. M. (2010). Effect of fermentation temperature on microbial population evolution using culture-independent and dependent techniques. Food Res. Int. 43, 773–779. doi: 10.1016/j.foodres.2009.11.014
Arbefeville, S., Harris, A., and Ferrieri, P. (2017). Comparison of sequencing the D2 region of the large subunit ribosomal RNA gene (MicroSEQ®) versus the internal transcribed spacer (ITS) regions using two public databases for identification of common and uncommon clinically relevant fungal species. J. Microbiol. Methods 140, 40–46. doi: 10.1016/j.mimet.2017.06.015
Ashurst, J. V., and Nappe, T. M. (2023). “Methanol toxicity. [Updated 2022 Jun 21]” in StatPearls [internet] (Treasure Island (FL): StatPearls Publishing) Available at: https://www.ncbi.nlm.nih.gov/books/NBK482121/
Baliga, M. S., Baliga, B. R. V., Kandathil, S. M., Bhat, H. P., and Vayalil, P. K. (2011). A review of the chemistry and pharmacology of the date fruits (Phoenix dactylifera L.). Food Res. Int. 44, 1812–1822. doi: 10.1016/j.foodres.2010.07.004
Botelho, G., Anjos, O., Estevinho, L. M., and Caldeira, I. (2020). Methanol in grape derived, fruit and honey spirits: a critical review on source, quality control, and legal limits. PRO 8:1609. doi: 10.3390/pr8121609
Bourgeois, J. F., McColl, I., and Barja, F. (2006). Formic acid, acetic acid and methanol: their relevance to the verification of the authenticity of vinegar. Arch. Sci. 59, 107–112.
Deppenmeier, U., Hoffmeister, M., and Prust, C. (2002). Biochemistry and biotechnological applications of Gluconobacter strains. Appl. Microbiol. Biotechnol. 60, 233–242. doi: 10.1007/s00253-002-1114-5
Du Toit, W. J., and Pretorius, I. S. (2002). The occurrence, control and esoteric effect of acetic acid bacteria in wine making. Ann. Microbiol. 52, 155–179.
Ema, F. A., Shanta, R. N., Rahman, M. Z., Islam, M. A., and Khatun, M. M. (2022). Isolation, identification, and antibiogram studies of Escherichia coli from ready-to-eat foods in Mymensingh. Bangladesh. Vet. World. 15, 1497–1505. doi: 10.14202/vetworld.2022.1497-1505
Food Regulations. (1985). Standards and particular labeling requirements for food: vinegar sauce, chutney and pickle. Malaysia: Food Act 1983, Food Regulation 1985.
Gomes, R. J., Borges, M. F., Rosa, M. F., Castro-Gómez, R., and Spinosa, W. A. (2018). Acetic acid bacteria in the food industry: systematics, characteristics and applications. Food Technol. Biotechnol. 56, 139–151. doi: 10.17113/ftb.56.02.18.5593
Gullo, M., and Giudici, P. (2008). Acetic acid bacteria in traditional balsamic vinegar: phenotypic traits relevant for starter cultures selection. Int. J. Microbiol. 125, 46–53. doi: 10.1016/j.ijfoodmicro.2007.11.076
Gullo, M., Zanichelli, G., Verzelloni, E., Lemmetti, F., and Giudici, P. (2016). Feasible acetic acid fermentations of alcoholic and sugary substrates in combined operation mode. Process Biochem. 51, 1129–1139. doi: 10.1016/j.procbio.2016.05.018
Halladj, F., Boukhiar, A., Amellal, H., and Benamara, S. (2016). Optimization of traditional date vinegar preparation using full factorial design. J. Am. Soc. Brew. Chem. 74, 137–144. doi: 10.1094/ASBCJ-2016-2188-01
Hamden, Z., El-Ghoul, Y., Alminderej, F. M., Saleh, S. M., and Majdoub, H. (2022). High-quality bioethanol and vinegar production from Saudi Arabia dates: characterization and evaluation of their value and antioxidant efficiency. Antioxidants 11:1155. doi: 10.3390/antiox11061155
Hassan, S. A., Altalhi, A. D., Gherbawy, Y. A., and El-Deeb, B. A. (2011). Bacterial load of fresh vegetables and their resistance to the currently used antibiotics in Saudi Arabia. Foodborne Pathog. Dis. 8, 1011–1018. doi: 10.1089/fpd.2010.0805
Health Protection Agency (2009). Guidelines for assessing the microbiological safety of ready-to-eat foods placed on the market. London: Health Protection Agency.
Hidalgo, C., Mateo, E., Mas, A., and Torija, M. J. (2012). Identification of yeast and acetic acid bacteria isolated from the fermentation and acetification of persimmon (Diospyros kaki). Food Microbiol. 30, 98–104. doi: 10.1016/j.fm.2011.12.017
Ho, C. W., Lazim, A. M., Fazry, S., Zaki, U. K., and Lim, S. J. (2017). Varieties, production, composition and health benefits of vinegars: a review. Food Chem. 221, 1621–1630. doi: 10.1016/j.foodchem.2016.10.128
Komagata, K., Iino, T., and Yamada, Y. (2014). “The family Acetobacteraceae” in The prokaryotes. eds. E. Rosenberg, E. F. DeLong, S. Lor, E. Stackebrandt, and F. Thompson (New York: Springer), 3–78.
Landeweert, R., Leeflang, P., Kuyper, T. W., Hoffland, E., Rosling, A., Wernars, K., et al. (2003). Molecular identification of ectomycorrhizal mycelium in soil horizons. Appl. Environ. Microbiol. 69, 327–333. doi: 10.1128/AEM.69.1.327-333.2003
Li, L., Cleenwerck, I., De Vuyst, L., and Vandamme, P. (2017). Identification of acetic acid bacteria through matrix-assisted laser desorption/ionization time-of-flight mass spectrometry and report of Gluconobacter nephelii Kommanee et al. 2011 and Gluconobacter uchimurae Tanasupawat et al. 2012 as later heterotypic synonyms of Gluconobacter japonicus Malimas et al. 2009 and Gluconobacter oxydans (Henneberg 1897) De ley 1961 (approved lists 1980) emend. Gosselé et al. 1983, respectively. Syst. Appl. Microbiol. 40, 123–134. doi: 10.1016/j.syapm.2017.01.003
Lin, P. H., Huang, S. Y., Mau, J. L., Liou, B. K., and Fang, T. J. (2010). A novel alcoholic beverage developed from shiitake stipe extract and canes with various Saccharomyces strains. LWT-Food Sci. Technol. 43, 971–976. doi: 10.1016/j.lwt.2010.02.006
Lisdiyanti, P., Katsura, K., Potacharoen, W., Navarro, R. R., Yamada, Y., Uchimura, T., et al. (2003). Diversity of acetic acid bacteria in Indonesia, Thailand, and the Philippines. Microbiol. Cult. Collect. 19, 91–99.
Maqsood, S., Adiamo, O., Ahmad, M., and Mudgil, P. (2020). Bioactive compounds from date fruit and seed as potential nutraceutical and functional food ingredients. Food Chem. 308:125522. doi: 10.1016/j.foodchem.2019.125522
Mas, A., Torija, M. J., García-Parrilla, M. D., and Troncoso, A. M. (2014). Acetic acid bacteria and the production and quality of wine vinegar. Sci. World J. 2014, 1–6. doi: 10.1155/2014/394671
Matloob, M. H. (2014). Zahdi date vinegar: production and characterization. Am. J. Food Technol. 9, 231–245. doi: 10.3923/ajft.2014.231.245
Matloob, M. H., and Balakita, A. A. (2016). Phenolic content of various date palms fruits and vinegars from Iraq. Int. J. Chem. Sci. 14, 1893–1906.
Matsutani, M., Hirakawa, H., Yakushi, T., and Matsushita, K. (2011). Genome-wide phylogenetic analysis of Gluconobacter, Acetobacter, and Gluconacetobacter. FEMS Microbiol. Lett. 315, 122–128. doi: 10.1111/j.1574-6968.2010.02180.x
Medina, E., Romero, C., Brenes, M., and de Castro, A. N. (2007). Antimicrobial activity of olive oil, vinegar, and various beverages against foodborne pathogens. J. Food Prot. 70, 1194–1199. doi: 10.4315/0362-028X-70.5.1194
Mohamed, A., and Fennir, A. (2017). Utilization of low marketing potential Libyan dry dates cultivar (Tasfert) to table vinegar. Int. J. Sci. Res. Publ. 7, 67–77.
Mounir, M., Shafiei, R., Zarmehrkhorshid, R., Hamouda, A., Alaoui, M. I., and Thonart, P. (2016). Simultaneous production of acetic and gluconic acids by a thermotolerant Acetobacter strain during acetous fermentation in a bioreactor. J. Biosci. Bioeng. 121, 166–171. doi: 10.1016/j.jbiosc.2015.06.005
Nguz, K., Shindano, J., Samapundo, S., and Huyghebaert, A. (2005). Microbiological evaluation of fresh-cut organic vegetables produced in Zambia. Food Control 16, 623–628. doi: 10.1016/j.foodcont.2004.07.001
Ohimain, E. I. (2016). Methanol contamination in traditionally fermented alcoholic beverages: the microbial dimension. Springerplus 5:1607. doi: 10.1186/s40064-016-3303-1
Raspor, P., and Goranovič, D. (2008). Biotechnological applications of acetic acid bacteria. Crit. Rev. Biotechnol. 28, 101–124. doi: 10.1080/07388550802046749
Sarraf, M., Jemni, M., Kahramanoğlu, I., Artés, F., Shahkoomahally, S., Namsi, A., et al. (2021). Commercial techniques for preserving date palm (Phoenix dactylifera) fruit quality and safety: a review. Saudi J. Biol. Sci. 28, 4408–4420. doi: 10.1016/j.sjbs.2021.04.035
Song, N. E., Cho, S. H., and Baik, S. H. (2016). Microbial community, and biochemical and physiological properties of Korean traditional black raspberry (Robuscoreanus Miquel) vinegar. J. Sci. Food Agric. 96, 3723–3730. doi: 10.1002/jsfa.7560
Takahashi, M., Yukphan, P., Yamada, Y., Suzuki, K., Sakane, T., and Nakagawa, Y. (2006). Intrageneric structure of the genus Gluconobacter analyzed by the 16S rRNA gene and 16S-23S rRNA gene internal transcribed spacer sequences. J. Gen. Appl. Microbiol. 52, 187–193. doi: 10.2323/jgam.52.187
Tamura, K., Stecher, G., and Kumar, S. (2021). MEGA 11: molecular evolutionary genetics analysis version 11. Mol. Biol. Evol. 38, 3022–3027. doi: 10.1093/molbev/msab120
Vidal, N. P., Manful, C. F., Pham, T. H., Stewart, P., Keough, D., and Thomas, R. H. (2020). The use of XLSTAT in conducting principal component analysis (PCA) when evaluating the relationships between sensory and quality attributes in grilled foods. MethodsX 7:100835. doi: 10.1016/j.mex.2020.100835
Villarreal, P., Quintrel, P. A., Olivares-Muñoz, S., Ruiz, J. J., Nespolo, R. F., and Cubillos, F. A. (2022). Identification of new ethanol-tolerant yeast strains with fermentation potential from Central Patagonia. Yeast 39, 128–140. doi: 10.1002/yea.3662
Yamada, Y., Hosono, R., Lisdyanti, P., Widyastuti, Y., Saono, S., Uchimura, T., et al. (1999). Identification of acetic acid bacteria isolated from Indonesian sources, especially of isolates classified in the genus Gluconobacter. Gen. Appl. Microbiol. 45, 23–28. doi: 10.2323/jgam.45.23
Keywords: acetic acid bacteria, date vinegar, ethanol, fermentation, Gluconobacter , yeast
Citation: Al-Malki FA, Al-Kharousi ZS, Guizani N, Al-Bulushi IM and Al-Sadi AM (2023) Fermentative microbiota and chemical characterization of traditional date vinegar with promising biotechnological applications. Front. Sustain. Food Syst. 7:1142152. doi: 10.3389/fsufs.2023.1142152
Edited by:
Guiomar Melgar-Lalanne, Universidad Veracruzana, MexicoReviewed by:
Marika Pellegrini, University of L’Aquila, ItalyCopyright © 2023 Al-Malki, Al-Kharousi, Guizani, Al-Bulushi and Al-Sadi. This is an open-access article distributed under the terms of the Creative Commons Attribution License (CC BY). The use, distribution or reproduction in other forums is permitted, provided the original author(s) and the copyright owner(s) are credited and that the original publication in this journal is cited, in accordance with accepted academic practice. No use, distribution or reproduction is permitted which does not comply with these terms.
*Correspondence: Zahra S. Al-Kharousi, dW1vaGFuZWRAc3F1LmVkdS5vbQ==
Disclaimer: All claims expressed in this article are solely those of the authors and do not necessarily represent those of their affiliated organizations, or those of the publisher, the editors and the reviewers. Any product that may be evaluated in this article or claim that may be made by its manufacturer is not guaranteed or endorsed by the publisher.
Research integrity at Frontiers
Learn more about the work of our research integrity team to safeguard the quality of each article we publish.