
94% of researchers rate our articles as excellent or good
Learn more about the work of our research integrity team to safeguard the quality of each article we publish.
Find out more
ORIGINAL RESEARCH article
Front. Sustain. Food Syst., 12 April 2023
Sec. Nutrition and Sustainable Diets
Volume 7 - 2023 | https://doi.org/10.3389/fsufs.2023.1115801
This article is part of the Research TopicNew Challenges and Future Perspectives in Nutrition and Sustainable Diets in AfricaView all 16 articles
 Ndashe Kapulu1,2
 Christian Chomba3
 Chewe Nkonde4Melvin Holmes1Simon Manda5
 Harriet E. Smith6
 Jennie I. Macdiarmid7
 Caroline Orfila1*
Introduction: Soybean farming in Zambia is promoted to increase farm productivity and diversification away from maize, and improve cash income and livelihoods for farmers. However, the impact of soybean farming on women's dietary intake is not clear. This study compares the dietary diversity of women from soybean (S) and non-soybean (NS) farming households as a pathway to understanding policy efficacy.
Methods: A cross-sectional survey involving 268 women of reproductive age from 401 rural households was conducted in two soybean-producing districts of Central Province, Zambia. Data from a qualitative 7-day food frequency questionnaire (FFQ) was used to calculate dietary diversity scores (DDS), women's dietary diversity scores (WDDS-10) and assess dietary patterns. Information on household sociodemographic and agricultural characteristics was used to explore determinants of dietary diversity.
Results: Results show there were no significant differences in the mean DDS (S: 10.3 ± 2.4; NS:10.3 ± 2.6) and WDDS-10 (S:6.27 ± 1.55; NS:6.27 ± 1.57) of women from soybean and non-soybean farming households. Both cohorts had similar dietary patterns, plant-based food groups with additional fats and oils. Agricultural diversity was not associated with dietary diversity. Household wealth status was the most important determinant of dietary diversity, as women from wealthier households were more likely to have higher DDS (β = 0.262, 95% CI = 0.26 to 0.70, P < 0.001) and WDDS-10 (β = 0.222, 95% CI = 0.08 to 0.37, P < 0.003) compared to those from poorer households. Women from households that spent more on food had a higher DDS (β = 0.182, 95% CI = 0.002 to 0.07), but not WDDS-10 (β = 0.120, 95% CI = −0.01 to 0.03); for every additional dollar spent on food in the past 7 days, the DDS increased by 0.18. Meanwhile, soyabean farming was not statistically associated with higher wealth.
Conclusions: Policymakers and promoters of agricultural diversification and nutrition-sensitive agriculture need to consider how women can benefit directly or indirectly from soybean farming or other interventions aimed at smallholder farmers.
The United Nations Sustainable Development Goal Two (SDG2) has led to ambitious efforts to transform the food system into one that promotes sustainable development and meets the increased demand for food and nutrients from a rapidly growing population. Increasing policy prominence specifically points to efforts to end hunger, address food insecurity, improve nutrition, and promote sustainable agriculture by 2030 (Nkomoki et al., 2019; Atukunda et al., 2021). In response, national governments have promoted investments in agriculture around internationally linked value chains such as soybean, which are presented as great pathways through which farmers can benefit economically (Manda et al., 2019).
In the past two decades, Zambia has been under growing pressure to improve agricultural productivity to meet the food and nutrition needs of a rapidly growing population (FAO, 2017). This has highlighted the importance of agribusiness and foreign investments in value addition and processing (Mdee et al., 2020), underpinned by different smallholder coordination arrangements (Manda et al., 2018b). However, like other sub-Saharan Africa (SSA) countries, Zambia has a problem of limited agricultural diversity and productivity, with a dominance of maize (Mwanamwenge and Cook, 2019; Kapulu et al., 2020). Driven by increased multinational investment and policy support from the government, in the last two decades, soybean has increased contributions to the national-level supply of key dietary nutrients such as energy, protein, iron, zinc and calcium (Kapulu et al., 2022); however, the effect that soybean growing has on household-level diet quality is not well-understood. Historically, agricultural policies promoted maize production, neglecting crop diversification—only now are these emerging (Kapulu et al., 2022). Consequently, diets have predominantly remained poorly diversified, limiting the availability of macro and micronutrients (Joy et al., 2014; Kapulu et al., 2022), increasing the risk of dietary deficiencies and associated poor health outcomes (Afshin et al., 2019).
In Zambia, women and children are the most affected by undernutrition and micronutrient deficiencies (Doocy and Burnham, 2006; Zambia Statistics Agency, 2019), especially in rural areas (NFNC, 2014; Grech et al., 2018). Despite being important actors in the food system, population data shows that 30% and 14% of women were anemic and vitamin A deficient, respectively (Zambia Statistics Agency, 2019). Among children under 5 years of age, 58% were anemic, 35% stunted, 4% wasted and 12% underweight (Zambia Statistics Agency, 2019). Diversifying agriculture and other forms of nutrition-sensitive agricultural interventions, could be strategies that address nutritional deficiencies among rural households by increasing their access to a range of nutrient-dense foods such as fruits, vegetables, legumes, dairy and eggs (Jones et al., 2014; Mofya-Mukuka and Hichaambwa, 2018). A nationally representative survey in Malawi revealed a strong association between greater farm production diversity with increased consumption of legumes, vegetables and fruits (Jones et al., 2014). In the case of Zambia, the government and its stakeholders have promoted dietary diversity from the assumption that more diverse diets increase the likelihood of achieving caloric and micronutrient adequacy and improved nutritional outcomes (Sibhatu et al., 2022). The proposed pathways through which agriculture contributes to dietary diversity or diet quality include on-farm production and diversification, increased income from agriculture and higher expenditure on food. As an example, on-farm production diversification can be promoted through tax incentives for inputs required to grow healthier foods, improved access to farming advice, seeds and markets, and gendered agricultural empowerment (Ruel et al., 2018; Kaltenbrun et al., 2020; Sharma et al., 2021).
Zambia has developed policies toward agricultural expansion and sustainable intensification (Manda et al., 2019) and diversification of diets away from maize (Mwanamwenge and Harris, 2017). Using data from the 2015 Rural Agricultural Livelihoods Survey (RALS) longitudinal survey, Nkonde et al. (2021) explored household factors contributing to household dietary diversity scores in 7,934 households with children under 5 years in rural Zambia. The study showed that having male household heads, receiving extension advice on diversification, use of productivity enhancing inputs, practicing conservation tillage, education of mothers, amongst others, were significantly associated with households having a diversified diet and being more food secure (defined as having more than 6 months of adequate food provisions). However, the association between agricultural diversification and household dietary diversity score and adequate food provision were not statistically significant.
Soybean is a crop promoted among small-scale farmers to improve agricultural diversity and incomes. The increase is largely driven by expansions in the livestock and edible oil sectors, resulting in growing farmer participation in its production (Sitko et al., 2018). For instance, between 2006 and 2019, soybean production has increased from 57815MT to 281389MT representing a 320% increase (FAOSTAT, 2020). However, much emphasis has been placed on income from soybean production and biodiversity impacts (Manda et al., 2017; Sitko et al., 2018; Nuhu et al., 2021), as opposed to nutritional implications. Moreover, we did not find studies that explore the relationship between participation in soybean farming and nutrition outcomes in households with women of reproductive age.
The overall objective of this paper is to evaluate whether soybean farming contributes to dietary diversity of women in rural Zambia. The specific objectives were (i) to calculate and compare the dietary diversity of women from soybean and non-soybean farming households; (ii) to assess the dietary patterns in those households; and (iii) to determine what sociodemographic and agricultural factors are associated with dietary diversity.
Zambia country has ten provinces and a population of 18 million (CSO et al., 2019). Nearly 1.5 million people live in the Central Province, and almost 75% of the households are in rural settings, from which 90% depend on agriculture for their livelihood. The province has a 56% poverty prevalence rate, while 54% of under-five children were in 2016 wasted, 11% are underweight, and 6% are stunted (CSO, 2016). Malnutrition severity levels range from medium to high (CSO, 2013, 2016). The province accounts for 43% of the area under soybean in Zambia, including 46% of the annual soybean production of 450 000MT (ZAMSTATS, 2020).
The study was conducted in two districts of the Central Province, specifically, Mkushi and Chibombo districts (Figure 1). Chibombo district is located south of Central Province near Lusaka and Kabwe—urbanized cities. The district has an estimated population of 294 000 and an annual growth rate of 2% (CSO et al., 2019). By contrast, Mkushi district is located further north of Central Province, away from major cities and has a population of about 149 000 with a 4% annual growth rate, the highest in the province (CSO et al., 2019). Both districts have a combination of subsistence and commercial farming settlements. However, 85% of farmers are smallscale (CSO, 2016). The few commercial farms occupy the more fertile lands near main trade routes with access to developed infrastructure (MAL-GRZ, 2016). These commercial farms cultivate maize seed, wheat and soybean (grain and seed). In contrast to large scale farming, smallscale agriculture occurs in more remote areas with less developed infrastructure and is characterized by poor soils (MAL-GRZ, 2016, 2018). Maize grain, groundnuts, and pulses such as common beans and cowpeas are grown for subsistence, with some households cultivating cash crops such as soybean, tobacco and cotton.
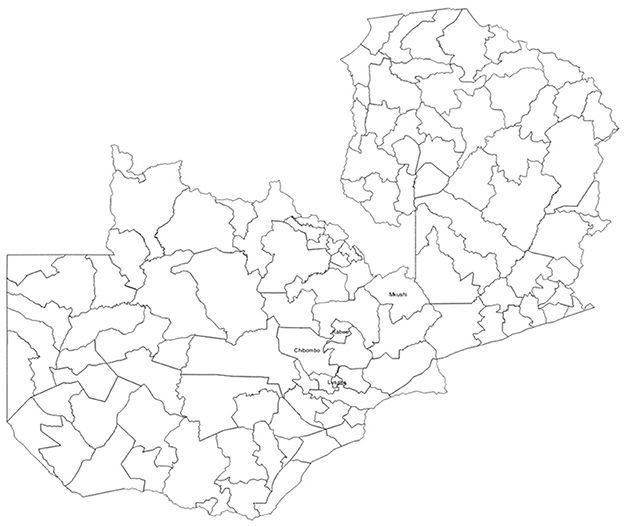
Figure 1. District map of Zambia showing the main study areas Chibombo and Mkushi districts, respectively.
Marketing arrangements for smallscale agriculture in the two districts differ. In Mkushi, the farmers mainly depend on government-controlled markets, while Chibombo has a combination of government and other gateways to commodity markets in nearby urban towns (MAL-GRZ, 2016, 2018). Also, Chibombo hosts Mount Meru Limited, a multinational edible oil processing company that provides access to ready soybean markets and out-grower schemes for smallscale farmers located near the plant. Likewise, other multinational cotton ginneries located in Kabwe and Chibombo offer opportunities for cotton out-grower schemes to smallscale farmers (MAL-GRZ, 2018). In addition, Lusaka hosts well-established grain processing industries for livestock feed, food and edible oils that provide additional soybean markets for farmers in Chibombo (Samboko et al., 2018). Finally, compared to Mkushi, farmers in Chibombo have better access to agricultural advisory services, including government and NGO extension (MAL-GRZ, 2018).
Before undertaking the survey, ethical approval was obtained from ethics committees at the University of Leeds (Ref No. MEEC 18-009) and in Zambia by ERES (Ref No. 2019-Apr-008). In addition, the Zambian government granted clearance to conduct the household survey. During the survey, verbal consent was given by participants in the presence of a witness, normally a local leader, or a government official.
Data collection was conducted over 10 days in May 2019. Five days were spent in each district. This period coincides with the primary harvest season for most crops such as soybean, maize, cassava and groundnuts. The interviews were conducted in three commonly spoken local languages: Bemba, Tonga, and Nyanja. At each household, an adult male or female (in most cases, the head of household) was the primary respondent. The dietary assessment considered responses from women only. Before data collection, questionnaire pre-testing involving 20 households was conducted in Chikumbi agricultural camp, Chibombo district, to ensure the questions were interpreted as intended before conducting the survey. Following the pre-test, the questionnaire was adjusted by rephrasing or including additional terms to some questions. Data were captured electronically on a tablet using a web-based open data kit (ODK) application. Interviews lasted between 50 and 90 min. The data was verified and uploaded to a server at the end of each interview.
The sample comprised 401 respondents of which 268 women of childbearing age (15–49 years) completed the dietary assessment questions. The women were randomly selected using a multistage cluster selection process involving: (1) purposive selection of the two districts (Mkushi and Chibombo) based on soybean market linkages; (2) stratified random selection of four target agricultural camps1 based on access to soybean markets; (3) selection of agricultural zones and determining the number of households for enumeration using probability proportional to size without replacing sampling; (4) simple random sampling of households for enumeration in each zone. As a result, 100 households were selected for enumeration from each respective camp in the two districts (Table 1).
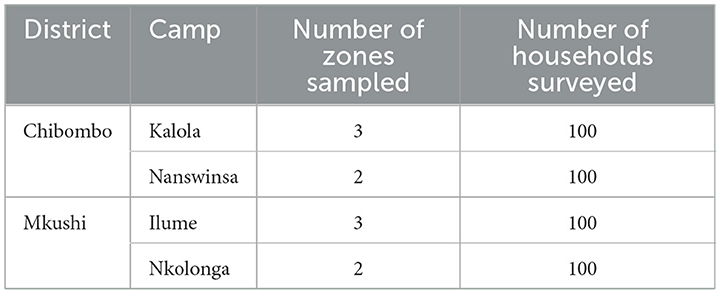
Table 1. The number of households and agricultural camps surveyed.
Ten trained enumerators collected sociodemographic data, including household assets, family size, education status, market distance, and amount spent on food in the past seven days. Agricultural data included land ownership, size of agricultural land, ownership of livestock, and the number of crops cultivated in the past 12 months. Dietary data were collected using a list-based 7-day food frequency questionnaire (FFQ) without portion size estimation. The FFQ was adapted and modified from previous studies conducted in Ethiopia, Tanzania, and Zambia by including other foods commonly eaten in Zambia (WFP, 2008; Ambikapathi et al., 2019; Madzorera et al., 2021).
An asset-based index was constructed using principal component analysis in the Statistical Package for Social Sciences (SPSS) to determine the wealth status of each household (Vyas and Kumaranayake, 2006; Rutstein, 2008). The following variables considered to be determinants of wealth included in the analysis were the type of material used for house walls and floors, primary lighting source, cooking energy source, type of roofing material, ownership of land, livestock, farm and household assets such as tractor, plows, TV, radio, mobile phones. These are reliable determinants of the household wealth status used to overcome bias challenges in self-reporting wealth by participants, especially in rural settings (Morris et al., 2000; Doocy and Burnham, 2006; Rutstein, 2008). All the variables were converted to binary format [yes (1) or no (0)] except for those already collected as continuous variables. The binary recoding indicated whether they were present or absent from a household.
Eigenvalues for each principal component indicated the percentage variation explained in the original data (Vyas and Kumaranayake, 2006). For example, the first component with a 26.4% variance explained in the original data was used to determine individual households' wealth status. Next, the wealth score values were added to the data as a variable for each household to create a new variable. Finally, this new variable indicating a wealth score was used to generate five quintiles representing a wealth index, ranging from 1 being the poorest to 5 the richest.
The FPDS is a simple unweighted count of the number of food crops, plants and livestock species produced and kept on the farm (Sibhatu et al., 2015). The respondents were asked questions on the type of crops produced and livestock species raised on the farm in the last 12 months. The FPDS was calculated from a generated list of crop and livestock species categorized based on the FAO classification (FAO, 1994), including (1) cereals; (2) tubers; (3) pulses; (4) nuts and seeds; (5) vegetables; (6) fruits; (7) cattle; (8) poultry; (9) goats and sheep; (10) pigs; (11) rabbits and guinea pigs. Although farm productivity (total species count on-farm) is a determinant of wealth status (Jones et al., 2014), from a nutrition standpoint, it was necessary to group the species based on their nutritional contribution (Sibhatu and Qaim, 2018a). This approach was taken to avoid double-counting, especially crops (e.g., wheat and maize) with similar nutritional profiles and adding crop and animal species such as tobacco and donkeys, which are not consumed in Zambia. In the end, the FPDS was developed as a continuous variable ranging from 1 to 11.
Dietary diversity is a valuable indicator of household and individual access to different foods and a proxy indicator of nutrient adequacy in the diet for individuals (Arimond et al., 2010; FAO FHI360, 2016; FAO, 2018).
A 7-day FFQ was used to collect information on habitual dietary intake. The dietary information was used to calculate dietary diversity score (DDS) and women's dietary diversity score (WDDS-10).
The DDS was calculated by adding the number of food groups reported consumed in the past 7-days based on 20 binary questions included in FFQ. These are based on an FAO classification of food groups commonly consumed in rural settings of low- and middle-income countries (FAO, 2018). The food groups were predefined as (1) cereals; (2) roots and tubers; (3) pulses; (4) nuts and seeds; (5) dark green vegetables; (6) vitamin A-rich vegetables; (7) other vegetables; (8) vitamin A-rich fruits; (9) other fruits; (10) red palm oil; (11) dairy; (12) meat and poultry; (13) organ meat (i.e., liver, heart, intestines or kidney); (14) eggs; (15) fish and seafood; (16) oils and fats; (17) savory and fried snacks; (18) sweets, confectionery and sweetened beverages; (19) condiments; (20) other beverages (e.g., tea, coffee and alcohol). A score of 1 (if consumed) or 0 (if not consumed) was assigned, to give a maximum score of 20.
The WDDS-10 was calculated using the 7 days binary FFQ data using 10 food groups. The 10 food groups (FAO FHI360, 2016) were aggregated from the list of 20 predefined lists described above and included the following: (1) cereals, roots and tubers; (2) pulses; (3) nuts and seeds; (4) dark green vegetables; (5) vitamin A-rich fruits and vegetables; (6) other vegetables; (7) other fruits; (8) dairy; (9)meat, poultry and fish; (10) eggs. A score of 1 (if consumed) or 0 (if not consumed) was assigned (FAO, 2018). Women who reported consuming at least five or more different food groups in the previous 7 days were expected to have a higher likelihood of achieving micronutrient adequacy compared to those who consumed food from fewer than five food groups (FAO FHI360, 2016; FAO, 2018).
Minimum dietary diversity (MDD-W) for women of reproductive age (MDD-W) is a dichotomous indicator used to establish the prevalence of women in a given population who achieve minimum dietary diversity (FAO FHI360, 2016) in this case among soybean and non-soybean farmers. The MDD-W is determined from 10 food groups used to estimate WDDS-10 and has a cut-off point of 5 (FAO, 2018). A value of 1 was assigned when a woman consumed at least 5 different food groups in the previous 7 days and 0 when otherwise.
Statistical Package for Social Sciences (SPSS) version 25 was used for all statistical analyses (Field, 2009). The normality of the data was checked using the Kolmogorov-Smirnov and Shapiro-Wilk tests, respectively. The variables representing the household, farming, women, and dietary characteristics were summarized as mean standard deviation (SD) or standard error (SE) were appropriate. Summary statistics were used to assess the composition of diets for soybean and non-soybean farmers. Analysis of variance (ANOVA) with Brown-Forsythe robust test was used to test the hypotheses that growing soybean increases mean DDS and WDDS-10, respectively. Bivariate analysis (at P < 0.05 significance level) was conducted to explore for covariates under household (i.e., sociodemographic) and farming (i.e., agricultural) characteristics. In addition, variables were identified as potential confounders based on literature. This included district, farming system, women's education, women's age, gender of household head, education of household head, and age of household head.
A stepwise ordinary least square (OLS) multivariate regression model that included wealth status, household size, nearest market distance, and amount spent on food as explanatory variables and DDS and WDDS-10 as continuous variable outcomes to assess whether sociodemographic factors were predictors of women's dietary diversity. In addition, the model was adjusted for the district, farming system, women's education, women's age, gender of household head, education of household head, and age of household head. Further, a second model assessed the association between agricultural factors, including FPDS and women's dietary diversity. The OLS multivariate regression model included FPDS, the crop area cultivated under soybean, the proportion of crops grown consumed, and the proportion of crops harvested sold as explanatory variables with DDS and WDDS-10 as outcomes. The model was adjusted for confounder as above alongside wealth status. The model outputs included β-coefficients, 95% confidence intervals (CIs), and P-value for each explanatory variable.
The characteristics of study participants from the two farming systems [soybean (S) and non-soybean (NS) farmers] and at the district level (Chibombo and Mkushi) for soybean farming households only are shown in Table 2.
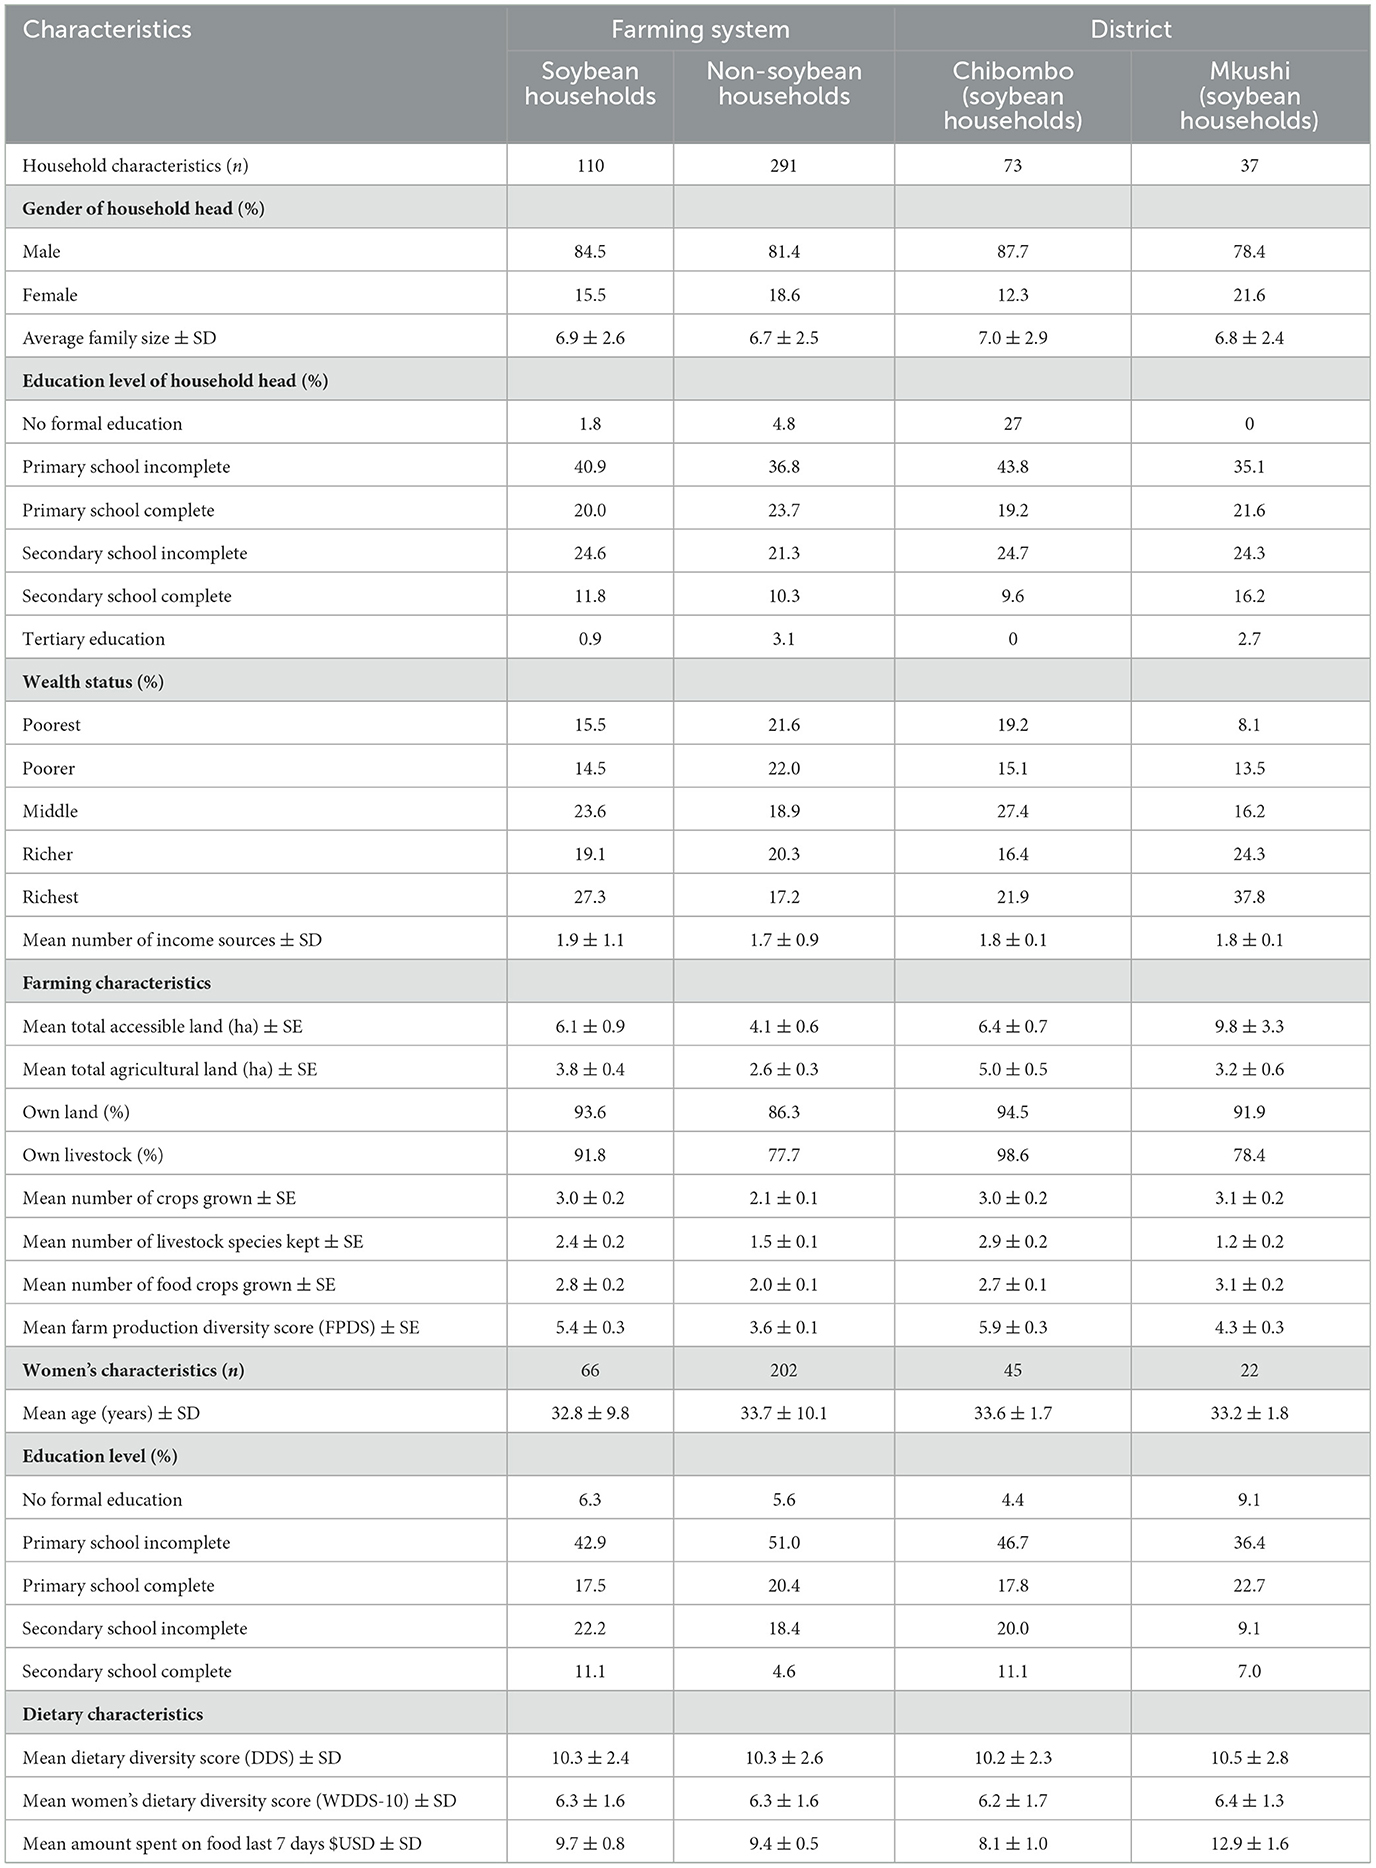
Table 2. Demographic, agricultural and dietary characteristics of the sampled households and women according to the farming system and district.
More than 80% of the head of households in the farming systems were male. The average family size was six people per household. The level of education among household heads was moderately low, with many (61%) having attended school only up to the primary level. Chibombo had a higher proportion (44.2%) of households ranked as “poorest and poor” than the 35.7% from Mkushi. The primary source of income was from on-farm activities, comprising mainly crop production with some livestock keeping.
Households in the survey had access to an average of 5.0 ha of land, while an average of 3.1 ha was used for agriculture in the preceding 12 months. More than 80% owned the land. The mean (±SD) number of crops grown was 3.0 ± 0.15 and 2.1 ± 0.08 for the two farming systems. A further look at the soybean farmers at district levels showed that the mean (±SD) number of crops grown were 3.0 ± 0.16 in Chibombo and 3.1 ± 0.19 in Mkushi. Maize, soybean, beans, sweet potatoes and tomatoes were the most common crops grown. Many households owned livestock, especially chickens and goats, with a few having cattle and pigs. The mean (±SD) FPDS was statistically significantly different for the two farming systems 5.4 ± 0.26 and 3.6 ± 0.13 (P < 0.001) for soybean and non-soybean farms, respectively, and for districts, 4.3 ± 0.25 and 5.9 ± 0.25 (P < 0.001) Mkushi and Chibombo, respectively.
The mean age for women was 33 years. About 50% of the women attended school up to the primary, but only 20% completed secondary and tertiary levels. More than 80% of the women were married.
The mean DDS for women from soybean and non-soybean farming households are shown in Table 3. Analysis of variance (ANOVA) with Brown-Forsythe robust test was used to determine if soybean growing affected mean DDS. The results show that the mean (±SD) DDS between soybean (10.3 ± 2.4) and non-soybean (10.3 ± 2.6) farmers did not differ significantly (P = 0.909). Further analysis of soybean farming households showed that the mean (±SD) DDS of women from Chibombo district (10.2 ± 2.3) did not differ significantly (P = 0.629) from those from Mkushi district (10.5 ± 2.8) (Table 3).
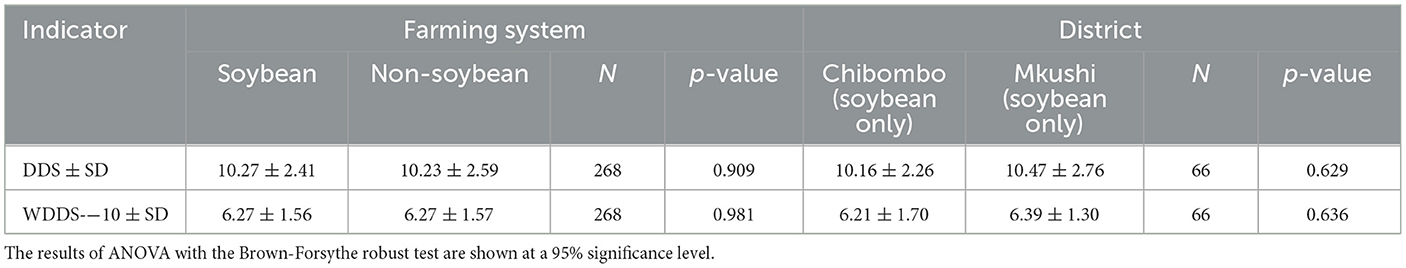
Table 3. Mean ±SD dietary diversity scores (DDS) and women's dietary diversity scores (WDDS-10) categorized according to the farming system and district.
The WDDS-10 for women from soybean and non-soybean farming households are shown in Table 3. The results show that the mean (±SD) WDDS-10 of women from soybean (6.27 ± 1.55) and non-soybean (6.27 ± 1.57) farming households did not differ significantly (P = 0.981). Further analysis of soybean growing households district showed that the mean (±SD) WDDS-10 of women from Chibombo district (6.2 ± 1.7) did not differ significantly (P = 0.636) with those from Mkushi district (6.4 ± 1.3) (Table 3).
The WDDS-10 calculated from food groups consumed in the previous seven days and the proportion of women who achieved the minimum dietary diversity (MDD-W) were further investigated (Figure 2). More than 86% of women from soybean and non-soybean households achieved the MDD-W (i.e., WDDS-10 ≥ 5), while 14% of women did not achieve MDD-W (i.e., WDDS-10 < 5). In this case, the diet comprised of plant-based foods primarily. For example, those who consumed two food groups tended to eat cereals and dark green vegetables. Those who consumed three food groups consumed starchy roots in addition to cereals and dark green vegetables. Only a few reported eating eggs (13%) and fish (38%). As the WDDS-10 increased, the diets comprised mostly starchy roots, dark green vegetables, and other vegetables with other food groups such as pulses, eggs, fish, dairy, organ meat, and meat. Likewise, when the district is considered, over 86 women from soybean farming households in Chibombo and Mkushi achieved an MDD score of 1, consuming >5 food groups daily (Supplementary Figure 1).
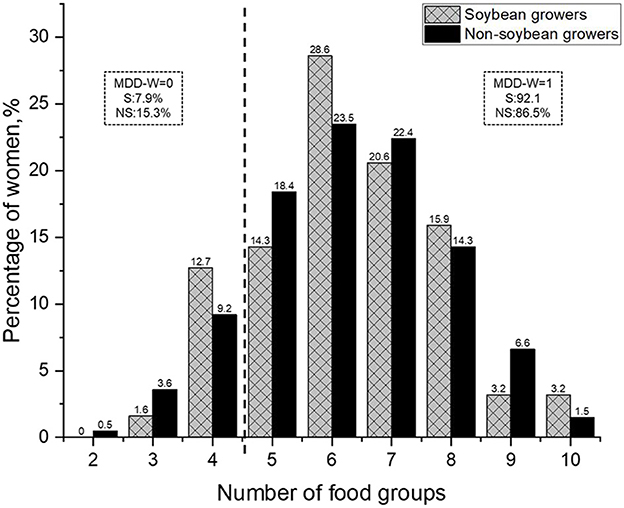
Figure 2. Percentage of women achieving different women's dietary diversity scores (WDDS-10) and prevalence of the minimum dietary diversity for women of reproductive age (MDD-W) among soybean (S) and non-soybean farmers (NS). MDD-W = 1 if the women consumed at least five or more different food groups during the past seven days and 0 otherwise. The dotted line denotes a cut-off point for MDD-W. N = 268.
Figure 3 shows the percentage of households from which women reported consuming a food group in the past seven days. The results confirm the observations with WDDS-10 of a general dominance of plant-based food groups in the diets. Cereals are consumed by more than 95% of households. Nearly 90% reported consuming dark green vegetables and other vegetables, while pulses, roots and tubers, and nuts and seeds were consumed by over 60% of the households. About 50% of the households reported consuming animal products such as fish, eggs, meat, and poultry in the past seven days. A few households reported consuming other food groups such as fruits, dairy, and vitamin A-rich foods. Notably, 20.9% of women from non-soybean farming households said they consumed snacks in the past seven days compared to 77.8% from soybean farming households, while 50.5% from non-soybean farming households consumed sugary foods against 43.1% soybean farming households. Likewise, 86.7% non-soybean farming households said they consumed condiments in the past 7 days compared to 77.8% from soybean farming households.
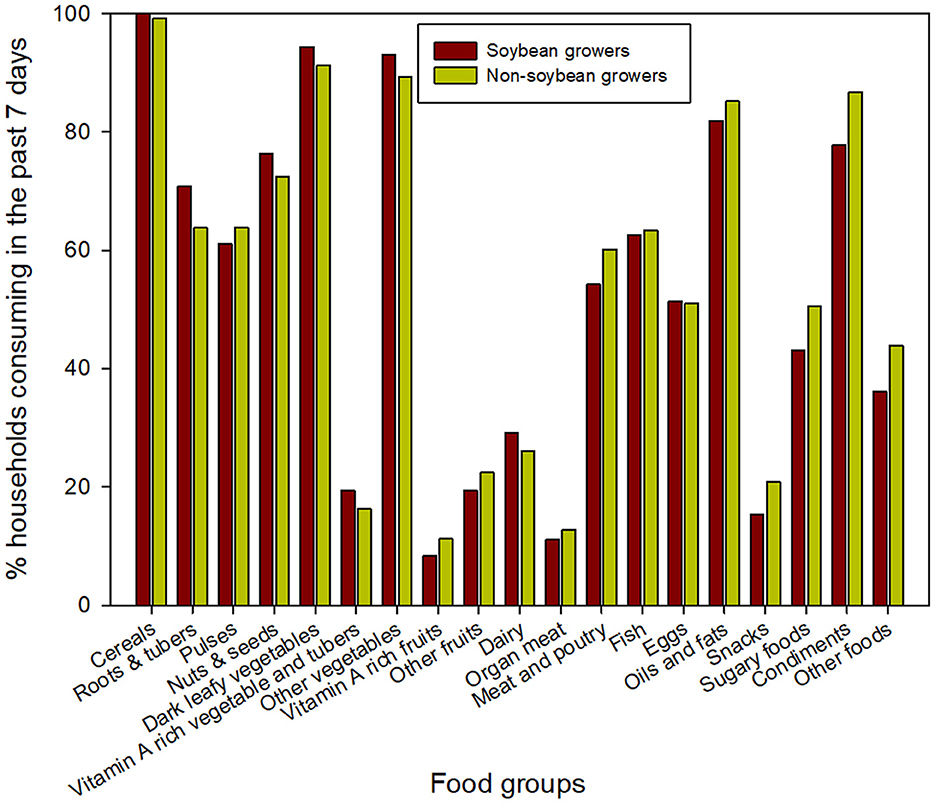
Figure 3. Percentage of women from households who reported consuming a food group in the past 7 days.
Further analysis of dietary patterns among women from soybean-farming households in the two districts revealed that women ate mostly similar foods (Supplementary Figure 2). More than 90% of the women from both districts reported consuming cereals, dark green vegetables, and other vegetables. Notably, the consumption of vitamin A rich fruits, other fruits, dairy, and vitamin A rich vegetables ranged from 6 to 35% in the two districts. However, over 80% reported consuming roots and tubers in Mkushi compared to 65% from Chibombo. Likewise, 80% consumed pulses in Mkushi against 50% in Chibombo, and 84% of the women in Mkushi ate fish compared to 50% from Chibombo. A possible explanation to this is that Mkushi compared to Chibombo has several rivers and streams. In contrast, nuts and seeds were consumed more in Chibombo (91%) than Mkushi (50%). Organ meat (15.0 vs. 3.8%), including meat and poultry (65.2 vs. 34.6%), were also reported to have been eaten more by women from Chibombo than Mkushi, respectively. On the other hand, oils and fats were equally eaten by 87% of the women in Chibombo against 73% from Mkushi.
Table 4 shows the results of a multivariate regression analysis of the relationship between selected household agricultural characteristics with DDS and WDDS-10. The analysis was adjusted for district, farming system, women's education, women's age, gender of household head, education of household head, age of household head and wealth status (see Supplementary Table 3 for unadjusted model outputs). DDS and WDDS-10 were not statistically significantly associated with farming diversity indicator FPDS (P = 0.334; P = 0.222), proportion of crop area cultivated under soybean (P = 0.647; P = 0.575), and proportion of crops grown consumed (P = 0.856; P = 0.903). Notably, the regression analysis shows that the higher proportion of crop harvested sold was associated with greater DDS (β = 0.141, 95% CI = 0.70–3.60) but this was not the case with WDDS-10 (β = 0.087, 95% CI = −0.626 to 1.717). For every kilogram of crop harvested that was sold, DDS increased by 0.141.
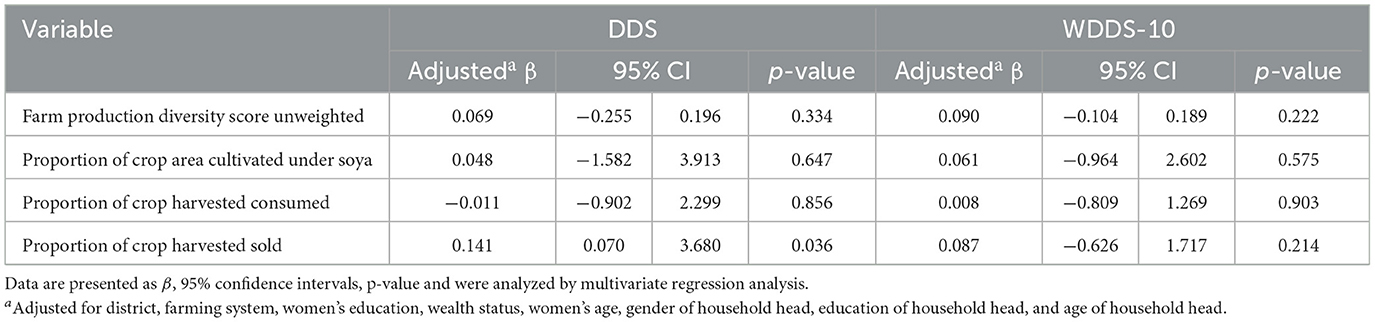
Table 4. Multivariate regression analysis of the relationship between dietary diversity scores (DDS) and women's dietary diversity scores (WDDS-10) and agricultural factors.
Table 5 shows the results of a multivariate regression analysis of the relationship of DDS and WDDS-10 with sociodemographic variables, including wealth status, household size, nearest market distance, and amount spent on food in the past seven days. The analysis was adjusted for district, farming system, women's education, women's age, gender of household head, education of household head, age of household head and wealth status (see Supplementary Table 4 for unadjusted model outputs). Wealth status and amount spent on food in the past 7 days showed a significant positive relationship with women's dietary diversity. Wealth status was associated with higher DDS (β = 0.305, 95% CI = 0.27–0.73) and WDDS-10 (β = 0.230, 95% CI = 0.08–0.37). The results indicate that each unit increase in women's wealth status increased the DDS and WDDS-10 by 0.31 and 0.23, respectively. Women from households that spent more on food in the past seven days were associated with a higher DDS (β = 0.182, 95% CI = 0.002–0.07), but not WDDS-10 (β = 0.120, 95% CI = −0.01 to 0.03). This means that for every additional dollar spent on food in the past 7 days, the DDS increased by 0.18. By contrast, household size and distance to the nearest market were not associated with greater increase in DDS (β = 0.106, 95% CI = −0.101 to 0.15; β = 0.094, 95% CI = −0.005 to 0.021) and WDDS-10 (β = 0.125, 95% CI = −0.037 to 0.125; β = 0.115, 95% CI = −0.001 to 0.015).
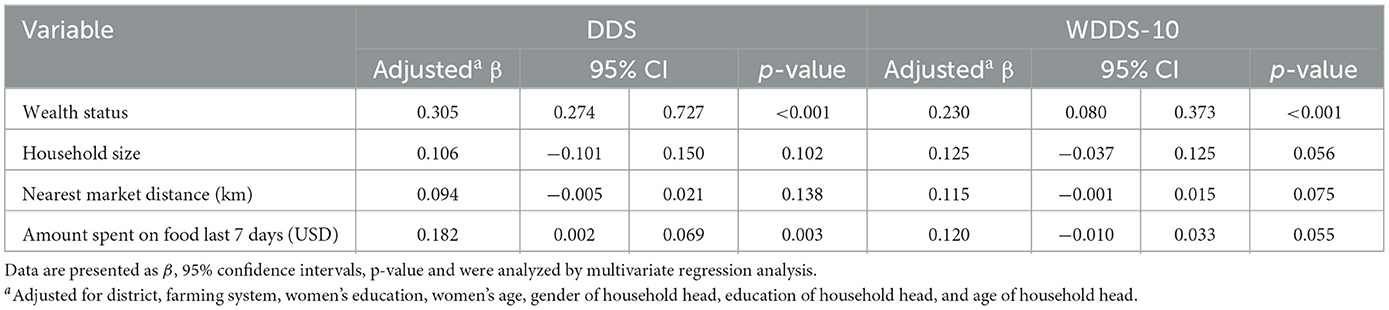
Table 5. Multivariate regression analysis of the relationship between dietary diversity scores (DDS) and women's dietary diversity scores (WDDS-10) and sociodemographic factors.
Here we advance the literature by comparing the dietary diversity of women from soybean and non-soybean households from rural Zambia. Overall, we report no significant difference in DDS and WDDS-10 between the two groups. We explored factors associated with dietary diversity and report that household wealth status is the most important determinant of women's diet diversity as an indicator of diet quality. Our findings suggest that dietary diversity is mediated by socioeconomic factors such as household wealth.
As in other African countries, soybean in Zambia has been promoted to encourage crop diversification away from maize (a leading food and income security crop), improve cash income to farmers and nutritional security (Giller et al., 2011; Manda et al., 2017; Mubichi, 2017). However, the study finds little evidence suggesting that growing soybean resulted in higher diet diversity directly. Farmers are more motivated to grow the crop for sale than household consumption. This could be attributed to the focus of soybean promotional messages as a cash crop rather than food crop. Soybean production and processing (mostly into livestock feeds and edible oils) has increased exponentially in the past two decades. Exports for soybean products such as oilcake/meal enabled by rapid growth in livestock sectors in the Southern African region, seem to drive increased investment in industrial processing of soy (Meyer et al., 2019; Mulenga et al., 2020). Likewise, a recent study using FAO food balance sheets shows that soybean has increased contributions to the national supply dietary nutrients such a calcium, protein, energy, iron at national-level in Zambia (Kapulu et al., 2022). However, the findings from this study show that the quality of diets assessed via DDS and WDDS-10 of women from soybean farming households did not differ from that of non-soybean farming households. The findings demonstrate that soybean farming was not associated directly with more diverse diets. This likely because soybean is processed into oils and livestock feeds, rather than directly consumed. In this cohort, there is low consumption of animal source foods among soybean and non-soybean farming women, suggesting that there is little contribution coming from soybean as animal-feed to the diets of women. Our findings confirm what previous studies show regarding low household-level utilization of soybean for food in SSA. Therefore, there is a need to train farmers in domestic processing for soybean for food to encourage its consumption and utilization—an important enabler (Chianu et al., 2009; Wilson et al., 2021). However, this needs to go alongside interventions such as behavioral change communication focusing on consuming nutritious foods, especially the locally available ones such as eggs and fruits. Nutrition-sensitive agriculture (NSA) programmes focused on women's training in processing their produce have resulted in increased intake of nutritious foods and improved diet diversity (Gondwe et al., 2017).
This study revealed that women from soybean-growing households residing in Chibombo with better proximity to soybean and food markets, including major cities such as Lusaka and Kabwe, achieved similar diet scores compared to those living in Mkushi. This suggests that location did not seem to affect dietary diversity across differently linked to urban cities. Both districts are in rural settings, which could be a function of the diversity of food markets in such settings. For instance, a study involving 600 households conducted in Cameroon and Ghana suggests that households living in urban cities with better access to food markets were more likely to have higher DDS than those from peri-urban (agricultural) cities (Bahadur et al., 2018). Moreover, the women from the two districts had similar consumption patterns (Supplementary Figure 2). Previous reports suggest that in rural Zambian settings, the diets do not differ much, comprising mostly nshima (a thick porridge) made from maize or cassava alongside dark green leafy vegetables, which is consistent with results from this study (Caswell et al., 2018). However, a further look at the dietary composition from results of this study suggest that dietary transitions is slowly occurring among rural households as consumption of sugar and snacks is on the rise (Kapulu et al., 2022). Notably, Chibombo women consumed more meat, poultry, oil, and fats than Mkushi. This could be attributed proximity to edible oil processing plants for the women located in Chibombo.
The present study results showed no relationship between the proportion of crops harvested consumed with DDS and WDDS-10 (Table 3). The farms were not diversified enough with food crops to affect the diet diversity of the women. Another possible explanation for this is that soybean and many other cash crops (e.g., tobacco, groundnuts) have been promoted to increase agricultural incomes (Kumar et al., 2018). However, studies from Zambia report that direct consumption of soybean from their own produce is low due to processing constraints among smallscale farmers (Lubungu et al., 2013; Alamu et al., 2018). This is due to a lack of knowledge of soybean processing techniques such as cooking and baking (from soy-flour) for home consumption (Lubungu et al., 2013). Likewise, a survey conducted among smallholder farmers in Ghana revealed that many farmers consider soybean more of a cash crop than a food crop (Mbanya, 2011). Thus, many smallscale farmers prefer selling most of their harvest, improving their incomes (Meyer et al., 2018).
In Zambia, soybean productivity among smallscale farmers is below 1 ton/ha and is characterized by high transactional costs (Sitko et al., 2018). Farmers also have poor access to inputs and markets offering higher soybean prices (Mbanya, 2011; Asodina et al., 2020). Besides, the scale is too small to provide an adequate income to diversify the food they can purchase. Moreover, smallscale farmers tend to over-specialize when market demand for especially cash crops increases, impacting agricultural and diet diversity, respectively (Mofya-Mukuka and Hichaambwa, 2018). Recent reports from Zambia show that increasing soybean productivity and better market access seems important if smallscale farmers are to realize dietary benefits from soybean production (Nuhu et al., 2021). The study measured resultant welfare benefits from growing soybean on smallscale farmer incomes and household food security. Generally low productivity soybean and limited access to land among smallscale farmers compared to commercial farmers, affected household food security and incomes. This suggests that, while policy interventions in Zambian agriculture have focused on improving agricultural diversity, e.g., promoting soybean and emphasizing increasing rural incomes (Manda et al., 2019), there is a need to improve their access to land and increase productivity. Smallscale farmer production systems are not diverse and thus farming has little to no effect on dietary diversity.
Furthermore, results showed no relationship between FPDS (a proxy indicator of agricultural diversity) and DDS and WDDS (Table 3). In this study, most of the households in the two farming systems and districts had low diversity, and they grew less than three food crops and kept fewer than two livestock species (see Table 2). The pathway linking production diversity with women's diets is complex (Sibhatu and Qaim, 2018a; Madzorera et al., 2021). For example, contributions from farm production diversity to dietary diversity will most likely be diminished if households predominantly grow crops or keep livestock for sale and not consumption. Unlike our study, a previous rural agricultural household survey by Nkonde et al. (2021) used a 24-h recall to investigate the link between agricultural diversification and household diet diversity scores (DDS) among 7,934 households with under 5-year-old children across all 10 provinces of Zambia. They did not find a relationship between agricultural diversification and household diet diversity scores (Sibhatu and Qaim, 2018b; Sibhatu, 2019). In all these studies, better market access mediated the effects of production diversity on dietary diversity. Improved market access can improve farmer incomes from sales, which improves diets when spent on nutritious foods. Provided the markets are well-functioning and have stable supply (available) and affordable nutritious foods (Manda et al., 2018a).
Several factors that seem to mediate the relationship between diversification and diets are reported in the studies (Sibhatu et al., 2015; Sibhatu and Qaim, 2018a; Madzorera et al., 2021). These include consumption of own produce, food prices, food market availability, geographical location, and income from sales. However, while agricultural diversification can improve smallholder incomes (Jones, 2017), the results of this study show a weak association. Agricultural diversification alone, we argue, is not enough, and that there are equally important determinants of the quality and diversity of diets. It can be argued that from a nutrition-sensitive perspective, interventions such as soybean farming are not yet providing the farmers with better access to affordable markets with nutritious foods (Madzorera et al., 2021). This can be achieved with much emphasis on increasing farm income from soybean sales, investment in micro-level processing as well as sensitization on the role and importance of crop diversification more generally and soya bean expansion specifically.
The sociodemographic factors revealed that household wealth was the strongest predictor of DDS and WDDS-10 among agricultural households. For example, every increase in wealth status (i.e., from poorest to poorer or middle to rich) resulted in a 0.26 (95% CI 0.25–0.7) and 0.22 (95% CI 0.08–0.37) unit increase in DDS and WDDS, respectively (Table 4). These findings are aligned with previous research in Zambia by Mofya-Mukuka et al. (2017) that used 24-h recall panel data collected from two surveys in all 10 provinces. The study involving 8839 households also found that household wealth status increased household diet diversity scores by 18 percentage points (Mofya-Mukuka et al., 2017). Further, the present study results show that women's dietary diversity (DDS and WDDS-10) improved in households with wealth status ranked middle, rich and richest, respectively. Conversely, women in poor and poorest ranked households had low diet diversity regardless of farming system and district.
Considering that the districts in this study are rural, poverty levels are high (CSO, 2016), with limited infrastructure and inadequate institutional support for market engagement. This could potentially be the reason this study did not find difference in diets between soybean and non-soybean households. A recent study shows that farmers who cultivated < 5 ha soybean (i.e., smallscale) did not receive sufficient economic returns to reduce poverty, despite a wider growing market demand and soybean prices (Nkonde et al., 2021). Limited market connectivity could be another important factor.
Another key finding in this study was a positive relationship between the proportion of crops harvested and sold with DDS. The regression model was adjusted for district (Chibombo and Mkushi), farming system (soybean and non-soybean) and wealth status. It is plausible that women from households that allocated more money toward food achieved more diverse diets. A panel study in Zambia confirmed this, finding a positive association between land under soybean and increased incomes from sales with diet diversity (Nkonde et al., 2021).
This study found that the amount of money spent on food was positively associated with DDS and WDDS-10. The finding agrees with previous studies that report increased effects of income from agriculture on diet diversity (Mofya-Mukuka and Hichaambwa, 2018; Some and Jones, 2018; Mulenga et al., 2021). This study demonstrates that although crops like soybean have been promoted as cash crops, this may not always impact diet diversity if incomes earned are not sufficient. Policy measures that provide income social safety nets especially for the poor are required, including tax incentives on nutritious foods to increase availability.
Nevertheless, this was not the case for farmers who did not receive sufficient economic returns from soybean growing on < 5 ha of soybean. Smallscale soybean production is characterized by low productivity. Their yields and land area were insufficient to improve their wealth despite growing market demand and soybean prices (Nkonde et al., 2021). In the case of the present study, farmers involved in soybean need to earn enough income from crop sales for soybean to improve diets via the income pathway.
Therefore, while the Zambian government has promoted soybean to improve rural incomes, the results from this study show that improving diet diversity among rural farming households involves complex socioeconomic factors. Some of these notable factors include food market availability, the proportion of harvest retained for consumption, the amount spent on food, household-level decision-making dynamics, women empowerment, education, and incomes from sales (Wineman, 2016; Gondwe et al., 2017; Rosenberg et al., 2018; Sauer et al., 2018; Mulenga et al., 2021). For example, women play an important role in making decisions about food purchases (Bellon et al., 2016). However, women are at a higher risk of achieving low diet diversity, especially if they are less empowered and come from low-income or poor households (Harris-Fry et al., 2015; Madzorera et al., 2021). Since poor women may find it difficult to purchase enough food, including nutritious ones, to feed the entire household, they might prioritize meeting the food needs of other family members (e.g., children and men) over their own (Chakona and Shackleton, 2017). Therefore, a better understanding of such household dynamics is needed if interventions such as soybean farming are to achieve food security and desired nutrition outcomes for women.
Economic imperatives, specifically attractive soybean prices driven by increased market demand, seem to be the Government basis for encouraging farmers to participate in soybean production in Zambia. The framing of soybean promotional messages among smallscale farmers are primarily for income rather than food. Evidence from this study support the hypothesis that farmers may be growing soybean for markets to earn higher incomes and not for direct food consumption or healthy food purchases. This research suggested limited evidence of soybean utilization for food among smallscale farmers. There is a need to sensitize smallscale farmers, especially women, on the nutritional benefits of soybean consumption and household-level processing technologies. Future studies should further explore opportunities and barriers for household-level soybean utilization among smallholder farmers.
This study also found an important difference between households in different wealth quintiles regardless of the farming system (soybean or non-soybean). Smallscale farmers rely on market functionality to grow their incomes and access nutritious foods. Results underpin the argument that the functionality of markets such as for soybean for farmers located both nearer and further away from cities and main roads could raise challenges including price exploitation. As with other crop value chains, this increases transactional costs on the part of smallscale farmers and undermines incomes, perpetuating the poverty trap (see Manda, 2022). The policy drive to expand soybean production has not considered the dynamics among smallscale farmers; instead, as the case has been with maize, the approach is more holistic than targeted. The implication is that because most of these farmers depend on agriculture as their main livelihood activity, they may not generate sufficient incomes (in this case, soybean farming) to enable them to move out of poverty and simultaneously meet their food needs (Mdee et al., 2020). Most smallscale farmers have access to small portions of land on which they also grow other staples. Furthermore, smallscale soybean farming is characterized by low productivity and poor market functionality. The farmers are not likely to earn sufficient incomes from soybean growing until these improve (Nkonde et al., 2021). The income pathway should be complemented with additional interventions to influence income use, for example, nutrition education and women empowerment for increased decision-making on how income from agriculture including soybean production, and non-agriculture sources are used to purchase nutrient-dense food.
For the first time, a study in Zambia focuses explicitly on assessing how soybean farming is associated with diet quality. However, the study has several limitations. First, the FFQ did not specifically ask questions about the consumption of soybean-based foods. Soybean was included in the FFQ as a food item under oil crops alongside other crops such as groundnuts and sunflower. Consequently, a limitation of this study is that it might not be possible to ascertain a single direct contribution to diet scores from soybean alone. In this case, dietary assessment methods that use an open 24 h recall would be fittingly relevant to assess the consumption of soybean. Therefore, caution should be applied when interpreting the results, as FFQ are good for estimating dietary patterns and not consumption of specific foods. While DDS it is a good measure of food access within the context of food security, it does not provide an indication of nutrient adequacy at the individual level (FAO, 2018) because it does not consider the nutritional quality of food groups consumed. This is particularly important considering that micronutrient deficiencies such as calcium, zinc, folate, and iron are prevalent among women in rural areas. To examine adequacy of the diet at an individual level, the WDDS-10 was used because it considers the quality of the diet by assessing the type of food groups consumed. The WDDS-10 is an easy-to-use proxy indicator for nutrient adequacy to determine diet quality when resources and time are limited (Arimond et al., 2010; FAO, 2018). The women from both farming systems had a mean DDS of 10 and consumed six food groups (WDDS-10 = 6) of the 10 required to achieve diet adequacy. Soybean was included in the FFQ as a food item under oil crops. While groundnuts are generally consumed in various forms, sunflower and soybean are mostly eaten as edible oil, represented in a different food category (i.e., oils and fats).
The study was a single time point study during the harvest months, which could change in the leaner months. Seasonality can influence dietary patterns and, consequently, the supply of dietary nutrients and nutrient adequacy (Caswell et al., 2018; Ambikapathi et al., 2019). For example, Caswell et al. (2018) shows that DDS for both women and children varied greatly across seasons in their study which involved 24h dietary recalls repeated 7 times over a period of a year. Food supply especially in rural setting could be influenced by seasonality and the geographical characteristics if the area e.g., proximity to food markets (Ambikapathi et al., 2019). Thus, future studies could design dietary assessment tools (e.g., a quantitative 24-h recall) that specifically ask questions about the consumption of different soybean foods alongside other foods and repeat this over time and across seasons.
This study has demonstrated that wealth status and income utilization are determinants of the dietary diversity of women from farming households in Zambia rather than agricultural diversification. Our study shows that diversifying small-scale agriculture through soybean farming does not appear to directly benefit diet diversity of women. Policymakers and promoters of agricultural diversification need to consider sociodemographic factors such as wealth status and market access as important drivers of dietary improvement. Policies that improve income need to be complemented with additional interventions to improve income utilization and increase soybean utilization in the household. This study provides a basis to inform nutrition-sensitive agriculture policies, including the implications of agricultural expansions to soybean on small-scale farmer livelihoods and nutrition outcomes. By better understanding the drivers and barriers, policymakers can develop appropriate strategies for improving nutritional outcomes among small-scale farming households affected by agricultural expansions.
The raw data supporting the conclusions of this article will be made available by the authors, without undue reservation.
The studies involving human participants were reviewed and approved by University of Leeds (Ref No. MEEC 18-009) and in Zambia by ERES (Ref No. 2019-Apr-008). Verbal consent was given by participants in the presence of a witness, normally a local leader, or a government official. Written informed consent for participation was not required for this study in accordance with the national legislation and the institutional requirements.
NK, CO, HS, JM, CN, and CC conceptualized the research. NK and HS developed the methodology. NK collected and curated the data and wrote the first draft of the manuscript. NK and MH analyzed the data. NK, CO, SM, HS, JM, CN, and CC critically evaluated the results and contributed to the writing and editing of the manuscript. CO, HS, and SM supervised the research. All authors contributed to the article and approved the submitted version.
This research was funded by the Biological Sciences Research Council (BBSRC) under the Global Challenges Research Fund (GCRF) project Agricultural and Food-system Resilience: Increasing Capacity and Advising Policy (GCRF-AFRICAP) grant number BB/P027784/1, and by Research England through a Ph.D. stipend to NK (project reference number 95522727).
The findings presented in this paper forms part of a Ph.D. thesis by NK at the University of Leeds [Kapulu, Ndashe Philemon (2022)] Soybean Agricultural Expansions and Implications for Food and Nutrition Security in Zambia. Ph.D. thesis, University of Leeds, accessible via https://etheses.whiterose.ac.uk/31809/. The authors wish to thank Prof. Tim Benton and Dr. Stephen Whitfield for leading the GCRF-AFRICAP project and suggesting the general area of study; Bertha Munthali at FARNPAN for discussions on the dietary assessment; Dr. Njongile Nyoni at FARNPAN for assistance with data collection and the ODK tool; the enumerators who assisted in data collection and the participants for taking part in the study.
CC was employed by Agricultural Consultative Forum.
The remaining authors declare that the research was conducted in the absence of any commercial or financial relationships that could be construed as a potential conflict of interest.
All claims expressed in this article are solely those of the authors and do not necessarily represent those of their affiliated organizations, or those of the publisher, the editors and the reviewers. Any product that may be evaluated in this article, or claim that may be made by its manufacturer, is not guaranteed or endorsed by the publisher.
The Supplementary Material for this article can be found online at: https://www.frontiersin.org/articles/10.3389/fsufs.2023.1115801/full#supplementary-material
Supplementary Figure 1. Percentage of women achieving different women's dietary diversity scores (WDDS-10) and prevalence of the minimum dietary diversity for women of reproductive age (MDD-W) among soybean farmers. MDD-W = 1 if the women consumed at least five or more different food groups during the past seven days and 0 otherwise. The dotted line denotes a cut-off point for MDD-W. N = 66.
Supplementary Figure 2. Percentage of women from soybean households in Chibombo and Mkushi who reported consuming a food group in the past 7 days.
1. ^A camp is an official government geographical area delineated into zones for administrative purposes comprising agricultural households. The number of households per camp can range from 300 to 3000.
Afshin, A., Sur, P. J., Fay, K. A., Cornaby, L., Ferrara, G., Salama, J. S., et al. (2019). Health effects of dietary risks in 195 countries, 1990–2017: a systematic analysis for the Global Burden of Disease Study 2017. Lancet 393, 1958–1972. doi: 10.1016/S0140-6736(19)30041-8
Alamu, E. O., Popoola, I., and Maziya-Dixon, B. (2018). Effect of soybean (Glycine max (L.) Merr.) flour inclusion on the nutritional properties and consumer preference of fritters for improved household nutrition. Food Sci. Nutr. 6, 1811–1816. doi: 10.1002/fsn3.751
Ambikapathi, R., Gunaratna, N. S., Madzorera, I., Passarelli, S., Canavan, C. R., Noor, R. A., et al. (2019). Market food diversity mitigates the effect of environment on women's dietary diversity in the Agriculture to Nutrition (ATONU) study, Ethiopia. Public Health Nutr. 22, 2110–2119. doi: 10.1017/S136898001900051X
Arimond, M., Wiesmann, D., Becquey, E., Carriquiry, A., Daniels, M. C., Deitchler, M., et al. (2010). Simple food group diversity indicators predict micronutrient adequacy of women's diets in 5 diverse, resource-poor settings. J. Nutr. 140, 2059S−2069S. doi: 10.3945/jn.110.123414
Asodina, F. A., Adams, F., Nimoh, F., Weyori, E. A., Wongnaa, C. A., and Bakang, J. E.-A. (2020). Are non-market benefits of soybean production significant? An extended economic analysis of smallholder soybean farming in Upper West region of northern Ghana. Agric. Food Security 9, 13. doi: 10.1186/s40066-020-00265-7
Atukunda, P., Eide, W. B., Kardel, K. R., Iversen, P. O., and Westerberg, A. C. (2021). Unlocking the potential for achievement of the UN Sustainable Development Goal 2 - 'Zero Hunger' - in Africa: targets, strategies, synergies and challenges. Food Nutr. Res. 65, 7686–7697. doi: 10.29219/fnr.v65.7686
Bahadur, K. K. C., Legwegoh, A. F., Therien, A., Fraser, E. D. G., and Antwi-Agyei, P. (2018). Food price, food security and dietary diversity: a comparative study of Urban Cameroon and Ghana. J. Int. Dev. 30, 42–60. doi: 10.1002/jid.3291
Bellon, M. R., Ntandou-Bouzitou, G. D., and Caracciolo, F. (2016). On-farm diversity and market participation are positively associated with dietary diversity of rural mothers in Southern Benin, West Africa. PLoS ONE 11, e0162535. doi: 10.1371/journal.pone.0162535
Caswell, B. L., Talegawkar, S. A., Siamusantu, W., West, K. P. Jr., and Palmer, A. C. (2018). A 10-food group dietary diversity score outperforms a 7-food group score in characterizing seasonal variability and micronutrient adequacy in rural zambian children. J. Nutr. 148, 131–139. doi: 10.1093/jn/nxx011
Chakona, G., and Shackleton, C. (2017). Minimum dietary diversity scores for women indicate micronutrient adequacy and food insecurity status in South African Towns. Nutrients 9, 812. doi: 10.3390/nu9080812
Chianu, J. N., Ohiokpehai, O., Vanlauwe, B., and Sanginga, N. (2009). Promoting a versatile but yet minor crop: soybean in the farming systems of Kenya. J. Sust. Dev. Afr. 11, 78–97.
CSO (2013). Census of Population and Housing, Agriculture analytical report: Population and Demographic Projections 2011 - 2035. Lusaka, Zambia: Central Statistical Office Zambia.
CSO (2016). (2015). Living Conditions Monitoring Survey Key Findings. 2602112534. Lusaka, Zambia: Central Statistical Office Zambia.
CSO MoH and ICF. (2019). Zambia Demographic Health Survey 2018: Key Indicator Report Office, C.S. Rockville, MD, USA: Central Statistical Office, Ministry of Health, and ICF.
Doocy, S., and Burnham, G. (2006). Assessment of socio-economic status in the context of food insecurity: implications for field research. World Health Popul. 8, 32–42. doi: 10.12927/whp.2006.18212
FAO (1994). Definition and Classification of Commodities. Rome, Italy: Food and Agriculture Organization of the United Nations (FAO). Available online at: https://www.fao.org/waicent/faoinfo/economic/faodef/faodefe.htm (accessed January 17, 2020).
FAO (2018). Dietary Assessment: A Resource Guide to Method Selection and Application in Resource Settings. Rome: Food and Agriculture Organisation of the United Nations.
FAO and FHI360 (2016). Minimum Dietary Diversity Scores for Women: A Guide for Measurement. Rome, Italy: FAO.
FAOSTAT (2020). FAOSTAT. Food Balance Sheet. Available online at: https://www.fao.org/faostat/en/#data/TCL
Giller, K. E., Murwira, M. S., Dhliwayo, D. K. C., Mafongoya, P. L., and Mpepereki, S. (2011). Soyabeans and sustainable agriculture in southern Africa. Int. J. Agric. Sust. 9, 50–58. doi: 10.3763/ijas.2010.0548
Gondwe, T. M., Alamu, E. O., Musonda, M., Geresomo, N., and Maziya-Dixon, B. (2017). The relationship between training farmers in agronomic practices and diet diversification: a case study from an intervention under the Scaling Up Nutrition programme in Zambia. Agric. Food Security. 6, 72. doi: 10.1186/s40066-017-0151-3
Grech, A. M., Alders, R., Darton-Hill, I., Bagnol, B., Hikeezi, D., and O'Leary, F. M. (2018). Nutrition knowledge, attitudes and dietary intake of women of reproductive age in women in Bundabunda Ward, Zambia. Clin. J. Nutr. Dietet. 1, 1–12.
Harris-Fry, H., Azad, K., Kuddus, A., Shaha, S., Nahar, B., Hossen, M., et al. (2015). Socio-economic determinants of household food security and women's dietary diversity in rural Bangladesh: a cross-sectional study. J. Health Popul. Nutr. 33, 2. doi: 10.1186/s41043-015-0022-0
Jones, A. D. (2017). Critical review of the emerging research evidence on agricultural biodiversity, diet diversity, and nutritional status in low- and middle-income countries. Nutr. Rev. 75, 769–782. doi: 10.1093/nutrit/nux040
Jones, A. D., Shrinivas, A., and Bezner-Kerr, R. (2014). Farm production diversity is associated with greater household dietary diversity in Malawi: findings from nationally representative data. Food Policy 46, 1–12. doi: 10.1016/j.foodpol.2014.02.001
Joy, E. J., Ander, E. L., Young, S. D., Black, C. R., Watts, M. J., Chilimba, A. D., et al. (2014). Dietary mineral supplies in Africa. Physiol. Plant. 151, 208–229. doi: 10.1111/ppl.12144
Kaltenbrun, T. A., du Plessis, L. M., and Drimie, S. (2020). A qualitative analysis of perceptions of various stakeholders on nutrition-sensitive agricultural interventions, including the taxation on sugar-sweetened beverages (SSBs), to improve overall health and nutrition in South Africa. BMC Public Health. 20, 1342. doi: 10.1186/s12889-020-09440-8
Kapulu, N., Clark, H., Manda, S., Smith, H. E., Orfila, C., and Macdiarmid, J. I. (2022). Evolution of energy and nutrient supply in Zambia (1961-2013) in the context of policy, political, social, economic and climatic changes. Food Security. 15, 323–342. doi: 10.1007/s12571-022-01329-1
Kapulu, N. P., Clark, H., Orfila, C., and Macdiarmid, J. I. (2020). “An evaluation of protein supply in Zambia between 1961 and 2013 shows dominance of plant-based sources,” in Proceedings of the Nutrition Society. Nutrition Society Live (2020). 14 Jul 2020 - 15 Jul 2020. Online. (Cambridge University Press (CUP)} doi: 10.1017/S002966512000748X. Available online at: https://eprints.whiterose.ac.uk/171045/
Kumar, N., Nguyen, P. H., Harris, J., Harvey, D., Rawat, R., and Ruel, M. T. (2018). What it takes: evidence from a nutrition- and gender-sensitive agriculture intervention in rural Zambia. J. Dev. Effect. 10, 341–372. doi: 10.1080/19439342.2018.1478874
Lubungu, M., Burke, W. J., and Sitko, N. J. (2013). Analysis of the Soya Bean Value Chain in Zambia's Eastern Province. IAPRI Working Paper, 74. Indaba Agricultural Policy Research Institute, Lusaka, Zambia.
Madzorera, I., Blakstad, M. M., Bellows, A. L., Canavan, C. R., Mosha, D., Bromage, S., et al. (2021). Food crop diversity, women's income-earning activities, and distance to markets in relation to maternal dietary quality in Tanzania. J. Nutr. 151, 186–196. doi: 10.1093/jn/nxaa,329
Manda, J., Alene, A. D., Mukuma, C., and Chikoye, D. (2017). Ex-ante welfare impacts of adopting maize-soybean rotation in eastern Zambia. Agric. Ecosyst. Environ. 249, 22–30. doi: 10.1016/j.agee.2017.07.030
Manda, S. (2022). Inside Zambia's 'new normal:' COVID-19 policy responses and implications for peri-urban food security and livelihoods. J. Int. Dev. doi: 10.1002/jid.3720. [Epub ahead of print].
Manda, S., Dougill, A., and Tallontire, A. (2018a). Business ‘Power of presence:' Foreign capital, industry practices and politics of sustainable development in Zambia. J. Develop. Stud. 56, 186–204. doi: 10.1080/00220388.2018.1554212
Manda, S., Dougill, A., and Tallontire, A. (2018b). Outgrower schemes, livelihoods and response pathways on the Zambian ‘sugarbelt.' Geoforum. 97, 119–130. doi: 10.1016/j.geoforum.2018.10.02
Manda, S., Dougill, A., and Tallontire, A. (2019). Large-scale land acquisitions and institutions: Patterns, influence and barriers in Zambia. Geograph. J. 2019, 1–15. doi: 10.1111/geoj.12291
Mbanya, W. (2011). Assessment of the constraints in soybean production: a case of Northern Region, Ghana. J. Dev. Sust. Agric. 6, 199–214. doi: 10.11178/jdsa.6.199
Mdee, A., Manda, S., Chasukwa, M., and Ofori, A. (2020). Neither sustainable nor inclusive: a political economy of agricultural policy and livelihoods in Malawi, Tanzania and Zambia. J. Peas. Stud. 48, 1260–1283. doi: 10.1080/03066150.2019.1708724
Meyer, F., Davids, T., and Chisanga, B. (2019). Feed the Future Zambia Commodity Balance Sheet: Soybeans Dataset. USAID Development Data Library: USAID. Available online at: https://data.usaid.gov/d/c755-9iqz (accessed January 17, 2020).
Meyer, F., Traub, L., Davids, T., Chisanga, B., Kachule, R., Tostão, E., et al. (2018). Modelling Soybean Markets in Eastern and Southern Africa: Regional Network of Agricultural Policy Research Institutes (ReNAPRI). Luxembourg: Publications Office of the European Union [Working Paper].
Mofya-Mukuka, R., and Hichaambwa, M. (2018). Livelihood effects of crop diversification: a panel data analysis of rural farm households in Zambia. Food Security 10, 1449–1462. doi: 10.1007/s12571-018-0872-6
Mofya-Mukuka, R., Sambo, J., and Kuhlgatz, H. C. (2017). Exploring Linkages Between Farm Productive Assets and Household Food Security in Zambia: Working Paper 124. Lusaka: Indaba Agricultural Policy Research Institute (IAPRI).
Morris, S. S., Carletto, C., Hoddinott, J., and Christiaensen, L. J. M. (2000). Validity of rapid estimates of household wealth and income for health surveys in rural Africa. J. Epidemiol. Community Health 54, 381–387. doi: 10.1136/jech.54.5.381
Mubichi, F. (2017). A comparative study between Mozambique and Malawi soybean adoption among smallholder farmers. J. Rural Soc. Sci. 32, 21–39.
Mulenga, B. P., Banda, A., Kasoma-Pele, W., and Chapoto, A. (2020). Soybean Value Chain Analysis in Zambia. Lusaka, Zambia: Indaba Agricultural Policy Research Institute (IAPRI) [Working Paper 157]. Available online at: http://www.iapri.org.zm (accessed November 21, 2021).
Mulenga, B. P., Ngoma, H., and Nkonde, C. (2021). Produce to eat or sell: panel data structural equation modeling of market participation and food dietary diversity in Zambia. Food Policy 102, 102035. doi: 10.1016/j.foodpol.2021.102035
Mwanamwenge, M., and Cook, S. J. (2019). Beyond Maize: Exploring Agricultural Diversification in Zambia from Different Perspectives. Sustainable Diets for All. Lusaka: Hivos and International Institute for Environment and Development (IIED).
Mwanamwenge, M., and Harris, J. (2017). Agriculture, Food Systems, Diets and Nutrition in Zambia. Sustainable diets for all. Lusaka: HIVOS and IIED.
NFNC (2014). Zambia Food Consumption and Micronutrient Status Survey Report. Lusaka, Zambia: National Food and Nutrition Commission.
Nkomoki, W., Bavorová, M., and Banout, J. (2019). Factors associated with household food security in Zambia. Sustainability 11, 2715. doi: 10.3390/su11092715
Nkonde, C., Audain, K., Kiwanuka-Lubinda, R. N., and Marinda, P. (2021). Effect of agricultural diversification on dietary diversity in rural households with children under 5 years of age in Zambia. Food Sci. Nutr. 9, 6274–6285. doi: 10.1002/fsn3.2587
Nuhu, A. S., Liverpool-Tasie, L. S. O., Awokuse, T., and Kabwe, S. (2021). Do benefits of expanded midstream activities in crop value chains accrue to smallholder farmers? Evidence from Zambia. World Dev. 143, 105469. doi: 10.1016/j.worlddev.2021.105469
Rosenberg, A. M., Maluccio, J. A., Harris, J., Mwanamwenge, M., Nguyen, P. H., Tembo, G., et al. (2018). Nutrition-sensitive agricultural interventions, agricultural diversity, food access and child dietary diversity: evidence from rural Zambia. Food Policy 80, 10–23. doi: 10.1016/j.foodpol.2018.07.008
Ruel, M. T., Quisumbing, A. R., and Balagamwala, M. (2018). Nutrition-sensitive agriculture: what have we learned so far? Glob. Food Security 17, 128–153. doi: 10.1016/j.gfs.2018.01.002
Rutstein, S. O. (2008). The DHS Wealth Index: Approaches for rural and urban areas, in Demographic and Health Research: DHS Working Papers (2008). No. 60. United States Agency for International Development.
Samboko, P. C., Zulu-Mbata, O., and Chapoto, A. (2018). Analysis of the animal feed to poultry value chain in Zambia. Dev. South. Afr. 35, 351–368. doi: 10.1080/0376835X.2018.1480932
Sauer, C. M., Mason, N. M., Maredia, M. K., and Mofya-Mukuka, R. (2018). Does adopting legume-based cropping practices improve the food security of small-scale farm households? Panel survey evidence from Zambia. Food Security 10, 1463–1478. doi: 10.1007/s12571-018-0859-3
Sharma, I. K., Di Prima, S., Essink, D., and Broerse, J. E. W. (2021). Nutrition-sensitive agriculture: a systematic review of impact pathways to nutrition outcomes. Adv. Nutr. 12, 251–275. doi: 10.1093/advances/nmaa103
Sibhatu, K. T. (2019). Farm-level agricultural biodiversity is not the principal contributor to diverse and micronutrient-rich diets, nor to overall food consumption in smallholder farm households. J. Nutr. 149, 1482–1483. doi: 10.1093/jn/nxz077
Sibhatu, K. T., Arslan, A., and Zucchini, E. (2022). The effect of agricultural programs on dietary diversity and food security: insights from the smallholder productivity promotion program in Zambia. Food Policy. 113, 102268. doi: 10.1016/j.foodpol.2022.102268
Sibhatu, K. T., Krishna, V. V., and Qaim, M. (2015). Production diversity and dietary diversity in smallholder farm households. Proc. Natl. Acad. Sci. U. S. A. 112, 10657–10662. doi: 10.1073/pnas.1510982112
Sibhatu, K. T., and Qaim, M. (2018a). Farm production diversity and dietary quality: linkages and measurement issues. Food Security 10, 47–59. doi: 10.1007/s12571-017-0762-3
Sibhatu, K. T., and Qaim, M. (2018b). Review: meta-analysis of the association between production diversity, diets, and nutrition in smallholder farm households. Food Policy 77, 1–18. doi: 10.1016/j.foodpol.2018.04.013
Sitko, N. J., Chisanga, B., Tschirley, D., and Jayne, T. S. (2018). An evolution in the middle: examining the rise of multinational investment in smallholder grain trading in Zambia. Food Security 10, 473–488. doi: 10.1007/s12571-018-0767-6
Some, J. W., and Jones, A. D. (2018). The influence of crop production and socioeconomic factors on seasonal household dietary diversity in Burkina Faso. PLoS ONE 13, e0195685. doi: 10.1371/journal.pone.0195685
Vyas, S., and Kumaranayake, L. (2006). Constructing socio-economic status indices: how to use principal components analysis. Health Policy Plan. 21, 459–468. doi: 10.1093/heapol/czl029
WFP (2008). Food Consumption Analysis: Calculation and Use of the Food Consumption Score in Food Security Analysis. Rome, Italy: Vulnerability Analysis And Mapping.
Wilson, W. C., Slingerland, M., Baijukya, F. P., van Zanten, H., Oosting, S., and Giller, K. E. (2021). Integrating the soybean-maize-chicken value chains to attain nutritious diets in Tanzania. Food Security 13, 1595–1612. doi: 10.1007/s12571-021-01213-4
Wineman, A. (2016). Multidimensional household food security measurement in rural Zambia. Agrekon 55, 278–301. doi: 10.1080/03031853.2016.1211019
Zambia Statistics Agency, Ministry of Health (MOH) Zambia, and ICF. (2019). Zambia Demographic and Health Survey 2018. Lusaka, Zambia, and Rockville, MD, USA.: Zambia Statistics Agency, Ministry of Health (MOH) Zambia, and ICF.
ZAMSTATS (2020). Crop Forecast Survey. Zambia Data Portal: Zambia Statistics Agency. Available online at: https://zambia.opendataforafrica.org/search?query=crop%20forecastandsource=HomePage (accessed October 15, 2020).
Keywords: soy, dietary diversity, Zambia, food system, women, farm production diversity, wealth status, nutrition-sensitive agriculture
Citation: Kapulu N, Chomba C, Nkonde C, Holmes M, Manda S, Smith HE, Macdiarmid JI and Orfila C (2023) Dietary diversity of women from soybean and non-soybean farming households in rural Zambia. Front. Sustain. Food Syst. 7:1115801. doi: 10.3389/fsufs.2023.1115801
Received: 04 December 2022; Accepted: 27 March 2023;
Published: 12 April 2023.
Edited by:
Gloria Essilfie, University of Ghana, GhanaReviewed by:
Ebenezer Toyin Megbowon, University of Fort Hare, South AfricaCopyright © 2023 Kapulu, Chomba, Nkonde, Holmes, Manda, Smith, Macdiarmid and Orfila. This is an open-access article distributed under the terms of the Creative Commons Attribution License (CC BY). The use, distribution or reproduction in other forums is permitted, provided the original author(s) and the copyright owner(s) are credited and that the original publication in this journal is cited, in accordance with accepted academic practice. No use, distribution or reproduction is permitted which does not comply with these terms.
*Correspondence: Caroline Orfila, Yy5vcmZpbGFAbGVlZHMuYWMudWs=
Disclaimer: All claims expressed in this article are solely those of the authors and do not necessarily represent those of their affiliated organizations, or those of the publisher, the editors and the reviewers. Any product that may be evaluated in this article or claim that may be made by its manufacturer is not guaranteed or endorsed by the publisher.
Research integrity at Frontiers
Learn more about the work of our research integrity team to safeguard the quality of each article we publish.