 Clare Gray Betts
 Damien Hicks
 Mark Reader
 Paul Wilson
- 1UK Department for Environment, Food and Rural Affairs, London, United Kingdom
- 2Department of Land Economy, University of Cambridge, Cambridge, United Kingdom
- 3Division of Agricultural and Environmental Sciences, School of Biosciences, University of Nottingham, Nottingham, United Kingdom
Global environmental sustainability and food security are fundamental societal issues, and most crop production relies upon inputs from organic or inorganic nitrogen sources. Previous research in the Global North has demonstrated a typical over application of nitrogen across global agriculture with substantial negative impacts on the environment. The objective of this work was to draw on English Farm Business Survey (FBS) data of non-organic General Cropping and Cereal farms to explore the relationship between farm gate nitrogen balance, fertilizer application advice and farm business performance. A mixed effects generalized modeling approach was used to partition the variance into random (such as year, or farm ID) and fixed effects (those of interest). Whilst the financial performance of farm businesses is subject to high variance and multiple drivers, a negative relationship was detected between business performance and farm gate nitrogen balance, we demonstrate that nitrogen lost to the environment of >60 kg per hectare is associated with a significant negative impact on farm performance. Supplier-provided fertilizer advice was also associated with reduced farm performance. These results imply a positive effect on farm performance of enhancing on-farm understanding of crop nutrient requirements through the provision of accredited fertilizer advice. Within the stated bounds our model demonstrates good predictivity on randomly subsetted data, and is presented as a tool for use in scenario modeling of interventions such as agri-environment schemes, Natural Capital and Ecosystems Assessment, and the UN Sustainable Development Goals.
1. Introduction
1.1. Broad impacts of nitrogen balance
Global environmental sustainability and food security are fundamental societal issues (Lal, 2006) in the face of climate change and population growth predictions (UNFPA, 2021). Specifically, the UN Sustainable Development Goals 12, 13, and 15 (United Nations Department of Economic and Social Affairs, 2021) highlight the urgent need for action in these areas (Withers et al., 2014). The fundamental basis of crop production to support a growing population relies on crucial crop inputs, arguably one of the most important of which is nitrogen (N) supplied either from organic (crop residues, fixation, manures) or inorganic sources (manufactured fertilizer) (Ball, 2015). Nitrogen is a key ingredient of photosynthesis and the most important yield-limiting factor in agricultural systems (Lin et al., 2016) yet economically optimal crop fertilization (Falk Øgaard, 2014) may result in higher N application than is removed in grain, suggesting an economic distortion underlying N losses. This distortion is exacerbated by the relative inexpensiveness of N, in which externalities are not captured in its market price (Cherry et al., 2012), and the risk-averse nature of farmers who may over apply N to avoid yield production penalties (Edmeades, 2003).
1.2. Agricultural food production in the UK
Temperate agriculture is a major contributor to global food production (Gornall et al., 2010). Within northern Europe, cereals (wheat, barley) typically dominate arable rotations (Hawkesford, 2014), with high value tuber, root and bulbs forming additional crops of economic importance (Vasco Silva et al., 2021). The drive for enhanced environmental stability to sit alongside food production in UK farming has recently received renewed impetus following the publication of the UK Agriculture Act (2020) and the focus on support for agriculture through the provision of public goods, including climate change adaptation and reducing losses to the environment (Defra, 2018, 2021a).
Comprising 70% of UK land area (Defra, 2021a), the UK agriculture industry is a major determinant of its rural economies and landscapes, is pivotal in a range of ecosystems services (Firbank et al., 2007) and provides about 60% (by economic value) of its domestic food consumption (Defra, 2021c). Using long term research at Rothamsted, MacDonald et al. (2017) demonstrated that the application of fertilizers, herbicides and the use of modern high-yielding varieties can dramatically increase yields, although inputs such as fertilizer N which exceed crop requirements are not economically or environmentally sustainable. This was supported by Dicks et al. (2019)'s poll on farm management practices by agricultural experts, who scored the factors “Use fertilizer more efficiently” and “Benchmark environmental performance” in their top 20 interventions for sustainable intensification.
1.3. Mixed effects modeling
Factorial experimental designs are common in agricultural research, where data are derived from crops blocked under specific growth conditions, each associated with discrete inputs and generating discrete output values (e.g., the long term field experiments at Rothamsted, Johnston, 1994). However, factorial experiments are relatively expensive to undertake and are not suited to the analysis of understanding variation in results derived from more than one source of variation. By contrast, mixed-effect models are suited to such data comprising many sources of variation, some of which may be considered random. Below we establish the methodological approach utilized in this paper that seeks to control for repeated measures over four different years, and repeated farms within these years. This framework enables the incorporation of multiple sources of within-subject variation, which are challenging to represent in a standard regression model.
1.4. Research aims
Here we use a powerful, large and unique data set (the Farm Business Survey) to better understand the relationship between the application of N on Cereal and General Cropping farms and the financial performance of the farm business, as well as the impact that different sources of fertilizer application advice have on this relationship. Specifically, we answer the following questions:
• Does seeking independent advice about fertilizer application rates impact the amount of N lost to the environment?
• Does seeking independent advice about fertilizer application rates impact farm business performance?
• Is there a relationship between farms which lose more N to the environment and farm business performance?
2. Materials and methods
2.1. Farm business survey variables and metrics
The Farm Business Survey (FBS; Defra, 2021b) is an annual stratified survey of English farms run by the Department for Environment, Food and Rural Affairs. It collects detailed data on the physical, environmental and financial performance of farms, running on a harvest year basis. The Sustainable Intensification Platform (SIP; Defra the Welsh Government, 2018) was a multi-partner research programme comprising farmers, industry experts, academia, environmental organizations, policy-makers and associated stakeholders. As part of this research, metrics were developed to measure aspects of sustainable production from farm business data.
FBS data for the years 2015/16–2018/19 inclusive were analyzed together with the corresponding metrics from the Sustainable Intensification Platform. The final dataset comprises 428 Cereal and 173 General Cropping farms, with most farms replicated in multiple years. As the FBS is a stratified sample of farms in England it is representative of the English Cereal and General Cropping farm population. Detailed methods on how the data are collected can be found at https://www.gov.uk/government/collections/farm-business-survey.
The FBS provides detailed financial data on farm businesses annually, with detailed fertilizer usage questions introduced in 2015. The Sustainable Intensification Platform metrics were developed to measure (among other aspects) the volumes of N brought onto or taken off farms, and are available for the years 2015–2018. Additionally the FBS contains data on a range of farm management practices in relation to fertilizer application (e.g., source of fertilizer advice) that we incorporated into our analysis. The analyses herein draws on this range of data alongside the wider set of farm business and production data, in particular the physical crop production of each farm and the N contained within this production.
2.2. Derivation of nitrogen balance and performance ratio
The concept of N balance is well documented (Nevens et al., 2006; Bassanino et al., 2007; Treacy et al., 2008). Here we designate the N balance as the difference between N brought on to the farm (in the form of inorganic fertilizers) and taken off the farm (in the form of agricultural outputs e.g., crops), as a proportion of the total area farmed; our N balance thus represents a farm-gate N balance. The N balance data were subsetted to six discrete bands: “exports>imports”, “0–20 Kg/Ha”, “20–40 Kg/Ha”, “40–60 Kg/Ha”, “60–80 Kg/Ha”, “>80 Kg/Ha”.
The volume of N brought on to the farm was calculated from FBS input data on quantities of physical nutrient use. It was not possible to quantify N brought on to the farm in the form of organic fertilizers because the sources of organic nutrients were themselves extremely variable in composition (relative to more precise commercially available products). In addition, no robust coefficients on composition could be found. The volume of N taken off the farm was calculated from standard nutrient compositions (RoySocChem, RB209, and AHDB) along with agricultural product production data, to estimate nutrient offtakes in the form of agricultural products. Framed in this context, the difference between N brought onto and taken off a farm can be thought of as the amount of N lost to the environment through, for instance, leeching into watercourses. The N balance was then calculated with the following formula:
Where Non to farm is the volume of nitrogen brought onto the farm in kilograms, Noff farm is the volume of nitrogen taken off the farm in kilograms, and A is the area farmed in hectares.
In addition to understanding N balance we seek to determine the influence of farm management decisions on both N balance and farm business performance. The latter is represented as a ratio, calculated as:
Where an unpaid labor adjustment is estimated through conversations with the farm manager, and is valued at average local market rates for manual agricultural work. Farm business output is the total value of agricultural produce generated by the farm, for instance as crops such as wheat. Farm business costs are the total costs for the farm, both variable (such as fertilizers or pesticides) and fixed (such as labor or machinery repairs).
2.3. Stratification of farm classes
Within the FBS dataset, farms are classified into farm “types” on the basis of their Standard Outputs (SO). Standard Outputs measure the total value of output of any one agricultural enterprise per hectare. This is the main product (e.g., wheat, barley, peas) plus any by-product that is sold, for example straw. Each farm is assigned a total SO by aggregating the SOs for its agricultural enterprises. The farm is classified into a particular type of farming by evaluating the proportion of its total SO deriving from different enterprises, for instance a farm which generates two thirds or more of it's SO from cereal production would be classified as a Cereal farm. Although livestock enterprises were included in the calculation of total SO, only farms which were classified as non-organic, Cereal or General Cropping farm types were used in this analysis (i.e., farms which generated two thirds or more of their SO from Cereal or General Cropping enterprises, and were not organic). This is a standard approach taken to classifying farms with similar characteristics based on their type of output, and is used by countries across the UK and the EU when calculating national scale farm statistics. For more information see the technical notes on the FBS website.
Farms were classified into size bands, which are based on the amount of labor used, calculated by applying labor coefficients (known as Standard Labor Requirements, or SLRs) to individual enterprise types. The SLR of a farm represents the normal labor requirement, in Full Time Equivalents, for all the enterprises on a farm under typical conditions. The SLR was then used to classify farms into one of the following size bands; “Spare-time”, “Part-time”, “Small”, “Medium”, “Large”, and “Very large”.
Farms were assigned a tenancy status based on the proportion of their total farm area which is owned or rented: “Owner occupied”, “Mostly owner-occupied”, “Mostly tenanted” and “Tenanted”.
Financial debt was calculated as total net interest payments as a proportion of farm business income (FBI), this measure provides an indication of whether farms can afford to pay the interest on their debts. The following debt bands were used; “No interest”, “FBI negative”, “ <5%”, “5– <10%”, “10– <20%”, “20– <50%”, “50%+”.
The Government Office Region of each farm was used to inspect the broad effect of geography in the model; “North East”, “North West”, “Yorkshire & Humber”, “East Midlands”, “West Midlands”, “East of England”, “South East” and “South West”.
The distribution of agricultural area of each farm was significantly skewed so it was transformed to log10 (area) to achieve a normal distribution.
Some farms receive advice about fertilizer application rates, in order to better match their application rates to crop requirements. The Fertilizer Advisers Certification and Training Scheme (FACTS) provides training in an evidence-based approach to fertilizer applications. Farms were classified into one of five bands based on their self-declared main source of advice for fertilizer application; “Own (not FACTS) advice”, “Own (FACTS) advice”, “Independent FACTS advice”, “Supplier” and “none (N/A)”.
For more details and information about how FBS farms are classified see the FBS website.
2.4. Exploratory data analyses
Preliminary checks for data quality were performed using histograms and QQ plots. Farms with missing data and/or non-respondents were removed, which accounted for only a handful of datapoints. Distributions of all variables were examined to check for any strong deviation from normality and appropriate transformations applied, including log transformation of farm business performance ratio for the final model. A single outlier was detected in the latter and removed to optimize the model's generality to new datasets. The final working dataset consisted of 1,474 datapoints.
All statistical analyses were undertaken in R (version 4.0.3, R Core Team, 2020) and the non-spatial figures plotted in ggplot2 (Wickham, 2016). The final model was built using the lme function in the nlme (Pinheiro et al., 2021) package to fit linear mixed effects models. Mixed models are an extension of generalized linear models which allow estimation of both fixed and random effects, being of particular value when there is non-independence (i.e., a hierarchical structure) in the data. Such non-independence could have been tackled simply by aggregating to average values, which yields consistent coefficients and standard errors, but would reduce the sample size as well as not take full advantage of the information value of all the data.
A set of candidate variables were selected for the maximal model, which were informed from previous work investigating the relationship between farm characteristics and business performance (Betts, 2020; Jones C., 2020; Jones N., 2020).
A range of random effects structures were trialed and tested using the anova function, including a simple intercept effect and autocorrelation structures to account for temporal pseudo-replication. The final random effects model structure was selected by parsimony to minimize degrees of freedom and Akaike Information Criterion (AIC). Farm ID was fitted to have a random effect on the intercept of the model, and year to have a random effect on the slope.
2.5. Spatial distribution
The spatial distribution of N balance per area and farm business performance ratio was examined in a confidentiality-preserving way by linkage to UK Local Authority polygons (Office for National Statistics ONS, 2021), computing the mean-per-polygon in each case, then plotting in the tmap package (Tennekes, 2018). Hypothesis testing for spatial autocorrelation of these polygon values was performed with a Monte Carlo permutation test for Moran's I statistic, using the spdep package (Bivand and Wong, 2018). This is preferred to an analytical calculation of Moran's I as it makes no assumptions about the dataset, including the shape and layout of each polygon.
2.6. Model selection
Stepwise reverse model simplification was performed manually and informed by anova and AIC. Models were fitted using Maximum Likelihood during model simplification, and Restricted Maximum Likelihood to obtain final coefficient estimates from the final minimum adequate model.
The retained variables in the final model were farm type (factor with two levels), farm size (factor with six levels), tenancy type (factor with four levels), log10 farm area, debt (factor with seven levels), region (factor with eight levels), log10 (agri-environment scheme payments), fertilizer advice (factor with five levels) and N balance (factor with six levels). The fit was inspected using standard model diagnostic plots, and checked for multicollinearity using the car package (Fox and Weisberg, 2019) to ensure that Variance Inflation Factor values were <5.
A model validation step was performed by fitting the minimum adequate model to a randomly selected (80%) subset of the data, which was then used to predict the performance ratio for the remaining 20%, the predicted values and actual values were regressed against one another and R2 calculated.
3. Results
3.1. Bivariate analysis
Farm performance ratio is subject to high variance and multiple drivers, yet for every single year studied there is a negative relationship to N balance which is borderline or significant (Figure 1). The negative slope of every individual model suggests a general pattern that those farms which lose the most N to the environment tend to be poorer performers.
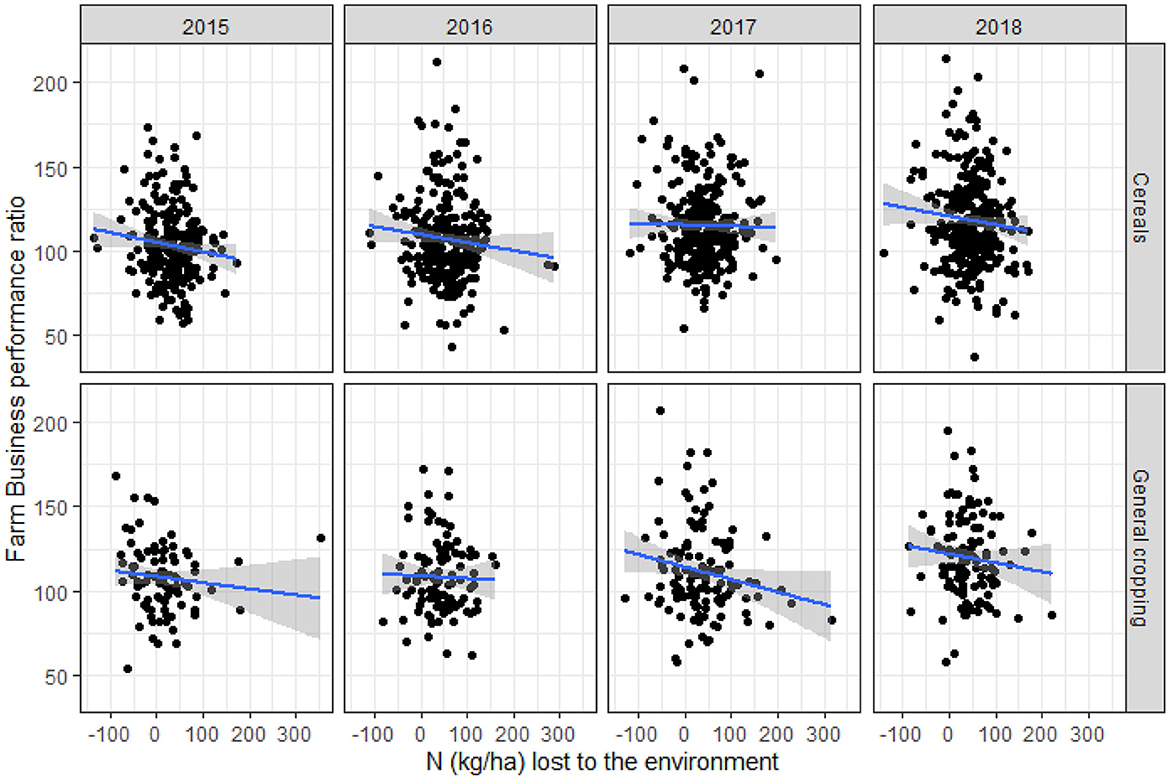
Figure 1. Farm business performance ratio by N balance, for each year of data included in the analysis. Each year of data has been fitted with a simple linear model, with performance as the response variable, and N balance as the sole predictor variable.
3.2. Spatial distribution
The data were plotted spatially at Local Authority (i.e., ‘NUTS4') level in order to explore any regional bias, whilst retaining the confidentiality of farms (Figure 2). The distribution of N balance and farm business performance ratio for Cereal and General Cropping farms shows little spatial clustering across the study area.
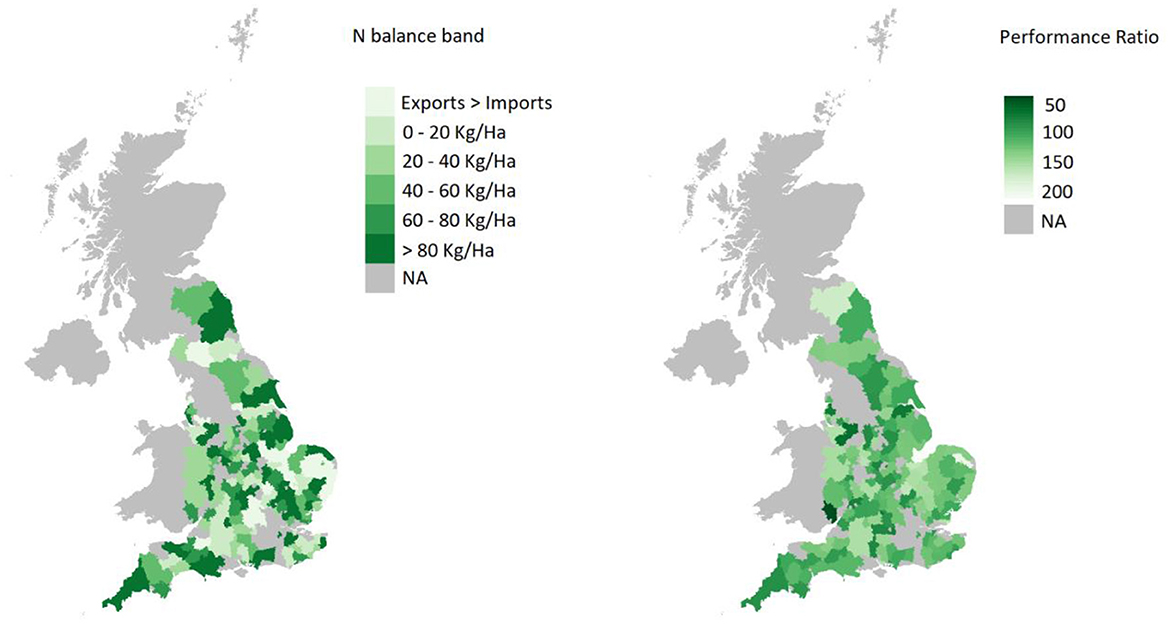
Figure 2. Local Authority (NUTS4) polygons of England, displaying modal values of N balance band (left panel) and mean values of farm business performance ratio (right panel) where FBS data are available.
Monte Carlo permuted Moran's I tests reported no significant spatial autocorrelation of N balance per area farmed (I = 0.10, p = 0.052) nor farm business performance ratio (I = −0.07, p = 0.87). Supplementary Figures 1, 2 show these I scores against the density distribution of Moran I values that we could expect if the variable is randomly distributed across the local authorities.
3.3. Fertilizer use advice
The volume of N lost to the environment was not found to be correlated to the source of fertilizer application advice (Figure 3) for these farm types. However, the relationship between source of fertilizer application advice and farm business performance differed between the two farm types (Figure 4). Whilst no relationship is evident for Cereal farms, General Cropping farms show a pattern, such that farms which used their own (FACTS qualified) advice tended to be better business performers.
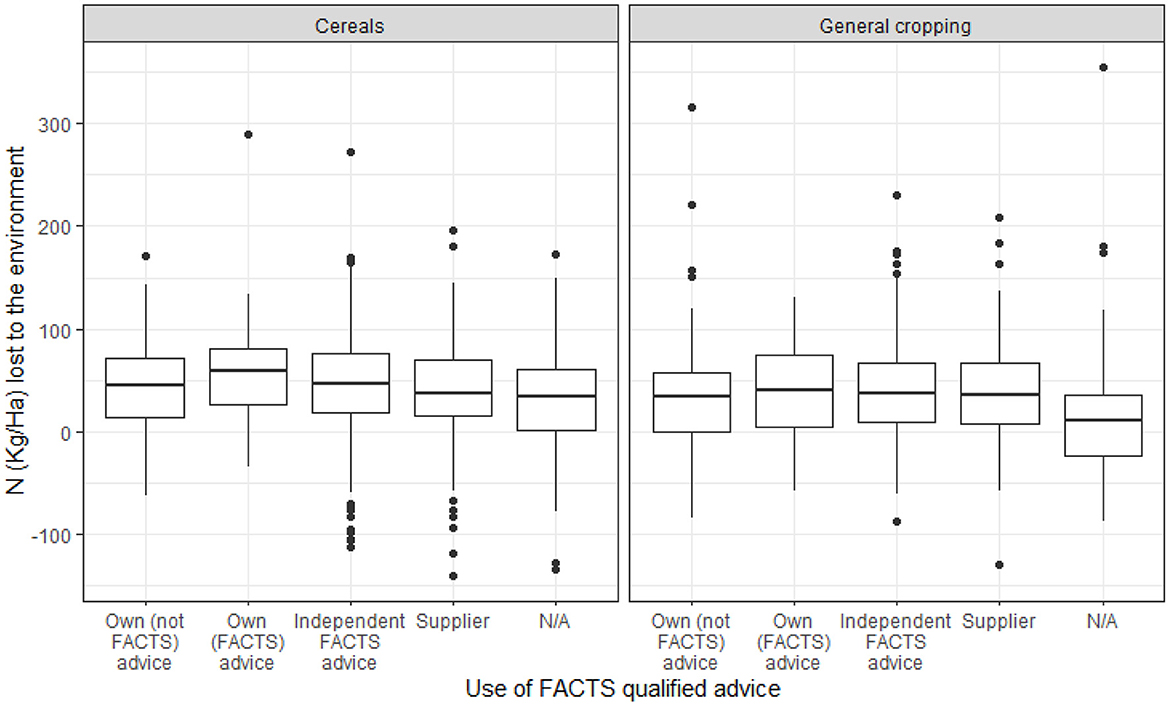
Figure 3. Box plots of N balance against the use of FACTS qualified advice, for Cereal and General Cropping farms. Scores of N/A are assigned for pre 2016 when FACTS data were not available.
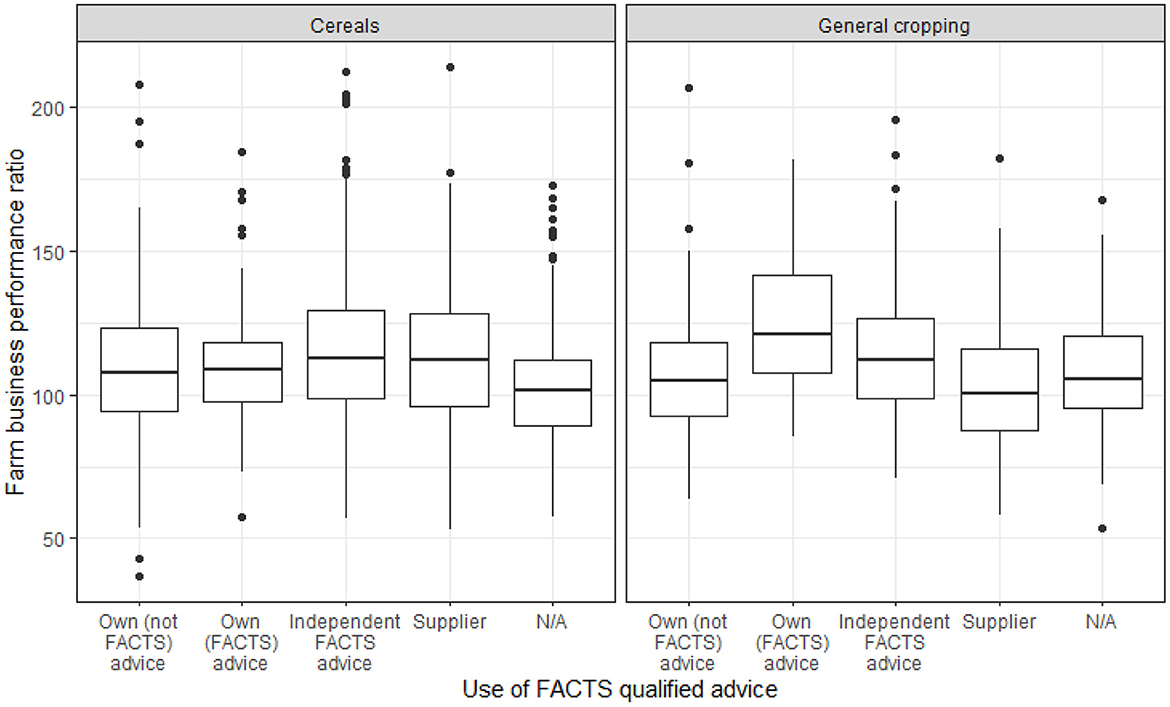
Figure 4. Box plots of farm business performance against the use of FACTS qualified advice, for cereals and General Cropping farms. Scores of N/A are assigned for pre 2016 when FACTS data were not available.
3.4. Coefficients of the final model
Interestingly the signs and magnitude of the coefficients remained little changed (Supplementary Table 1) through the model simplification process. The variables with the largest coefficient magnitudes (and therefore those that are most influential in the model) are those of area and financial debt.
Examination of the effects structure shows that 60% of variance in the random effects is accounted for by farm ID, reflecting the high degree of variability in farm businesses. Thirty two percent of the variation was explained by year, and the remaining 8% is residual (i.e., the variability that was unexplained by the predictors in the model—the fixed effects).
3.5. Marginal effects
In the final model, N balance was found to be significantly related to log farm business performance (Figures 5, 6, Supplementary Table 1), wherein farms which lost more N to the environment (>60 Kg/Ha) were significantly poorer farm business performers, and those farms having a positive N balance (i.e., exports > imports) were consistently higher business performers than all others.
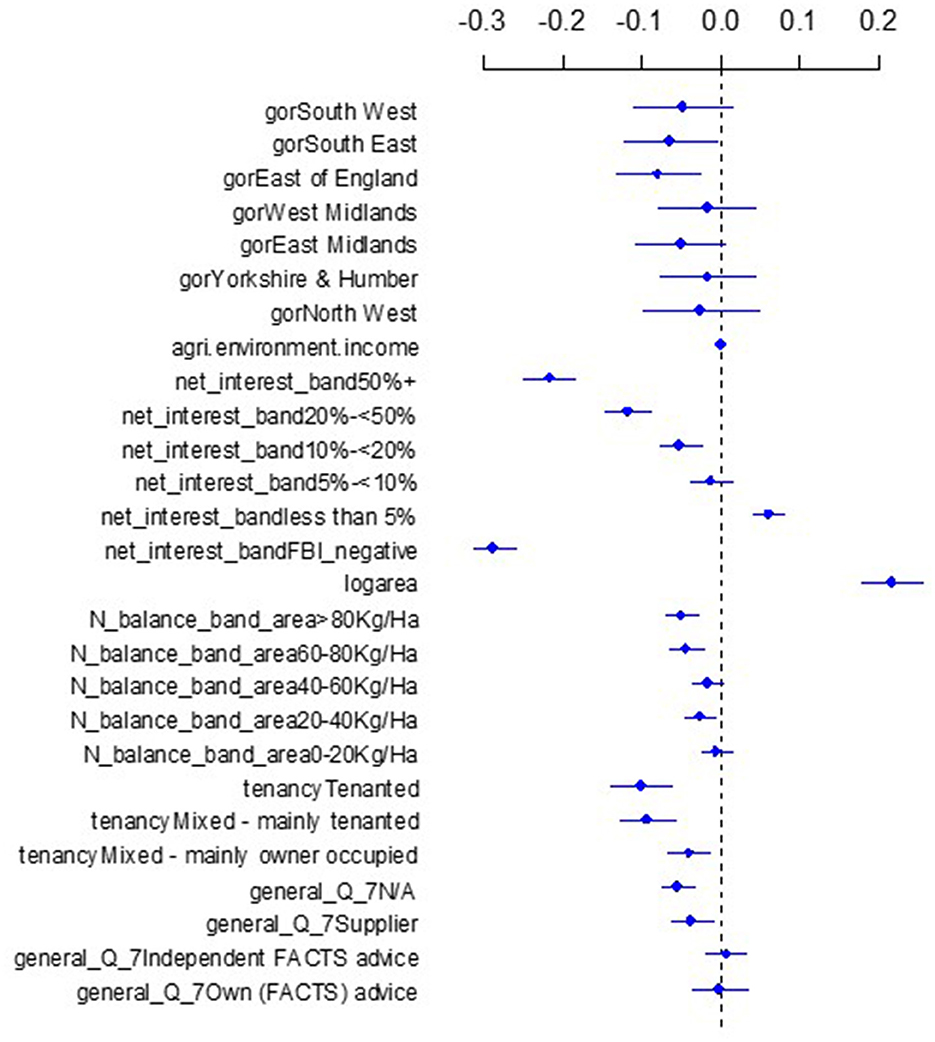
Figure 5. Terms, coefficients and 95% confidence intervals of the estimated values for the final model of log farm business performance ratio.
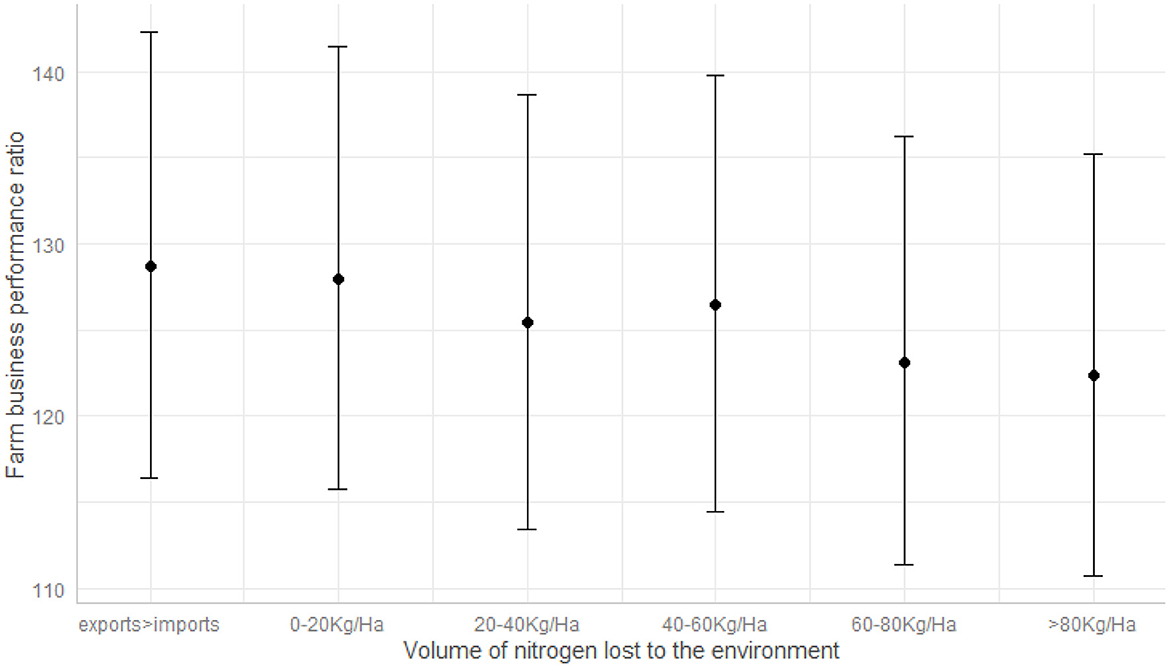
Figure 6. Mean and 95% confidence intervals of marginal predicted values of farm business performance ratio (back-transformed from log farm business performance ratio) generated from the final model, by N balance.
For model prediction purposes, note that the effects of individual model terms with all others held fixed are interpreted as e(modelcoefficient). So for example a switch from the N balance class “exports>imports” to “60–80 Kg/Ha” or “>80 Kg/Ha”, are significantly associated with a 4% (e−0.04 = 0.96) and 5% (e−0.05 = 0.95) reduction in farm business performance ratio.
In addition, fertilizer advice was significantly related to log farm business performance ratio (Figure 7, Supplementary Table 1), wherein farms which took advice from suppliers were significantly poorer business performers than those using independent FACTS, own FACTS, or own non-FACTS advice.
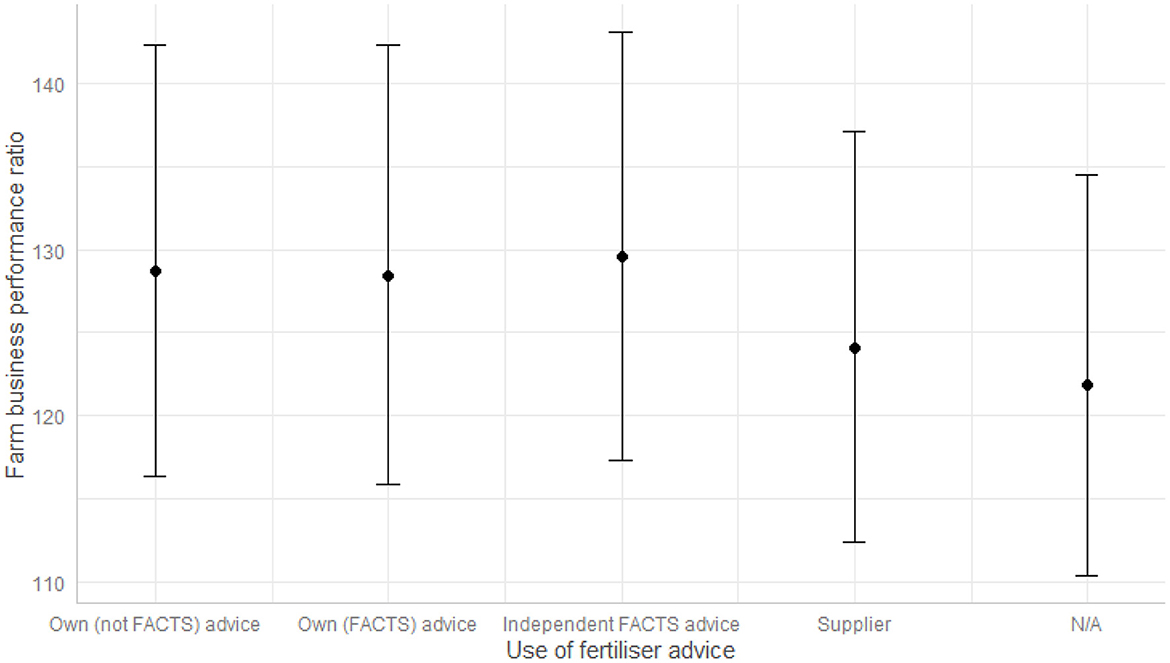
Figure 7. Mean and 95% confidence intervals of marginal predicted values of farm business performance ratio (back-transformed from log farm business performance ratio) generated from the final model, by fertilizer advice.
3.6. Validation
This model showed good predictivity on the bulk of randomly subsetted data (Figure 8), suggesting that its wider use in scenario-modeling of farm performance would be justified. Its correlation coefficient of 67% between predictions and actual data is of note given that the performance of the model is constrained by fitting it to only 80% of the available data.
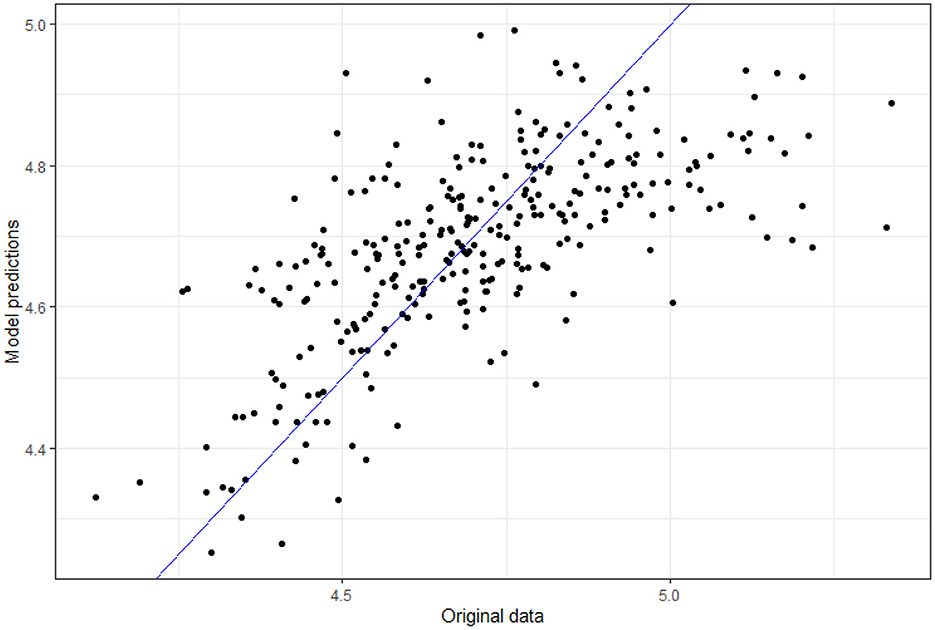
Figure 8. Validation of the final model: The same model specification was fit on a random 80% subset of the original data, that model being used to generate predictions for the remaining 20%, plotting those predictions against actual data. R2 = 0.67.
The model underpredicts log performance at the higher end, beyond values of around 5 (i.e., farm business performance of ~150). This suggests that there are a group of high-performing farms, which are insufficiently represented by the drivers which fit well those farms with a performance ratio under ~150. Indeed, if that group are omitted from Figure 8, the model displays a strong linear fit to the remainder.
4. Discussion
4.1. Nitrogen balance and business performance
In line with previous studies (e.g., Langeveld et al., 2007; Buckley and Carney, 2013) the results presented in Figure 1 demonstrate a negative relationship between over application of N and farm business performance. Specifically, farms which lost more N to the environment (>60 Kg/Ha) were significantly poorer farm business performers, while businesses with a positive N balance (i.e., exports > imports) were consistently higher performers.
As Local Authority means of neither N balance nor farm business performance were significantly auto correlated across England, we have not found evidence for spatial effects (e.g., contagion or repulsion) at work at this spatial level. In other words, the proximity of one Local Authority to another does not appear to be explanatory of the N balance nor business performance of its constituent farms. Thus for any policy aiming to target N balance or business performance, farmer take-up may also be anticipated to be dependent on other factors than farm proximities.
4.2. Fertilizer use advice
In contrast to previous studies (e.g., Williamson, 2011), we have found little relationship between the source of fertilizer advice and N lost to the environment, whereas other research has shown a positive relationship between farm efficiency (Buckley et al., 2016) or farm performance (Lillywhite and Rahn, 2005) and the use of independent advice (e.g., advice not linked to fertilizer sales).
For General Cropping farms however, our results suggest that the direct provision of fertilizer skills to farmers (via FACTS) is linked to farm business outcomes, in a similar way to previous studies that have shown the importance of independent advice (Sharpley et al., 2015). Our model results are in line with this previous research (Barnes et al., 2013), suggesting that farms which took advice from suppliers (advice linked to fertilizer sales) were significantly poorer business performers than those using independent FACTS, own FACTS, or own non-FACTS advice. This is the first work of which we are aware explicitly linking the detailed source of fertilizer advice to the financial performance of farm businesses rather than crop enterprise performance.
4.3. Changing policy landscape in the UK
Within the UK, and specifically within England, new agricultural policies will result in lower payment supports to farmers via the Basic Payment Scheme, and increased support for the delivery of public goods (UK Agriculture Act, 2020). This represents a fundamental change in the support structures for farming, that will reinforce the need for improved business and agricultural enterprise performance. Efficiency of resource use in food production will thus be of even greater importance to business survival. The current study uses a uniquely powerful dataset to demonstrate a link between environmental and business performance, wherein farms that have lower losses to the environment are associated with improved performance, in agreement with previous work (Wilson et al., 2001).
Whilst it is not possible to attribute causality between on-farm advice and actions with environment and business performance from our results, these findings are informative for policy recommendations. Specifically, in order to enhance business and environmental (i.e., lower losses to the environment) performance, supporting the delivery of FACTS or similar training to farmers alongside reducing barriers to the uptake of independent fertilizer advice represent clear and actionable policy recommendations.
In contrast to environmental policies that seek to reduce land devoted to food production in order to undertake environmental actions, enhancing farmer control of crop nutrient requirements will arguably aid in the delivery of both food security and environmental sustainability goals. We recognize that this recommendation cannot independently deliver food and environmental sustainability. However, the “win–win” outcome from this represents a tangible deliverable that could be supported with environmental land management schemes. This has the potential to be widely and positively received within the farming sector, provided that the method and means of communicating this outcome are clearly understood by farmers (Wilson et al., 2001).
4.4. Possible data generating mechanisms
The pattern is dominated by the variables of area and financial debt, and the rank order of coefficient values within factors (e.g., net interest band, N balance band, tenancy) is intuitive. The fact that location (at least at the level of Government Office Region) is apparently of significance in explaining farm business performance warrants further investigation and has ramifications for parity in post-Brexit agricultural policy.
That the model under predicts at the higher end (> ~150) of farm business performance is of interest. Clearly the variables of area, tenancy and debt are critical predisposers of farm business performance, but they do not seem to explain the full story in this dataset. The implication is of a predictor variable (or variables) that we did not include, and which does not appear to be available even in the vast and comprehensive Farm Business Survey. Assuming that this pattern at the upper end of the scale is not an artifact arising from the calculation of farm business performance, it seems likely that its key predictor(s) may be hard to detect or widely overlooked. This tallies with the fact that farm ID assumes the large majority role in our random effects structure, as well as the narrative of O'Leary (2017) on explanatory factors in the human side of farm management.
Whilst there can be a trade-off between model complexity and interpretability, we suggest that potential alternatives to our approach could include GLMM, Bayesian inference, LASSO regression, mixed-effects Random Forest, or mixed-effects Support Vector Machines.
4.5. Conclusions
Globally, the results presented herein demonstrate the potential for enhancing farm level understanding of matching crop needs to input supply, and the impact of over application of N on farm business performance.
Many countries of the Global South provide farmer extension services, albeit that the market price for N often leads to that advice being directed toward oversupply of nutrients (Ndambi et al., 2019). In the Global North, policy and business structures tend to rely on farm businesses procuring independent advice with an associated businesses cost. Our results imply that through investment in training and/or annual cost of independent fertilizer advice, there is a potential link to both environmental and business performance. Global environmental and food sustainability will not be delivered through a single mechanism or policy, but it is hoped that our findings represent an important aspect of the drive to provide more sustainable outcomes.
Within the stated bounds our model demonstrates good predictivity on randomly subsetted data, and as such is presented as a tool for use in current scenario modeling of interventions such as agri-environment schemes, Natural Capital and Ecosystems Assessment, and the UN Sustainable Development Goals.
Data availability statement
The data analyzed in this study is subject to the following licenses/restrictions: The data used herein is of a sensitive nature and confidential, and as such is not openly available. Anonymous, confidential FBS data are available to bona fide researchers and can be obtained via the Economic and Social Data Service, UK Data Archive, University of Essex. Requests to access these datasets should be directed to https://www.data-archive.ac.uk.
Author contributions
PW and MR oversaw data collection. CG and DH conducted the analysis. All authors contributed to formalizing the research questions and contributed to manuscript writing.
Funding
Funding for the Sustainable Intensification Platform research project from Defra and The Welsh Government is gratefully acknowledged.
Acknowledgments
Thanks to the FBS Co-operators who willing gave of their time to take part in this survey, and to the Research Officers (ROs) from Rural Business Research who undertook the interviews with FBS Co-operators. Finally, the authors wish to thank Ian Lonsdale, Jo Hutchinson, Alison Wray, and the Defra Farming Statistics team for their time and thoughtful discussion when reviewing this work, as well as the reviewers for their constructive comments.
Conflict of interest
The authors declare that the research was conducted in the absence of any commercial or financial relationships that could be construed as a potential conflict of interest.
Publisher's note
All claims expressed in this article are solely those of the authors and do not necessarily represent those of their affiliated organizations, or those of the publisher, the editors and the reviewers. Any product that may be evaluated in this article, or claim that may be made by its manufacturer, is not guaranteed or endorsed by the publisher.
Supplementary material
The Supplementary Material for this article can be found online at: https://www.frontiersin.org/articles/10.3389/fsufs.2023.1106196/full#supplementary-material
References
Barnes, A. P., Toma, L., Willock, J., and Hall, C. (2013). Comparing a “budge” to a “nudge”: Farmer responses to voluntary and compulsory compliance in a water quality management regime. J. Rural Stud., 32, 448–459. doi: 10.1016/j.jrurstud.2012.09.006
Bassanino, M., Grignani, C., Sacco, D., and Allisiardi, E. (2007). Nitrogen balances at the crop and farm-gate scale in livestock farms in Italy. Agric Ecosyst Environ 122, 282–294. doi: 10.1016/j.agee.2007.01.023
Betts, C. (2020). Characteristics of High Performing Grazing Livestock Farms in England. Defra. Available online at: https://www.gov.uk/government/publications/characteristics-of-high-performing-grazing-livestock-farms-in-england (accessed November 23, 2022).
Bivand, R., and Wong, D. W. S. (2018). Comparing implementations of global and local indicators of spatial association. Test 27, 716–748. doi: 10.1007/s11749-018-0599-x
Buckley, C., and Carney, P. (2013). The potential to reduce the risk of diffuse pollution from agriculture while improving economic performance at farm level. Environ. Sci. Policy 250, 118–126. doi: 10.1016/j.envsci.2012.10.002
Buckley, C., Wall, D. P., Moran, B., O'Neill, S., and Murphy, P. N. (2016). Farm gate level nitrogen balance and use efficiency changes post implementation of the EU Nitrates Directive. Nutr. Cycl. Agroecosyst. 104, 1–13. doi: 10.1007/s10705-015-9753-y
Cherry, K., Mooney, S. J., Ramsden, S., and Shepherd, M. (2012). Using field and farm nitrogen budgets to assess the effectiveness of actions mitigating N loss to water. Agric. Ecosyst. Environ., 1471, 82–88. doi: 10.1016/j.agee.2011.06.021
Defra (2018). Emissions of Air Pollutants in the UK, 1970 To 2016. Available online at: https://assets.publishing.service.gov.uk/government/uploads/system/uploads/attachment_data/file/681445/Emissions_of_air_pollutants_statistical_release_FINALv4.pdf (accessed November 23, 2022).
Defra (2021a). Agriculture in the UK. Available online at: https://www.gov.uk/government/collections/agriculture-in-the-united-kingdom (accessed November 23, 2022).
Defra (2021b). The Farm Business Survey. Available online at: https://www.gov.uk/government/collections/farm-business-survey (accessed November 23, 2022).
Defra (2021c). United Kingdom Food Security Report 2021: Theme 2: UK Food Supply Sources. Available online at: https://www.gov.uk/government/statistics/united-kingdom-food-security-report-2021/united-kingdom-food-security-report-2021-theme-2-uk-food-supply-sources (accessed November 23, 2022).
Defra the Welsh Government (2018). The Sustainable Intensification Platform. Available online at: https://www.siplatform.org.uk/ (accessed November 23, 2022).
Dicks, L. V., Rose, D. C., Ang, F., Aston, S., Birch, A. N., Boatman, N., et al. (2019). What agricultural practices are most likely to deliver “sustainable intensification” in the UK? Food Energy Secur. 8, e00148. doi: 10.1002/fes3.148
Edmeades, D. C. (2003). The long-term effects of manures and fertilizers on soil productivity and quality: a review. Nutr. Cycl. Agroecosyst. 662, 165–180. doi: 10.1023/A:1023999816690
Falk Øgaard, A. (2014). Nitrogen balance and nitrogen use efficiency in cereal production in Norway. Acta Agric. Scand. Sect. B Soil Plant Sci. 63, 146–155. doi: 10.1080/09064710.2013.843718
Firbank, L. G., Petit, S., Smart, S., Blain, A., and Fuller, R. J. (2007). Assessing the impacts of agricultural intensification on biodiversity: a British perspective. Philos. Trans. R. Soc. Lond. B Biol. Sci. 363, 777e.787. doi: 10.1098/rstb.2007.2183
Fox, J., and Weisberg, S. (2019). An R Companion to Applied Regression, Third edition. Thousand Oaks, CA: Sage.
Gornall, J., Betts, R., Burke, E., Clark, R., Camp, J., Willett, K., et al. (2010). Implications of climate change for agricultural productivity in the early twenty-first century. Phil. Trans. R. Soc. B. 365. 2973–2989. doi: 10.1098/rstb.2010.0158
Hawkesford, M. J. (2014). Reducing the reliance on nitrogen fertilizer for wheat production. J. Cereal Sci., 593, 276–283. doi: 10.1016/j.jcs.2013.12.001
Johnston, A. E. (1994). “The Rothamsted Classical Experiments,” in Johnston, A. E., and Leigh, R. A. (ed.) Long-Term Experiments in Agricultural and Ecological Sciences (Wallingford, Oxon CABI International, Wallingford, Oxon (CABI)).
Jones, C. (2020). Characteristics of High Performing Cereal Farms in England. Defra. Available online at: https://www.gov.uk/government/publications/characteristics-of-high-performing-cereal-farms-in-england
Jones, N. (2020). Characteristics of High Performing Dairy Farms in England. Defra. Available online at: https://www.gov.uk/government/publications/dairy-farms-economic-performance-and-links-with-environmental-performance (accessed November 23, 2022).
Lal, R. (2006). Managing soils for feeding a global population of 10 billion. J. Sci. Food Agric. 86, 2273–2284. doi: 10.1002/jsfa.2626
Langeveld, J. W., Verhagen, A., Neeteson, J. J., van Keulen, H., Conijn, J. G., Schils, R. L. M., et al. (2007). Evaluating farm performance using agri-environmental indicators: recent experiences for nitrogen management in The Netherlands. J. Environ. Manage. 823, 363–376. doi: 10.1016/j.jenvman.2005.11.021
Lillywhite, R., and Rahn, C. (2005). Nitrogen UK Vol. 44. Warwickshire. Available online at: http://www2.warwick.ac.uk/fac/sci/lifesci/wcc/research/nutrition/nmassbal/nitrogenuk.pdf (accessed November 23, 2022).
Lin, H-. C., Huber, J. A., Gerl, G., and Hülsbergen, K-. J. (2016). Nitrogen balances and nitrogen-use efficiency of different organic and conventional farming systems. Nutr. Cycl. Agroecosyst. 105, 1–23. doi: 10.1007/s10705-016-9770-5
MacDonald, A. J., Poulton, P. R., Glendining, M. F., Goulding, K. W. T., Perryman, S. A. M., Powlson, D. S., et al. (2017). Sustainable intensification—lessons from the rothamsted long-term experiments. Aspects Appl. Biol. 136, 239–244.
Ndambi, O. A., Pelster, D. E., and Owino, J. O. (2019). Manure management practices and policies in Sub-Saharan Africa: implications on manure quality as a fertilizer. Front. Sustain. Food Syst. 3, 1–14. doi: 10.3389/fsufs.2019.00029
Nevens, F., Verbruggen, I., Reheul, D., and Hofman, G. (2006). Farm gate nitrogen surpluses and nitrogen use efficiency of specialized dairy farms in Flanders: evolution and future goals. Agric. Syst. 88, 142–155. doi: 10.1016/j.agsy.2005.03.005
Office for National Statistics ONS. (2021). UK Local Authority district boundaries, ultra-generalised UK boundaries shapefile. (2020). Available onlilne at: https://geoportal.statistics.gov.uk/datasets/7f83b82ef6ce46d3a5635d371e8a3e7c_0?geometry=-69184.%2C46.017%2C64.322%2C63.434 (accessed November 23, 2022).
O'Leary, W. (2017). “Farmer attributes associated with farm profitability—a study of dairy farms in Great Britain,” in Thesis submitted in partial fulfilment of the requirements for the degree of Doctor of Philosophy in Agricultural Economics (London: University of Reading).
Pinheiro, J., Bates, D., DebRoy, S., Sarkar, D., and R Core Team. (2021). nlme: Linear and Nonlinear Mixed Effects Models. R package version 3, 1–152. Available online at: https://CRAN.R-project.org/package=nlme
R Core Team. (2020). R: A Language and Environment for Statistical Computing. Vienna, Austria: R Foundation for Statistical Computing.
Sharpley, A. N., Bergström, L., Aronsson, H., Bechmann, M., Bolster, C. H., Börling, K., et al. (2015). Future agriculture with minimized phosphorus losses to waters: research needs and direction. Ambio 44S2, 163–179. doi: 10.1007/s13280-014-0612-x
Tennekes, M. (2018). tmap: Thematic Maps in R. J. Stat. Softw. 846, 1–39. doi: 10.18637/jss.v084.i06
Treacy, M., Humphreys, J., McNamara, K., Browne, R., and Watson, C. J. (2008). Farm-gate nitrogen balances on intensive dairy farms in the south west of Ireland. Irish J Agric Food Resour. 47, 105–117.
UK Agriculture Act. (2020). Available online at: https://www.legislation.gov.uk/ukpga/2020/21/contents/enacted (accessed November 23, 2022).
UNFPA. (2021). United Nations Population Fund. Available online at: https://www.unfpa.org/data/world-population-dashboard
United Nations Department of Economic Social Affairs. (2021). Available online at: https://sdgs.un.org/goals
Vasco Silva, J., van Ittersum, M. K., ten Bergec, H. F. M., Spätjens, L., Tenreiro, T. R., Anten, N. P. R., et al. (2021). Agronomic analysis of nitrogen performance indicators in intensive arable cropping systems: an appraisal of big data from commercial farms. Field Crops Res. 269, 108176. doi: 10.1016/j.fcr.2021.108176
Wickham, H. (2016). ggplot2: Elegant Graphics for Data Analysis. New York: Springer-Verlag. doi: 10.1007/978-3-319-24277-4
Williamson, J. M. (2011). The role of information and prices in the nitrogen fertilizer management decision: new evidence from the agricultural resource management survey. J. Agric. Resource Econ. 363, 552–572.
Wilson, P., Hadley, D., and Asby, C. (2001). The influence of management characteristics on the technical efficiency of wheat farmers in eastern England. Agric. Econ. 243, 329–338. doi: 10.1111/j.1574-0862.2001.tb00034.x
Keywords: nitrogen balance, farm business performance, mixed effects models, nitrogen emissions, fertilizers
Citation: Gray Betts C, Hicks D, Reader M and Wilson P (2023) Nitrogen balance is a predictor of farm business performance in the English Farm Business Survey. Front. Sustain. Food Syst. 7:1106196. doi: 10.3389/fsufs.2023.1106196
Received: 23 November 2022; Accepted: 05 January 2023;
Published: 23 January 2023.
Edited by:
Andrews Opoku, Kwame Nkrumah University of Science and Technology, GhanaReviewed by:
Jacob Ulzen, University of Ghana, GhanaHenry Jordaan, University of the Free State, South Africa
Copyright © 2023 Gray Betts, Hicks, Reader and Wilson. This is an open-access article distributed under the terms of the Creative Commons Attribution License (CC BY). The use, distribution or reproduction in other forums is permitted, provided the original author(s) and the copyright owner(s) are credited and that the original publication in this journal is cited, in accordance with accepted academic practice. No use, distribution or reproduction is permitted which does not comply with these terms.
*Correspondence: Clare Gray Betts,  Y2xhcmUuYmV0dHNAZGVmcmEuZ292LnVr; Paul Wilson, cGF1bC53aWxzb25Abm90dGluZ2hhbS5hYy51aw==