 Deping Jiang1,2
 Xiang Ji
- 1School of Mechanics and Civil Engineering, China University of Mining and Technology, Xuzhou, China
- 2School of Economics and Management, Jiangsu Vocational Institute of Architectural Technology, Xuzhou, China
- 3Jiangsu Collaborative Innovation Center for Building Energy Saving and Construction Technology, Jiangsu Vocational Institute of Architectural Technology, Xuzhou, China
Coastal regions in China have the highest levels of economic development due to their prominent geographical locations and corresponding supporting policies. Global research concerns now include the spatiotemporal analysis of urban land use and landscape fragmentation in coastal plains. Research on coastal land use in China and related topics can provide a scientific basis for urban land use and sustainable development in other countries. In this study, a quantitative analysis of spatiotemporal changes in land use and landscape fragmentation was carried out based on land use data from Yancheng City, China. The dynamic degree of land use, Markov transition matrix and landscape indices were all subject to analysis. The results demonstrated that land use patterns in Yancheng City underwent substantial changes from 1990 to 2020. Cropland was found to be the dominant landscape in Yancheng City. Water rapidly increased whereas Grassland and Woodland dramatically decreased during the study period. Frequent transformations in and out of urban land were observed. In the late study period, the Tidal flat was gradually transformed into Grassland and Water. Variations in the landscape indices indicated significant changes in the landscape patterns. The landscape patterns in Yancheng City over a 30-year study period were found to be complicated. The special characteristics of Tidal flat land areas further intensified the landscape heterogeneity of the spatial range. Based on the above analyses, it was concluded that human activities (urban construction, beach reclamation, land development, and utilization activities) increased landscape fragmentation in Yancheng City throughout the three stages and gradually increased the degree of disturbance. These findings indicated that human intervention, the social economy and urban planning development could influence landscape fragmentation in coastal cities. This study used a spatially explicit approach to understand the relevant drivers of urban land-use change in a coastal plain. Moreover, it reduced the knowledge gap between land-use change and landscape fragmentation research from a temporal and spatial perspective.
1. Introduction
Changes in land usage are an important consequence of human activities on earth (Lambin et al., 2001). The rapid development of cities and population growth could trigger dramatic changes in land use patterns in coastal cities (Zhang et al., 2020) and directly lead to the intensification of landscape fragmentation to different degrees within these regions. Due to their unique geological locations, coastal regions have become crucial areas for national construction activities in China (Ju et al., 2021). Rapid urbanization, population growth, and changes in land use could have a substantial impact on the coastal regional environment (Deng et al., 2009). Changes in land use and coverage are gradually getting more pronounced over time. In particular (Yu et al., 2013), land use changes in coastal cities have become a key driver for urban economic growth (Wu et al., 2019). In coastal regions, land resources not only provide economic leverage, but also act as a factor of production (Liu et al., 2018). Due to urban growth, fundamental changes have occurred in the original land use structure (Khadour et al., 2021). As a result, resource and environmental problems in coastal cities have gradually emerged (He et al., 2007; Sun et al., 2011). National and local governments have different land use objectives. The Chinese government has adopted several countermeasures for land use change (Zhang, 2000). In coastal regions of eastern China, land use changes may alter the landscape pattern to different extents while resulting in changes in the ecological environment of these regions. Moreover, land use changes may influence economic and social development. Maintaining the continuity of ecosystems has become a core goal of spatial planning policies. The current landscape fragmentation in cities is largely due to excessive changes in land use as a result of human activities. Urban development must consider the original land types and should avoid landscape fragmentation (Chen, 2021). However, there are limited quantitative analyses on the changes in Cropland and Tidal flats (Zhang et al., 2019). Changes in the traditional landscape structure and morphology of coastal cities are inevitable. With rapid urbanization and the resulting expansion of coastal cities, more complex challenges will come up. Therefore, there is a need for a comprehensive understanding of land use and landscape fragmentation in these regions (Shi et al., 2015).
Land use changes are primarily driven by urban expansion and the resulting transformation of the corresponding land to other land use types (Huang et al., 2016). To analyse land use changes, remote sensing images can provide consistent spatiotemporal monitoring information (Kantakumar et al., 2016). Landscape patterns are the core structures of landscape ecology and represent different landscape types, quantities, areas, and spatial layouts (Wu, 2000). The amount of literature on the landscape evolution process based on various theoretical methods is increasing day by day. However, the existing studies have mainly performed either quantitative or qualitative analyses on landscape patterns. Furthermore, the unique geographic characteristics of coastal cities have a significant influence on landscape fragmentation. The development process, land use changes and resource management in coastal cities have considerable economic and social significance (Bagheri et al., 2021). The evolution of the landscape pattern is closely related to ecological processes. Microscopically, this can influence the living environment of human beings and macroscopically, it can determine regional economic development. Therefore, analyzing landscape fragmentation and its influencing factors is critical to the study of land use/coverage changes (Sui, 1998). Understanding spatiotemporal changes in landscape patterns are vital for land use planning and the sustainable economic development of regions (Li et al., 2021). To date, only a few studies have focused on land use and landscape fragmentation in coastal cities. Therefore, this case study based on the coastal regions of Yancheng City was performed to examine the development of land use functions and the spatial characteristics of land use patterns. This study has included the calculation of the dynamic change value of land use based on land use classification data, the calculation of the corresponding landscape difference value, and the application of pattern analysis to reflect regional landscape characteristics. In addition, this study has a novel approach while utilizing the moving window method to analyse the landscape fragmentation and spatial distribution characteristics of the Yancheng coastal city at the county scale. Yancheng Tidal flat Wetland, located on the west coast of the Pacific Ocean, is the largest tidal flat wetland in China. It is home to a large number of living species, which ensures the migration of millions of waterfowl and endangered species such as red-crowned cranes throughout the winter. Blind land use development will not only increase the risk of landscape fragmentation but also destroy ecological balance and affect regional economic development.
2. Study area
Coastal areas in China are mainly located in East China, starting from the Yalu River to the Belun Estuary in the north (18.2–40.5°N) (Wang et al., 2020). Yancheng City is located at 32°34′ to 34°28′N, 119°27′ to 120°54′E. It is next to the Yellow Sea in the east and is located in the middle-east of Jiangsu Province. The local terrain is high in the northwest and southeast, but low in the center and northeast. Yancheng City administers Dongtai City, Yandu District, Tinghu District, Dafeng District, Jianhu County, Sheyang County, Funing County, Binhai County and Xiangshui County. As of November 2020, the registered population of Yancheng City was 8.14 million. Yancheng City is situated in the transition area between the northern subtropical climate and the warm temperate climate. The climate can be divided by the Subei General Irrigation Canal, where the southern regions have a subtropical climate and the northern regions have a warm temperate climate. As a result, it exhibits transitional characteristics. The total land area in Yancheng City is 15,800 km2, including 361 km2 of the coastal beach area. The total coastal length is 582 km, which accounts for 56% of the total coastal length of Jiangsu Province. As the only city in China that does not have any mountains, the elevation of most regions in Yancheng City is < 5 m and the maximum relative height is < 8 m. Comprehensive analysis shows that the land use types of Yancheng are relatively concentrated and not overly complex. The region is dominated by cultivated land and tidal flat land. There are certain differences in the spatial distributions of various land types. Changes in regional land use and landscape fragmentation are within the scope. According to historical records, the Yellow River has entered into the sea through Yancheng City for over 700 years and has caused a considerable accumulation of sediment in coastal regions after its convergence with the Yangtze River. This has resulted in a vast coastal plain (Figure 1). Yancheng City is constructing “two vertical and two horizontal” main ecological corridors: the north-south coastal wetland ecological conservation corridor, the north-south Tongyu River water source protection ecological corridor, the east-west north Jiangsu irrigation canal landscape ecological corridor, and the east-west ecological corridor of Yanggang-Dalong Lake, which is the ecological corridor connecting sea and land. In addition, several branch corridors are also under construction.

Figure 1. Location of the study area.
The Overall Plan of Land Use in Yancheng City (2006–2020) describes the further reclamation of coastal tidal wetlands, the guarantee of various land uses based on reasonable development and the complete remote supplementation of Cropland throughout the province. In 2009, the State Council Meeting approved the Coastal Regional Development Plan in Jiangsu Province. This promoted coastal regional development in Jiangsu Province to become a national strategy while resulting in the official implementation of the regional development plan. Thus, the development of coastal tidal resources is anticipated to increase further. Reasonable utilization of tidal flat resources in sea areas could become a key strategy in coastal development. The results of this study indicated that Yancheng City accelerated the development of Tidal flat areas from 2010 to 2020. Large areas of Tidal Flat were transformed into Grassland and Water with some becoming Cropland and Urban land. To improve the ecological environment in coastal wetlands, Yancheng City has input a lot of capital into the reconstruction of various landscapes, strengthening land administration, providing strict protection of important ecological functional protection zones, and promoting sustainable utilization of land resources.
3. Methodology
The fundamental geographic data for this study were derived from the zoning plan, land use map and statistical yearbook of Yancheng City. TM images were mainly based on Landsat satellite data (USA). TM is an acronym for Thematic mapper, meaning “Thematic plotter.” It is a type of imager that is carried by the American LANDSAT satellite and has a high spatial resolution, spectral resolution, extremely rich information and positioning accuracy. Four Landsat TM/ETM+ images in 1990, 2000, 2010, and 2020 were chosen with a time span of 10 years. With absolute calibration on the star, the enhanced thematic mapper known as ETM+ (Enhanced Thematic Mapper) has improved the resolution and positioning quality of earth observation, adjusted the accuracy, range and sensitivity of radiation measurement, and reduced the high brightness saturation effect caused by strong reflectors. To ensure the objectivity of the data, a total 30 years study period was chosen for comparative analysis.
3.1. Land use analysis
Scientific analysis of land use changes can reveal the influence of human activities on the natural environment (Bock et al., 2018). The land use dynamics may exhibit exponential growth with changes in the population density of a region (Fei, 2015). To study the rate of variation and land use pattern development, three indices, i.e., the dynamic degree of land use (DD), spatial dynamic degree of land use (SDD) and change status of land use (CS) were chosen. The DD is an index that reflects land use changes and is used to quantitatively analyse the variation rate of a land use pattern in a study area. The SDD characterizes the degree of spatial variation of a land use pattern and CS characterizes the variation trend and state of a land use pattern. These three indices can be expressed as follows:
where Ua and Ub are the areas of a land use pattern in the early and late stages of the study period; T is the study period; Uin is the sum of areas transformed from other land use patterns into the chosen land use pattern in the study period T; Uout is the sum of the areas transformed from a land use pattern into other land use types in the study period T.
3.2. Markov transition matrix
A Markov transition matrix can be used to analyse land transformation in and out within a corresponding time series (Nouri et al., 2014). The transition matrix of land use patterns can be used to quantitatively analyse mutual transformation among different land use types and reveal the mutual transformation proportions and rates. In the present study, land use/coverage changes were mainly brought on by rapid urban economic development. To reveal the variation in land use patterns within a spatiotemporal range in the study area, a Markov transition matrix was applied. The Markov transition matrix was used to analyse the variation trend of land use and determine the landscape pattern changes in Yancheng City. This transition matrix can be expressed as follows:
where S represents the area; n is the number of land use patterns; i, j (i, j = 1, 2, …, n) denotes the land use patterns before and after the transition; and Sij is the area of the land use type i transformed into the land use type j before the transition.
3.3. Selection of landscape indices
Landscape pattern indices can be used to describe the spatial distribution and arrangement of landscape patches. There are mutual relations among the various landscape indices (Chi et al., 2018). To reflect the variation characteristics and landscape fragmentation trends in this study, a total of 11 landscape indices at the class and land levels were selected. At the class level, the number of patches (NP) of a particular patch type is a simple measure of the extent of subdivision or fragmentation. Patch density (PD) expresses patch number on a unit area basis, which facilitates comparison between landscapes of different sizes. The Largest patch index (LPI) quantifies the percentage of the total landscape area comprised by the largest patch. Landscape Shape Index (LSI) provides a standardized measure of total edge or edge density that adjusts for the size of the landscape. Patch Cohesion Index (COHESION) measures the physical connectedness of the corresponding patch type. The percolation threshold was chosen as the patch cohesion was sensitive to the aggregation of the focal class. At the land level, edge density (ED) has the same utility and limitations as Total Edge, except that edge density reports edge length on a per unit area basis that facilitates comparison among landscapes of varying sizes. Contagion Index (CONTAG) is inversely related to edge density. When edge density is very low, for example, when a single class occupies a very large percentage of the landscape, then contagion will be high and vice versa. Aggregation Index (AI) is calculated from an adjacency matrix at the class level. At the landscape level, the index is computed simply as an area-weighted mean class aggregation index, where each class is weighted by its proportional area in the landscape. Interspersion and Juxtaposition Index (IJI) is based on patch adjacencies rather than cell adjacencies like the contagion index. Shannon Diversity Index (SHDI) is a popular measure of diversity in community ecology, which has been applied here to landscapes. Shannon's index is somewhat more sensitive to rare patch types than Simpson's diversity index. Simpson's Evenness Index (SHEI) is expressed in a way that an even distribution of area among patch types results in maximum evenness.
The landscape indices for Yancheng City in 1990, 2000, 2010, and 2020 were calculated using Fragstats 4.2 and were used to examine spatial changes in land use intensity in Yancheng. Quantitative description and monitoring of dynamic changes in landscape structural characteristics as a function of time and degree of landscape fragmentation were carried out.
3.4. Moving window method
Different landscapes have different pattern characteristics and their responses to scale changes are also different. For the moving window approach, raster data were utilized and a window of target size was moved over the study area in an orderly manner. The value of the landscape index was calculated within each window and its value was assigned to the center grid of that window. This approach resulted in a new raster data graph that could be implemented in Arc GIS to visualize the spatial distribution of the landscape index at the regional scale. This approach enabled a clear presentation of the landscape pattern information and better connected the landscape ecological processes of the natural and social landscapes in the study area to the economic conditions. Measurement of the environment in adjacent regions was performed using the moving window method through grid comparison (Meng et al., 2020). Specifically, the Fragstats 4.2 moving window method was used to analyse land use data at each of the four stages. Given the scale of the study area, the radii of moving windows were compared. Data analysis was carried out using 500, 1,000, 1,500, 2,000, 2,500, 3,000, and 4,000 m windows. Based on this analysis, a radius of 2,000 m was selected for examination of the landscape pattern spatial distribution in the study area. This radius not only maintained the scale characteristics but also enabled the examination of changes in the spatial pattern of counties and districts in the study area.
4. Results
4.1. Spatiotemporal change analysis of landscapes in Yancheng City
4.1.1. Land use changes and classification
Land use areas and changes were studied and the relationship between the evolution of various landscape types and landscape fragmentation was analyzed. As shown in Figure 8. Land use classification of Yancheng City in 1990, 2000, 2010, and 2020.and Table 1, Cropland still occupied the largest area in all three stages, which was consistent with the landform and functional characteristics of a plain city. It presented in Table 1, areas of Cropland, Water, Urban land, and Tidal flat increased continuously from 1990 to 2000 while areas of Grassland decreased annually and the area of Woodland exhibited little change. During 2000–2010, areas of Water and Urban land continued to increase while areas of Cropland, Woodland, Grassland, and Tidal flat decreased annually. From 2010 to 2020, areas of Water and Woodland continuously increased while areas of Cropland, Grassland, Urban land, and Tidal flat decreased annually. Throughout the period, Cropland made up roughly 75% of the total land area followed by Urban land, Water, Tidal flat, Grassland, and Woodland. The proportion of Water increased significantly from 2.26 to 9.35%, indicating that the national policy of returning farmland to lakes has been effective. The proportion of Grassland decreased from 6.46 to 2.86% and the proportion of Tidal flat decreased from 4.05 to 2.29%. The variation in the proportions of other land use patterns was relatively constant.
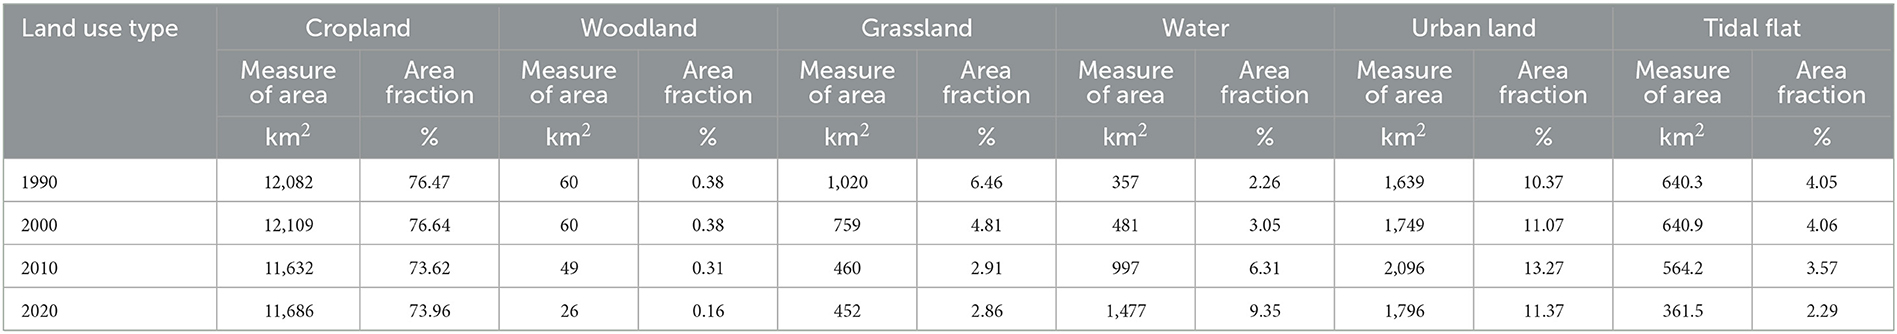
Table 1. The quantitative changes of land use types during three periods from 1990 to 2020 in the city of Yancheng.
4.1.2. Land ues analysis
As shown in Figure 2, the absolute DD values of Woodland, Grassland, Water, and Tidal flat in the study area were relatively high, reflecting substantial variation in land use patterns. Other land use patterns such as Cropland and Urban land were relatively stable. Areas of Woodland, Grassland, and Tidal flat decreased at each stage. The negative growth in Woodland reached a maximum (4.74%) from 2010 to 2020. The area of the Tidal flat decreased over time, indicating that large-scale transformation of land use patterns occurred during the study period due to human activities and the acceleration of the urbanization process. The area of Water continued to increase across all periods and its DD increased significantly from 2000 to 2010 while reaching 10.72%. In other words, the area of Water increased from 2000 to 2010 and the growth rate accelerated. In terms of spatial variation, the SDD values of Woodland and Grassland in Yancheng from 1990 to 2020 were relatively high, indicating a larger spatial transfer area and frequent spatial transfer. The SDD values of Cropland, Water, Urban land, and Tidal flat were relatively low, indicating a small spatial transfer frequency among these land use types. The SDD values of the six land use patterns underwent a more pronounced change between 2000 to 2010 than those in the other stages. From 2010 to 2020, the SDD of Grassland reached a maximum (10.4%), indicating that Grassland frequently transferred to other land use patterns during this time. Therefore, the spatial variation frequency was highest. The CS values in the three stages were also comprehensively analyzed. The CS values of Urban land and Tidal flat first decreased and then increased, reaching a peak from 2010 to 2020. However, the CS of Water and Cropland did not significantly change. This indicated that there was a gradual increase in the artificial transformation of land use patterns.
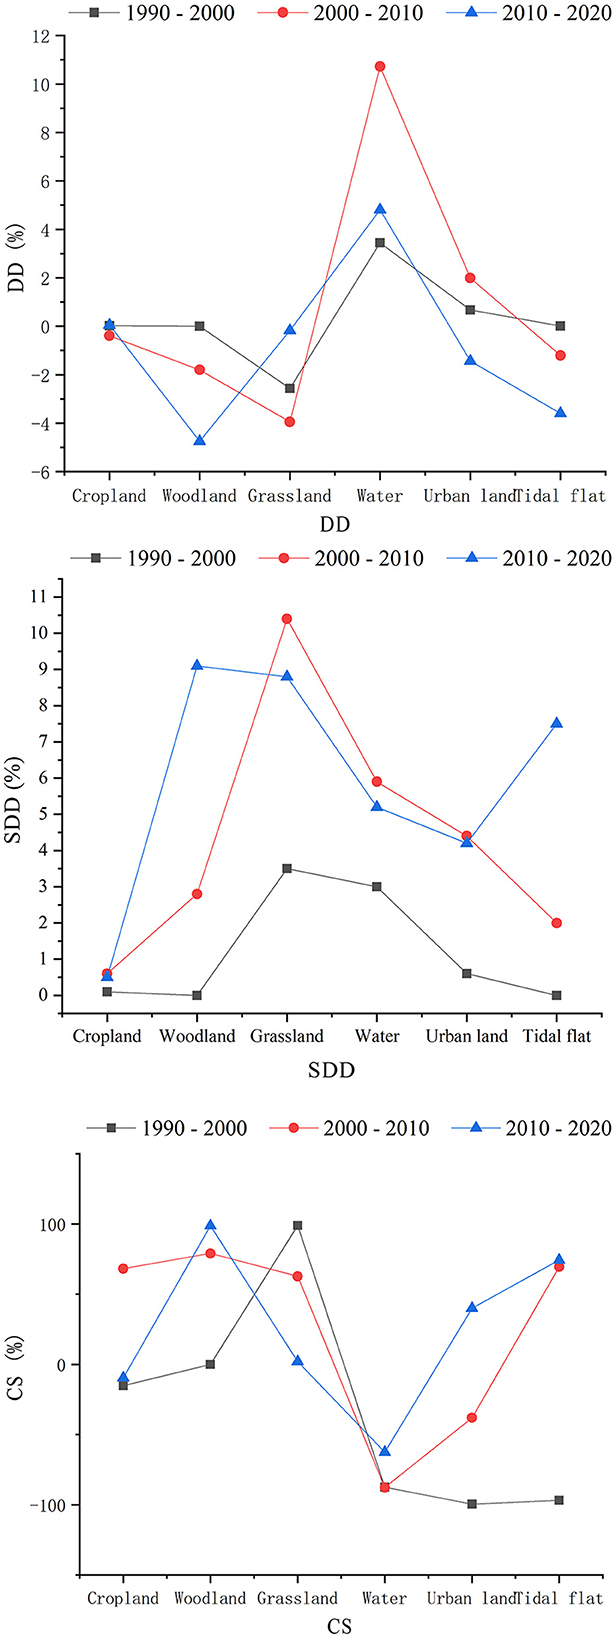
Figure 2. The dynamic analysis of land use types during three periods from 1990 to 2020 in the city of Yancheng.
4.1.3. Analysis of land use transfer
A transfer table of land use patterns in the study area from 1990 to 2020 was obtained using Arc GIS10.2 (Table 2). The land use maps of Yancheng City from 1990 to 2020 were overlapped spatially and the transfer matrix of land use patterns was calculated. The transformation directions of numerous land use patterns were compared. Over the past 30 years. There are great differences in the transfer and change of different types in Yancheng City. Among them, the area of Cropland decreased by nearly 400 km2 and a relatively large area transferred to Urban land. Moreover, the total area of Woodland decreased and the area of Water expanded the most. The proportion of Urban land that was transferred was relatively high. The area of Tidal flats was further reduced. A combination of various factors led to an increase in the fragmentation of regional landscapes. A large number of buildings were originally built along the Tidal flats. With the extensive development of Tidal flats and the transfer to Water and Grasslands, the Urban land area decreased by 300 km2 from 2010 to 2020. Rapid urbanization has not significantly increased the area of Urban land, which was mainly due to the violent internal transformation. From 2003, the area of Urban land first increased and then decreased while Cropland and Woodland's areas were lost, resulting in sharp changes to Cropland and Grassland areas.
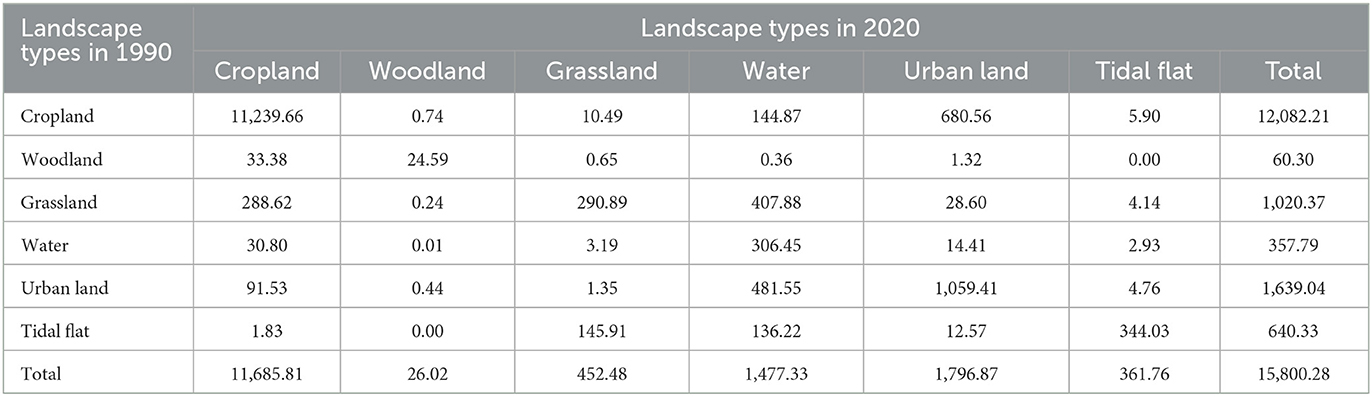
Table 2. The transition of landscape types from 1990 to 2020 in the city of Yancheng (km2).
4.2. Landscape fragmentation analysis in Yancheng City
4.2.1. Landscape fragmentation analysis at the class level
Landscape fragmentation refers to the process of landscape from simple to complex due to the interference of natural or human factors, that is, the landscape from a single, homogeneous and continuous whole to a complex, heterogeneous and discontinuous patch Mosaic. To some extent, the NP reflects landscape heterogeneity and is positively correlated with landscape fragmentation. As shown in Figure 3, the NP of Urban land was the highest among all study stages. Compared to other land use patterns, Urban land had the highest degree of fragmentation followed by Water. However, the NP of other land use types exhibited little change. Cropland occupied the largest area, but its NP was not the highest, indicating that the patch size was relatively large. Moreover, there were abundant dominant patches, which was consistent with the actual situation in the study area. From 1990 to 2020, the NP and PD of Cropland gradually increased, indicating a steady increase in Cropland's landscape fragmentation. The continuous reduction in LPI and continuous increase in LSI indicated that the degree of dominance of Cropland was significantly impacted by human activities. The NP, PD and LSI of Woodland increased from 1990 to 2010 but decreased from 2010 to 2020. In other words, the landscape fragmentation of Woodland exhibited an inverted V-shaped trend. The LPI of Cropland exhibited little change, indicating that its landscape dominance remained fairly constant. Over the 30-year study period, the NP and PD values of Water increased continuously. The PD reached a peak value in 2010 while LPI kept on increasing. The LSI decreased gradually and reached a low value in 2010. This indicated that the connection structure of the water landscape was better and its landscape dominance gradually increased. The characteristics revealed irregular changes in direction. The NP value of Grassland increased continuously while the LPI value decreased continuously. Although other landscape indices exhibited only slight changes, landscape fragmentation appeared to intensify. From 1990 to 2020, the NP and LPI values of Urban land exhibited inverted V-shaped variation trends and LSI exhibited a V-shaped variation trend. In contrast, only COHESION exhibited slight changes. In summary, the rapid urbanization process during the early study period had an influence on Urban land in Yancheng City while urban construction planning was rational during the late study period. It resulted in a different development mode to the initial urbanization stage. Moreover, the connectivity and bonding degree of Urban land was significantly increased due to the rapid economic development. From 1990 to 2020, the landscape indices of the Tidal flat did not fluctuate significantly.
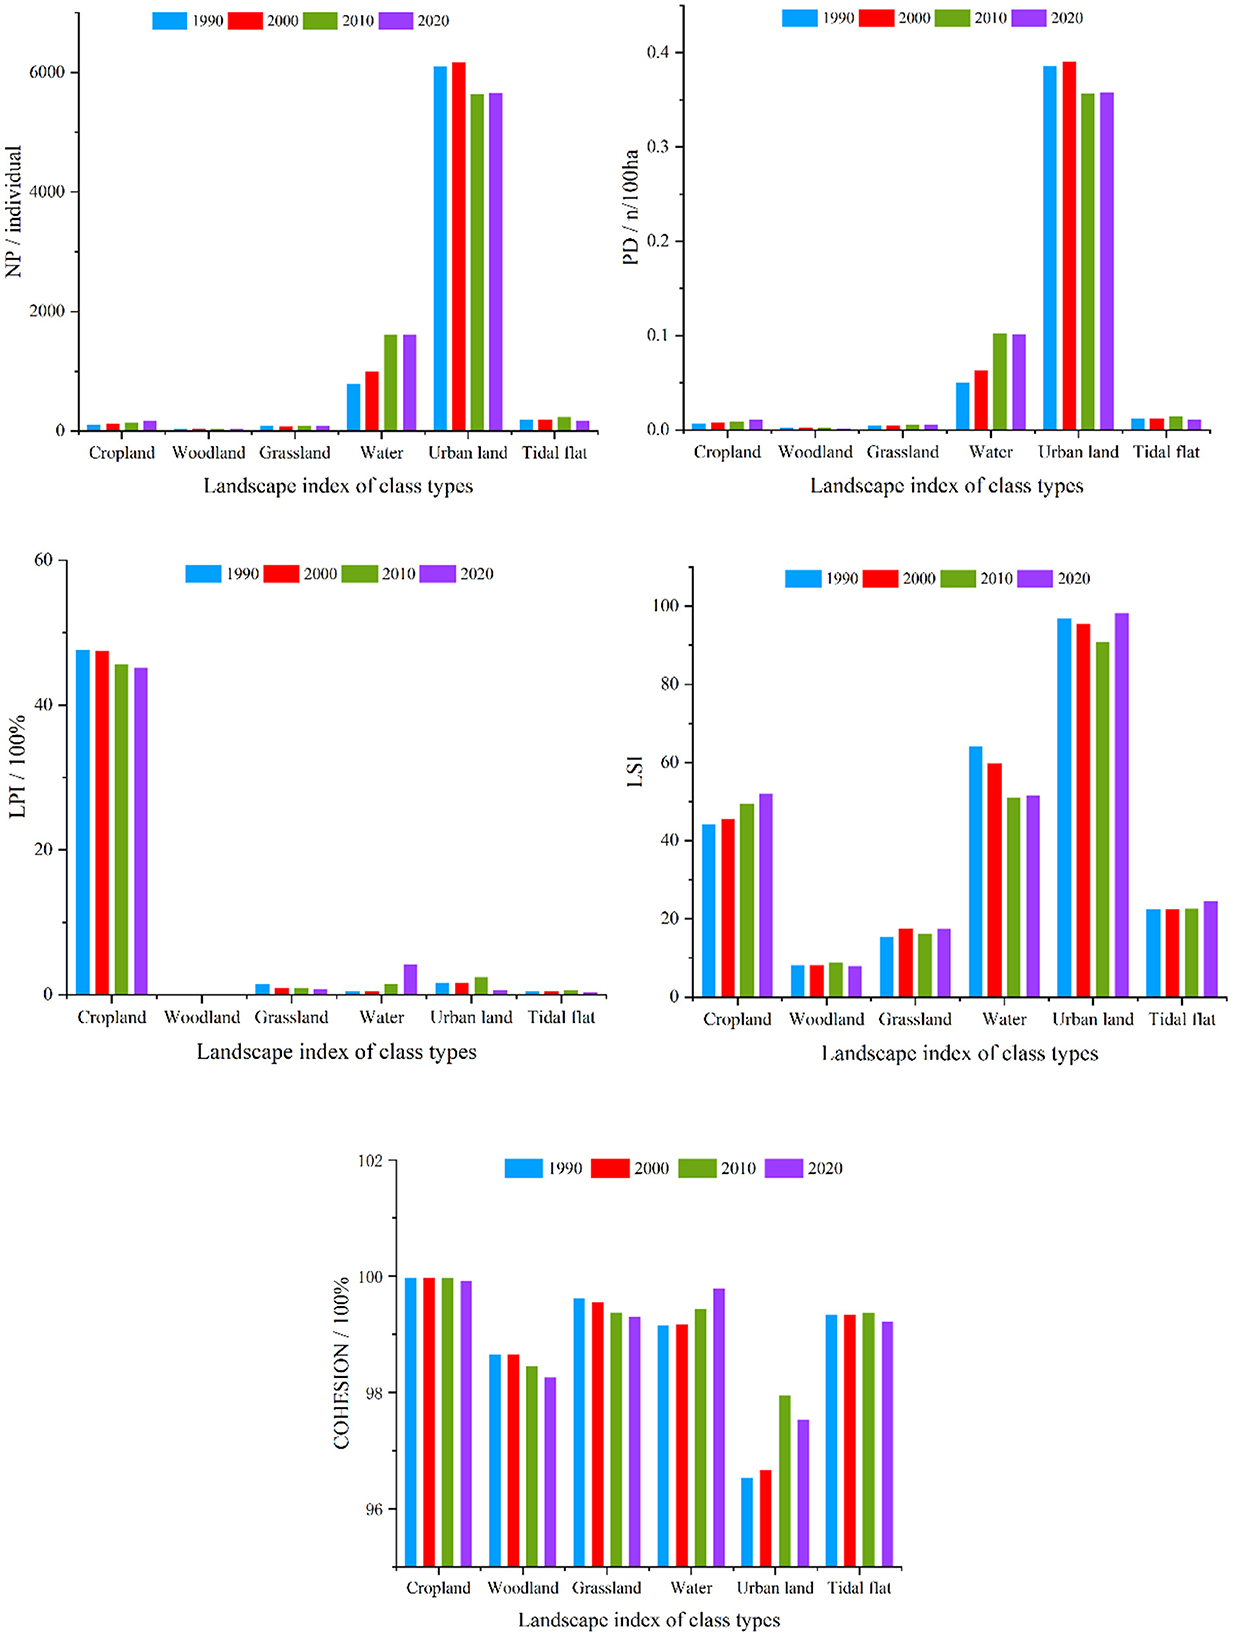
Figure 3. Landscape index of class types from 1990 to 2020 in the city of Yancheng.
4.2.2. Landscape fragmentation analysis at the landscape level
The landscape indices at the landscape level in Yancheng City are listed in Table 3. The results revealed that ED increased while CONTAG and AI decreased from 1990 to 2020. This indicated that the landscape marginal shape index in the study area was complicated. Moreover, the degree of discrete landscape types increased followed by a reduction in clustering in the regional space range. The SHDI and SHEI increased except for a slight decrease from 2010 to 2020. It indicated that the proportions of different landscape patch types in the study area gradually decreased. Moreover, a homogenous spatial distribution pattern was observed. The significant change in the diversity and richness of the landscape types was attributed to the reduction in Urban land and Woodland as well as the growth in Cropland and Water. There were relatively small differences in the proportions of various landscape types, which increased the complexity of the landscape pattern in Yancheng City over the 30-year study period. Due to its unique characteristics, the Tidal flat exhibited increased landscape heterogeneity across the spatial range. Based on the above analysis, it can be concluded that the landscape patterns in Yancheng City were greatly impacted by human activities from 1990 to 2020, and the degree of interference gradually increased.
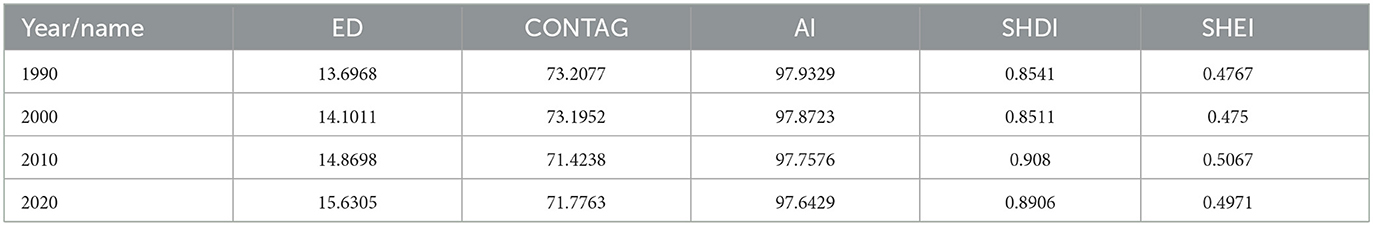
Table 3. Landscape index of land types from 1990 to 2020 in the city of Yancheng.
4.2.3. Landscape fragmentation and spatiotemporal distribution characteristic analysis at the county and district levels
As shown in Figure 4, the LPI values of Cropland, Grassland, Water, Urban land and Tidal flat in Yancheng City changed dramatically from 1990 to 2020 while the LPI of Woodland only changed slightly. High LPI values of Cropland were mainly concentrated in the southern regions of Funing County, western regions of Jianhu County, western regions of Yandu District and central areas of Tinghu District. This indicates that Cropland is still the main landscape of urban development. The LPI values of Woodland exhibited no changes whereas the high-value areas were scattered around. There was a reduction in low-value areas in Tinghu District, indicating minor human disturbances to Woodland. In other words, Woodland was very stable and did not exhibit obvious changes during the study period. High-value areas of Grassland were mainly concentrated in the central area of Binhai County and the northern area of Funing County. The Subei General Irrigation Canal and the Huai River entrance are situated in these areas. The low-value areas of Grassland in Sheyang County, Tinghu District, Dafeng District and Dongtai City decreased annually. This implied that the proportion of Grassland in the landscape area decreased annually. The high-value areas of Water increased annually, whereas the low-value areas decreased accordingly. Therefore, the integrity of Grassland in the study area decreased and the fluctuation intensified. Low-value areas of Urban land in the western regions of Tinghu District and east regions of Yandu District increased dramatically indicating that Urban land did not exhibit clustering growth and the urbanization process was slow. LPI changes in the Tidal flat were mainly manifested by the transformation of low-value regions into other land use types in the eastern regions of the Dafeng District. In other words, the artificial development of Tidal flat areas became more frequent with significant artificial interference.
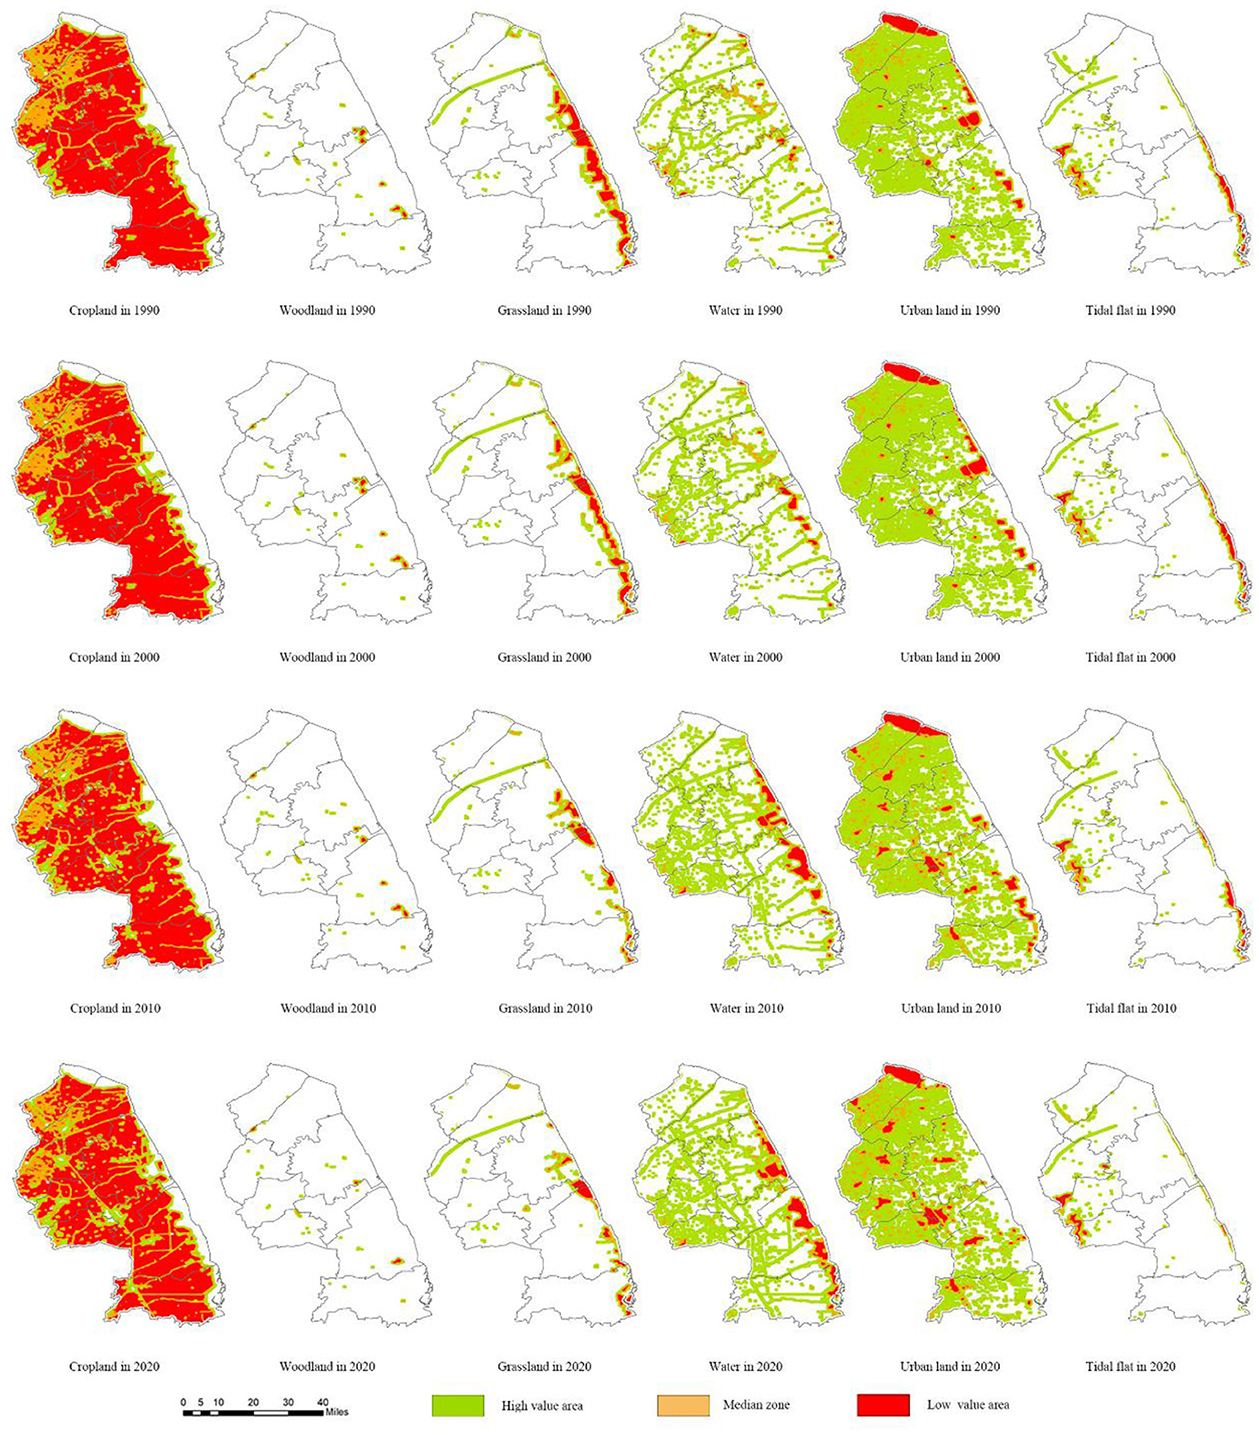
Figure 4. LPI spatial distribution of various ground feature types in Yancheng City from 1990 to 2020.
As shown in Figure 5, high IJI value regions of Cropland in the study area fluctuated in the four stages while high-value regions in the west of Xiangshui County and the central area of Funing County decreased significantly. The reduction in the Cropland area was due to the transformation into other land use types. The adjacent degree was reduced to 0. The IJI values of Woodland and Water remained intact, indicating that the landscape composition surrounding these land use types remained unchanged. The middle- and high-value regions of Grassland transformed into low-value regions and even disappeared, indicating that the distribution of Grassland transformation areas was relatively scattered and the adjacent degree was decreased. For Urban land, the mid-value regions in western Funing County, Jianhu County, and Yandu District were transformed into low-value regions, indicating that the Urban land of this region underwent landscape transformation and resulted in decreased IJI values. Variation in Tidal flat was mainly observed in the coastal regions. The middle- and high-value regions decreased gradually. This reflects the acceleration of artificial land development and utilization, which is closely related to the national policy for coastal development in 2006.
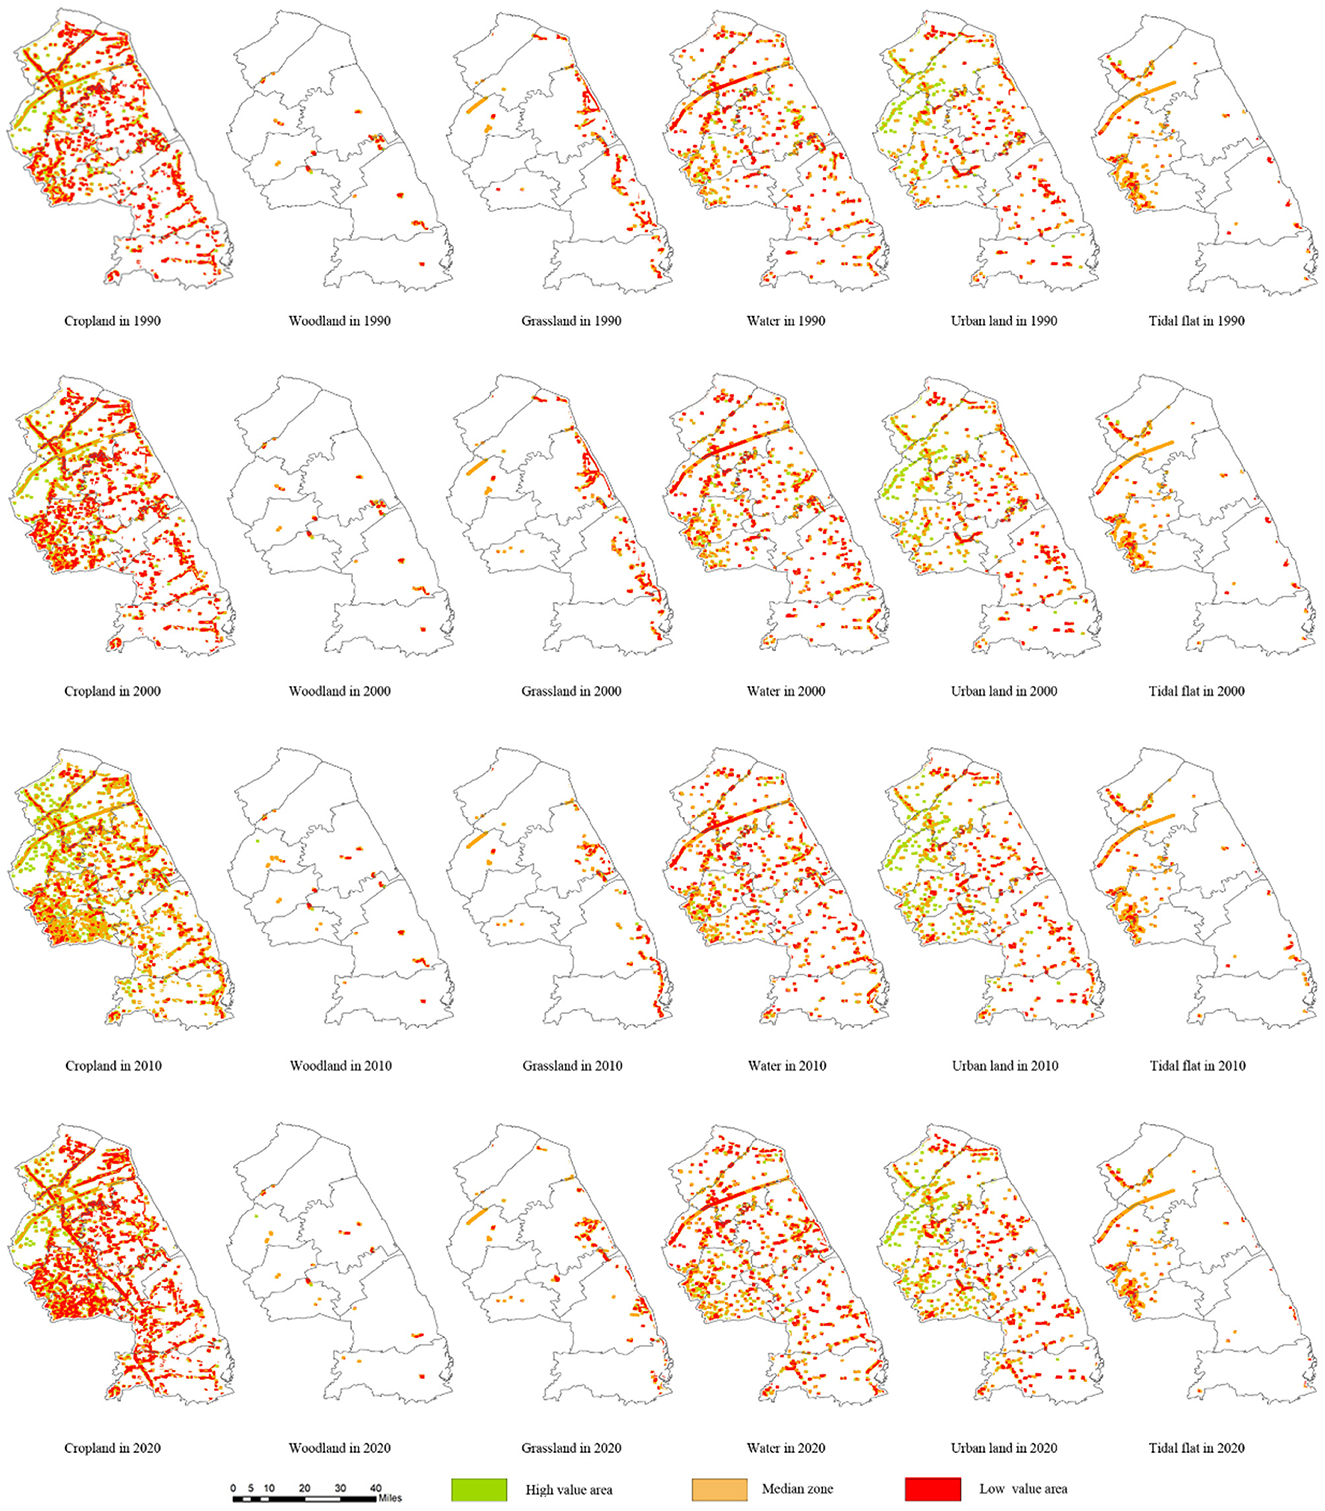
Figure 5. IJI spatial distribution of various ground feature types in Yancheng City from 1990 to 2020.
As shown in Figure 6, the overall CONTAG value did not change from 1990 to 2020. However, low-value regions in the center of Tinghu District, the center of Dafeng District and western Dongtai City were transformed into the middle- and high-value regions. This indicated that the landscape connectivity of these regions was strengthened and the landscape was stable. The middle- and high-value regions in coastal cities were transformed into low-value regions and exhibited regular stripped distributions, indicating that these regions were influenced significantly by human activities. The process of urban development should aim to reduce the degree of spreading so as to ensure the continued existence of certain landscapes such as urban ecological corridors. This could help to relieve the urban heat island effect and protect the biodiversity of the region while providing a better living environment for residents. The LSI values gradually decreased, indicating that landscape shapes in Yancheng City were developed in a regular direction and the urban development was reasonable. Western Xiangshui County, central and western Binhai County, and Funing County were transformed into low-value regions, indicating that the LSI values decreased more significantly under rapid urban development. The SHDI variation in Yancheng City was mainly manifested as the transformation of low-value regions in central and western Binhai County and Funing County into mid-value regions and the transformation of high-value coastal regions into low-value regions. Specifically, large-scale Cropland was transformed into Urban land. The influence of human activities on landscape changes was found to be significant, especially in the urban clustering zone.
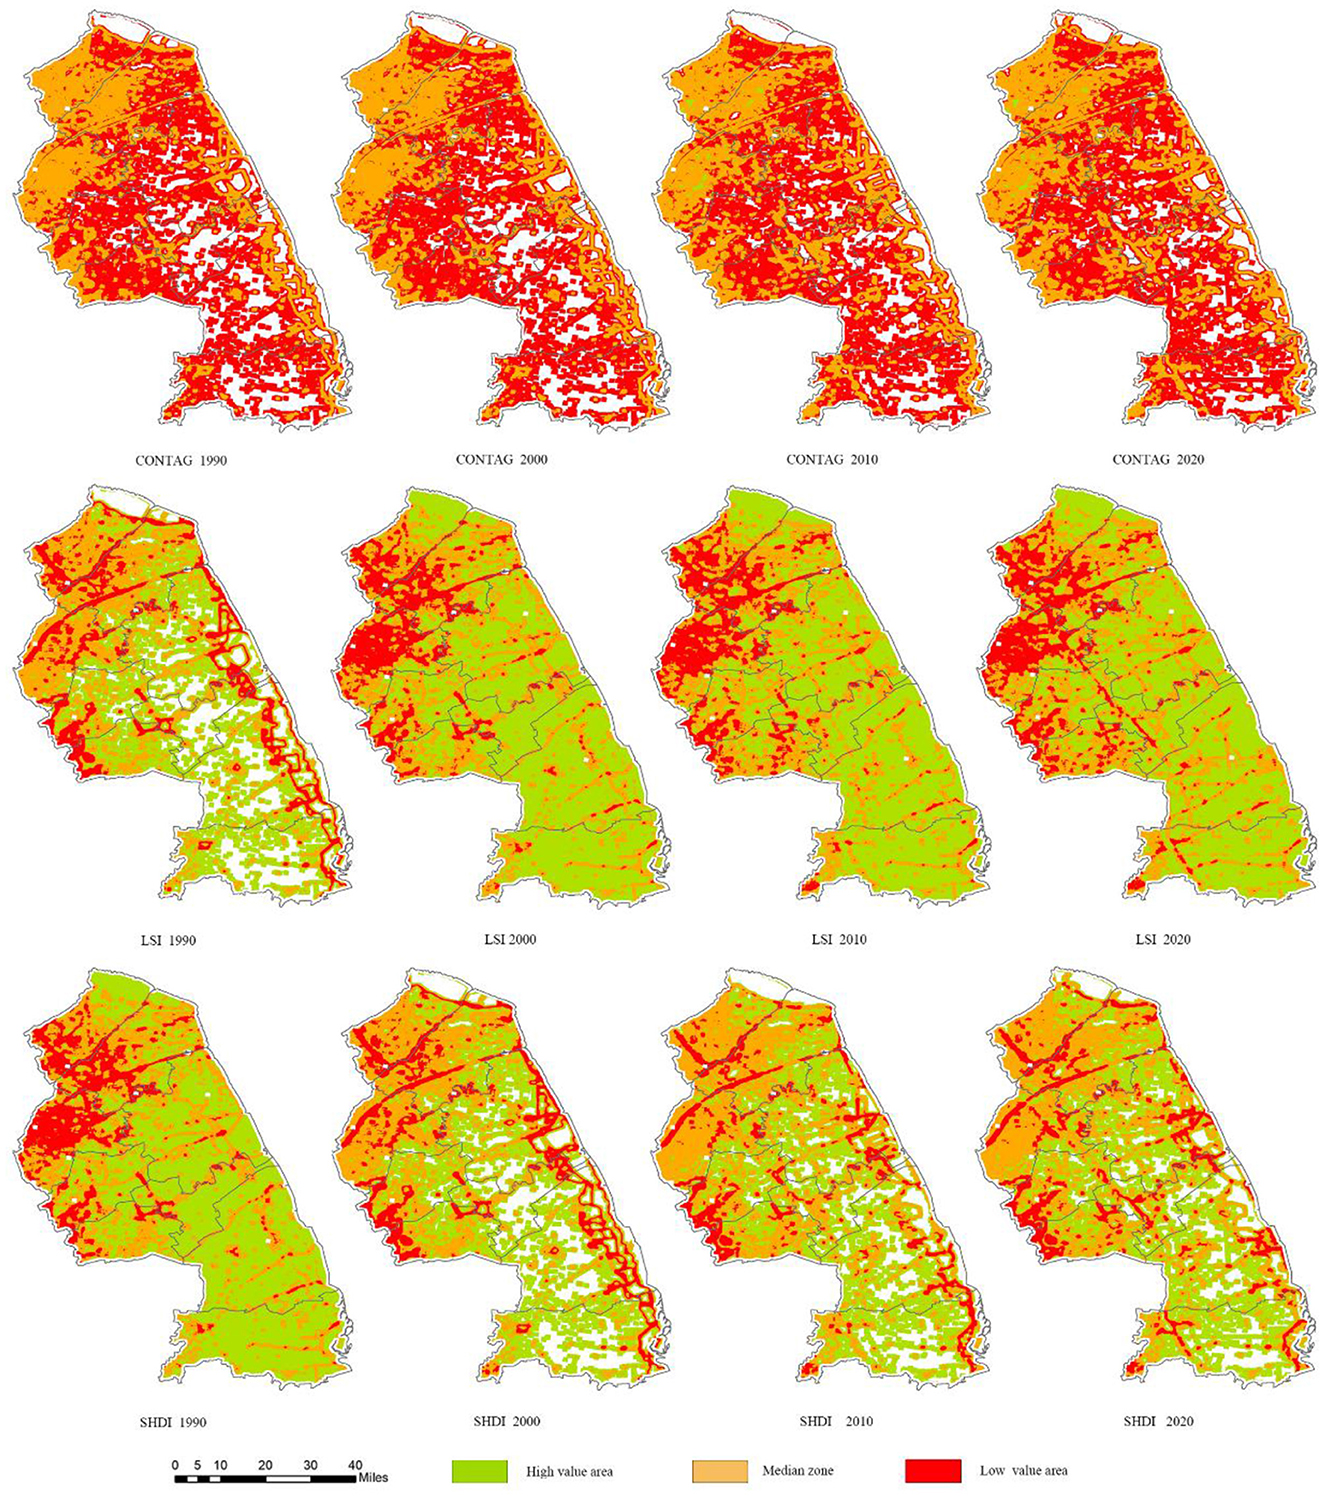
Figure 6. Spatial change of landscape index in Yancheng City from 1990 to 2020.
4.2.4. Landscape fragmentation analysis based on different land use patterns
Differences in landscape indices can reflect the quantity of variation and the trends in different land use patterns. Positive and negative values indicate growth and reduction in the index, respectively. Several land use types in Yancheng City were chosen as the sample points. The difference in the landscape indices in 1990 and 2020 was calculated. As shown in Figure 7, there were significant changes in the landscape indices of the various land use patterns in Yancheng City over the 30-year study period. These could be divided into three main types: (1) overall positive differences: primarily including differences in LSI. The Water exhibited the highest difference in LSI followed by Cropland. This indicated that the NP in Yancheng City continuously increased over the study period and land fragmentation intensified. (2) Overall negative differences: primarily including differences in LPI. This landscape index differed significantly among the various land use patterns. Specifically, Water showed the highest difference in LPI while Woodland exhibited the smallest difference. This could be attributed to the rich water systems in coastal cities which led to continuous segmentation of land use patterns. (3) Stable differences: mainly relating to differences in NP and PD. Aside from the great negative difference in Urban land, the remaining land use patterns exhibited slight changes.
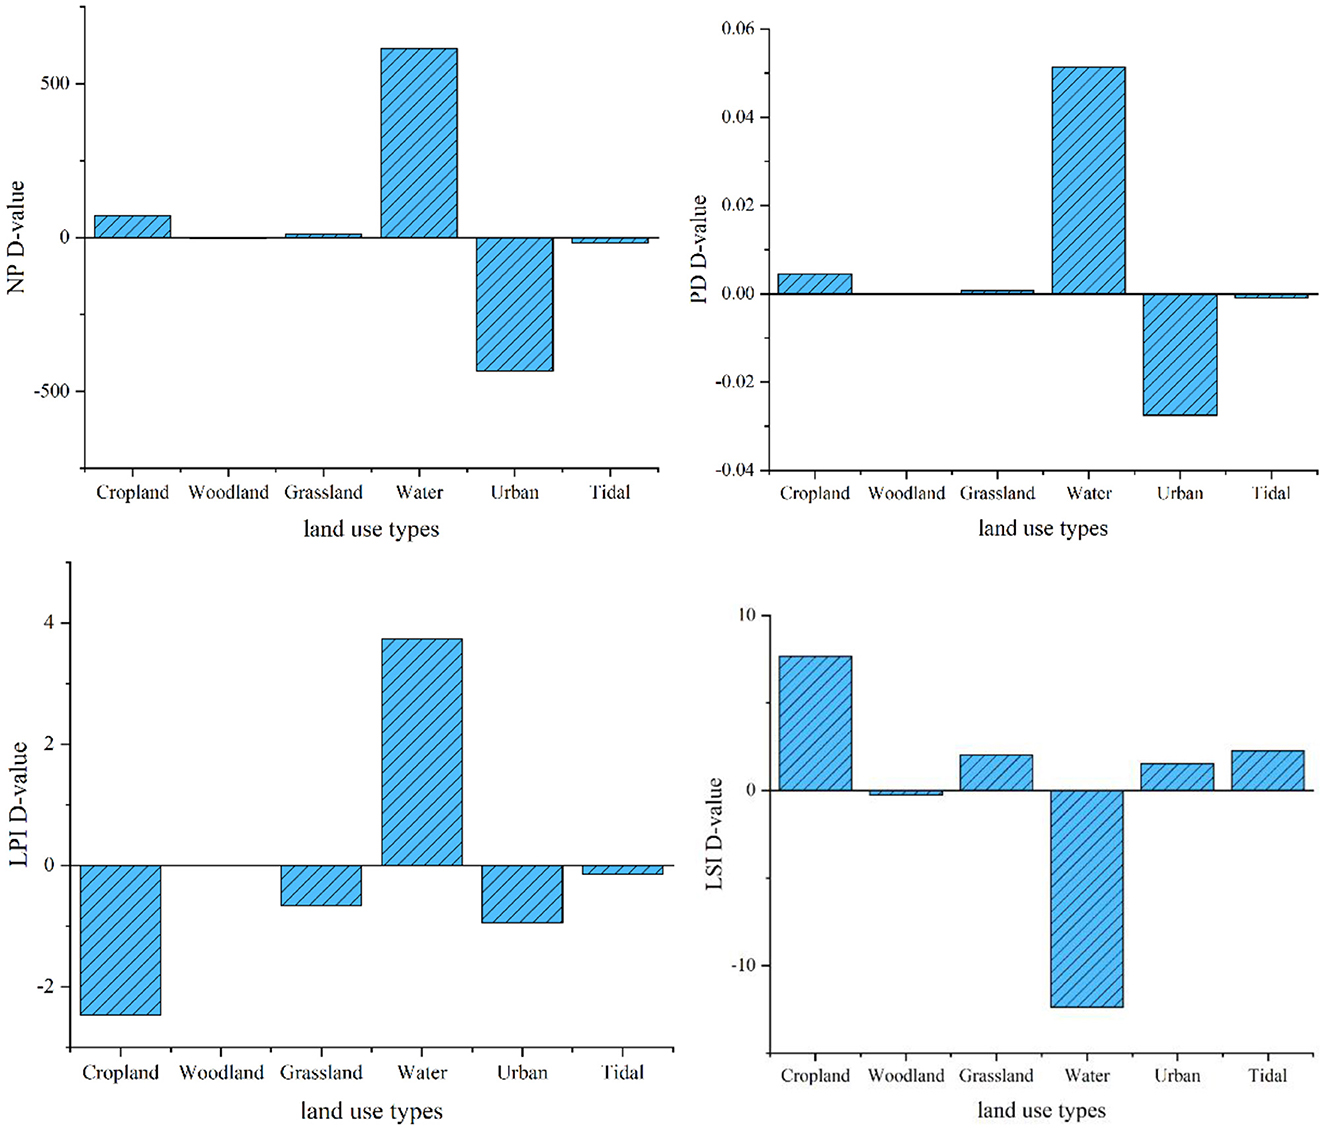
Figure 7. Landscape fragmentation difference of land use types in Yancheng City from 1990 to 2020.
5. Discussion
5.1. Analysis of the causes of dynamic land use change
Land use change is closely related to the external environment and human activities (Ju et al., 2020). The results of this study indicated that the natural landscape area within the study area gradually decreased and the artificial landscape area increased continuously. Much of the Cropland areas were transformed into Urban land. Therefore, cropland protection has become a pressing issue (Liu et al., 2015). Over the 30-year study period, the proportions of Cropland, Woodland, and Grassland decreased to different extents and changed to Urban land. The influence of cities on Cropland in urban suburbs gradually increased. This resulted in the widespread transformation of Cropland (Lee et al., 2015). The urban construction activities in Yancheng City were relatively active. The transformation and utilization of Tidal flat land changed significantly. Due to its unique soil properties, Tidal flat land did not initially change during the study period. However, the development and utilization of Tidal flat land have been increasing since 2000, which reflects the increase in artificial intervention activities.
Dense human activities could lead to land use changes in coastal regions, thus influencing the local landscape pattern (Tang et al., 2020). Artificial interference is a major cause of landscape pattern changes in Yancheng City. Specifically, growth in the gross domestic product (GDP) and per capita income were the major causes of Cropland's transformation. This indirectly indicates that the function of Cropland and its human utilization value has changed. Following the promotion of social and economic development, land use changes have gradually started to return to rationality since 2015 (Liu et al., 2019; Jiao et al., 2020). According to the data from the Statistical Bureau of Yancheng City (Table 4), the GDP in the study area increased from 2.637 to 595.338 billion yuan over the 30-year study period. Outputs of all industries in the study area increased at a stable rate. Specifically, the tertiary industry began to exceed the second industry in 2010, which broke the long-term industrial structure dominated by the secondary industry. In the study period, land use patterns changed mutually and frequently. Economic development influenced the growth rates of industries. On the other hand, it drove the allocation and adjustment of land resources. Hence, the population and economy are the major driving forces in landscape pattern changes in the study area (Zhao et al., 2021).

Table 4. Some socio-economic indicators 1990 to 2020 in the city of Yancheng.
5.2. Analysis and understanding of landscape fragmentation
Landscape pattern indices can be used to quantitatively assess land use changes in cities (Cadenasso et al., 2007). Cropland was generally the dominant land use pattern in coastal cities of the study area. Cropland not only occupied a large area and had a high degree of dominance, but it also exhibited good connectivity. The results demonstrated that all six land use patterns in Yancheng City have changed since the zoning adjustment in 2000. Considering the perspective of temporal and spatial changes in landscape fragmentation, the fragmentation degree was higher from 2000 to 2010 than from 2010 to 2020. The removal of counties and districts resulted in a rapid increase in the fragmentation of regional landscapes from 2000 to 2010. It increased the complexity of land use and spatial patterns. Over the past 20 years, infrastructure construction and Urban land expansion have disrupted the original large-scale spatial distribution of Woodland and Cropland, resulting in increased fragmentation of the landscape in the region.
The degree of landscape fragmentation in coastal cities decreased over the past 30 years. However, there were differences at the county and district levels. Due to the urban development of Cropland, Woodland, and Tidal flat, the NP and PD values in the region decreased. The rising maximum patch index indicated that landscape fragmentation decreased during the study period. The landscape indices of Yancheng City exhibited obvious regional differences. Landscape fragmentation was closely related to regional development. Comparative analysis showed that patch fragmentation was mainly concentrated in coastal wetlands while the landscape index in the west and northeast of Yancheng City was relatively stable.
Rapid urbanization further intensifies large-scale development activities in coastal cities. It not only increases the regional economy but also results in a series of ecological problems. Therefore, the study of land use and landscape fragmentation in coastal cities is critical. In this study, dynamic changes in land use and landscape fragmentation were examined in coastal cities that have undergone intense economic development. Moreover, the relevant influencing factors were quantitatively analyzed. The results indicated that due to social and economic development, the degree of landscape fragmentation in Yancheng City increased significantly. Due to differences in locational factors between coastal and inland cities, the degree of landscape fragmentation differed in different counties and regions of the study area.
Compared to an overall macroscopic analysis, this study carried out a multi-scale analysis of the spatiotemporal features of landscape fragmentation by combining land use changes, dynamic degree changes and relevant landscape indices. However, the correlation between landscape indices and scale is still unclear. Below vital questions need to be further addressed. Are landscape pattern indices related to landscape scales? How does landscape heterogeneity change with scale? These problems must be urgently addressed in order to more comprehensively understand landscape indices, especially when analyzing these indices using the moving window method. The optimum way to develop cities and protect Cropland is also a problem that remains to be solved. Further deep analysis and follow-up studies are required to address these questions.
6. Conclusion
Geometric correction refers to the process of remote sensing imaging. Under the comprehensive influence of various factors, the geometric position, shape, size, dimension, orientation, and other features of ground objects on the original image are often inconsistent with those of the corresponding ground objects. Radiation correction refers to the correction of systematic and random radiation distortion (or distortion caused by external factors), data acquisition and transmission system, and eliminating/correcting image distortion caused by radiation error. In this study, geometric and radiation corrections were first conducted on the TM data. Using the administrative map of Yancheng City, administrative regions of Yancheng City were sheared. Landscapes in Yancheng City were divided into six types (Cropland, Woodland, Grassland, Water, Urban land, and Tidal flat) using the monitoring classification method in ENVI software. Four land use vector graphs (one for each period) were obtained and vector data documents were produced. A geographical database was established and Arc GIS10.2 was used for the management of the spatial data and function analysis. This enabled macroscopic analysis of the landscape pattern in Yancheng City. The landscape changes in Yancheng City in 1990, 2000, 2010, and 2020 were analyzed. Statistical analysis of the transformation of different land use patterns was carried out using GIS10.2 software (Figure 8).
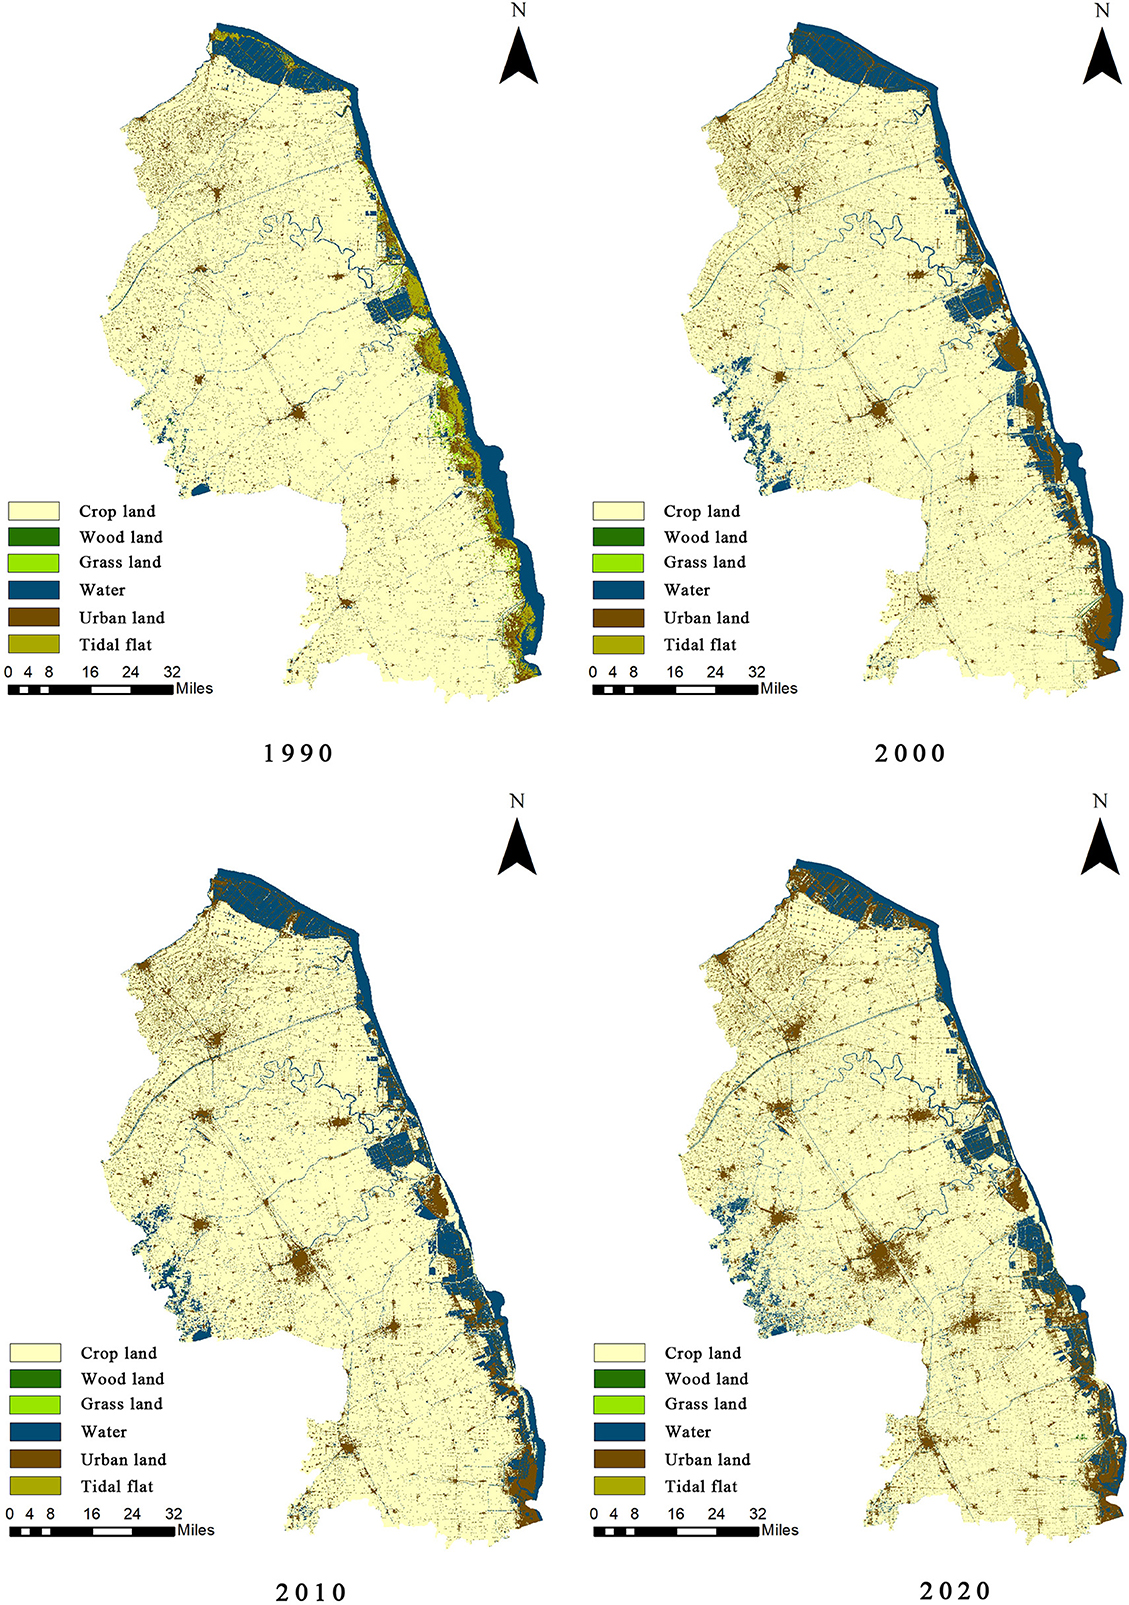
Figure 8. Land use classification of Yancheng City in 1990, 2000, 2010, and 2020.
Urban land use change and landscape fragmentation features in coastal regions were analyzed and measured in this study. The results can provide theoretical references for optimal land use structure and ecological environmental governance. In view of the series of problems caused by human activities, rational use of land resources, orderly urban construction and reclamation of tidal flats can protect the ecological environment to the maximum extent. Due to its good natural conditions and high economic development level, Yancheng City is an ideal representative city for studying land use changes. As a result of the process of urbanization and rapid economic development, the demands for Urban land in Yangcheng City continue to increase. This indirectly suggests that landscape fragmentation in Yancheng City is mainly related to urban construction activities. With respect to the patch pattern changes, the landscape dominance of Cropland exhibited an obvious reduction. Since multiple factors further increase the complex boundary and shape of Cropland, landscape connectivity was significantly impacted within the study period. Water and Tidal flat land areas were the landscape corridors and influenced the landscape heterogeneity of Yancheng City.
Dynamic changes in land use reflected vulnerability and fluctuation of the ecological environment in Yancheng City. This also leads to unstable changes to landscape structures in the regional range. Establishing a corresponding information database based on the use of GIS technology could allow accurate quantification of landscape spatial pattern indices. The establishment of a transfer matrix of land use patterns in this study enabled the examination of mutual transformation of the landscape matrix, patches, and corridors. Quantitative analysis and comparison of the corresponding parameters can further contribute to ecological environmental theories in the Yancheng Region. Moreover, such results have important significance for monitoring level-1 deterioration of land use/coverage. The use of multiple information technologies and software computation methods allows for the exploration of the evolutionary law of regional landscape fragmentation from the temporal dimension. In this study, the distribution of various landscape types and their transformation laws in different stages were explored from the spatial dimension. The landscape fragmentation in Yancheng City was closely related to the location of coastal cities, urban landforms and urban development. With the development of the social economy, the intervention and regulation of human activities on the stability of the ecosystem are more and more intense. Natural factors and human factors often act together, and human factors can lead to the strengthening or weakening of natural factors. Therefore, artificial activities were the major driving force in landscape pattern changes in these cities. Additionally, the development and utilization of Tidal flat areas significantly contributed to the transformation of landscape types while bringing positive influence on the climate and ecological environment in the region.
Data availability statement
The original contributions presented in the study are included in the article/supplementary material, further inquiries can be directed to the corresponding author.
Author contributions
DJ contributed to the conception of the study and wrote the manuscript. XJ helped perform the analysis with constructive discussions. DW contributed significantly to analysis and manuscript preparation. PL performed the data analyses. All authors have read and agreed to the published version of the manuscript.
Funding
This research was funded by the National Key Research and Development Program of China (No. 2018YFD1100200) and the Science and Technology Planning Project of Jiangsu Provincial Department of Housing and Urban-Rural Development (No. 2019ZD001015).
Conflict of interest
The authors declare that the research was conducted in the absence of any commercial or financial relationships that could be construed as a potential conflict of interest.
Publisher's note
All claims expressed in this article are solely those of the authors and do not necessarily represent those of their affiliated organizations, or those of the publisher, the editors and the reviewers. Any product that may be evaluated in this article, or claim that may be made by its manufacturer, is not guaranteed or endorsed by the publisher.
References
Bagheri, M., Zaiton Ibrahim, Z., Mansor, S., Abd MAnaf, L., Fadzhik Akhir, M., Asma Wan Talaat, W. I., et al. (2021). Land-use suitability assessment using delphi and analytical hierarchy process (D-AHP) hybrid model for coastal city management: Kuala Terengganu, Peninsular Malaysia. ISPRS Int. J. Geo-Inf. 10, 621. doi: 10.3390/ijgi10090621
Bock, M., Gasser, P.-Y., Pettapiece, W. W., Brierley, A. J., Bootsma, A., Schut, P., et al. (2018). The land suitability rating system is a spatial planning tool to assess crop suitability in Canada. Front. Environ. Sci. 6, 77. doi: 10.3389/fenvs.2018.00077
Cadenasso, M. L., Pickett, S. T. A., and Schwarz, K. (2007). Spatial heterogeneity in urban ecosystems: reconceptualizing land cover and a framework for classification. Front. Ecol. Environ. 5, 80–88. doi: 10.1890/1540-9295(2007)5[80:SHIUER]2.0.CO;2
Chen, G. (2021). The construction of ecological security patterns in coastal areas based on landscape ecological risk assessment—a case study of Jiaodong Peninsula, China. Int. J. Environ. Res. Public Health 18, 12249. doi: 10.3390/ijerph182212249
Chi, Y., Shi, H., Zheng, W., and Wang, E. (2018). Archipelagic landscape patterns and their ecological effects in multiple scales. Ocean Coast. Manage. 152, 120–134. doi: 10.1016/j.ocecoaman.2017.11.027
Deng, J. S., Ke, W., and Yang, H. (2009). Spatio-temporal dynamics and evolution of land use change and landscape pattern in response to rapid urbanization. Landsc. Urban Plann. 92, 187–198. doi: 10.1016/j.landurbplan.2009.05.001
Fei, L. I. (2015). The relationships between land use change and demographic dynamics in western Jilin province. J. Geogr. Sci. 25, 617–636. doi: 10.1007/s11442-015-1191-x
He, J. F., Liu, J. Y., Zhuang, D., Zhang, W., and Liu, M. (2007). Assessing the effect of land use/land cover change on the change of urban heat island intensity. Theor. Appl. Climatol. 90, 217–226. doi: 10.1007/s00704-006-0273-1
Huang, Y., Zhang, T., Wu, W., Zhou, Y., and Tian, B. (2016). Rapid risk assessment of wetland degradation and loss in low-lying coastal zone of Shanghai, China. Hum. Ecol. Risk Assess. Int. J. 23, 82–97. doi: 10.1080/10807039.2016.1223536
Jiao, L., Xu, Z., Xu, G., Zhao, R., Liu, J., Wang, W., et al. (2020). Assessment of urban land use efficiency in China: a perspective of scaling law. Habitat Int. 99, 102172. doi: 10.1016/j.habitatint.2020.102172
Ju, H., Niu, C., Zhang, S., Jiang, W., Zhang, Z., Zhang, X., et al. (2021). Spatiotemporal patterns and modifiable areal unit problems of the landscape ecological risk in coastal areas: a case study of the Shandong Peninsula, China. Clean. Prod. 310, 127522. doi: 10.1016/j.jclepro.2021.127522
Ju, H., Zuo, L., Zhang, Z., Zhao, X., Wang, X., Wen, Q., et al. (2020). Methods research on describing the spatial pattern of land use types in China. Acta Geograph. Sin. 75, 143–159. doi: 10.11821/dlxb202001011
Kantakumar, L. N., Kumar, S., and Schneider, K. (2016). Spatiotemporal urban expansion in Pune metropolis, India using remote sensing. Habitat Int. 51, 11–22. doi: 10.1016/j.habitatint.2015.10.007
Khadour, N., Basha, N. A., Sárospataki, M., and Fekete, A. (2021). Correlation between land use and the transformation of rural housing model in the coastal region of Syria. Sustainability 2021, 13. doi: 10.3390/su13084357
Lambin, E. F., Turner, B. L., Geist, H. J., Agbola, S. B., Angelsen, A., Bruce, J. W., et al. (2001). The causes of land-use and land-cover change: moving beyond the myths. Glob. Environ. Chang. Hum. Policy Dimens. 11, 261–269. doi: 10.1016/S0959-3780(01)00007-3
Lee, Y. C., Ahern, J., and Yeh, C. T. (2015). Ecosystem services in pen-urban landscapes: the effects of agricultural landscape change on ecosystem services in Taiwan's western coastal plain. Landsc. Urban Plan. 139:137–148. doi: 10.1016/j.landurbplan.2015.02.023
Li, Y., Sun, Y., and Li, J. (2021). Heterogeneous effects of climate change and human activities on annual landscape change in coastal cities of mainland China. Ecol. Indic. 125, 107561. doi: 10.1016/j.ecolind.2021.107561
Liu, F., Zhang, Z. X., Zhao, X. L., Wang, X., Zuo, L. J., Wen, Q. K., et al. (2019). Chinese cropland losses due to urban expansion in the past four decades. Sci. Total Environ. 650, 847–857. doi: 10.1016/j.scitotenv.2018.09.091
Liu, M., Tao, R., Yuan, F., and Cao, G. (2018). Instrumental land use investment-driven growth in China. J. Asia Pac. Econ. 13, 313–331. doi: 10.1080/13547860802131300
Liu, T., Liu, H., and Qi, Y. (2015). Construction land expansion and cultivated land protection in urbanizing China: insights from national land surveys,1996-2006. Habitat Int. 46, 13–22. doi: 10.1016/j.habitatint.2014.10.019
Meng, Q., Sun, Y., Chen, X., Li, J., Wang, X., and Wu, J. (2020). Moving window method: an effective approach to measure surrounding greenness. J. Indian Soc. Remote Sens. 48, 1729–1738. doi: 10.1007/s12524-020-01180-x
Nouri, J., Gharagozlou, A., Arjmandi, R., Faryadi, S., and Adl, M. (2014). Predicting urban land use changes using a CA–Markov model. Arab. J. Sci. Eng. 39, 5565–5573. doi: 10.1007/s13369-014-1119-2
Shi, L., Liu, F., Zhang, Z., Zhao, X., Liu, B., Xu, J., et al. (2015). Spatial differences of coastal urban expansion in China from 1970s to 2013. Chin. Geogr. Sci. 25, 389–403. doi: 10.1007/s11769-015-0765-y
Sui, D. Z. (1998). GIS-based urban modelling: practices, problems, and prospects. Int. J. Geogr. Inf. Sci. 12, 651–71. doi: 10.1080/136588198241581
Sun, C., Wu, Z. F., Lv, Z. Q., Yao, N., and Wei, J. B. (2011). Quantifying different types of urban growth and the change dynamic in Guangzhou using multi-temporal remote sensing data. Int. J. Appl. Earth Obs. Geoinf. 21, 409–417. doi: 10.1016/j.jag.2011.12.012
Tang, J., Li, Y., Cui, S., Xu, L., Ding, S., and Nie, W. (2020). Linking land-use change, landscape patterns, and ecosystem services in a coastal watershed of southeastern China. Glob. Ecol. Conserv. 23, e01177. doi: 10.1016/j.gecco.2020.e01177
Wang, X., Xiao, X., Zou, Z., Chen, B., Ma, J., Dong, J., et al. (2020). Tracking annual changes of coastal tidal flats in China during 1986–2016 through analyses of Landsat images with Google Earth Engine. Remote Sens. Environ. 238, 110987. doi: 10.1016/j.rse.2018.11.030
Wu, J. (2000). Landscape Ecology: Pattern, Process, Scale and Hierarchy. Beijing: Higher Education Press.
Wu, J., Guo, Q., and Hewings, G. (2019). Land regulating economy as a policy instrument in urban China. Cities 94, 225–234. doi: 10.1016/j.cities.2019.06.009
Yu, X., Zhang, A., Hou, X., Li, M., and Xia, Y. (2013). Multi-temporal remote sensing of land cover change and urban sprawl in the coastal city of Yantai, China. Int. J. Digit. Earth 6, 137–154. doi: 10.1080/17538947.2011.653995
Zhang, C., Zhong, S., Wang, X., Shen, L., Liu, L., and Liu, Y. (2019). Land use change in coastal cities during the rapid urbanization period from 1990 to 2016: a case study in Ningbo City, China. Sustainability 11, 2122. doi: 10.3390/su11072122
Zhang, T. (2000). Land market forces and government's role in sprawl: the case of China. Cities 17, 123–135. doi: 10.1016/S0264-2751(00)00007-X
Zhang, W., Chang, W. J., Zhu, Z. C., and Hui, Z. (2020). Landscape ecological risk assessment of Chinese coastal cities based on land use change. Appl. Geograp. 117, 102174. doi: 10.1016/j.apgeog.2020.102174
Keywords: coastal plain areas, land use, landscape fragmentation, moving window method, spatiotemporal change
Citation: Jiang D, Ji X, Wang D and Liu P (2023) Spatiotemporal changes in land use and landscape fragmentation in coastal plain areas—A case study of Yancheng City, China. Front. Sustain. Food Syst. 7:1105897. doi: 10.3389/fsufs.2023.1105897
Received: 23 November 2022; Accepted: 15 February 2023;
Published: 09 March 2023.
Edited by:
Samir Sayadi Gmada, Andalusian Institute for Research and Training in Agriculture, Fisheries, Food and Ecological Production (IFAPA), SpainReviewed by:
Pablo Torres-Lima, Metropolitan Autonomous University, MexicoGuillermo Garcia-Garcia, IFAPA Center Purchil Road, Spain
Copyright © 2023 Jiang, Ji, Wang and Liu. This is an open-access article distributed under the terms of the Creative Commons Attribution License (CC BY). The use, distribution or reproduction in other forums is permitted, provided the original author(s) and the copyright owner(s) are credited and that the original publication in this journal is cited, in accordance with accepted academic practice. No use, distribution or reproduction is permitted which does not comply with these terms.
*Correspondence: Xiang Ji, aml4aWFuZzA2MTVAeWVhaC5uZXQ=