 Jesús Castillo
 Guy J. D. Kirk
 M. Jordana Rivero
 Stephan M. Haefele
- 1Programa Nacional de Investigación en Arroz, Instituto Nacional de Investigación Agropecuaria (INIA), Treinta y Tres, Uruguay
- 2Sustainable Soils and Crops, Rothamsted Research, Harpenden, United Kingdom
- 3School of Water, Energy and Environment, Cranfield University, Cranfield, United Kingdom
- 4Net Zero and Resilient Farming, Rothamsted Research, North Wyke, United Kingdom
The reintegration of crops with livestock systems is proposed as a way of improving the environmental impacts of food production globally, particularly the impact involving nitrogen (N). A detailed understanding of processes governing N fluxes and budgets is needed to design productive and efficient crop–livestock systems. This study aimed to investigate regional differences in N balance (NBAL, defined as all N inputs minus outputs), N use efficiency (NUE, defined as N outputs/inputs × 100), and N surplus (NSURP, defined as all N inputs minus only outputs in food products) in the rice–livestock system of Uruguay. Three regions across Uruguay are distinguished based on soil fertility and length of pasture rotation. The northern region has high soil fertility and short length of rotation (HFSR); the central region has medium soil fertility and medium length of rotation (MFMR); the eastern region has low fertility and long pasture rotation (LFLR). Results for the last 18 years show a very high NUE (90%) for the rice component in all rotations, associated with negative NBALs ranging from −35 kg N ha−1 yr−1 in HFSR to −3 kg N ha−1 yr−1 in LFLR. However, the livestock component, which overall had low animal productivity (<2 kg N ha−1 yr−1), had low NUE (<10%) but positive NBALs in all the rotations, sustaining N supply in the rice component. At the system level, NUE was high (60%) and NBAL was slightly positive in all rotations (from +2.8 kg N ha−1 yr−1 in HFSR to +8.5 kg N ha−1 yr−1 in LFLR). Because of a recent increase in the N fertilizer dose in rice, NSURP for the overall system was intermediate (40 kg N ha−1 yr−1) and should be monitored in the future. Efforts to improve the system's efficiency should focus on the livestock component.
Introduction
Over the past many decades, production systems in most parts of the world have adapted to the growing global food demand and changes in diets by specialization (Russelle et al., 2007; Lassaletta et al., 2014). Specialized systems frequently rely on large amounts of external inputs of which fertilizers, particularly N, play a key role. This has caused environmental damage including a major contribution to global greenhouse gas (GHG) emissions (Galloway et al., 2008; Hilimire, 2011). Nitrogen use efficiency (NUE) in global food production is low with an average of < 20–25% of N inputs reaching the final consumable product (Sutton et al., 2013; Zhang, 2020). In general, crop systems have higher NUE than livestock systems, which are associated with high animal waste and GHG emissions (Uwizeye et al., 2020). Specialization has broken a virtuous circle between livestock and crops, whereby the forage, fiber, and grains for animal feed were provided by cropping while nutrients and organic matter were returned from animals to crops (Thorne, 2007; Wolfe, 2011). A return to integrated crop–livestock production systems are increasingly discussed as a way of achieving high production while avoiding the negative externalities of specialized systems (Baiyeri et al., 2019; Peterson et al., 2020; Vogel et al., 2021).
There are many variants of the integrated crop–livestock systems, from those managed in separate farms but sharing by-products and residues to those in which crops and animals are on the same farm, sometimes in rotation on the same land, but this scenario is currently quite rare, representing in the best case < 50% of the total system agricultural area (Wolfe, 2011; Garrett et al., 2017; Brewer and Gaudin, 2020). In all cases, regardless of the degree of integration, the common denominator is the use of animals for what they are good at converting fibrous feeds (e.g., forage) and by-products from the food system into high-value products and manure (Van Zanten et al., 2019). Recoupling crops and livestock at least through the inclusion of annual forages for direct animal grazing between cash crops are being considered in the Rio de la Plata region of South America. Despite remaining incipient, regarding the total region area, diverse ecosystem services have been observed (i.e., soil restoration, nutrient cycling, better adaptation to climate variation) near after starting that management practice (De Faccio Carvalho et al., 2021). In contrast, the particular case of the Uruguayan rice–livestock system could be seen as an example of such a circular farming system, with the whole country's rice area integrated into a systematic pasture–livestock rotational scheme (García et al., 2009; Lanfranco et al., 2018). The system has been operated for four to six decades depending on the region, with a constant yield increase over time of 90 kg ha−1 yr−1 (Blanco et al., 2010) and with relatively low use of N fertilizers (Tseng et al., 2021). In an earlier study (Castillo et al., 2021), we analyzed the system at a national level and found complementarity through N transfer from animal deposition to rice, biological N fixation during the pasture phase, and N recycling in rice bran to livestock. We found the N balances are tight (< 3.5 kg N ha yr−1 in both the components and the system), and N surpluses are low but increasing. Nitrogen use efficiency is high in rice (65%) but much lower in livestock (13%) and the system (23%). National rice yields of 10 Mg ha−1 are now targeted by farmers, potentially requiring more N fertilizer. Over time, this could lead to a decline in NUE and potentially increased N surplus up to undesirable values (Dobermann et al., 2022). At that point, adjustments in fertilizer technology and regulations would be needed. There are regional differences in management across the rice–livestock system, mainly in terms of the length of pasture rotations related to the level of natural soil fertility. These are likely to be linked to differences in NUE and N surplus and their progression over time, which need to be understood to improve the overall system.
Our objectives were to assess N balance, NUE, and their components in rice–livestock rotations across Uruguay and follow their changes from 2004 to 2022. Based on our national scale assessment (Castillo et al., 2021), we hypothesize that even with relatively small N fertilizer additions to rice, the NBAL has been around neutrality while NUE has reached high values in all the rotations over the period investigated. However, we expect differences among rotations due to different pasture lengths and management practices. Because of small N outputs in animal products, we hypothesize that the livestock component reached positive and stable NBALs and medium to low NUE across the period, resulting in positive NBALs and medium NUE in the whole system. We also explore different production scenarios to identify the more sensitive aspects of NBAL and NUE for improving management practices.
Materials and methods
Cropping system characteristics and data sources
The rice–livestock system of Uruguay consists of ~163,000 ha of rice and 570,000 ha of pastures integrated into a stable rotation divided into three regions (Table 1). The main region is in the east (LFLR in Table 1), accounting for 70% of the national rice area. The northern area (HFSR) accounts for 20% and the central area (MFSR) accounts for 10%. The eastern region is characterized by a flat landscape with slopes of ~0.1%, medium to low soil fertility, and river water sources for flood irrigation. In the northern and central regions, rice is grown on more fertile soils, which includes sloped areas of < 5% (nearly 60% in the north and 25% in the central region), and irrigation water is sourced from artificial dams. Despite those particularities, the main differences among the regions are soil fertility and pasture phase length after rice. On average, after two or three consecutive rice crops (the latter mainly associated with the northern region), 4, 3, or 2 years of perennial pastures grazed by livestock complete the rotation in the eastern, central, and northern regions, respectively (García et al., 2009; Giménez et al., 2011; Lanfranco et al., 2018).
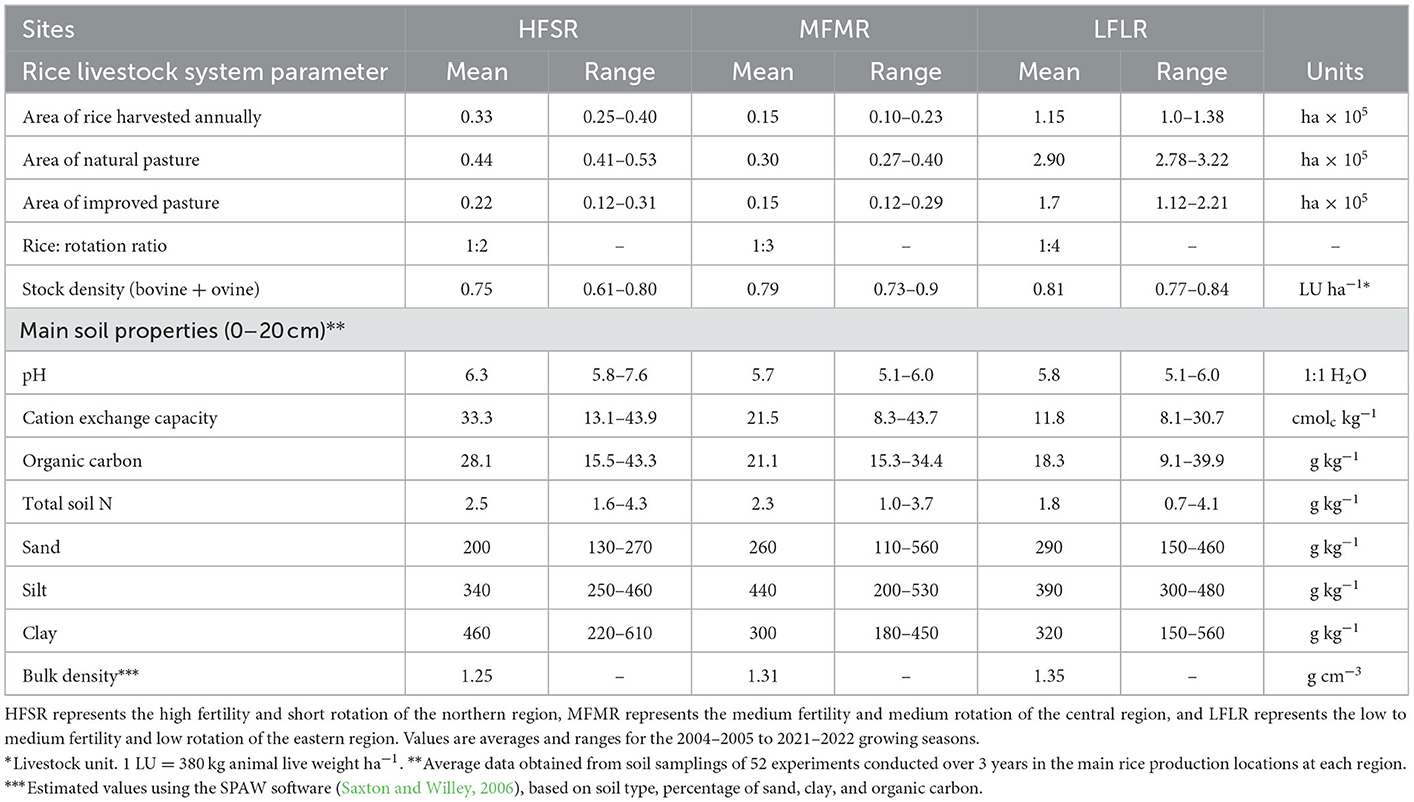
Table 1. Components of the rice–livestock system of Uruguay at a regional level.
Following rice crops, ~ 31% of HFSR, 33% of MFMR, and 38% of LFLR are mixed pastures, including legume species, seeded into the rice stubble. The combination of these factors means that the ratios of rice seeded into (a) rice stubble, (b) improved pastures including legumes or (c) native grassland are 60–17–23 for HFSR, 50–18–32 for MFMR, and 35–21–44 for LFLR. However, there are a few differences in crop management and the amount of fertilizer and agrochemical products added. The system as a whole is stable and based on land agreements in which the rice farmers rent land for long periods or on an annual basis.
We analyzed data from the Agricultural and Livestock Ministry (MGAP), the Agricultural Statistics Department (DIEA), the National Institute of Meat (INAC), the National Institute for Agricultural Research (INIA), and the rice milling industry (Supplementary Table 1). The original data are available at different scales. For example, while rice data are available from the farm to the county level, livestock and pasture information are only available at the county level. However, calculated cattle stocking rates for each region (0.79, 0.75, and 0.81 livestock units ha−1) were similar to the 0.76 livestock units ha−1 reported in previous studies of a typical rice–livestock rotation district (Simeone et al., 2008).
Rice data
Annual information on rice yield and seeded area were collected from governmental agencies (DIEA Estadísticas Agropecuarias, 2005, 2022). Crop management data are presented annually by the rice milling companies and summarized by INIA, covering ~85–90% of the total rice area. Crop parameters and characteristics associated with each variety were taken from internal records of INIA. Approximately 75% of the exported or internally consumed rice is white rice (Observatory of Economic Complexity, 2020), so we assumed that all the bran after milling was returned to the rice–livestock system as animal feed. In addition, soil information for the dominant rice systems in each region was collected from a multi-year-location field trial network of N response conducted by INIA (Table 1).
Pasture data
The country forage base is composed of native grassland, semi-natural pastureland, and temporary pastureland, averaging 90, 4, and 6%, respectively, following Allen's et al. (2011) classification. Native grassland comprises native grass species, and the other two pasture categories include legumes (Trifolium spp. and/or Lotus spp.) and grasses (Lolium spp. or Festuca spp.). No N fertilizer is applied. We refer to the semi-natural pastureland and temporary pastureland as improved pastures. Natural grassland forage productivity was estimated based on 16 years of remote sensing data for the main ecological regions of the country (Asuaga et al., 2019) and 10 years of remote sensing data for improved pastures (Martínez, 2011). Additional information on dry matter production and botanical pasture composition at different pasture stages and years was taken from a long-term experiment on rice-improved pasture rotations at INIA facilities.
Livestock data
We estimated animal meat production (beef and sheep) and the N accumulated in the animal body as follows. We used long-term data of county annual livestock stock (Dirección Nacional de Contralor de Semovientes, 2004; Sistema Nacional de Información Ganadera, 2022), and monthly reports of the livestock category and live weight of animals received at the abattoir from each county (Instituto Nacional de Carnes, 2020). The latter also includes records of on-farm self-consumption on an annual and county basis. These records were used for animal meat production and N retention calculations. In addition, wool production was included in the meat production calculations under the equivalent meat concept (FAO, 2018). Wool was also included in the N retention calculations considering the country's average wool production of 4 kg animal−1 yr−1 (DIEA Oficina de Estadísticas Agropecuarias, 2020), adjusted to a dry and clean basis and a literature N concentration value of 16% (ARC, 1980). We calculated the animal N recycling as a function of the animal species, the botanical pasture composition, and production, as well as the forage utilization efficiency (including rice straw) and animal internal N use efficiency.
Modeling of missing N data
Despite having good long-term records for calculating the main N pool fluxes, data on soil N losses are scarce and partial in the country. We have recently parameterized and tested the DeNitrification–DeComposition (DNDC) model for different rice rotations (including the rice–pasture–livestock rotation) on a typical rice soil of Uruguay (Castillo et al., 2022). Results showed good agreement between simulated and observed crops and pasture yields, cumulative N rice uptake, and soil NH4-N during flooded conditions, as well as acceptable estimates of N2O emissions during aerobic and anaerobic soil conditions. For this study, we used DNDC to simulate N losses (gaseous NH3 and N2O, and NO in leaching and runoff) in rice–pasture + livestock rotations in each region over the study period. Considering all the rotation phases present in 1 year, we started the modeling for 2004–2005 with first-year rice and second-year rice or pasture, varying the pasture duration as appropriate for each region. Both natural grassland and improved pasture were simulated. The crop parameters set in the DNDC model were as in our previous study (Godinot, Leterme, Vertés, Faverdin, and Carof, Godinot et al.), and the soil data according to the region as in Table 1. Climatic data were obtained from INIA's weather stations in each region.
Data analysis
We conducted simple NBAL analyses following a mass conservation approach, and a full chain NUE analysis for both the component and the system level, as well as for each rotation. For rice, inputs were N in fertilizers, atmospheric N deposition, biological N fixation (BNF), and animal N deposition (AND) occurring during the 6 months before the crop, and outputs of N in grain, gaseous NH3 and N2O, and leached NO. Nitrogen inputs for the livestock component included N from pasture BNF, atmospheric deposition, and rice bran, while outputs were N in animal tissue, gaseous NH3 and N2O, and leached NO. The N output from AND corresponded to feces and urine from the livestock-pasture component of the 6 months before land preparation or chemical fallow. Rice bran is the main feed input used in commercial farms of the rice–livestock system area, so we assumed all the annual production was returned to the livestock component in the same proportion as regionally produced. These N inputs were not considered when analyzing the entire system because they act as an intermediate product between components. Mineralization of soil N and N in the forage was considered in constant recycling and not included in the calculations.
We assessed the trajectories of NUE over the study period using a graphical approach (EU Nitrogen Expert Panel, 2015). The resulting values of N outputs in edible food products in relation to inputs were plotted against defined low and high NUE thresholds and a desirable N target in food products. For rice, defined NUE thresholds were < 90 and >50%, and the crop N target was 80 kg N in grain ha−1 yr−1 (EU Nitrogen Expert Panel, 2015). This crop N target value is in accordance with the average rice yield of the period (8.1 Mg ha−1, 130 g kg−1 humidity) and with the high-yielding rice pasture systems of South America in general (Singh et al., 2017). For the livestock component, NUE thresholds were < 25 and >10, as stated by Gerber et al. (2014), and the defined target N in food products was 3 kg N ha−1 yr−1. This targeted N value is reasonable for extensive grazing systems (Oenema et al., 2016) and similar to the values stated by Kanter et al. (2016) as attainable values for Uruguayan extensive conditions. We set the system boundary as the farm gate given the negligible food import and low product industrialization that typify Uruguay as a net commodity exporter.
For all the assessed parameters, rotations were compared using multiple t-tests with a significance level of 5%. The Satterthwaite procedure was used if variances were not homogenous. Adjusted regressions were analyzed using auxiliary variables to test the equality mean effect of the different groups and the homogeneity regression slope. Analyses were conducted using InfoStat (Di Renzo et al., 2017).
Uncertainties and scenarios analysis
We analyzed data for the average situation of the rice and livestock components and the whole system. The pasture component has the greatest variability, which in turn influences livestock production (forage offer) and the rice component (N recycling), giving uncertainty to our estimations. For example, a survey of different rice–livestock systems in Uruguay (Simeone et al., 2008) has shown that the percentage of improved pastures considered in those systems ranged from 8 to 84% of the total pasture grazing area. The animal productivity of those scenarios ranged from 54 to 355 kg live weight ha−1 yr−1 (148 kg ha−1 yr−1 on average). This indicates that calculations for this study with 34% of improved pastures (Table 1) could be under or overestimated when different percentages of improved pastures are considered. Another source of uncertainty is the amount of N applied to rice.
To assess the effects of these uncertainties, we analyzed three scenarios. First, rice–livestock production rotation on regenerated natural grasslands after rice crop (SGR). Second, the same scenario but with 40 kg N ha−1 fertilizer to rice (SGRN). Third, with 80% improved pastures (SIP). For SGR, we considered a decrease of N output in animal products by 25% based on the stocking rate of extensive livestock systems (Soares de Lima, 2009), which also decreases the N transferred from the livestock component to the rice. For the SIP scenario, we assumed a high meat production of 355 kg live weight ha−1 yr−1 (Simeone et al., 2008) and an extraction rate (ratio of sold animal weight to total animal weight in stock) of 40% (Soares de Lima, 2009). Increased N in rice bran fed to livestock after higher rice yields were allowed.
Results
Rice yield and nitrogen balance
Rice yield reached 8,100 ± 727 kg ha−1 yr−1 with yield gain rates from 66 kg ha−1 yr−1 (HFSR) to 110 kg ha−1 yr−1 (MFMR and LFLR) over the period (Figure 1A). The N fertilization rate also showed increasing trends of 3.6, 2.7, and 2.3 kg N ha−1 yr−1 in HFSR, MFMR, and LFLR, respectively (Figure 1B). The annual increases in N rate were 4.7 (HFSR), 1.2 (MFMR), and 0.9 (LFLR) times the annual increase of N removed in grain yield.
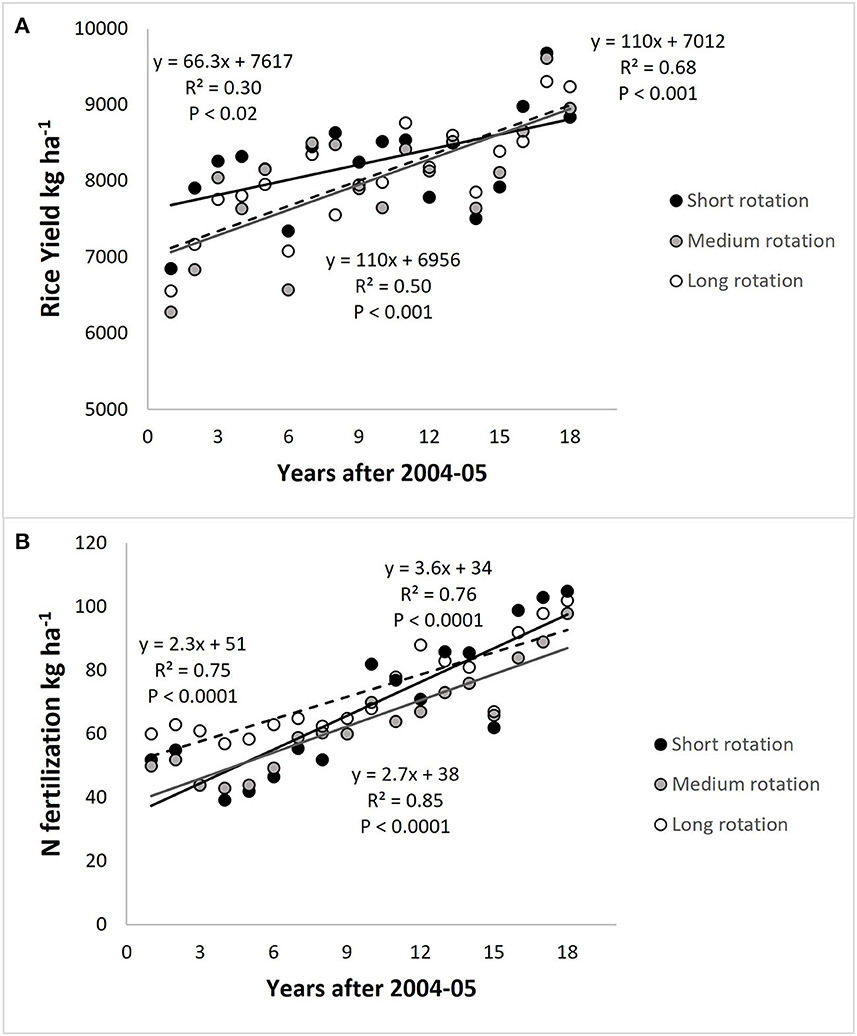
Figure 1. (A) Rice yield and (B) nitrogen fertilization trajectories from 2004–2005 to 2021–2022 growing seasons. HFSR, high fertility and short rotation; MFMR, medium fertility and medium length rotation; LFLR, low to medium fertility and long rotation.
Total N input to rice was greater in LFLR than in HFSR and MFMR (Table 2). The main N input to rice was in fertilizers (73, 70, and 68% of the total N inputs for HFSR, MFMR, and LFLR, respectively), with smaller contributions from BNF and atmospheric deposition. Differences in total N inputs among rotations were due to AND transferred to rice. Total N inputs to pastures were the greatest in HFSR followed by MFMR and LFLR due to the BNF from pastures. This BNF value is linked to the entire pasture area of each region (native grasslands + improved pastures); on average 46 kg ha−1 yr−1 of N was fixed in improved pastures. Similarly, differences in N input from bran are mainly explained by the total area of rice in each region. On average, atmospheric N deposition was very similar among rotations averaging 6 kg N ha−1 yr−1. At the rice–livestock system level, total N inputs for each rotation differed in the order HFSR > MFMR > LFLR.
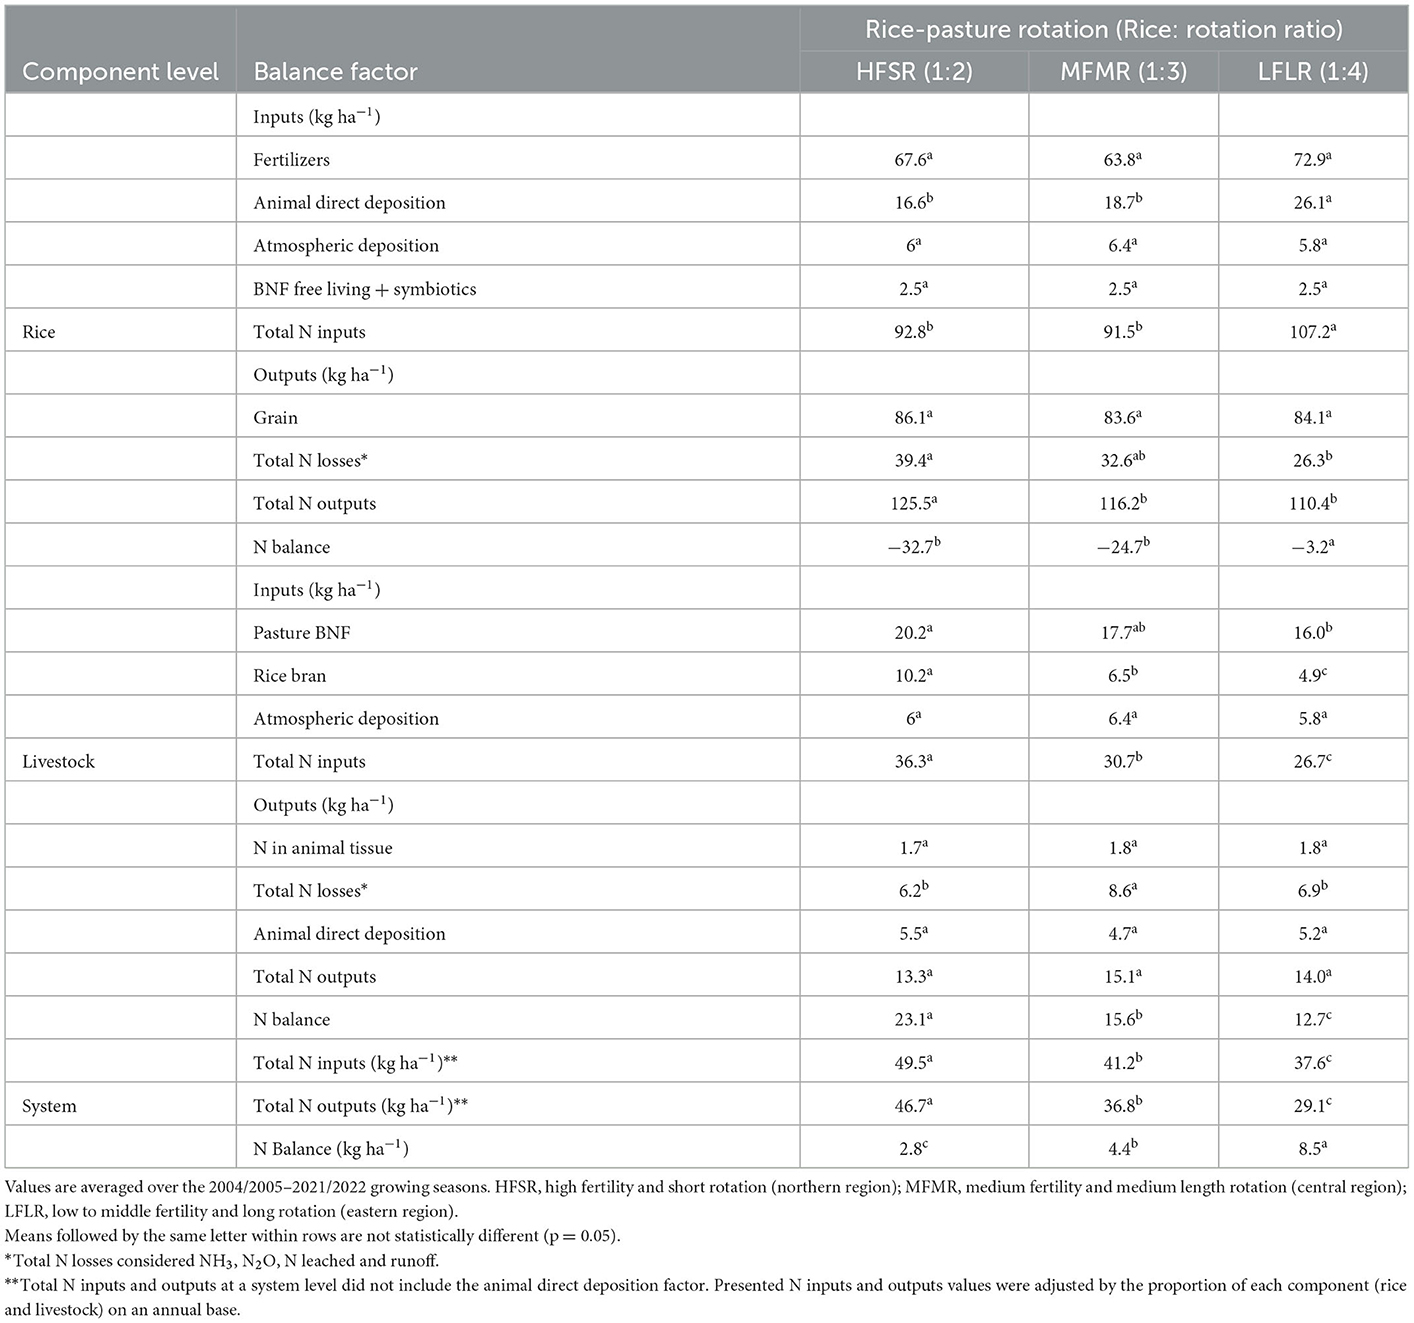
Table 2. Nitrogen balance of each system component and the entire rice–pasture–livestock system.
Total N outputs for the rice component were greater in HFSR than in MFMR and LFLR. Nitrogen in grain was the main output and was similar among rotations, averaging 84.6 kg N ha−1 yr−1, i.e., ~72% of the total N output. Differences in total N output were associated with N losses, which represented 31, 28, and 24% of total N output in HFSR, MFMR, and LFLR, respectively. Volatilization was the main N loss process (97, 91, and 87% in HFSR, MFMR, and LFLR, respectively), followed by denitrification (2, 7, and 8%) and leaching plus runoff (1, 2, and 5%).
The average total N output of the livestock–pasture component was 12% of that of the rice component. Nitrogen losses were the main output averaging 7.2 kg N ha−1 yr−1, followed by the N transferred from the livestock to rice (5.1 kg N ha−1 yr−1), and both outputs varied a little among rotations. Output in animal tissue was only 1.8 kg N ha−1 yr−1. At the system level, total N input and output values were close to each other, resulting in a slightly positive balance. However, the system N balance differed among rotations over the study period. The system NBAL for HFSR increased from −8.5 in 2004/2005–2009/2010 to +2.8 in 2010/2011–2015/2016 and +14.1 kg N ha−1 yr−1 in 2016/2017–2021/2022. By contrast, system N balance for MFMR and LFLR was always positive but decreased over time from 5.7 to 3.8 to 4.2 kg N ha−1 yr−1 in MFMR and from 9.7 to 8.7 to 7.1 kg N ha−1 yr−1 in LFLR over the same periods. For all rotations, the system NBAL was highly correlated with total N inputs of the livestock–pasture component (r = 0.87, 0.82, and 0.75, p < 0.001 for HFSR, MFMR, and LFLR, respectively), mainly due to the amount of N fixed during the pasture phase (r = 0.73, 0.70, and 0.66, p < 0.01 for the same rotations). In addition, the system NBAL was strongly associated with N fertilizer inputs in HFSR (r = 0.86, p < 0.0001).
Full chain-NUE and N surplus analyses
Rice component
The NUE of the rice component was higher in HFSR and MFMR (98 and 94%, respectively), than in LFLR (79%) averaged over the 18 years. The NUE trajectory had two stages in HFSR: first where NUE values exceeded the upper threshold (average 115%), and then when NUE was in the target zone (Figure 2A). This shift happened because of an increase in the N fertilization rate (50 vs. 86 kg N ha−1 yr−1; Figure 1). In the second phase, during 2018 only, the NUE exceeded the threshold due to less N fertilizer application. On average, the total N removed in grain was higher than the desirable N target (80 kg N ha−1 yr−1). For MFMR, 50% of the records were above or around the upper threshold, and the remaining data were in the target zone. Again, the increase in N fertilizer dose explained a constant offset of NUE into the desirable zone (r = −0.73, p < 0.001, Figure 2A).
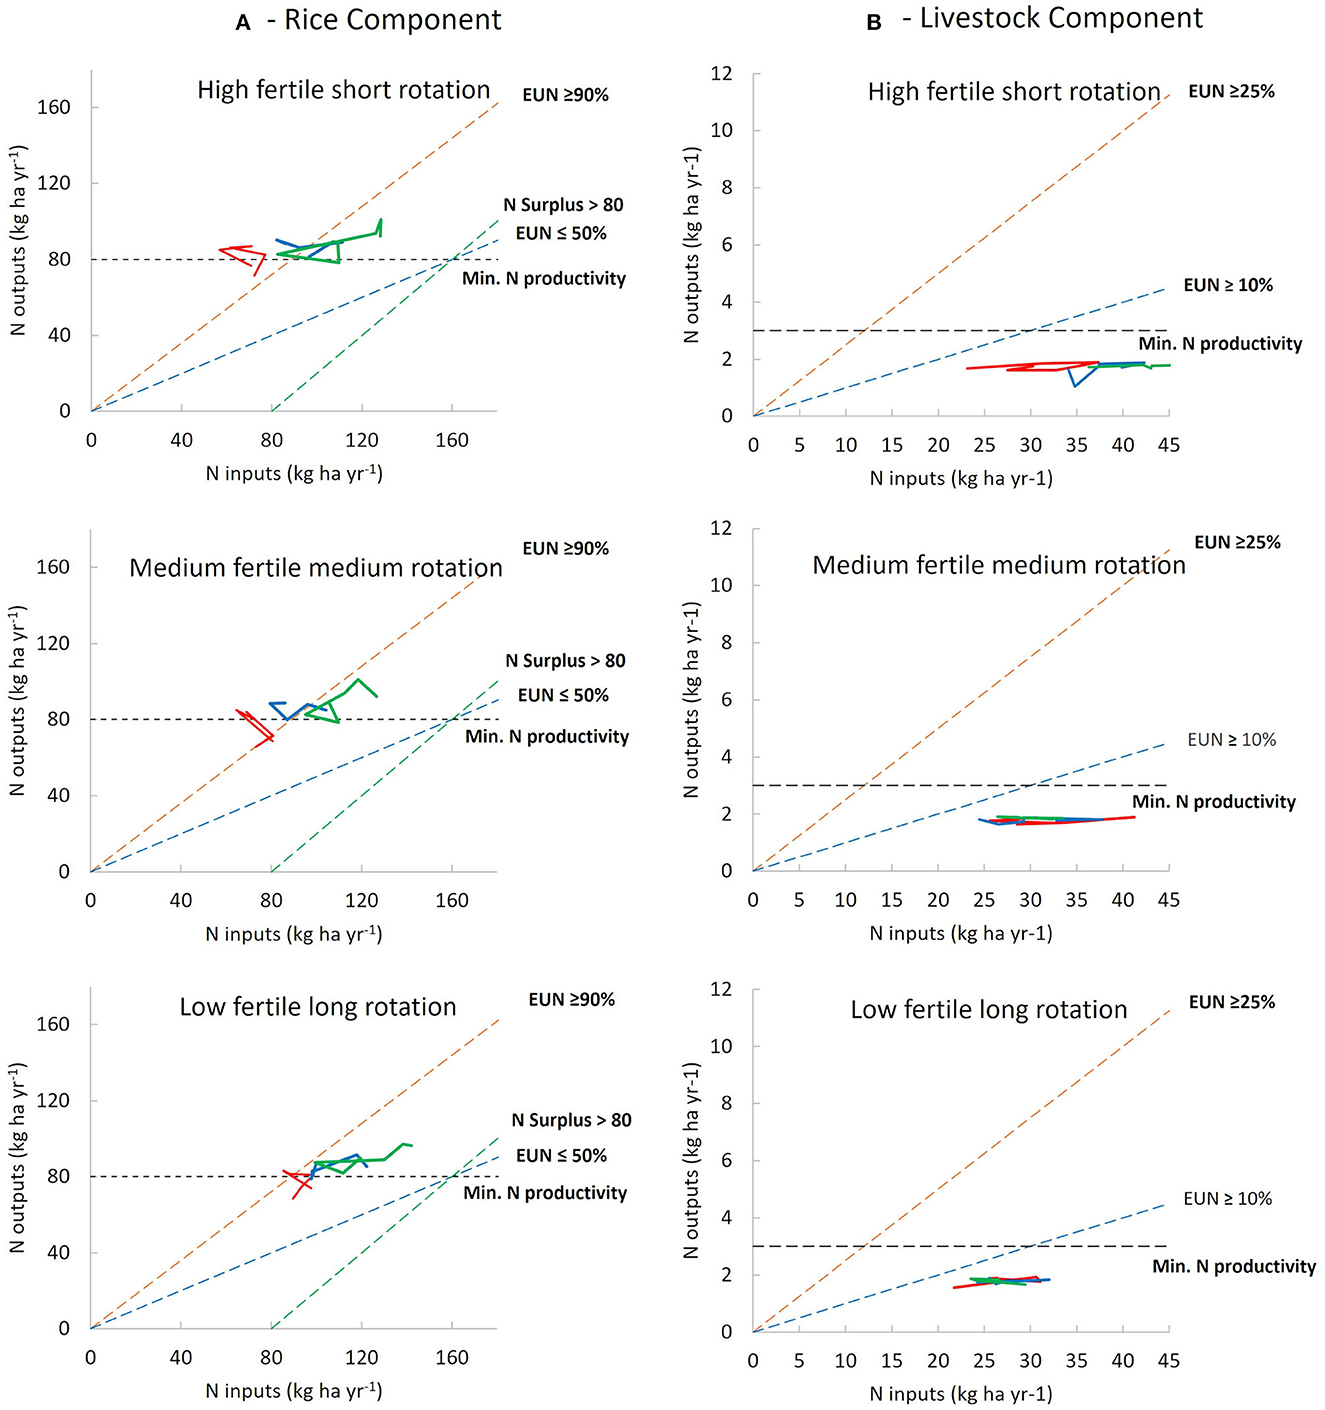
Figure 2. Changes in N outputs in food products vs. N inputs in the 2004–2005 to the 2021–2022 growing seasons for the three regions: (A) rice component and (B) livestock component. Solid red, blue, and green lines indicate changes from 2004–2005 to 2009–2010, 2010–2011 to 2015–2016, and 2016–2017 to 2021–2022, respectively. The dashed orange and blue lines indicate NUE (= outputs/inputs × 100) of 90 and 50%, respectively, for rice and 25 and 10%, respectively, for livestock. The dashed black lines indicate the expected N output for a desirable level of production and the dashed green lines indicate the maximum admissible N surplus.
Unlike the other rotations, 90% of NUE values for LFLR were in the target zone, with an average of 84 kg N ha−1 yr−1 in grain. Here again, the increase in the N fertilizer dose strongly influenced NUE each year (r = −0.80, p < 0.0001), shifting values toward the lower NUE threshold (50%) in the last few years of the study. On average, NSURP in LFLR was higher (23 kg N ha−1 yr−1) than in MFMR and HFSR (8 kg N ha−1 yr−1 and 7 kg N ha−1 yr−1, respectively). However, positive values for NSURP in MFMR and HFSR were observed around the middle of the study period when NUE fell below 100% (Figure 3A). At the end of the study period, NSURP reached 36, 33, and 46 kg N ha−1 for HFSR, MFMR, and LFLR, respectively. As expected, NSURP in rice was positively correlated with N fertilizer in addition to all regions (r > 0.90, p < 0.0001). A negative correlation between NUE and NSURP was found for all rotations (r = −0.97, p < 0.0001). The decline in NUE across the period differed (p = 0.005) between HFSR and LFLR, while MFMR was intermediate. Similarly, the rate of increase in NSURP differed between HFSR and LFLR, with MFMR intermediate (Figure 3A). The different downward trends of NUE and associated upward trends of NSURP matched the different stages of the generalized pathways, as shown in Figure 3C.
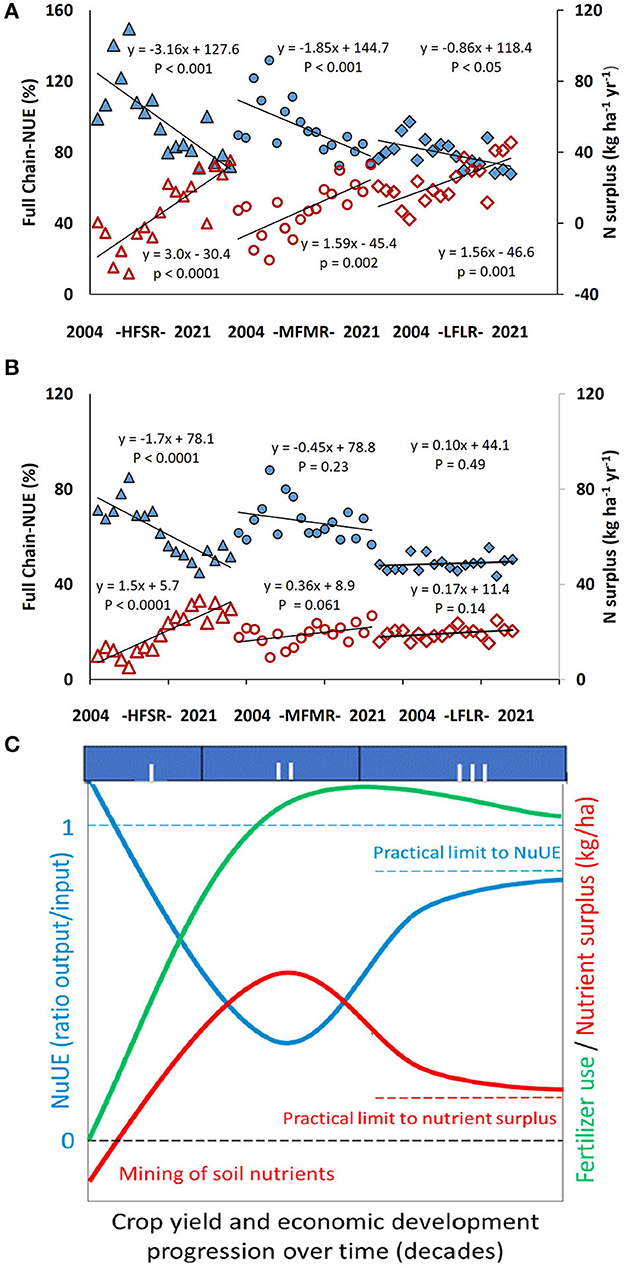
Figure 3. (A) Rice and (B) system N surplus and N use efficiency in 2004–2005 to 2021–2022 growing seasons. Triangles, HFSR (high fertility and short rotation); circles, MFMR (medium fertility and medium length rotation); rhombuses, LFLR (low to medium fertility and long rotation). Blue symbols, system (full chain) NUE and red symbols, system N surplus. (C) Generalized development pathway for N use efficiency and N surplus (after Dobermann et al., 2022).
Livestock component
Livestock NUE values were much lower than those in rice. For the 18-year period, NUE values were 6.8, 6.0, and 4.8% for LFLR, MFMR, and HFSR, respectively. Nitrogen output in animal tissue was almost the same for the different rotations, so differences in NUE were associated inversely with the total N inputs, mainly by pasture BNF (r = −0.80, p < 0.0001), followed by rice N bran (r = −0.72, p < 0.0001). While NUE values for LFLR and MFMR remained flat over time, values for HFSR decreased by ~20% (Figure 2B), explained by an increase in pasture BNF linked to a greater area of improved pastures over time. Both NUE and N in animal products were below the targets (10% NUE and 3 kg N ha−1 animal products, respectively), in all rotations. Records were closer to the lower NUE threshold during the first years in LFLR but more distant in the last few years of HFSR. Unlike rice, the NUE of the livestock component was not associated with NSURP, and both variables remained steady over the study period.
Rice–livestock system
The average annual NUE at the system level was higher in HFSR and MFMR (62 and 67%, respectively), than in LFLR (49%), following the same trend as for the rice component (Figures 3A, B). The annual rate of decrease was higher in HFSR (−1.7%, p < 0.0001) than in MFMR (−0.45 %) and LFLR (0.1%), the latter being basically flat during the study period. The NUE was positively correlated with rice NUE in HFSR (r = 0.91, p < 0.0001) and MFMR (r = 0.80, p < 0.0001), and with livestock NUE in LFLR (r = 0.70, p < 0.001). For HFSR, there was also a negative correlation with the addition of N fertilizer (r = −0.84, p < 0.0001). For NSURP, the annual increase was higher in HFSR (+ 1.5 kg N ha−1 yr−1) than in MFMR (+ 0.36 kg N ha−1 yr−1) and LFLR (+ 0.17 kg N ha−1 yr−1). For all rotations, NSURP was positively correlated with rice N fertilizer addition (r = 0.55, p = 0.018; r = 0.57, p = 0.013, and r = 0.91, p < 0.0001 for LFLR, MFMR, and HFSR, respectively). As for the rice component, the NUE was negatively correlated with NSURP (r = −0.78, −0.92, and −0.98, p < 0.0001 for LFLR, MFMR, and HFSR, respectively).
Scenario analysis
For all rotations, the SGR scenario generated the most negative NBAL and a higher NUE than the original situation in the rice component (Figure 4). That was due to a greater reduction in N inputs (less AND in the absence of improved pastures) than the decrease in N outputs (mainly N in grain and N losses). In the HFSR and MFMR, the NUE was shifted beyond the upper NUE threshold but not in the LFLR rotation. Adding more N fertilizer in the SGRN scenario not only increased N inputs but also increased N outputs, mainly due to greater N losses which increased by 52, 60, and 80% over the original values for HFSR, MFMR, and LFLR, respectively. This resulted in an even more negative NBAL, and all three rotations reached NUE values between 80 and 87%. Total N inputs of the SIP scenario were almost the same as for SGRN but with more N from pasture BNF. However, N losses were lower than in SGRN because less N was added as fertilizer. The NBAL for the SIP scenario was the least negative among the three scenarios, increasing on average by 10 kg N ha−1 yr−1 for HFSR and LFLR and not changing in MFMR. The resulting NUE was 84, 79, and 70% for HFSR, MFMR, and LFLR, respectively. The NSURP was higher in SIP (23, 27, and 43 kg N ha−1 yr−1 for HFSR, MFMR, and LFLR, respectively) than in the other scenarios and rotations (all < 26 kg N ha−1 yr−1).
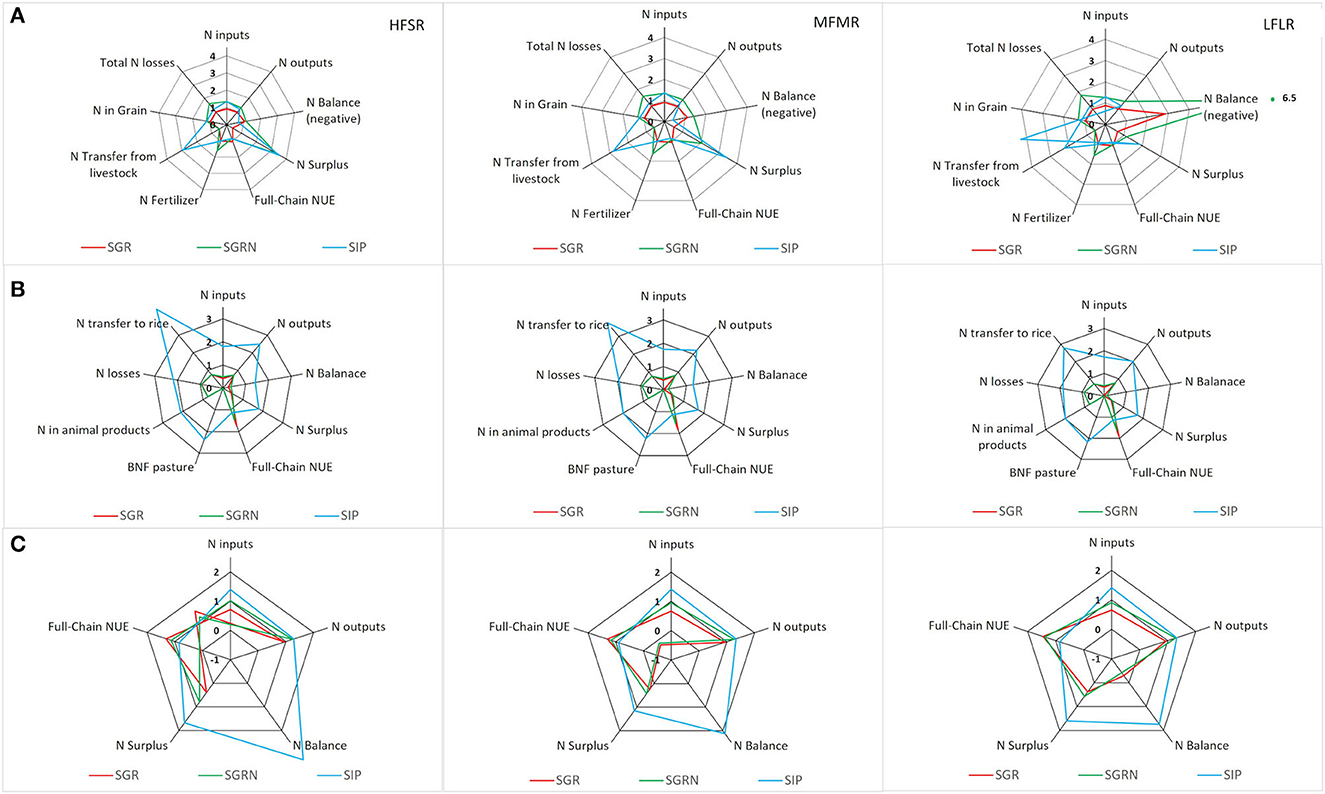
Figure 4. Relative changes of N balance, N inputs N outputs, N surplus, and N use efficiency for three simulated scenarios. The red line represents a rice rotation with grassland (SGR), the green line represents a rice rotation with grassland but adding extra N to the rice crop (SGRN), and the blue line represents a rice rotation with improved pasture on 80% of the total forage area (SIP). (A) Rice component, (B) livestock component, and (C) the entire system. HFSR, high fertility and short rotation; MFMR, medium fertility and medium length rotation; LFLR, low to middle fertility and long rotation.
For the livestock component, the fall in N inputs of the SGR scenario (−40% on average) was explained mostly by the absence of N inputs from pasture BNF. Nitrogen outputs also decreased mainly because of the reduced AND transference to rice (−50% on average), followed by a fall in animal N products (−25%). Because the decrease in N inputs was greater than the decrease in N outputs, NBAL and NSURP decreased in all rotations and NUE increased, reaching values above the lower NUE livestock threshold for MFMR and LFLR, and close to it for HFSR. Increased N fertilization in the SGRN scenario only affected the input from rice bran, which increased the NBAL compared with SGR but was still smaller than in the original situation. As expected, there were greater changes in the SIP scenario due to a substantial increase of N inputs from pasture BNF. However, N outputs from animal N products and N losses also increased, resulting in increases in NBAL and NUE (41, 38, and 43% for NBAL and 14, 11, and 15% for NUE in HFSR, MFMR, and LFLR, respectively).
At a system level and for all rotations, NBAL was negative in SGR and SGRN and positive in SIP. By contrast, NUE was higher in SGR and SGRN and lower in SIP, in the latter case being even below the original situation. The NUE values in the SGR scenario were 32, 30, and 44% higher than in the original situation, while they were decreased by 15, 10, and 14% at SIP for HFSR, MFMR, and LFLR, respectively.
Discussion
Nitrogen balance
We have found regional differences in the N balance of the rice and livestock components as well as of the whole system. The negative N balance in the rice in the more fertile HFSR and MFMR regions differed from the slightly positive balance at the country level in our earlier study (Castillo et al., 2021). But the country-level estimates relied on the literature data and some of these, particularly N volatilization losses, might have been underestimated. The HFSR and MFMR regions should have greater N volatilization losses because of the greater amounts of N cycling from the higher natural soil fertility and proportionally greater N transfer from the livestock component to rice. The N balance was far more negative in HFSR and MFMR rotations when N fertilizer use was lower during the first 5 years (−57 and −30 kg N ha−1 yr−1, respectively). Therefore, the greater precision of this regional analysis is important for correctly understanding the system.
It is likely that the accumulated NBAL before our study period was highly negative because of much lower or no N fertilizer use after the introduction of the rice component. Linking the negative NBAL with the inferred initial N stock based on the soil data, we estimate an average depletion of 10, 8, and 1% of the total N (0.20 m depth) for HFLR, MFMR, and LFLR, respectively. Such mining of soil N is typical of the agriculture of developing countries at the early stages of intensification, but this can be partially reversed with increased N fertilizer doses over time, in turn leading to increased losses and environmental hazards in the long term (Quemada et al., 2020).
How has the Uruguayan rice system been in operation for more than 50 years with consistently high yield levels but only a relatively small addition of N fertilizer? The answer is linked to efficient N cycling from the livestock component. The contributions of N fixed by pastures and N returned in rice bran exceed the relatively low N outputs from the system. The main output was the N lost by volatilization, which was at similar rates to previous reports for Uruguay (Perdomo et al., 2009; FAO, 2018). All rotations reached positive NBALs for the livestock component, which resulted also in positive NBALs for the whole system. Therefore, the livestock component plays a key role in supporting the rice component by offsetting its negative NBAL. Such complementarity between components has been reported in other systems. For example, García-Préchac et al. (2004) showed that during 46 years of the upland crop–pasture rotation in a long-term experiment, soil organic C was depleted during the upland crop phase but recovered in the pasture phase. In each crop–pasture cycle, soil C rose to near the initial C level. Similar results were reported by Macedo et al. (2021), and Carlos et al. (2020) also found the presence of animal pastures in rice rotations was the key to maintaining soil organic C and total N levels.
In the following sections, we discuss how different N balances in each component and the entire system is related to their N use efficiencies and N surpluses, and how the simulated scenarios can inform future improvements of the system.
The whole system N use efficiency and N surplus
In general, the less positive the NBAL, the higher the NUE, reaching values greater than the upper threshold (90%), indicating soil N mining. For HFSR (98%) and MFMR (94%), this is mainly explained by low N fertilizer use during the early years. Some studies in European countries (EU Nitrogen Expert Panel, 2015; Erisman et al., 2018) have shown a trajectory opposite to this, with the NUE moving from very low values toward the desirable target after reducing N inputs and improving N recovery by the crops. In our study, the shift to the target NUE zone in HFSR and MFMR regions was associated with higher N fertilizer rates. In the LFLR region, which had a slightly negative average NBAL, NUE was in the desirable zone for the whole period. The high yield reached by rice in all years and rotations meant that the minimum N target in grain (80 kg N ha−1 yr−1) was achieved, indicating a high contribution of indigenous soil N. However, the trend of increasing N fertilizer rates across the three regions resulted in NUE in rice of 75, 80, and 70 for HFSR, MFMR, and LFLR, respectively, over the last 3 years of the series, which is very close to the desirable 70% NUE value for crop systems (Scientific Panel on Responsible Plant Nutrition, 2020).
By contrast to the rice, the positive NBAL in the livestock component corresponded to a very low NUE (6% on average), much below the defined thresholds (25% > NUE > 10%) but similar to reports from extensive livestock systems, which ranged from 4 to 7% (Gameiro et al., 2019). In addition, the amount of N captured in animal food products (1.8 kg N ha−1 yr−1) was low compared with the target (3 kg N ha−1 yr−1). In our previous study (Castillo et al., 2021), the livestock NUE was within the thresholds because the pasture area data exceeded the typical rice-to-pasture ratio. First, the percentage of the improved pasture area was lower than in this study, and with it, the amount of N fixed by improved legume pastures; and second, the amount of rice bran per hectare was lower because of the greater total pasture area considered. Therefore, lower amounts of both N inputs explained the higher livestock NUE of the previous study. But even though a “too low” NUE is associated with inefficient resource use and could be linked to high N losses to the environment, our study shows how a low-efficiency component (livestock) helps the other system component (rice) reach a very high NUE record. When combined, the entire system reached a high average NUE (62, 67, and 49% for HFSR, MFMR, and LFLR, respectively, for the entire period). These values are higher than reported for other mixed systems, which were ~35–45% (Godinot, Leterme, Vertés, Faverdin, and Carof, Godinot et al.; Westhoek et al., 2014). However, in the last third of the time span analyzed here, system NUE values decreased considerably (51, 63, and 48%) due to greater N fertilizer use.
Increased N fertilizer applications to the rice increase NSURP and decrease NUE in the rice and the complete system in all the rotations. Given that N applications are still increasing, it is possible that NSURP will continue to increase and NUE will decrease. This matches the theoretical trajectory of NUE shown in the scheme in Figure 3C (after Dobermann et al., 2022). It seems that the three rotations are at different parts of Stages I and II in Figure 3C based on the slope of the adjusted regression for NUE and NSURP. While HFLR seems to be in the left upper zone of Stage I for NUE and the bottom zone for NSURP, MFMR, and LFLR are likely to be in the first and approaching middle zone of Stage II. The rate of increase in N fertilizer use over time was HFLR > MFMR > LFLR, while NSURP in the last few years of the series was in the order of LFLR > MFMR = HFLR. The system-level analysis followed the same trends for the rice component. Because the three rotations were apparently in different stages within the NUE development scheme, management changes should consider the initial situation to shift the current scenario to Stage III, trying to avoid Stage II as much as possible. Such an analysis could help to identify the best management practices to be adopted in each region and also be applied to other regions or systems if data of N inputs and outputs be available, as mentioned by Dobermann et al. (2022) when comparing different countries.
Scenario analysis
In some areas, improved pastures provide biologically fixed N to the system, compensating for N exported in grains (Pittelkow et al., 2016; Tseng et al., 2021). However, much of the area has no or very low inclusion of improved pasture species. This increases the importance of N contributed to the rice crop from livestock depositions. Removal of the improved pasture in the SGR scenario caused a greater decrease of N inputs (−9%) than N outputs (−5%) in the rice component, mainly due to less N transferred to rice as animal direct deposition, especially in HFLR (−50%) because of a shorter pasture phase. As a result, NBAL was even more negative and NUE more positive, especially in LFLR. However, the results of this simulation are incomplete to the extent that a continuing negative NBAL would reduce crop yields in the future. In that case, less N removed in grain will decrease NUE and the NBAL will be less negative.
When the NUE indicates N mining, a strategy of N replenishment is recommended (Quemada et al., 2020). Our simulations with increased N application rates (SGRN scenario) showed that after the N fertilizer was increased by 60%, the NUE was improved, shifting the efficiency values from mining into the desirable zone, which also increased the rice yield. However, NBAL and NSURP reached the minimum and maximum values, respectively, associated with a significant increase of 63% in N losses, indicating that a strategy of N replenishment through N fertilizer addition is not a good alternative. Finally, the SIP scenario maintained a similar amount of N input to SGRN but with N fertilizer replaced by BNF. This allowed a higher rice yield than in the original situation (17% on average), lower N losses (15% less on average), and less negative NBALs for all rotations. The only negative trend was the increase of NSURP, as for SGRN but without increased N losses.
The scenario analysis for the livestock component showed similar trends to the rice but differences for SGR and SIP. For SGR, the removal of improved pastures decreased N inputs (40% on average) resulting in reductions in all other parameters related to the NBAL. However, the greatest change was increased NUE (+72, +82, and +91% for HFLR, MFMR, and LFLR, respectively), into or around the targeted efficiency zone (25% < NUE animal systems > 10%). This indicates that if pastures are improved through the inclusion of legumes, an increase in animal productivity brings the NUE within the desirable zone. That was what happened in the SIP scenario where a greater percentage of improved pastures (80%) increased meat productivity by 100%. But because of the higher N inputs from biological fixation, NUE values were just 14% higher on average, reaching values below the lower threshold (10%). In those cases, alternative management toward increasing animal productivity must be applied while avoiding risks associated with very high stocking rates (Lezama and Paruelo, 2022). However, there is still an opportunity to improve animal productivity because the stocking rate of the SIP scenario (1.4 livestock units of 380 kg live weight ha−1) is still far below the standard of improved pastures (Rovira et al., 2020).
In summary, the scenario exploring a stable and greater use of improved legume pastures seems to improve the productivity and N budget of each component and the system. This is close to the proposal of Kanter et al. (2016) and Soares de Lima (2009) who identified improved practices to increase livestock productivity and indirectly the crop component. But we also believe that there is room for improved integrated management of the rice–livestock system to lead the system into an intensified and sustainable future.
Conclusion
The Uruguayan rice–livestock system is highly efficient and productive, with relatively low N fertilizer inputs and low N surpluses across the regions and rotations. In all the regions, this system is sustainable in terms of N balance because of the complementarity of the livestock and rice components. This could be challenged if either or both components were to intensify without considering the whole system. For this, a good quantification of all the components of the N balance combined with modeling tools can help to design future strategies. Improvements in livestock productivity and efficiency could be achieved by adjusting pasture lengths in regions with shorter pasture rotations and increasing the proportion of improved legume pastures. This could also contribute to greater rice yields without more N fertilizer use. Fine-tuning the system could also help to reduce greenhouse gas emissions and other costs associated with fertilizers use.
Data availability statement
The original contributions presented in the study are included in the article/Supplementary material, further inquiries can be directed to the corresponding author.
Author contributions
JC: conceptualization, visualization, data acquisition, curation, interpretation, analysis, modeling, and drafting of the manuscript. GK, SH, MR, and JC: critical thinking and discussion, and writing-review and editing. All authors listed contributed directly to the manuscript and approve this work for publication.
Funding
JC was funded by a Ph.D. studentship from the National Institute for Agricultural Research (INIA) of Uruguay. Rothamsted Research receives grant-aided support from the Biotechnology and Biological Sciences Research Council (BBSRC) of the United Kingdom. Support in writing up this work was funded by the Institute Strategic Programme (ISP) grant Soil to Nutrition (BBS/E/C/000I0310 and BBS/E/C/000I0320) at Rothamsted Research. The contributions by MR were also funded by the Natural Environment Research Council (NERC) under research program NE/W005050/1 AgZero+: Toward sustainable, climate-neutral farming. AgZero+ was an initiative jointly supported by NERC and BBSRC. GK was funded through the BBSRC Research Grant BB/P02274X/1.
Conflict of interest
Authors declare that the research was conducted in the absence of any commercial or financial relationships that could be construed as a potential conflict of interest.
Publisher's note
All claims expressed in this article are solely those of the authors and do not necessarily represent those of their affiliated organizations, or those of the publisher, the editors and the reviewers. Any product that may be evaluated in this article, or claim that may be made by its manufacturer, is not guaranteed or endorsed by the publisher.
Supplementary material
The Supplementary Material for this article can be found online at: https://www.frontiersin.org/articles/10.3389/fsufs.2023.1104229/full#supplementary-material
References
Allen, V. G., Batello, C., Berretta, E. J., Hodgson, J., Kothmann, M., Li, X., et al. (2011). An international terminology for grazing lands and grazing animals. Grass Forage Sci. 66, 2–29. doi: 10.1111/j.1365-2494.2010.00780.x
ARC (1980). The Nutrient Requirements of Ruminant Livestock: Technical Review. Behalf of the Agricultural Research Council by the Commonwealth Agricultural Bureaux. Slough
Asuaga, A., Oyarzábal, M., Galansino, P., and Berterretche, M. (2019). “Productividad forrajera de campos naturales estimada a partir de inforamación satelital en veintiún ambientes edáficos: calibración de un modelo,” in Uso Sostenible del Campo Natural, eds A. Asuaga, and M. Berterretche (INIA-Instituto Nacional De Investigación Agrpecuaria), 77–108. Available online at: http://inia.uy/Publicaciones/Paginas/publicacionAINFO-59975.aspx (accessed October 14, 2020).
Baiyeri, P. K., Foleng, H. N., Machebe, N. S., and Nwobodo, C. E. (2019). “Crop-Livestock interaction for sustainable agriculture,” in Innovations in Sustainable Agriculture, eds M. Farooq, and M. Pisante (Cham: Springer Nature), 557–582. doi: 10.1007/978-3-030-23169-9_18
Blanco, P., Roel, Á., Deambrosi, E., Bonilla, C., Cantou, G., and Molina, F. (2010). “Closing the yield gap in rice production in Uruguay : impact of technological changes,” in 28th International Rice Research Conference. (Hanoi).
Brewer, K. M., and Gaudin, A. C. M. (2020). Potential of crop-livestock integration to enhance carbon sequestration and agroecosystem functioning in semi-arid croplands. Soil Biol. Biochem. 149, 107936. doi: 10.1016/j.soilbio.2020.107936
Carlos, F. S., Denardin, L. G. O., Martins, A. P., Anghinoni, I., de Faccio Carvalho, P. C., Rossi, I., et al. (2020). Integrated crop–livestock systems in lowlands increase the availability of nutrients to irrigated rice. Land Degrad. Dev. 31, 2962–2972. doi: 10.1002/ldr.3653
Castillo, J., Kirk, G. J. D., Rivero, M. J., Dobermann, A., and Haefele, S. M. (2021). The nitrogen economy of rice-livestock systems in Uruguay. Glob. Food Sec. 30, 100566. doi: 10.1016/j.gfs.2021.100566
Castillo, J., Kirk, G. J. D., Rivero, M. J., Fabini, G., Terra, J. A., Ayala, W., et al. (2022). Measured and modelled nitrogen balances in lowland rice-pasture rotations in temperate South America. Front. Sustain. Food Syst.
De Faccio Carvalho, P. C., Savian, J. V., Chiesa, T., Della, De Souza Filho, W., Terra, J. A., Pinto, P., et al. (2021). Land-use intensification trends in the rio de la plata region of south america: toward specialization or recoupling crop and livestock production. Front. Agric. Sci. Eng. 8, 97–110. doi: 10.15302/J-FASE-2020380
Di Renzo, J., Casanoves, F., Balzarini, M., Gonzalez, L., Tablada, M., and Robledo, C. (2017). InfoStat Software Estadístico: Versión 2017.
DIEA Estadísticas Agropecuarias (2005). Encuesta Arrocera 2004/05. Serie Encuestas 230. DIEA Estadísticas Agropecuarias. (Montevideo).
DIEA Estadísticas Agropecuarias (2022). Resultados de la Encuesta de Arroz “ Zafra 2021/22.” Available online at: https://www.gub.uy/ministerio-ganaderia-agricultura-pesca/comunicacion/noticias/diea-presenta-resultados-encuesta-arroz-zafra-202122 (accessed August 17, 2022).
DIEA Oficina de Estadísticas Agropecuarias (2020). Anuario Estadístico Agropecuario 2020. Ministerio de Ganaderia Agricultura y Pesca, Editorial Hemisferio Sur. Oficina de Estadísticas Agropecuarias. Available online at: https://descargas.mgap.gub.uy/DIEA/Anuarios/Anuario2020/ANUARIO2020.pdf (accessed June 15, 2021).
Dirección Nacional de Contralor de Semovientes (2004). Datos Generales de la Declaración Jurada Ante DICOSE al 30 de Junio de Cada año—Año 2004. Ministerio de Ganaderia Agricultura y Pesca. Available online at: https://www.gub.uy/ministerio-ganaderia-agricultura-pesca/datos-y-estadisticas/datos/datos-generales-declaracion-jurada-ante-dicose-30-junio-cada-ano-ano-2004-total-nacional (accessed June 03, 2020).
Dobermann, A., Bruulsema, T., Cakmak, I., Gerard, B., Majumdar, K., Mclaughlin, M., et al. (2022). Responsible plant nutrition : a new paradigm to support food system transformation. Glob. Food Sec. 33, 100636. doi: 10.1016/j.gfs.2022.100636
Erisman, J. W., Leach, A., Bleeker, A., Atwell, B., Cattaneo, L., and Galloway, J. (2018). An integrated approach to a nitrogen use efficiency (NUE) indicator for the food production-consumption chain. Sustainability. 10, 925. doi: 10.3390/su10040925
EU Nitrogen Expert Panel (2015). Nitrogen Use Efficiency (NUE)-an Indicator for the Utilization of Nitrogen in Agriculture and Food Systems. EU Nitrogen Expert Panel. Wageningen, Netherlands.
FAO (Ed.). (2018). Nutrient Flows and Associated Environmental Impacts in Livestock Supply Chains. Guidelines for Assessment (Version 1). Rome: FAO.
Galloway, J. N., Townsend, A. R., Erisman, J. W., Bekunda, M., Cai, Z., Freney, J. R., et al. (2008). Transformation of the nitrogen cycle: recent trends, questions, and potential solutions. Science 320, 889–892. doi: 10.1126/science.1136674
Gameiro, A. H., Bonaudo, T., and Tichit, M. (2019). Nitrogen, phosphorus and potassium accounts in the Brazilian livestock agro-industrial system. Reg. Environ. Change 19, 893–905. doi: 10.1007/s10113-018-1451-2
García, F., Lanfranco, B., and Hareau, G. G. (2009). “rice production in uruguay : technical change options under a general equilibrium framework,” in Twelfth Annual Conference on Global Economic Analysis “Trade Integration and Sustainable Development: Looking for an Inclusive World,” (Santiago de Chile), 1–34.
García-Préchac, F., Ernst, O., Siri-prieto, G., and Terra, J. A. (2004). Integrating no-till into crop—pasture rotations in Uruguay. Soil Tillage Res. 77, 1–13. doi: 10.1016/j.still.2003.12.002
Garrett, R. D., Niles, M., Gil, J., Dy, P., Reis, J., and Valentim, J. (2017). Policies for reintegrating crop and livestock systems: a comparative analysis. Sustainability 9, 473. doi: 10.3390/su9030473
Gerber, P. J., Uwizeye, A., Schulte, R. P. O., Opio, C. I., and de Boer, I. J. M. (2014). Nutrient use efficiency: a valuable approach to benchmark the sustainability of nutrient use in global livestock production? Curr. Opin. Environ. Sustain. 9, 122–130. doi: 10.1016/j.cosust.2014.09.007
Giménez, A., Castaño, J. P., Olivera, L., Califra, Á., Petraglia, C., and Baethgen, W. E. (2011). “Análisis de la introducción del cultivo de arroz en la cuenca del río cuareim utilizando un sistema de información geográfica, imágenes satelitales y modelos de simulación,” in XIII Conferencia Iberoamericana En SIstemas de Información Geográfica. (Toluca, Estado de México).
Godinot, O., Leterme, P., Vertés, F., Faverdin, P., and Carof, M. (2015). Relative nitrogen efficiency, a new indicator to assess crop livestock farming systems. Agronom. Sustain. Develop. 35, 857–868. doi: 10.1007/s13593-015-0281-6
Hilimire, K. (2011). Integrated crop/livestock agriculture in the united states : a review. J. Sustain. Agric. 35, 376–393. doi: 10.1080/10440046.2011.562042
Instituto Nacional de Carnes (2020). Toda la Información. Available online at: https://www.inac.uy/innovaportal/v/17550/10/innova.front/toda-la-informacion (accessed November 12, 2020).
Kanter, D. R., Schwoob, M. H., Baethgen, W. E., Bervejillo, J. E., Carriquiry, M., Dobermann, A., et al. (2016). Translating the sustainable development goals into action: a participatory backcasting approach for developing national agricultural transformation pathways. Glob. Food Sec. 10, 71–79. doi: 10.1016/j.gfs.2016.08.002
Lanfranco, B., Saldías, R., Penengo, C., and Ferraro, B. (2018). Setting transformational pathways consistent with post-2015 SDGs: The case of Uruguay rice sector. 30th ICAE Conference “Agriculture in an Interconnected World”, Interntional Association of Agicultural Economists, (IAAE), Vancouver, BC, Canada.
Lassaletta, L., Billen, G., Grizzetti, B., Garnier, J., Leach, A. M., and Galloway, J. N. (2014). Food and feed trade as a driver in the global nitrogen cycle: 50-year trends. Biogeochemistry 118, 225–241. doi: 10.1007/s10533-013-9923-4
Lezama, F., and Paruelo, J. M. (2022). Regional Assessment of Stocking Rate Effects on Uruguayan Rangelands: A Ranch-Level Study. Rangeland Ecol. Manag. 82, 58–65. doi: 10.1016/j.rama.2022.02.005
Macedo, I., Pravia, M. V., Castillo, J., and Terra, A. (2021). Soil organic matter in physical fractions after intensification of irrigated rice-pasture rotation systems. Soil Tillage Res. 213, 105160. doi: 10.1016/j.still.2021.105160
Martínez, M. (2011). Cuánto produce un campo de las sierras del este y cúal sería la estrategia de manejo con cría vacuna? Rev. Plan Agropecuario 138, 56–59. Available online at: https://www.planagropecuario.org.uy/web/148/revistas/mayo-2011-n°138.html (accessed July 02, 2020).
Observatory of Economic Complexity (2020). Uruguay (URY) Exports, Imports, and Trade. The Observatory of Economy Complexity. The World's Leading Data Visualization Platform for International Trade Data. Available online at: https://oec.world/en/profile/country/ury#top (accessed July 18, 2020).
Oenema, O., Brentrup, F., Lammel, J., Bascou, P., Billen, G., Dobermann, A., et al. (2016). Nitrogen Use Efficiency (NUE) - an indicator for the utilization of nitrogen in agriculture and food systems. Encycloped. Appl. Plant Sci., 1, 278–284. doi: 10.1016/B978-0-12-394807-6.00138-6
Perdomo, C., Irisarri, P., and Ernst, O. (2009). Nitrous oxide emissions from an Uruguayan argiudoll under different tillage and rotation treatments. Nutr. Cycl. Agroecosyst. 84, 119–128. doi: 10.1007/s10705-008-9231-x
Peterson, C., Deiss, L., and Gaudin, A. (2020). Commercial integrated crop-livestock systems achieve comparable crop yields to specialized production systems : a meta-analysis. PLoS ONE 15, e0231840. doi: 10.1371/journal.pone.0231840
Pittelkow, C. M., Zorrilla, G., Terra, J., Riccetto, S., Macedo, I., Bonilla, C., et al. (2016). Sustainability of rice intensification in Uruguay from 1993 to 2013. Glob. Food Sec. 9, 10–18. doi: 10.1016/j.gfs.2016.05.003
Quemada, M., Lassaletta, L., Jensen, L. S., Godinot, O., Brentrup, F., Buckley, C., et al. (2020). Exploring nitrogen indicators of farm performance among farm types across several European case studies. Agric. Syst. 177, 102689. doi: 10.1016/j.agsy.2019.102689
Rovira, P., Ayala, W., Terra, J., Garc, F., Harris, P., Lee, M. R. F., et al. (2020). The ‘ palo a pique ' long-term research platform : first 25 years of a crop – livestock experiment in Uruguay. Agronomy 10, 441. doi: 10.3390/agronomy10030441
Russelle, M. P., Entz, M. H., and Franzluebbers, A. J. (2007). Reconsidering integrated crop-livestock systems in North America. Agron. J. 99, 325–334. doi: 10.2134/agronj2006.0139
Saxton, K., and Willey, P. (2006). “The SPAW model for agricultural field and pond hydrologic simulation,” in Watershed Models, eds V. Singh, and D. Frevert (CRC Press), 401–435. doi: 10.1201/9781420037432.ch17
Scientific Panel on Responsible Plant Nutrition (2020). A New Paradigm for Plant Nutrition. Issue Brief 01. Issue Brief 01. Scientific Panel on Responsible Plant Nutrition. Available online at: www.sprpn.org (accessed August 22, 2022).
Simeone, Á., Andregnette, B., and Buffa, J. I. (2008). “Variables que afectan el resultado físico y aconómico de la ganadería en los sistemas arroz-pasturas del este,” in Producción De Carne Eficiente En Sistemas Arroz- Pasturas, eds Á. Simeone, B. Andregnette, and J. I. Buffa (Montevideo, Uruguay: Instituto Nacional de Investigació́n Agropecuaria (INIA)), 19–39.
Singh, V., Zhou, S., Ganie, Z., Valverde, B., Avila, L., Marchesan, E., et al. (2017). “Rice production in the Americas,” in Rice Production Worldwide, eds B. S. Chauhan, K. Jabran, and G. Mahajan (Cham: Springer), 137–168.
Sistema Nacional de Información Ganadera (2022). Declaración Jurada Anual De Existencias 2020-2021. Datos Actualizados Basados En La Declaración Jurada de Existencias DICOSE–SNIG 2021. Available online at: https://www.gub.uy/ministerio-ganaderia-agricultura-pesca/datos-y-estadisticas/datos/datos-actualizados-basados-declaracion-jurada-existencias-dicose-snig-2021 (accessed June 30, 2022).
Soares de Lima, J. M. (2009). Modelo bioeconómico para la evaluación de impacto de la genética y otras variables sobre la cadena cárnica vacuna en Uruguay (Tesis Doctoral). Departamento de Estadística e Investigación Operativa Aplicadas y Calidad, Universidad Politécnica de Valencia, Valencia, Spain.
Sutton, M., Bleeker, A., Howard, C., Bekunda, M., Grizzetti, B., de Vries, W., et al. (2013). Our Nutrient World. The Challenge to Produce More Food and Energy With Less Pollution. Centre for Ecology and Hydrology. Edinburgh, UK.
Thorne, P. S. (2007). Environmental health impacts of concentrated animal feeding operations : anticipating hazards–searching for solutions. Environ. Health Perspect. 115, 296–297. doi: 10.1289/ehp.8831
Tseng, M. C., Roel, A., Macedo, I., Marella, M., Terra, J. A., Zorrilla, G., et al. (2021). Field-level Factors For Closing Yield Gaps In High-Yielding Rice Systems of Uruguay. Field Crops Res. 264, 108097. doi: 10.1016/j.fcr.2021.108097
Uwizeye, A., de Boer, I. J. M., Opio, C. I., Schulte, R. P. O., Falcucci, A., Tempio, G., et al. (2020). Nitrogen emissions along global livestock supply chains. Nat. Food 1, 437–446. doi: 10.1038/s43016-020-0113-y
Van Zanten, H. H. E., Van Ittersum, M. K., and De Boer, I. J. M. (2019). The role of farm animals in a circular food system. Glob. Food Sec. 21, 18–22. doi: 10.1016/j.gfs.2019.06.003
Vogel, E., Martinelli, G., and Dalzotto, F. (2021). Environmental and economic performance of paddy field-based crop-livestock systems in Southern Brazil. Agric. Syst. 190, 103109. doi: 10.1016/j.agsy.2021.103109
Westhoek, H., Lesschen, J. P., Rood, T., Wagner, S., De Marco, A., Murphy-Bokern, D., et al. (2014). Food choices, health and environment: effects of cutting Europe's meat and dairy intake. Glob. Environ. Change 26, 196–205. doi: 10.1016/j.gloenvcha.2014.02.004
Wolfe, E. C. (2011). “Interaction between crop and livestock activities in rainfed farming systems,” in Rainfed Farming Systems, eds P. Tow, I. Cooper, I. Pertridge, and C. Birch (Wagaa, NSW: Springer), 271–298. doi: 10.1007/978-1-4020-9132-2_11
Keywords: rice-pasture rotations length, nitrogen budgets, nutrient balance, full-chain NUE, NUE development pathway
Citation: Castillo J, Kirk GJD, Rivero MJ and Haefele SM (2023) Regional differences in nitrogen balance and nitrogen use efficiency in the rice–livestock system of Uruguay. Front. Sustain. Food Syst. 7:1104229. doi: 10.3389/fsufs.2023.1104229
Received: 21 November 2022; Accepted: 12 January 2023;
Published: 14 February 2023.
Edited by:
Sudhakar Srivastava, Banaras Hindu University, IndiaReviewed by:
Arvind Kumar Dubey, University of Nebraska, United StatesSaurabh Yadav, Hemwati Nandan Bahuguna Garhwal University, India
Copyright © 2023 Castillo, Kirk, Rivero and Haefele. This is an open-access article distributed under the terms of the Creative Commons Attribution License (CC BY). The use, distribution or reproduction in other forums is permitted, provided the original author(s) and the copyright owner(s) are credited and that the original publication in this journal is cited, in accordance with accepted academic practice. No use, distribution or reproduction is permitted which does not comply with these terms.
*Correspondence: Jesús Castillo,  amVzdXMuai5jYXN0aWxsby12ZWxhenF1ZXpAY3JhbmZpZWxkLmFjLnVr