 Tzodoq Obrero Magbanua
 Janice Alano Ragaza
95% of researchers rate our articles as excellent or good
Learn more about the work of our research integrity team to safeguard the quality of each article we publish.
Find out more
SYSTEMATIC REVIEW article
Front. Sustain. Food Syst. , 16 March 2023
Sec. Aquatic Foods
Volume 7 - 2023 | https://doi.org/10.3389/fsufs.2023.1103263
This article is part of the Research Topic Innovative, Non-Conventional Ingredients for Sustainable Aquafeeds View all 5 articles
One of the most widely cultivated species in the aquaculture sector is the Nile tilapia (Oreochromis niloticus). However, the rising price of fishmeal has a huge impact on its market value. Proteins derived from plants have been used to address the issue. In this study, systematic review and meta-analysis were used to quantitatively analyze the whole-body composition and growth of Nile tilapia fed pea meal. Based on the preferred reporting items for systematic reviews and meta-analysis methods, the literature review and paper selection were completed. Meta-analysis was performed on the data from peer-reviewed studies that met the inclusion screening requirements, namely: tilapia development stage, standard error reporting, feeding period, lack of nutritional supplements, and crude protein levels. The control diet outperformed the plant-based diets according to the result, in which growth and feed utilization characteristics were significantly different (P < 0.05). All except the final weight were significantly better (P < 0.05) in tilapia fed control compared to tilapia fed pea treatment. Additionally, the pooled estimate of whole-body composition of fish fed a diet based on pea meal was not substantially different from that of fish fed a diet based on fishmeal (P > 0.05). Due to large and statistically significant I2 values, the feeding interval, crude protein concentration, fish development stage, and dietary pea meal inclusions were all examined using meta-regression analysis to identify the sources of heterogeneity. Not all co-variates explained the heterogeneity except for the feeding period and crude protein % in some of the parameters. The minimum quantities of dietary pea meal needed for best Nile tilapia performance in terms of growth, feed utilization, and whole-body composition were found to be 4.9, 488.6, and 210.3 g kg−1, respectively.
Tilapia cultivation is claimed to be profitable because it uses fish species that are disease-resistant and only requires modest upkeep. Several species of tilapia can breed and grow in a variety of environments, reaching a marketable size of 600–900 g in just about 6 months (Fitzsimmons, 2000; Yue et al., 2016). In fact, global tilapia output in 2017 totaled 4.13 million tons, valued at $7.61 billion (Tacon, 2019).
Due to its high protein content and balanced ratio of key amino acids, commercially available fishmeal has been used as the primary protein source in fish diets. The utilization of alternative protein sources such as plant-based proteins have been rapidly adapted mainly due to the low supply and high demand for fishmeal (FM). Although plant-based proteins are less expensive than FM, they lack critical amino acids and have a protein-sparing effect, which reduce feed resource consumption when fed at greater doses (El-Sayed, 1999; Gonzales et al., 2007; Hardy, 2010; Daniel, 2017). To address this, the use of proteases may eliminate anti-nutritional hindrances from plant-based proteins (Francis et al., 2001; Daniel, 2017).
Pea (Pisum sativum) is a common fishmeal replacement for marine and freshwater organisms. Pea meal contains moderate amounts of protein with limited lysine and methionine contents and high levels of carbohydrates (Gatlin et al., 2007). It also contains nutrient-limiting compounds like oligosaccharides and alkaloids. In a study by Santiago et al. (2002), pea meal can substitute 10–50% fishmeal in Nile tilapia Oreochromis niloticus diets without negatively affecting feed efficiency and feeding activity. Moreover, weight gain and survival rate of the tilapia were seen similar across treatments. Feed conversion and protein efficiency ratios were also found unaffected by replacing 92% of fishmeal with soybean meal, copra, and rice bran in a 2:1:1 ratio and supplemented with pea meal in increasing concentrations.
The utilization of pea meal in freshwater fish farming is not well-known and well-studied. Aside from Nile tilapia, limited data on pea meal-based protein diets identified its digestibility in shrimps (Davis et al., 2002; Bautista-Teruel et al., 2003; Cruz-Suarez, 2013), Atlantic salmon Salmo salar (Overland et al., 2009), milkfish (Borlongan et al., 2003), Asian sea bass Lates calcarifer (Ganzon-Naret, 2019) and rainbow trout Oncorhynchus mykiss (Burel et al., 2000; Thiessen et al., 2003). Moreover, there are limited studies on pea meal plant proteins as fishmeal replacement in the diets of Nile tilapia. Aside from the lack of data, available studies on pea meal plant proteins have reported different and conflicting optimum inclusion levels.
Growth response studies on fishmeal replacement with plant-based proteins mainly used percent weight gain (%WG), protein efficiency ratio (PER), condition factor (CF), and specific growth rate (SGR) as parameters (Figueiredo-Silva et al., 2015; Mamauag et al., 2019; Dileep et al., 2021) to evaluate fish growth. Meanwhile, whole-body composition gives a nutritional preview of the protein, ash, moisture, and lipid contents of whole-body of the fish. Data from the whole-body composition is used as a numerical basis for growth to estimate the diet utilization of the fish.
There are only a few studies available that used systematic review and meta-analysis to identify the effects of diets on the overall growth and health response of cultured fish (Novriadi, 2017; Luthada-Raswiswi et al., 2021; Reverter et al., 2021; Thepot et al., 2021). Moreover, these studies focused on identifying the effects of different practical protein sources on the growth of several fish species. These studies showed that practical diets were sufficient for proper fish growth. However, as of date, there has been no systematic review and meta-analysis performed on the dietary pea meal inclusion.
The present study quantifies the overall growth performance and whole-body composition of Nile tilapia O. niloticus fed pea meal via systematic review and meta-analysis. It aims to determine the favorable inclusion levels of pea meal-based proteins and the effects of different feeding factors on the response of Nile tilapia. Meta-analysis reported the heterogeneity across related literatures and postulated a pooled result.
Preferred reporting items for systematic reviews and meta-analysis (PRISMA) search strategy was used in this study. Related literatures from 1960 to 2022 were covered using the following search engines: EBSCO Discovery Search–Ateneo de Manila University, Google Scholar, Wiley Online Library, Taylor and Francis, and Scopus. Only studies on pea meal as fishmeal replacement were included. The keywords used for the search engines were fishmeal, pea meal, fishmeal replacement, Nile tilapia, and fish feed. To maintain high quality and reliability, only peer-reviewed studies (Ahn and Kang, 2018) in English language were included in this study. The inclusion criteria set for the search were: gradual pea meal replacement for fish meal in Nile tilapia diet; sufficient growth parameters (i.e., %WG, PER, SGR, and final weight) with standard errors; whole-body composition data expressed as mean values ± standard errors; at least a duration of 6 weeks for the feeding trial; presence of a fishmeal-based diet as control; absence of plant protein mixtures; absence of supplementation of amino acids, other supplements or additives, and enzymes; clear indication of the development life stage of the Nile tilapia; and iso-nitrogenous test diets with a range of 30–45% crude protein.
The established selection criteria included considerations that directly affects the overall fish performance. Standard errors were required for meta-analysis in each variable. Six weeks of feeding duration was set as the minimum standard for feed testing. A control made of fishmeal was added to serve as a benchmark for the modifications made by the test diets. Studies that included crystalline amino acids, exogenous enzymes, probiotics, or any other supplements and additives were removed from the selection due to their direct effects fish performance. Finally, diets that adhered to the Food and Agriculture Organization's criteria for the percentage of dietary crude protein in each development life stage of the Nile tilapia were chosen.
The means and standard deviations of all data for growth and whole-body composition were treated using Hedge's g (Novriadi, 2017) in determining the estimated effect of pea meal on Nile tilapia. The data gathered on SGR, feed conversion ratio (FCR), %WG, PER, and final weight were used to evaluate the overall fish growth. On the other hand, protein, lipid, moisture, and ash contents as variables were used for whole-body composition. I2 and p-value for Q statistic was used to identify heterogeneity between studies in each analysis. The level of significance was set to 0.05. All calculations were done using STATA v.15 software.
Meta-regression analysis was conducted using the random-effect model to estimate the summary effect or the standard mean difference (SMD). The identified covariates were feeding period, crude protein content, fishmeal inclusion level, fish development life stage, and the inclusion level of dietary pea meal. The selected covariates were considered exogenous and endogenous factors in which their values vary from one study to another that may cause heterogeneity. The minimum required pea meal levels were derived using meta-regression models. It was identified when the SMD of covariate is at most zero. This would mean that after this point, the dietary pea meal has statistically better performance than the control. The STATA v.15 software was used for all calculations in the entire study.
A total of 1,675 search results were gathered from the five search engines as shown in Figure 1. There were eight studies removed due to duplication, 1,581 studies due to different subjects and variables evaluated while 81 did not pass the criteria during abstract assessment and two studies did not have sufficient data needed. A total of three papers (Santiago et al., 2002; Schulz et al., 2007; Hussin et al., 2010) were included for the meta-analysis on the effects of dietary pea meal on the growth response and whole-body composition of Nile tilapia.
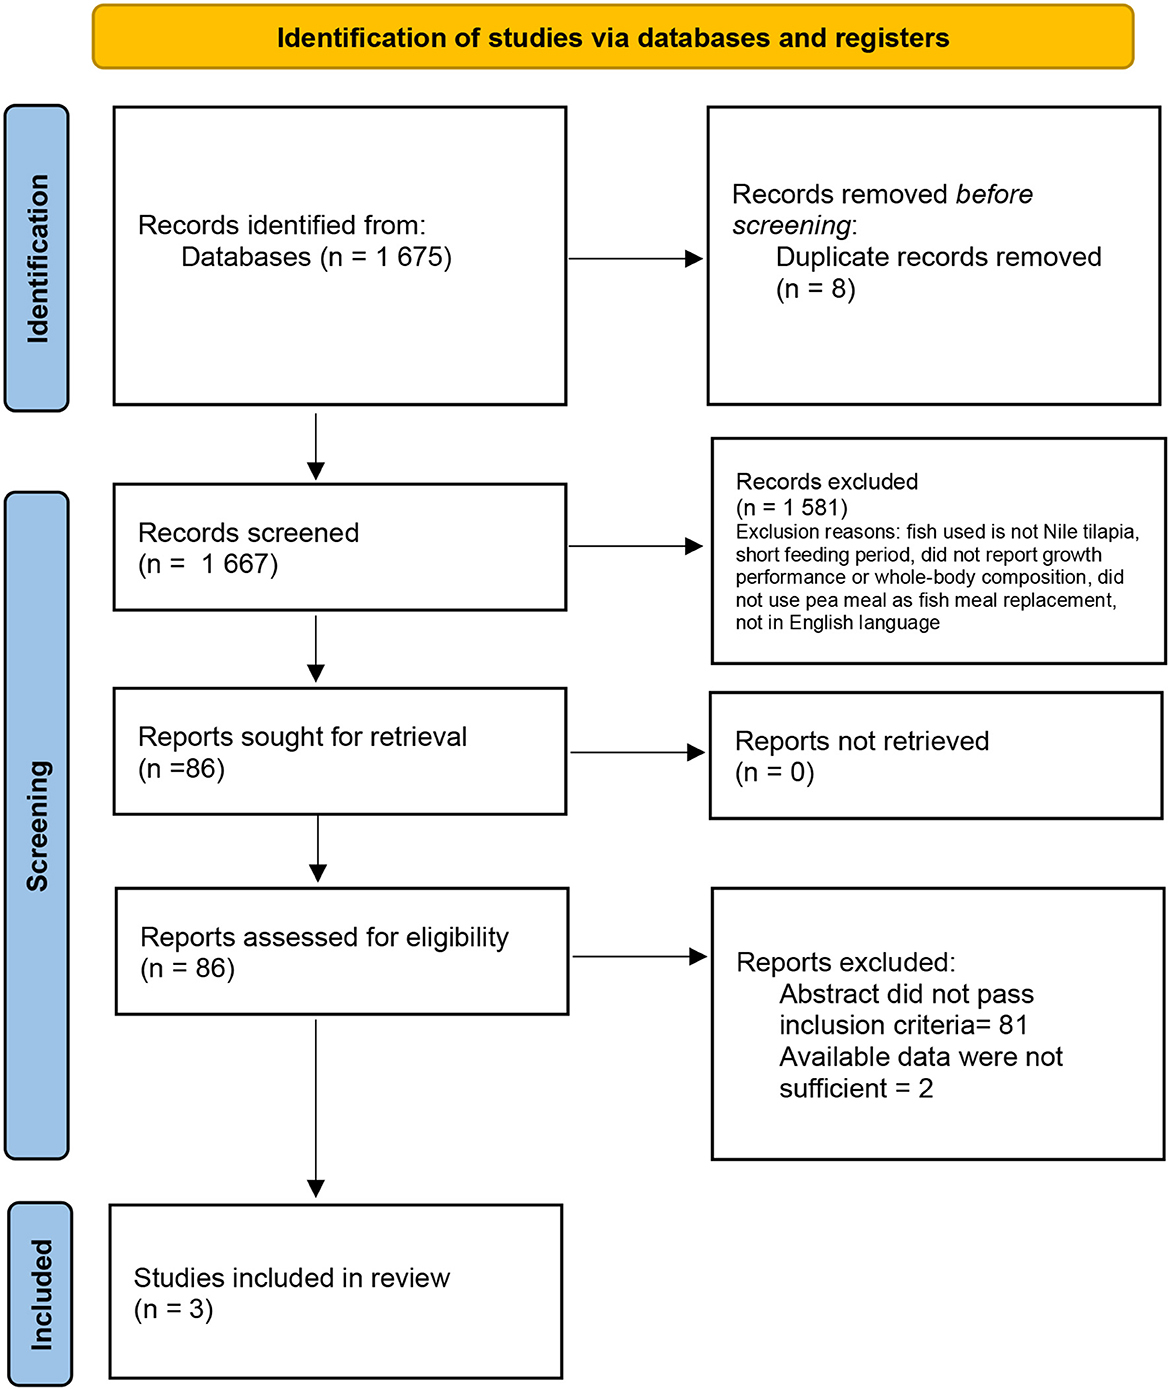
Figure 1. Literature search and inclusion of related studies on pea meal as fishmeal replacement for Nile tilapia O. niloticus diet.
Based on the results (Table 1), all the growth response and feed utilization variables were significantly different (P ≤ 0.05) between the control and pea treatment. All variables except final weight were significantly better (P ≤ 0.05) in tilapia fed control compared to tilapia fed pea treatment. The mean final weight of tilapia fed pea treatment was higher by 3.4 g compared to tilapia fed control. For whole-body composition, none of the responses were significant (P > 0.05). The mean values for whole-body ash, protein, and lipid compositions were not significantly different (P > 0.05) between tilapia fed control and tilapia fed pea treatment.
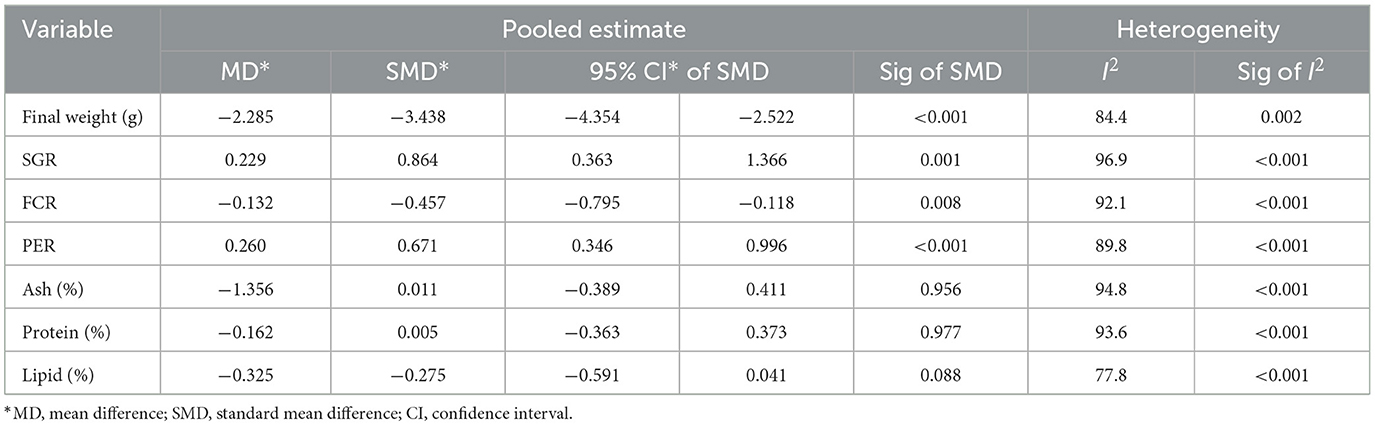
Table 1. Pooled estimate and heterogeneity of pea meal treatment meta-analysis.
Forest plots visually show the effect sizes estimated in each study and their respective weight contributions. The solid vertical line at zero indicates statistical significance of estimates, such that lines that pass through this mark imply no significance. The dashed vertical line indicates the pooled or overall estimate. Each study is represented by a shaded square whose size depends on the weight contribution. A larger square means higher weight. The horizontal lines attached to the square represents the length of the confidence interval. Lastly, the pooled or overall estimate is represented by a diamond.
All the selected studies showed higher tilapia final weight (Figure 2) when fed pea treatment. The study with the largest contribution was that of Hussin et al. (2010). Overall, the final weight of the tilapia fed pea treatment was significantly higher (P ≤ 0.05) than that of tilapia fed control diet.
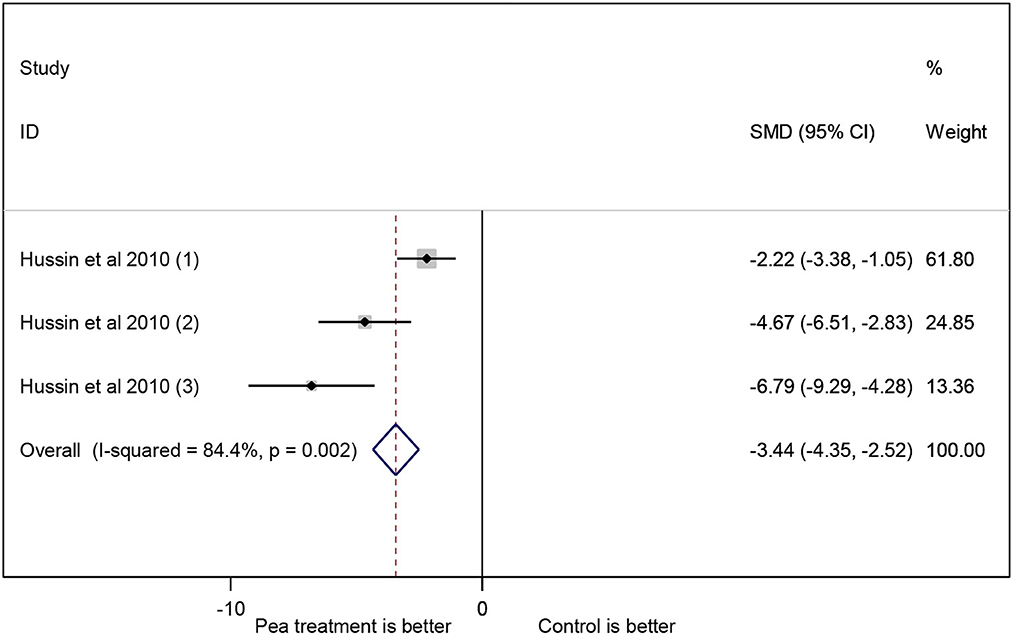
Figure 2. Forest plot of the effect of pea meal on the final weight of Nile tilapia.
Figure 3 shows that in the study of Hussin et al. (2010), where tilapia fed pea treatment has significantly higher SGR. On the other hand, in the study of Schulz et al. (2007), tilapia fed control diet has significantly higher SGR. The study with the largest contribution was that of Schulz et al. (2007). Overall, tilapia fed control diet has significantly higher (P ≤ 0.05) SGR.
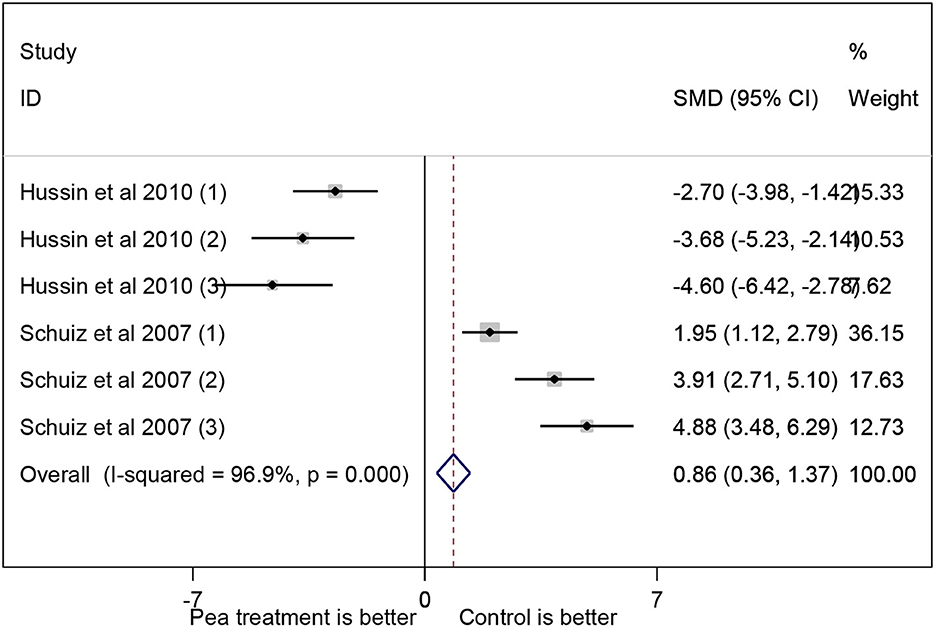
Figure 3. Forest plot of the effect of pea meal on the SGR.
Six out of the 11 studies reported lower FCR in tilapia fed pea treatment compared to tilapia fed control as shown in Figure 4. The study with the largest contribution was that of Hussin et al. (2010). However, overall, tilapia fed control diet has significantly lower (P ≤ 0.05) FCR.
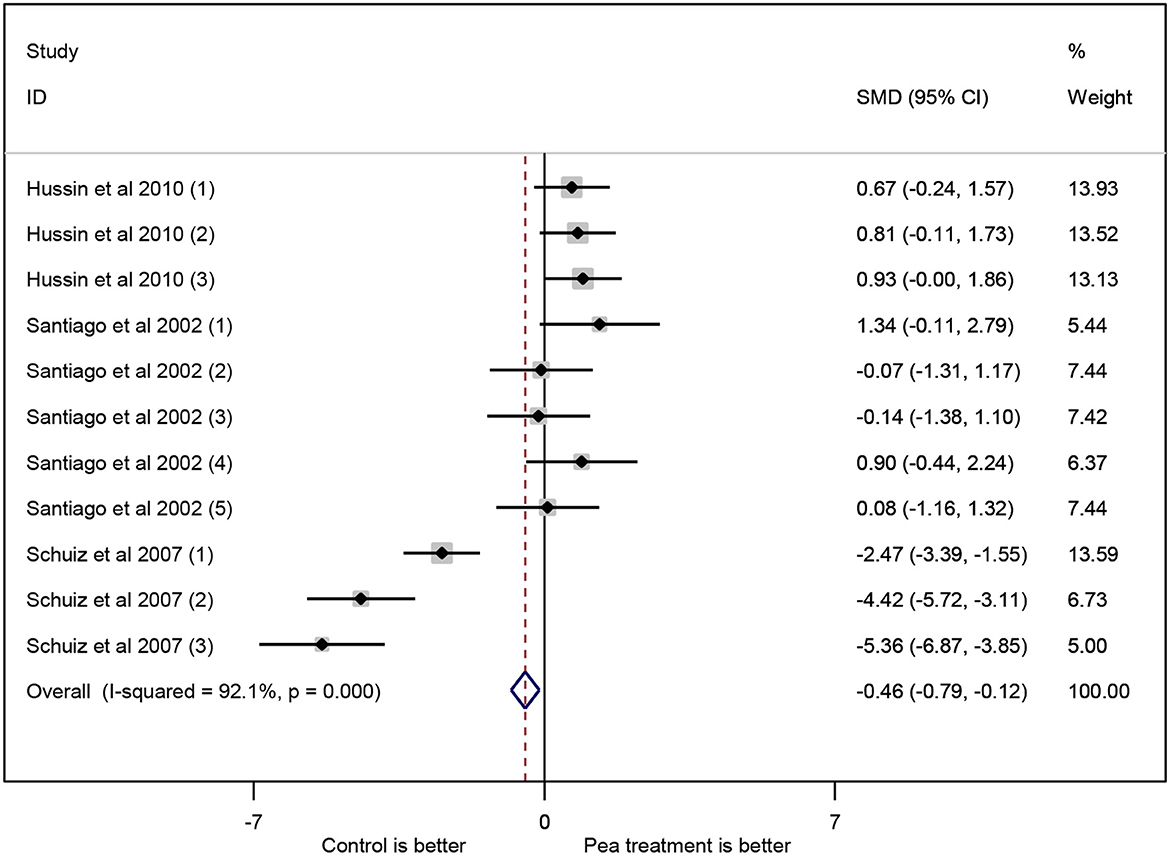
Figure 4. Forest plot of the effect of pea meal on the FCR.
There are included studies that had higher PER values (Figure 5) in tilapia fed pea treatment compared to tilapia fed control. However, the study with the largest contribution was that of Schulz et al. (2007) in which tilapia fed control showed significantly higher (P ≤ 0.05) PER, thus affecting the overall PER value.
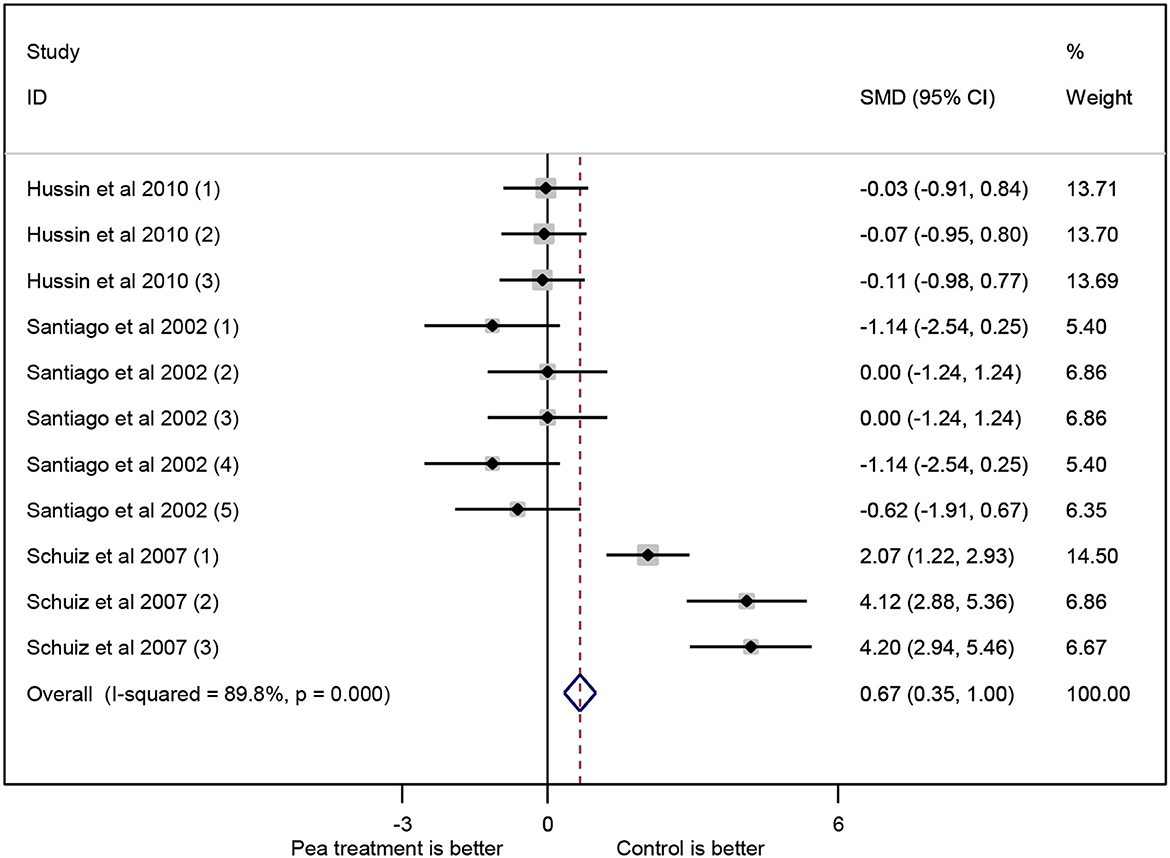
Figure 5. Forest plot of the effect of pea meal on the PER.
All the selected studies except Schulz et al. (2007) showed increased whole-body ash content in tilapia fed pea treatment compared to tilapia fed control (Figure 6). The study with the largest contribution was that of Schulz et al. (2007). Overall, tilapia fed control diet exhibited increased ash composition compared to tilapia fed pea treatment. Nonetheless, this was not statistically significant (P > 0.05). This may imply that the whole-body ash composition was relatively equivalent between tilapia fed control and pea treatment.
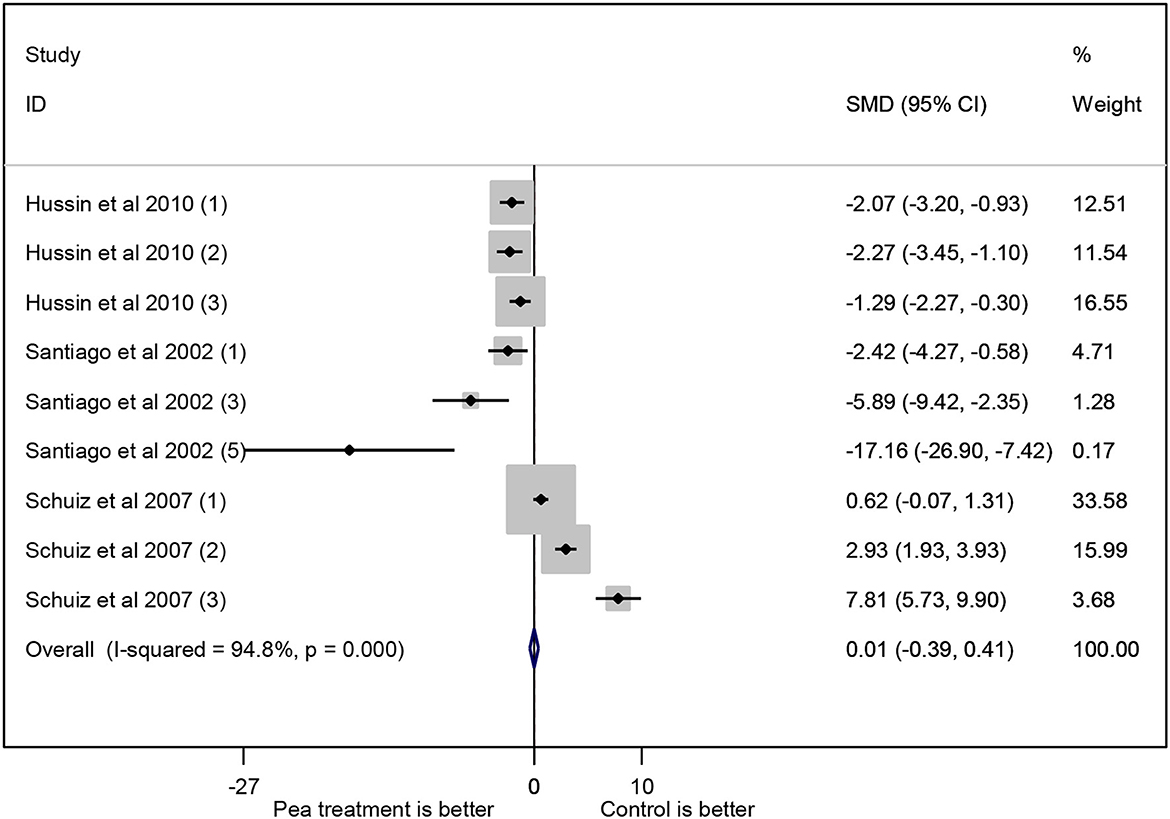
Figure 6. Forest plot of the effect of pea meal on the whole-body ash composition of Nile tilapia.
Most of the studies showed higher whole-body protein content in tilapia fed control compared to tilapia fed pea treatment (Figure 7). The study with the largest contribution was that of Schulz et al. (2007). Overall, tilapia fed control diet exhibited increased protein composition compared to tilapia fed pea treatment, but this is not statistically significant (P > 0.05). It may mean that the whole-body protein composition was relatively equivalent between tilapia fed control and pea treatment.
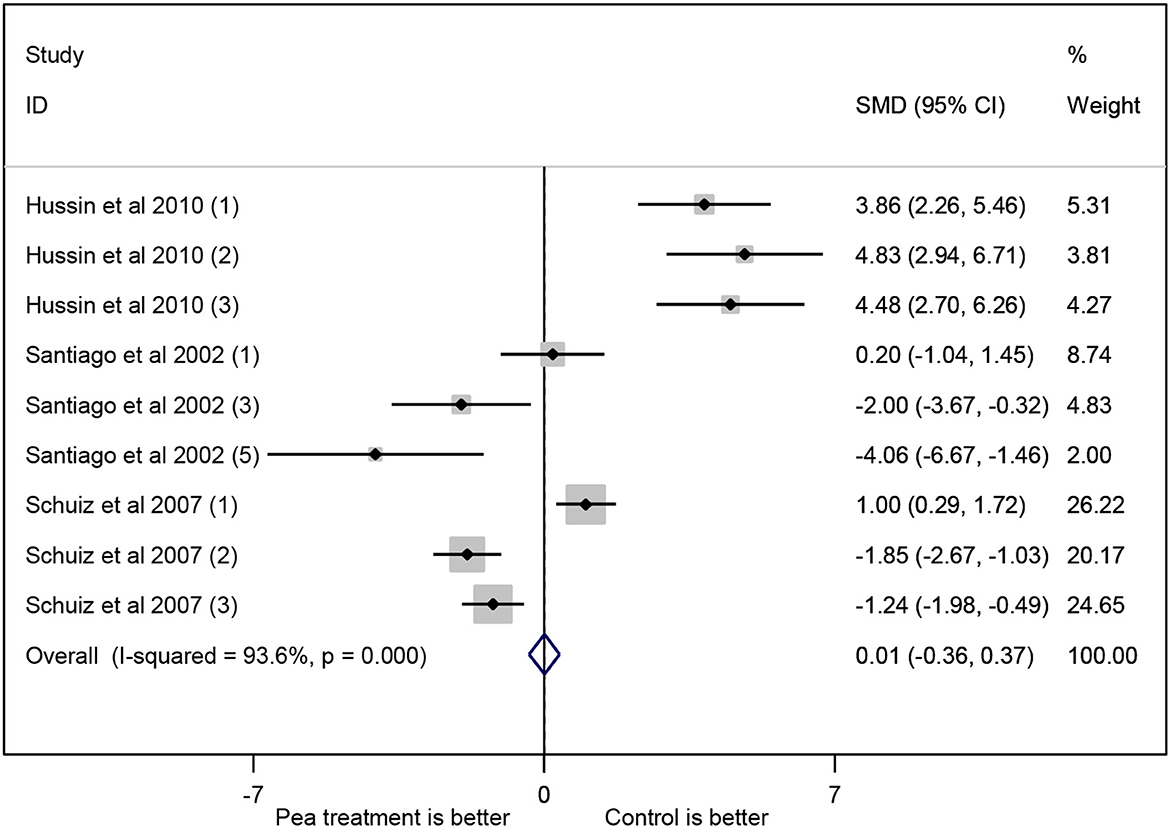
Figure 7. Forest plot of the effect of pea meal on the whole-body protein composition of Nile tilapia.
Most of the studies showed higher whole-body lipid content in tilapia fed pea treatment compared to tilapia fed control (Figure 8). Overall, tilapia fed pea treatment exhibits increased lipid composition compared to tilapia fed control, but this was not statistically significant (P > 0.05). It may mean that the lipid composition was relatively equivalent between tilapia fed control and pea treatment.

Figure 8. Forest plot of the effect of pea meal on the whole-body lipid composition of Nile tilapia.
Heterogeneity tests showed that the SMD of all variables were heterogeneous (Table 1). The differences among the study results were not fully accounted by the analysis. Moreover, there may be other factors that necessitate inclusion for heterogeneity. Thus, meta-regression was performed to determine factors that may have caused the heterogeneity observed.
The moisture content was not included in the meta-analysis because the studies selected reported dry matter only. The values for percent weight gain were also not included because the studies selected did not report any.
For final weight (Table 2), fishmeal had the highest effect. Hence, fishmeal is positively associated to SMD. This means that a higher fishmeal inclusion leads to a higher SMD (approaches positive value). Tilapia fed control is expected to exhibit higher final weight if the fishmeal inclusion in the diet is higher than the dietary pea meal treatment. On the other hand, dietary pea is negatively associated to SMD. A higher dietary pea inclusion leads to a lower SMD (approaches negative value). This means that a higher tilapia final weight is expected when the dietary pea inclusion is higher in tilapia fed pea treatment than the fishmeal treatment. However, even though these factors explain most of the heterogeneity accounted in the final weight, none of these effects were statistically significant (P > 0.05).
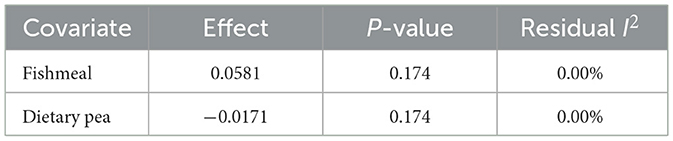
Table 2. Meta-regression for the final weight.
The fish development life stage had the highest effect on SGR (Table 3). A negative value means that Nile tilapia adults had higher SMD. Nile tilapia fingerlings fed control showed higher SGR while Nile tilapia adults fed pea treatment exhibited SGR, and this was statistically significant (P ≤ 0.05). For the quantitative factors, the feeding period and dietary pea inclusion levels had negative effects. Hence, the feeding period and the levels of dietary pea meal are negatively associated to SMD. This means that a longer feeding period or a higher level of dietary pea inclusion leads to a smaller SMD (approaches negative value). Nile tilapia fed pea treatment is expected to exhibit high SGR if the feeding period is longer or if the dietary pea inclusion is higher than the control. On the other hand, the CP% and fishmeal inclusions are positively associated to SMD. This means that a higher CP% or a fishmeal inclusion leads to a higher SMD (approaches positive value). Nile tilapia fed control diet is expected to exhibit high SGR when the CP% of the diet or the fishmeal inclusion is higher. However, only the feeding period and CP% were statistically significant (P ≤ 0.05).
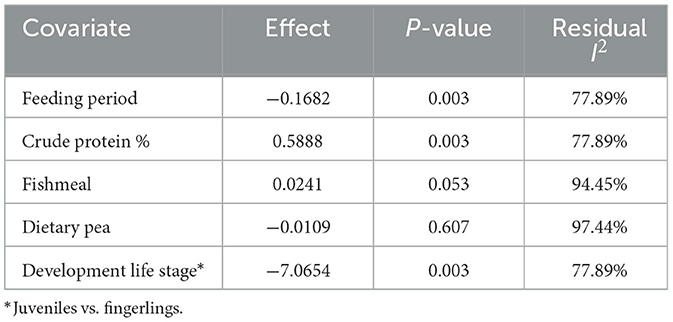
Table 3. Meta-regression for the SGR.
The negative effect of type means that the Nile tilapia adults had higher SMD for FCR (Table 4). Since it approaches a positive value, Nile tilapia adults fed the pea treatment exhibited lower FCR while Nile tilapia juveniles fed control showed lower FCR. For the quantitative factors, the feeding period and dietary pea inclusions had positive effects. Hence, the feeding period and dietary pea inclusion levels are positively associated to SMD. A longer feeding period or a higher dietary pea inclusion leads to a higher SMD (approaches positive value). This means that if the feeding period is longer or if the inclusion of dietary pea is higher than the control, Nile tilapia fed pea treatment is expected to exhibit lower FCR values. On the other hand, the CP% and fishmeal inclusions are negatively associated to SMD. This means that a higher CP% in the diet or a higher fishmeal inclusion leads to smaller SMD (approaches negative value). Nile tilapia fed control is expected to have lower FCR values when the CP% of the diet or the fishmeal inclusion is higher. However, only the CP% effect was statistically significant (P ≤ 0.05).
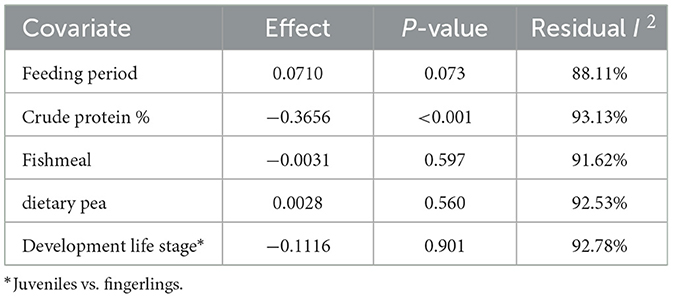
Table 4. Meta-regression for the FCR.
The development life stage had the highest effect on PER (Table 5). A positive value means that the Nile tilapia juveniles had higher SMD. Juvenile tilapia fed control had higher PER while adult tilapia fed pea treatment showed higher PER values. For the other quantitative factors, the CP% of the diet and fishmeal inclusion had positive effects. Hence, the CP% of the diet and fishmeal inclusions are positively associated to SMD. This means that a higher CP% in the diet or a higher fishmeal inclusion leads to a higher SMD (approaches positive value). Nile tilapia fed control has higher PER values if the CP% of the diet or the fishmeal inclusion is higher. The CP% effect on PER was statistically significant (P ≤ 0.05). On the other hand, the feeding period and dietary pea inclusions are negatively associated to SMD. This means that a longer feeding period or a higher dietary pea inclusion leads to smaller SMD (approaches negative value). Nile tilapia fed pea treatment has higher PER when the feeding period is longer or when the level of dietary pea inclusion is higher.
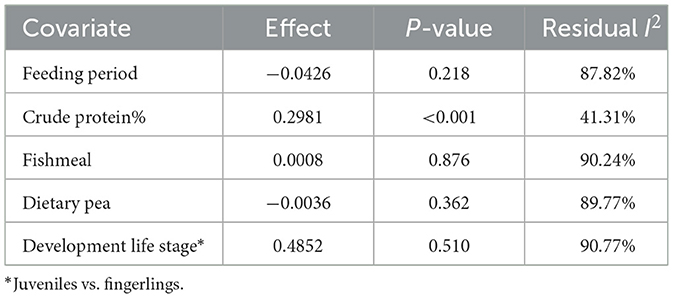
Table 5. Meta-regression for the PER.
Like the PER, the development life stage had the highest effect on whole-body ash composition (Table 6). A positive value means that the juvenile stage had higher SMD. Nile tilapia juveniles fed control had higher whole-body ash content. For the quantitative factors, all except the CP% of the diet had negative effects. Hence, the feeding period or the fishmeal and dietary pea inclusion levels are negatively associated to SMD. This means that a longer feeding period or a higher fishmeal or dietary pea inclusion level leads to a smaller SMD (approaches negative value). Nile tilapia fed pea meal has higher whole-body ash content if the feeding period is longer or if the level of fishmeal or dietary pea inclusion is higher. On the other hand, the CP% of the diet is positively associated to SMD. A higher CP% in the diet leads to a higher SMD (approaches positive value). This means that the whole-body ash composition is higher in Nile tilapia fed control when the CP% of the diet is higher; this effect was statistically significant (P ≤ 0.05).

Table 6. Meta-regression for the whole-body ash composition of Nile tilapia.
The development life stage also had the highest effect on whole-body protein composition (Table 7). A positive value means that Nile tilapia juveniles had higher SMD. This means that Nile tilapia juveniles fed control has higher whole-body protein content, and this effect was statistically significant (P ≤ 0.05). For the quantitative factors, all except the feeding period had negative effects. Hence, the CP% of the diet and fishmeal or dietary pea inclusion levels are negatively associated to SMD. This means that a higher CP% or a higher fishmeal or dietary pea inclusion leads to a smaller SMD (approaches negative value). Nile tilapia fed pea treatment has higher whole-body protein content if the CP% of the diet or fishmeal or dietary pea inclusions is higher. On the other hand, the feeding period is positively associated to SMD. This means that the whole-body protein content in Nile tilapia fed control is expected to increase when the feeding period is longer; this effect was statistically significant (P ≤ 0.05).
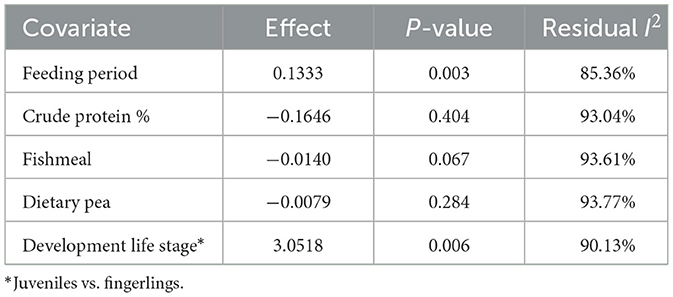
Table 7. Meta-regression for the whole-body protein composition of Nile tilapia.
Similarly, the development life stage showed the highest effect on whole-body lipid composition (Table 8). A negative value means that Nile tilapia adults had higher SMD. Nile tilapia fed control had higher whole-body lipid content while Nile tilapia juveniles fed pea meal showed higher lipid content. For the quantitative factors, the CP% of the diet and fishmeal inclusion had positive effects. Hence, the CP% of the diet and fishmeal inclusion levels are positively associated to SMD. A higher CP% or a higher fishmeal inclusion leads to a higher SMD (approaches positive value). This means that Nile tilapia fed control has higher whole-body lipid content if the CP% of the diet or the level of fishmeal inclusion is higher. On the other hand, the feeding period and the level of dietary pea inclusion are negatively associated to SMD. This means that Nile tilapia fed pea treatment has higher whole-body lipid content when the feeding period is longer or when the dietary pea inclusion level is higher. The effect of feeding period, crude protein %, and level of fishmeal inclusion on tilapia lipid composition were all statistically significant (P ≤ 0.05).
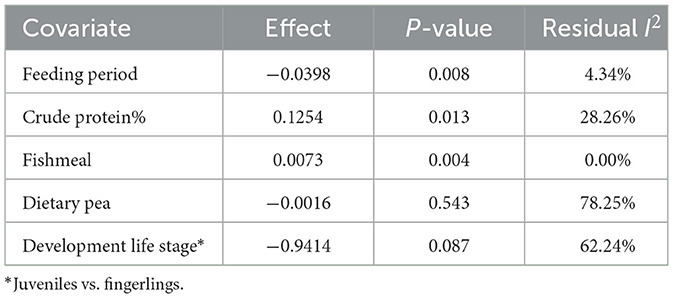
Table 8. Meta-regression for the whole-body lipid composition of Nile tilapia.
Listed in Table 9 are the minimum required levels of dietary pea for each parameter which will result in a negative predicted SMD. If the predicted SMD is negative, it means that the pea treatment is favorable over the control (except for FCR where positive SMD is preferred). The pea meal inclusions of 4.9 to 549.5 g kg−1 favor fish growth and whole-body composition.
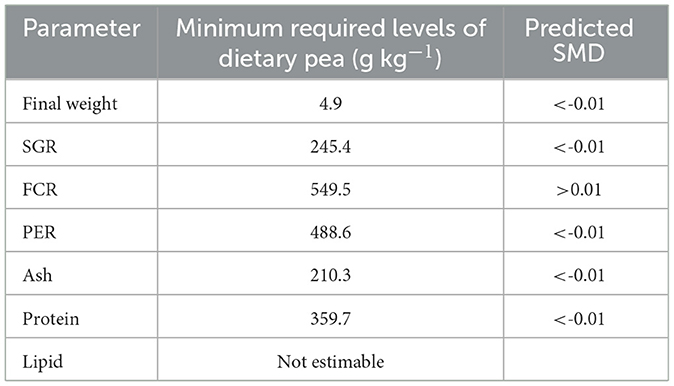
Table 9. Minimum required inclusion levels of dietary pea per variable.
Half of the total aquaculture expenses accounts to feeding with protein as the most expensive (Mzengereza et al., 2014). The industry heavily relies to fishmeal as protein source of fish feed. However, its increasing price directly affects the price of fish in the market. Furthermore, fishmeal production uses food-grade fish that competes with human consumption (Cashion et al., 2017). This negatively impacts the global supply of fish products (Naylor et al., 2000), implying issues related to its sustainability and global food security.
Plant-based protein diets are now utilized to either completely or partially replace fishmeal. Moreover, these proteins are cheaper and readily available. However, the anti-nutritional factors and limiting amino acid contents of plant-based raw materials decrease its full potential as the main protein source (El-Sayed, 1999; Gonzales et al., 2007; Hardy, 2010; Daniel, 2017).
In this study, pea meal was evaluated using systematic review and meta-analysis as a fishmeal replacement for Nile tilapia O. niloticus. The included studies on pea meal as protein source for Nile tilapia diets reported varied results. This paper quantitatively generalizes the effect of pea meal on the overall growth response and whole-body composition of Nile tilapia using peer-reviewed literature.
Except for final weight, growth was significantly different between Nile tilapia fed control and pea meal treatment. Remarkably, the CP% of the diet has a significant positive relationship with the SMD of the growth parameters. This means that with a lower crude protein in the diet, there is an expected increase in the growth parameter values of Nile tilapia fed pea meal treatment. The result agrees with the studies of Bahnasawy (2009) and Carneiro et al. (2017) which showed that Nile tilapia diets containing high crude protein can lead to growth retardation.
The CP% requirement varies depending on the life or development stage of the tilapia. In the present study, one publication was included per tilapia life or development stage. The life or development stages pertain to fingerlings, juveniles, and adults. Each development life stage is differentiated from one another based on the fish weight. There were two publications that reported 30 CP% (Santiago et al., 2002; Hussin et al., 2010) in the diet and one publication (Schulz et al., 2007) reported 42 CP% in the diet. According to Food Agriculture Organization (FAO). (2020), Nile tilapia requires 35–40%, 30–35%, and 28–32% crude protein in the diets for fingerlings, juveniles, and adults, respectively. One study used a diet with more than the required crude protein (i.e., 42%) which may explain the negative effect of CP% on the growth of fish that requires a lower CP%. Moreover, the study by Schulz et al. (2007) contributed the most compared to the rest of the publications as seen in the forest plots of SGR, PER, and the ash and protein contents. This is due to the higher sample size in Schulz et al. (2007) compared to the other publications. The meta-regression results showed that CP% level moderately affected most of the heterogeneity observed from the meta-analysis. The meta-regression also showed that in some parameters including SGR, PER, FCR, lipid and ash composition, the CP% of the diet is significantly affected the SMD values. This means that the manipulation of the CP% in Nile tilapia feeds significantly affects the growth and whole-body composition of the fish, which was likewise shown in the study of Subandiyono and Hastuti (2020).
The optimization of the feed certainly contributes to the growth response of fish. The excess protein in feeds can lead to growth retardation of the fish. The excess energy from the high protein content may result in lipid accumulation which consequently causes the lower feed intake and reduced weight gain Craig and Helfrich (2017). Kim et al. (2016) fed parrot fish (Oplegnathus fasciatus) with increasing levels of crude protein in the diet; the authors showed that higher dietary protein can cause detrimental effects on the growth response and the body composition of parrot fish.
In the current study, the whole-body proximate composition of Nile tilapia fed pea meal was unaffected. Similarly, previous studies on Atlantic salmon (S. salar) (Overland et al., 2009) and gilthead sea bream (Sparus aurata) (Pereira and Oliva-Teles, 2002; Sánchez-Lozano et al., 2009) fed dietary pea meal resulted in unaltered whole-body composition. This may be explained by the nutritional profile of the pea meal used. Pea meal is reported to contain crude protein between 20 and 25% (Abd El-Salam and El-Shibiny, 2016), 70–80% of which are globulins, namely, convicilin, legumin, and vicilin (González-Pérez and Arellano, 2009). Although it has a lower protein content compared to soybean meal, pea meal contains low fat and high starch content that can provide significant energetic value in fish diets (Glencross, 2016).
High heterogeneity is also seen from the meta-analysis; thus, meta-regression was performed. The co-variates were feeding duration, crude protein %, fishmeal level, dietary pea inclusion, and fish life or development stage. Not all co-variates explained the heterogeneity except for the feeding period and crude protein % in some of the parameters. SGR and protein and lipid composition have a significant negative relationship with SMD. It means that the longer the feeding period is, the better the fish performance when dietary pea is used in the diet. Among the three studies included in the meta-analysis, Hussin et al. (2010) conducted the longest feeding duration (i.e., 98 days). Similarly, the longer feeding duration promoted better growth performance of juvenile European sea bass (Dicentrarchus labrax) (Gouveia and Davies, 1998) and juvenile tiger shrimp (Penaeus monodon) (Bautista-Teruel et al., 2003) at 84 and 90 days of feeding, respectively.
Some of the heterogeneity was not explained by the co-variates. Feed preparation, for one, is considered as a possible source of heterogeneity. Several reports suggest that the method used for pea meal preparation affects fish growth performance. For example, the dehulling of peas resulted in significant growth promoting effects on several aquatic species (Booth et al., 2001; Ganzon-Naret, 2019). In another study, dehulled and raw legumes including field pea (P. sativum), faba beans (Vicia faba), chickpeas (Cicer arietinum), and vetch (Vicia sativa) were fed to silver perch Bidyanus bidyanus. Except for faba beans, the dehulling of legumes significantly improved the energy digestibility of the practical diets. Moreover, the protein digestibility was also significantly higher in fish fed dehulled legumes (Booth et al., 2001).
Autoclaving peas can also affect the growth response of fish. In a study, pea meal was dehulled and autoclaved for 5 min and 15 min. When fed to rainbow trout (O. mykiss), dehulled and autoclaved pea meal for 5 min improved apparent digestibility (Hernandez et al., 2010). Hence, dehulling and autoclaving may lead to reduction of anti-nutritional factors present in plant-based ingredients, consequently improving fish performance (Ganzon-Naret, 2019). Although heat treatment can decrease anti-nutritional factors, overheating can also cause protein modification that diminish the suitability of peas as a feed ingredient.
The minimum required levels of dietary pea meal are identified between 4.9 and 549.5 g kg−1. These levels agree with previous studies where dietary pea meal was fed to different fish species. A mixture of lupin seed meal and pea meal protein concentrate did not cause any deleterious effect on the proximate composition of juvenile black sea bream (Sparus macrocephalus) at 500 g kg−1 inclusion level (Zhang et al., 2012). In a separate study, pea protein concentrate can replace fishmeal up to 60% without adverse effects on growth performance and nutrient digestibility of sea bass (Dicentrarchus labrax L.) (Tibaldi et al., 2005).
This study revealed that pea meal is a suitable partial fishmeal replacement in the diets of Nile tilapia. The whole-body composition of the fish was unaffected albeit the growth parameters were statistically higher in control-fed fish. There was high heterogeneity across literatures as shown in the meta-analysis. The study determined that feeding period and crude protein % moderately explained the heterogeneity in some variables via meta-regression. For instance, a longer feeding period and a higher crude protein % in the diet of fish fed pea meal treatment led to higher growth parameter values such as SGR, PER, and whole-body composition, and a lower FCR.
The present study suggests that 4.9, 488.6, and 210.3 g kg−1 are the minimum requirements for dietary pea meal inclusion for optimum growth performance, feed utilization, and whole-body composition of Nile tilapia, respectively. It is suggested to perform actual feeding trials to verify the effect of the identified pea meal protein inclusion levels. Additional covariates for meta-regression analysis are also recommended(i.e., feed preparation techniques and abiotic factors related in fish farming), and an explicit search on Web of Science for additional literatures.
The original contributions presented in the study are included in the article/supplementary material, further inquiries can be directed to the corresponding author.
TM: writing manuscript and analysis. JR: writing and editing manuscript and proofreading. All authors contributed to the article and approved the submitted version.
TM and JR would like to thank the Rizal Library Open Access Journal Publication Grant of the Ateneo de Manila University for the financial assistance and support for the publication fee.
The authors declare that the research was conducted in the absence of any commercial or financial relationships that could be construed as a potential conflict of interest.
All claims expressed in this article are solely those of the authors and do not necessarily represent those of their affiliated organizations, or those of the publisher, the editors and the reviewers. Any product that may be evaluated in this article, or claim that may be made by its manufacturer, is not guaranteed or endorsed by the publisher.
Abd El-Salam, M., and El-Shibiny, S. (2016). “Natural biopolymers as nanocarriers for bioactive ingredients used in food industries,” in Nanotechnology in the Agri-Food Industry, Encapsulation (Cambridge, MA: Academic Press). doi: 10.1016/B978-0-12-804307-3.00019-3
Ahn, E., and Kang, H. (2018). Introduction to systematic review and meta-analysis. Korean J. Anesthesiol. 71, 103–112. doi: 10.4097/kjae.2018.71.2.103
Bahnasawy, M. (2009). Effect of dietary protein levels on growth performance and body composition of monosex nile tilapia, Oreochromis niloticus L. reared in fertilized tanks. Pak. J. Nutr. 8, 674–678. doi: 10.3923/pjn.2009.674.678
Bautista-Teruel, M., Eusebio, P., and Welsh, T. (2003). Utilization of feed pea, Pisum sativum, meal as a protein source in practical diets for juvenile tiger shrimp, Penaeus monodon. Aquaculture 225, 121–131. doi: 10.1016/S0044-8486(03)00284-9
Booth, M. A., Allan, G. L., Frances, J., and Parkinson, S. (2001). Replacement of fish meal in diets for Australian silver perch, Bidyanus bidyanus: IV. Effects of dehulling and protein concentration on digestibility of grain legumes. Aquaculture 196, 67–85. doi: 10.1016/S0044-8486(00)00578-0
Borlongan, I., Eusebio, P., and Welsh, T. (2003). Potential of feed pea (Pisum sativum) meal as a protein source in practical diets for milkfish (Chanos chanos Forsskal). Aquaculture 225, 89–98. doi: 10.1016/S0044-8486(03)00280-1
Burel, C., Boujard, T., Francesca, T., and Kaushik, S. (2000). Digestibility of extruded peas, extruded lupin, and rapeseed meal in rainbow trout (Oncorhynchus mykiss) and turbot (Psetta maxima). Aquacult. 188, 285–298. doi: 10.1016/S0044-8486(00)00337-9
Carneiro, W. F., Pandini, F., Rosa da Silva, L. C., Dena dos Santos, L., Rossato, K. A., and Muerer, F. (2017). Digestible protein requirement for Nile tilapia fed with rations based on soybean meal and corn. Anim. Sci. 39, 343–349. doi: 10.4025/actascianimsci.v39i4.36122
Cashion, T., Le Manach, F., Zeller, D., and Pauly, D. (2017). Most fish destined for fishmeal production are food-grade fish. Fish Fish. 18, 837–844. doi: 10.1111/faf.12209
Craig, S., and Helfrich, L. A. (2017). Understanding Fish Nutrition, Feeds and Feeding (Publication 420–256). Virginia Cooperative Extension, Virginia State University, Yorktown, VA, United States. p. 4.
Cruz-Suarez, L. E. (2013). Incorporation of dietary nitrogen from fish meal and pea meal (Pisum sativum) in muscle tissue of Pacific white shrimp (Litopenaeus vannamei) fed low protein compound diets. Aquacul. Res. 44, 847–859. doi: 10.1111/j.1365-2109.2011.03083.x
Daniel, N. (2017). Status of aquaculture with respect to nutrition and feed. Int. J. Fish Aquat. Stud. 5, 333–345.
Davis, D. A., Arnold, C. R., and McCallum, I. M. (2002). Nutritional value of feed peas (Pisum sativum) in practical diet formulations for Litopenaeus vannamei. Aquaculture 8, 87–94. doi: 10.1046/j.1365-2095.2002.00194.x
Dileep, N., Pradhan, C., Peter, N., Kaippilly, D., Sashidharan, A., and Sankar, T. V. (2021). Nutritive value of guar and copra meal after fermentation with yeast Saccharomyces cerevisiae in the diet of Nile tilapia, Oreochromis niloticus. Trop. Anim. Health Prod. 53, 1–13. doi: 10.1007/s11250-021-02855-4
El-Sayed, A.-F. M. (1999). Alternative dietary protein sources for farmed tilapia, Oreochromis spp. Aquaculture 179:149–168. doi: 10.1016/S0044-8486(99)00159-3
Figueiredo-Silva, C., Lemme, A., Sangsue, D., and Kiriratnikom, S. (2015). Effect of dl-methionine supplementation on the success of almost total replacement of fishmeal with soybean meal in diets for hybrid tilapia (Oreochromis niloticus × Oreochromis mossambicus). Aquacul. Nutr. 21, 234–241. doi: 10.1111/anu.12150
Fitzsimmons, K. (2000). “Tilapia: The most important aquaculture species in the 21st century,” in Tilapia Aquaculture in the 21st Century. Proceedings from the Fifth International Symposium on Tilapia Aquaculture, eds K. Fitzsimmons and J. C. Filho (Tucson, AZ: University of Arizona). p. 320.
Food Agriculture Organization (FAO). (2020). Tilapia production and trade with a focus on India. World Aquaculture Performance Indicators (WAPI). Rome, 100. Available online at: http://www.fao.org/3/ca9224en/ca9224en.pdf (accessed March 25, 2022).
Francis, G., Makkar, H. P., and Becker, K. (2001). Antinutritional factors present in plant-derived alternate fish feed ingredients and their effects in fish. Aquaculture 199, 197–227. doi: 10.1016/S0044-8486(01)00526-9
Ganzon-Naret, E. (2019). Utilization of raw, dehullled, autoclaved and soaked pea Pisum sativum seed meals as replacement for fishmeal in practical diet formulation for juvenile sea bass in a recirculating system. World J. Agri. Soil Sci. 1, 1–6. doi: 10.33552/WJASS.2019.01.000520
Gatlin, I. I. I. D., Barrows, F., Brown, P., Dabrowski, K., Gaylord, G., Hardy, R., et al. (2007). Expanding the utilization of sustainable plant products in aquafeeds: a review. Aquacul. Res. 38, 551–579. doi: 10.1111/j.1365-2109.2007.01704.x
Glencross, B. (2016). Understanding the Nutritional and Biological Constraints of Ingredients to Optimize Their Application in Aquaculture Feeds. Cambridge, MA: Academic Press. doi: 10.1016/B978-0-12-800873-7.00003-8
Gonzales, J. M., Hutson, A. H., Rosinski, M. E., Wu, Y. V., Powless, T. F., and Brown, P. B. (2007). Evaluation of fishmeal-free diets for first feeding Nile tilapia, Oreochromis niloticus. J. Appl. Aquacul. 19, 89–99. doi: 10.1300/J028v19n03_06
González-Pérez, S., and Arellano, J. B. (2009). “Vegetable protein isolates,” in Woodhead Publishing Series in Food Science, Technology and Nutrition, Handbook of Hydrocolloids, 2nd Edn (Sawston; Cambridge: Woodhead Publishing). doi: 10.1533/9781845695873.383
Gouveia, A., and Davies, S. J. (1998). Preliminary nutritional evaluation of pea seed meal (Pisum sativum) for juvenile European sea bass (Dicentrarchus labrax). Aquaculture 166, 311–320. doi: 10.1016/S0044-8486(98)00292-0
Hardy, R. W. (2010). Utilization of plant proteins in fish diets: effects of global demand and supplies of fishmeal. Aquac. Res. 41, 770–776. doi: 10.1111/j.1365-2109.2009.02349.x
Hernandez, A., Borquez, A., Alcaino, L., Morales, J., Dantagnan, P., and Saez, P. (2010). Effects of autoclaving on the apparent digestibility coefficient of dehulled pea seed meal (Pisum sativum L.) in rainbow trout (Oncorhynchus mykiss W.). Cien. Inv. Agr. 37, 39–46. doi: 10.4067/S0718-16202010000300003
Hussin, M. S., Al-Azab, E. S., and Taj Adeen, Y. M. (2010). The effects of partial replacement of fish meal by peas (Pisum sativum) and tomato pomace by-product as non-conventional ingredients in diets fed to nile tilapia (Oreochromis niloticus) juvenile. J. Anim. Poultry Prod. 1, 225–240. doi: 10.21608/jappmu.2010.86218
Kim, K. W., Moniruzzaman, M., Kim, K. D., Han, H. S., Yun, H., Lee, S., et al. (2016). Effects of dietary protein levels on growth performance and body composition of juvenile parrot fish, Oplegnathus fasciatus. Int. Aquat. Res. 8, 239–245. doi: 10.1007/s40071-016-0139-9
Luthada-Raswiswi, R., Mukaratirwa, S., and O'Brien, G. (2021). Animal protein sources as a substitute for fishmeal in aquaculture diets: a systematic review and meta-analysis. Appl Sci. 11, 3854. doi: 10.3390/app11093854
Mamauag, R. E. P., Ragaza, J. A., and Nacionales, T. (2019). Fish performance, nutrient digestibilities, and hepatic and intestinal morphologies in grouper Epinephelus fuscoguttatus fed fermented copra meal. Aquacul. Rep. 14, 100202. doi: 10.1016/j.aqrep.2019.100202
Mzengereza, K., Msiska, O. V., Kapute, F., Kang'ombe, J., and Singini, W. K. A. (2014). Nutritional value of locally available plants with potential for diets of Tilapia rendalli in pond aquaculture in Nkhata Bay, Malawi. J. Aquac. Res. Dev. 5, 265. doi: 10.4172/2155-9546.1000265
Naylor, R., Goldburg, R., Primavera, J., Kautsky, N., Beveridge, M. C., Clay, J., et al. (2000). Effect of aquaculture on world fish supplies. Nature 405, 1017–1024. doi: 10.1038/35016500
Novriadi, R. (2017). A Meta-analysis approach toward fish meal replacement with fermented soybean meal: effects on fish growth performance and feed conversion ratio. Asian Fish. Sci. 30, 227–244. doi: 10.33997/j.afs.2017.30.4.002
Overland, M., Sorensen, M., Storebakken, T., Penn, M., Krogdahl, A., and Skrede, A. (2009). Pea protein concentrate substituting fish meal or soybean meal in diets for Atlantic salmon (Salmo salar)—Effect on growth performance, nutrient digestibility, whole-body composition, gut health, and physical feed quality. Aquacult. 288, 305–311. doi: 10.1016/j.aquaculture.2008.12.012
Pereira, T. G., and Oliva-Teles, A. (2002). Preliminary evaluation of pea seed meal in diets for gilthead sea bream (Sparus aurata) juveniles. Aquacul. Res. 33, 1183–1189. doi: 10.1046/j.1365-2109.2002.00782.x
Reverter, M., Tapissier-Bontemps, N., Sarter, S., Sasal, P., and Caruso, D. (2021). Moving towards more sustainable aquaculture practices: a meta-analysis on the potential of plant-enriched diets to improve fish growth, immunity, and disease resistance. Rev. Aquacul. 13, 537–555. doi: 10.1111/raq.12485
Sánchez-Lozano, N. B., Martínez-Llorens, S., Tomás-Vidal, A., and Cerdá, M. J. (2009). Effect of high-level fish meal replacement by pea and rice concentrate protein on growth, nutrient utilization and fillet quality in gilthead seabream (Sparus aurata, L.). Aquaculture 298, 83–89. doi: 10.1016/j.aquaculture.2009.09.028
Santiago, C., Eusebio, P., and Welsh, T. (2002). “Feed pea (Pisum sativum) as an alternative protein source in the diets of Nile tilapia, Oreochromis niloticus (L.),” in Utilization of Feed Peas (Pisum sativum) as Alternative Protein Sources in Diets for Shrimp, Tilapia, and Milkfish (Moscow: US Department of Agriculture), 11–19.
Schulz, C., Wickert, M., Kijora, C., Ogunji, J., and Rennert, B. (2007). Evaluation of pea protein isolate as alternative protein source in diets for juvenile tilapia (Oreochromis niloticus). Aquacul. Res. 38, 537–545. doi: 10.1111/j.1365-2109.2007.01699.x
Subandiyono, S., and Hastuti, S. (2020). Dietary protein levels affected on the growth and body composition of tilapia (Oreochromis niloticus). AACL Bioflux 13, 2468–2476.
Tacon, A. (2019). Trends in global aquaculture and aquafeed production: 2000–2017. Rev. Fish Sci. Aquac. 28, 43–56. doi: 10.1080/23308249.2019.1649634
Thepot, V., Campbell, A. H., Rimmer, M. A., and Paul, N. A. (2021). Meta-analysis of the use of seaweeds and their extracts as immunostimulants for fish: a systematic review. Rev. Aquacul. 13, 907–933. doi: 10.1111/raq.12504
Thiessen, D., Campbell, L., and Adelizi, P. (2003). Digestibility and growth performance of rainbow trout (Oncorhynchus mykiss) fed pea and canola products. Aquacul. Nutr. 9, 67–75. doi: 10.1046/j.1365-2095.2003.00203.x
Tibaldi, E., Tulli, F., Messina, M., Franchin, C., and Badini, E. (2005). Pea protein concentrate as a substitute for fish meal protein in sea bass diet. Italian J. Anim. Sci. 4, 597–599. doi: 10.4081/ijas.2005.2s.597
Yue, G., Lin, H., and Li, J. (2016). Tilapia is the fish for next - generation aquaculture. Int. J. Mar. Sci. Ocean Technol. 3, 11–13. doi: 10.19070/2577-4395-160003
Zhang, Y., Øverland, M., Xie, S, Dong, Z., Lv, Z., Xu, J., and Storebakken, T. (2012). Mixtures of lupin and pea protein concentrates can efficiently replace high-quality fish meal in extruded diets for juvenile black sea bream (Acanthopagrus schlegeli). Aquaculture 354, 68–74. doi: 10.1016/j.aquaculture.2012.03.038
Keywords: pea meal, Nile tilapia, whole-body composition, meta-analysis, plant-based protein
Citation: Magbanua TO and Ragaza JA (2023) Growth and whole-body proximate composition of Oreochromis niloticus Nile tilapia fed pea meal: A systematic review and meta-analysis. Front. Sustain. Food Syst. 7:1103263. doi: 10.3389/fsufs.2023.1103263
Received: 20 November 2022; Accepted: 28 February 2023;
Published: 16 March 2023.
Edited by:
Kevin Obiero, Kenya Marine and Fisheries Research Institute, KenyaReviewed by:
Connie Fay Komilus, Sultan Zainal Abidin University, MalaysiaCopyright © 2023 Magbanua and Ragaza. This is an open-access article distributed under the terms of the Creative Commons Attribution License (CC BY). The use, distribution or reproduction in other forums is permitted, provided the original author(s) and the copyright owner(s) are credited and that the original publication in this journal is cited, in accordance with accepted academic practice. No use, distribution or reproduction is permitted which does not comply with these terms.
*Correspondence: Janice Alano Ragaza, anJhZ2F6YUBhdGVuZW8uZWR1
Disclaimer: All claims expressed in this article are solely those of the authors and do not necessarily represent those of their affiliated organizations, or those of the publisher, the editors and the reviewers. Any product that may be evaluated in this article or claim that may be made by its manufacturer is not guaranteed or endorsed by the publisher.
Research integrity at Frontiers
Learn more about the work of our research integrity team to safeguard the quality of each article we publish.