 Muhammad Salman Mukhtar
 Waqas-ud-Din Khan
 Amin U. Khan1
 Shafeeq Ur Rahman
95% of researchers rate our articles as excellent or good
Learn more about the work of our research integrity team to safeguard the quality of each article we publish.
Find out more
ORIGINAL RESEARCH article
Front. Sustain. Food Syst. , 20 April 2023
Sec. Waste Management in Agroecosystems
Volume 7 - 2023 | https://doi.org/10.3389/fsufs.2023.1102930
This article is part of the Research Topic Enhancing Soil and Crop Resilience: Strategies Against Climate-Driven Salinization and Degradation View all 7 articles
Crop irrigation with brackish water having high Na+ is a common practice in developing countries like Pakistan; hence increasing the saline-sodic soils throughout the region. Therefore, two independent studies were conducted to evaluate the impact of minerals enriched contrasting biochars (MECBs) in mitigating Na+ toxicity on soil physicochemical properties, wheat growth, and physiology. In 1st trial, an incubation experiment was conducted having 32 treatments including simple biochar (SBc), manganese enriched biochar (MnBc), zinc enriched biochar (ZnBc), and iron enriched biochar (FeBc) applied at two rates (0.1% and 0.5%) with four different salinity levels such as 10, 20, 30, and 40 dSm−1. The soil was sampled after the 8th, 16th, and 24th day of incubation. Among the four sources of biochar, MnBc (0.1%) + 40 dSm−1 and FeBc (0.5%) + 40 dSm−1 showed efficient results to tolerate salinity stress in soil by efficiently reducing the availability of Na+ (60% and 30%) when compared to SBc (0.5%) + 40 dSm−1. Then, a pot study was conducted with 20 different treatments (control, SBc, MnBc, ZnBc, and FeBc) at four different salinity levels, i.e., 0, 5, 10, and 15 dSm−1. There were four replicates and the crop was harvested after 60 days of germination. The application of brackish water (control+15 dSm−1) significantly reduced the fresh weight of root (28%) and shoot (34%) of wheat (Triticum aestivum L.) as compared to FeBc+15 dSm−1. However, the soil Na+ toxicity was significantly decreased (23%) by the application of FeBc+15 dSm−1 as compared to control+15 dSm−1. Similarly, a significant increase was observed in leaf chl. a, b and photosynthetic rate (75%, 3 and 2-folds); however, a significant decrease was observed in transpiration rate (50%) in T. aestivum L. treated with FeBc+15 dSm−1 as compared to control+15 dSm−1. Interestingly, FeBc+15 dSm−1 also played a vital role to prevent oxidative damage by controlling the shoot CMP (63%) in T. aestivum L. by efficiently triggering the activities of shoot antioxidant enzymes such as APX (30%) and CAT (52%) when compared to control+15 dSm−1. In summary, it was evaluated that FeBc showed the highest adsorption capacity of Na+ ions to regulate salinity stress by improving soil health and crop physiology.
Micronutrient deficiency is a serious concern to the crops grown in developing countries due to different malpractices such as low moisture content, irrigation with industrial wastewater, excessive use of pesticides, etc. adopted by the farmers. This issue is aggravated in the near past as continuous groundwater pumping salinized the soils of arid/semi-arid climatic zones of the world (Bakhoum et al., 2020). The shortage of fine quality groundwater forces the farmers to exploit saline groundwater for crop cultivation; hence causing drastic impacts on crop growth and yield (Moradi et al., 2019). In cereal crops, wheat is semi tolerant to applied salinity as 50% yield reduction was reported on ECe 13 dS m−1. Wheat is a major cereal crop of Pakistan growing on a large area of 9.0 million hectare (mha) with annual production in 2022–23 is 26.4 million tons (mT) (USDA, 2023). However, 6.28 mha cultivated land in Pakistan is affected by salinity stress; if, this salt affected land brought under cultivation, additional 18.15 mT wheat would be accepted (Malik et al., 2021). The salinity stress initially causes ionic (Na+) toxicity in the rhizosphere; then, it leads to osmotic stress by uncontrolled production of reactive oxygen species (ROS) in the root zone of crops such as wheat (Mumtaz et al., 2021; Yasmin et al., 2021; Mansoor et al., 2022). The application of fertilizers to crops can further exacerbate this stress, as the additional salts in fertilizers can increase soil salinity levels. A study conducted by Munir et al. (2021) found that application of nitrogen (N) fertilizer to salt-stressed wheat plants resulted in decreased plant growth and yield. Similarly, Zhang et al. (2020) found that salt stress decreased the efficiency of phosphorus (P) fertilizer use in maize plants. The researchers suggested that reduced fertilizer application rates may be necessary in salt-affected areas to prevent further damage to crops. Similarly, the availability/bioavailability of different nutrients especially micronutrients such as iron (Fe), zinc (Zn), and manganese (Mn) remain restricted to plants under such high pH soils. Hence, the micronutrients application at a lower rate with a proper carrier material is required for a better plant growth under salt affected soils.
Fe and Zn are the two most important micronutrients required for healthy plant growth and enzymatic activities. Over three billion people suffer from various health issues due to the low supply of Zn and Fe in their food (Krishna et al., 2022). The major cause of micronutrient deficiency is due to the intake of staple food grains with very low contents of micronutrients (Lockyer et al., 2018). Fe is an essential micronutrient for almost all living organisms because it plays a critical role in metabolic processes such as DNA synthesis, respiration, and photosynthesis. Further, many metabolic pathways are activated by iron, and it is a prosthetic group constituent of many enzymes. An imbalance between the solubility of iron in soil and the demand for iron by the plant is the primary cause of iron deficiency in plants and animals (Rout and Sahoo, 2015). Zn deficiencies can affect plants by stunting their growth, decreasing the number of tillers, chlorosis, and smaller leaves, increasing crop maturity period, spikelet sterility, and inferior quality of harvested products (Hafeez et al., 2013). Zn is an important component of proteins and acts as a structural, functional, or regulatory cofactor of many enzymes. Moreover, it plays a significant role in plant metabolism. Generally, the presence of excess salt decreases photosynthesis, total carbohydrate, fatty acid, and protein, therefore, Zn tends to offset the negative effects of salinity on plant growth (Rani et al., 2019). It is studied that the uptake of Na by plants is a major reason for reduced growth/yield and micronutrients in plants. Application of Zn and Fe to plants reduces the effects of salinity in plants and increases nutrient availability in plants (Abbas et al., 2022). Similarly, Mn as an activator of various enzymes also plays an important role in photosynthesis. It also acts as a constituent of photosystem II protein and activates dehydrogenase, decarboxylase, superoxidase and phosphatase; while Mn deficiency induces chlorosis, necrosis and leaf fall which further inhibits the growth of plants (Hussain et al., 2018).
Different techniques have already been used to enhance crop productivity in saline conditions, but the desired targets could not be achieved due to extreme changes in the natural environment such as high temperatures and climate change. Hence, the world requires such a technique that not only improves soil health but also provides the micronutrient to the plant under unfavorable conditions. A lot of research has already been conducted to reduce the negative impacts of BW on soil and plants by using different inorganic and organic amendments such as biochar. Biochar (BC) is known as a great sequester of contaminants (such as salinity and heavy metals) due to its high ionic exchange capacity, electrostatic interactions, and specific ligand binding (Ippolito et al., 2012). Biochar generally had a net negative charge on its surface; thus, it has the great tendency to adsorb sodium ions (Na+) with its surface by providing different oxides and hydroxyl functional groups (Amini et al., 2016; Ali et al., 2017). Similarly, BC further reduces the impacts of salinity stress by enhancing the plant growth-promoting hormones (indole-3-acetic acid) in common bean seedlings; moreover, BC is also associated with a decline in stress hormones such as abscisic acid and different polyamines (Torabian et al., 2018). However, modified/enriched biochar might provide additional benefits such as its cation exchange capacity can be enhanced by enrichment with different nutrients (Khan et al., 2022; Taqdees et al., 2022). In a field experiment, Thomas et al. (2020) investigated that biochar adsorbed significant amounts (30 g m−2) of Na+ from BW. Thus, it might be that biochar immobilizes Na+ in moderately saline soils developed due to BW application, or that it may create non-saline microsites for enhanced nutrient uptake.
Minerals enriched contrasting biochars (MECBs) has a highly porous structure, large surface area, and high cation exchange capacity which further leads to a high sorption capacity (Bolton et al., 2019; Thomas et al., 2020). Among other properties, enriched biochar is also reported as recalcitrant to degradation, which enables large amounts of carbon to be stored in the soil (Thomas et al., 2020). However, the combination of the above-mentioned characteristics makes enriched biochar a good candidate for nutrient recycling. New methodologies are emerging to reduce the input cost such as enriching biochar with nutrients and minimizing the reliance on inorganic fertilizers (Farrar et al., 2019). In a long run, MECBs might become more beneficial in sustaining soil fertility through maintaining high soil organic matter and the gradual release of micronutrients compared to conventional chemical fertilizers.
Recent studies reported that iron enriched biochar increased Ascorbate peroxidase (APX) activities, catalase (CAT) activities, and total phenolics in plants under abiotic stress conditions (Dad et al., 2020). Moreover, plant height and leaf area were also significantly increased in tomato plants through the applications of domestic waste biochar under salinity stress (Kul et al., 2021). A study by Taqdees et al. (2022) recently investigated that Si-enriched biochar efficiently triggered the activities of superoxide dismutase (SOD), catalase (CAT), ascorbate peroxidase (APX) and total phenolics in the shoot of radish plant under salinity stress (100 mM NaCl); interestingly, Zn content in root and shoot of radish plant also significantly increased through the application of Zn-enriched biochar under 100 mM NaCl stress. Similarly, the availability of Na+ and Cd+ significantly reduced by the application of sulfur-enhanced biochar (5:100 w/w) in soil which efficiently improved drought tolerance, photosynthetic activities (2-folds), and nutritional status (N, P, K+, Ca2+, Fe, Mn, Cu, and Zn) in pepper plants (Abd El-Mageed et al., 2020). However, it would be effective to apply biochar enriched with minerals such as Fe, Zn, and Mn to improve the fertility and physiology of soil and plants under salinity stress.
To date, a lot of research has been successfully conducted to treat and utilize BW for drinking purposes but pumping and supplying the refined BW to agricultural land is still lagging especially in developing countries. Hence, there is a need to adopt multidirectional strategies to tackle the unrefined use of brackish water. It is well-known fact that Zn and Fe are the two most limiting nutrients available in saline or saline-sodic soils (Kizito et al., 2019). Thus, we hypothesized that the addition of minerals to the BC would improve soil health and enhance the supply of Zn, Fe and Mn to T. aestivum L. under Na+ toxicity. In general, we planned to evaluate the efficiency of different sources and rates of biochars (BCs) based on distinctive soil properties affected by different salt levels; likewise, to select and verify the most appropriate source and the rate of MECBs by confirming its effects on plant physiology and biochemistry under BW application.
Brackish water (BW) was prepared by adding different concentrations of sodium chloride (NaCl) salt into distilled water. For the incubation experiment, there were four different rates of BW prepared as 10, 20, 30, and 40 dSm−1 by adding NaCl to 100 mL of distilled water. Similarly, for the pot experiment, there were three different rates of BW prepared as 5, 10, and 15 dSm−1 by adding NaCl at the rate of 0.32%, 0.8%, and 1.2%, respectively, into 1 L of distilled water separately.
Simple biochar (SBc) was prepared from rice husk at a pyrolysis temperature of 500°C for 3 h (hrs) in a furnace (TF-1200X). Later, that biochar (Bc) was ground and passed through a 2 mm sieve. Zinc enriched biochar (ZnBc) was prepared by mixing the 10 g Bc with distilled water (1:5 w/v) in a mechanical vessel. The mixture was heated to raise the temperature (100°C); then, 2.97 g of Zn(NO3)2.6H2O was added to the mixture till the homogenous mixture was attained after continuous mixing and heating for 3 h. The Bc was dried in the oven at 60°C to remove the excess water from the prepared Bc (Li et al., 2018). Manganese enriched biochar (MnBc) was prepared by mixing the Bc with distilled water (1:5 w/v) in a mechanical vessel. The mixture was heated to raise the temperature (100°C); then, MnCl2 4.H2O was added to the mixture till the homogenous mixture was attained after continuous stirring and heating for 3 h. The Bc was dried in the oven at 60°C to remove the excess water from the prepared Bc (Li et al., 2018). Iron enriched biochar (FeBc) was prepared by mixing the Bc with distilled water (1:5 w/v) in a mechanical vessel. The mixture was heated to raise the temperature (100°C); then, the iron chloride (FeCl3) and iron sulfate (FeSO4) were added (2:10 w/v) to the mixture. The homogenous mixture was attained after continuous stirring and heating for 3 h. The Bc was dried in the oven at 60°C to remove the excess water from the prepared Bc (Khan et al., 2022).
Fourier-Transform Infrared (FTIR) characterization of all sorts of BCs was performed at the Center for Advanced Studies in Physics (CASP), Lahore.
An incubation study was conducted in the research laboratory of the Sustainable Development Study Centre at Government College University, Lahore. The main purpose of this study was to investigate the most efficient applied rate of four different BCs to tackle the severity of BW stress. The temperature of the laboratory was 25°C with a humidity level (of 40%) during the incubation period. The bhal soil (200 g) was used in that experiment (Rabiya et al., 2022). There were four rates of BW (10, 20, 30, and 40 dSm−1) and two rates of SBc, ZnBc, MnBc, and FeBc (0.1 and 0.5%) used in the experiment with triplicates. The purpose of this experiment was to evaluate that how higher concentration of salts affect the soil properties and how addition of simple and enriched Bc strengthen the soil physicochemical properties. The details of 32 treatments were provided in Table 1.
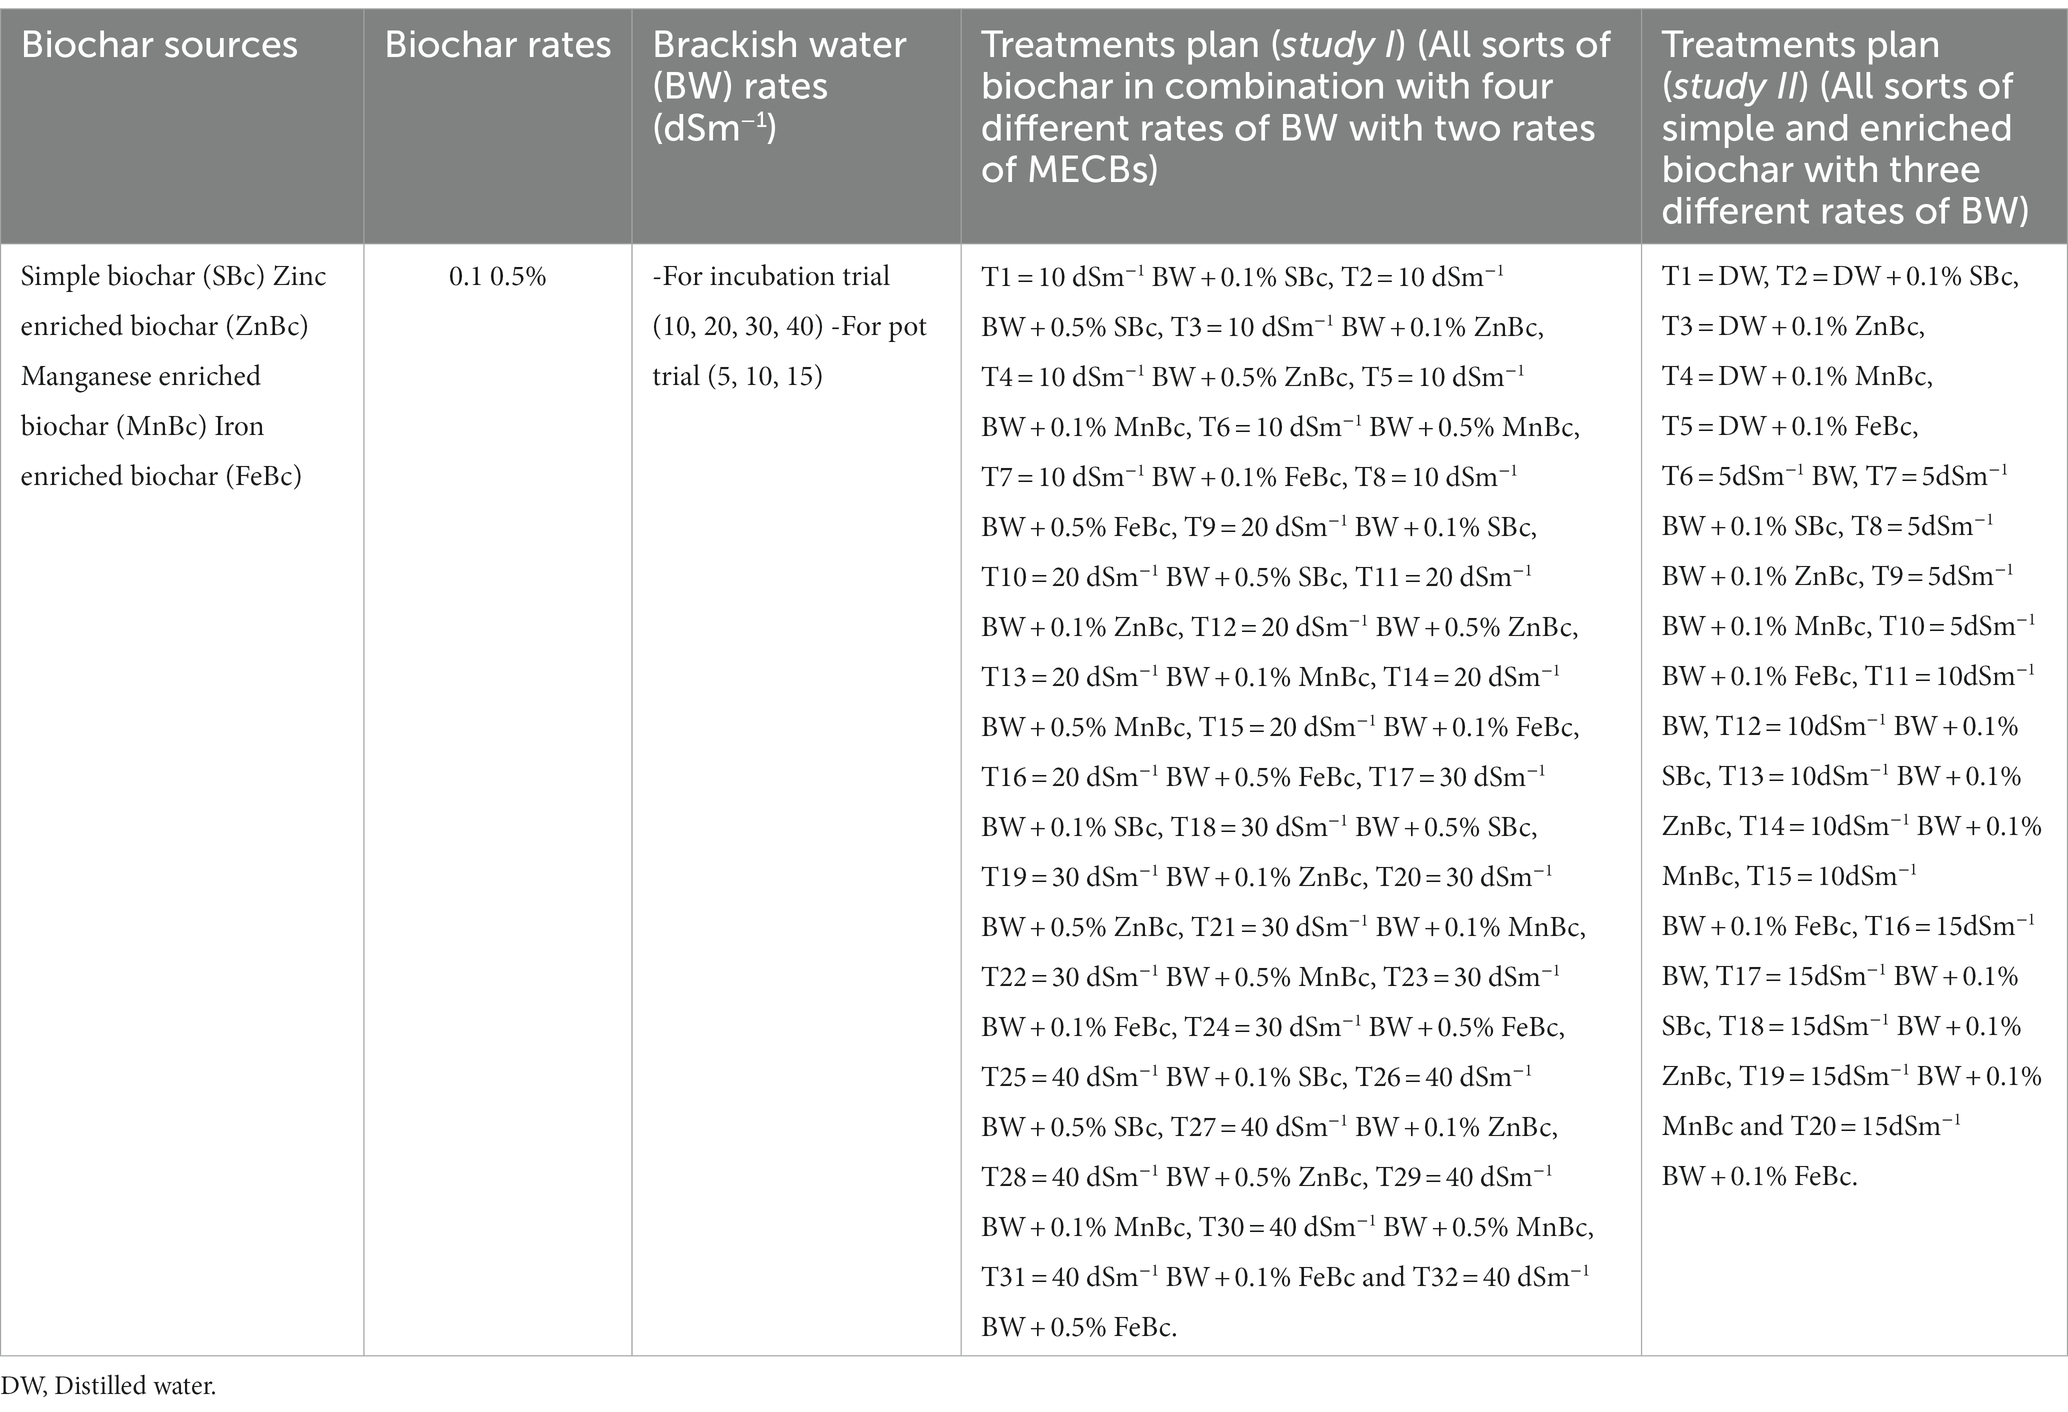
Table 1. Experimental design for the proposed studies.
One replicate of each treatment was harvested after the 8th, 16th, and 24th day of incubation (DAI), and the post-harvested soil was analyzed for different parameters such as pH, EC, Na+, and Chloride (Cl−). The pH of the soil was measured by using a standardized pH meter (YSI pH100) and EC by using a standardized electrical conductivity meter (Extech EC300). Soil solutions were prepared with a 1:2 soil/distilled water ratio and samples were shaken for 30 min using orbital flask shaker (SK-O330-Pro Biobase). Finally, readings were examined after 1 h of equilibrium (Hailegnaw et al., 2019). The concentration of Na+ in all soil samples was measured by following the method of Xiao et al. (2020). Soil samples (10 g) were mixed by adding DTPA (Diethylene Triamine Penta Acetic Acid) solution (20 mL) and the extract was finally analyzed on a multi-sequential atomic absorption spectrophotometer (Thermo Scientific ICE-3000 series). Cl− in soil was determined by using 5 mL soil extract obtained from the saturated paste of soil. In soil extract, 4 drops of 5% potassium chromate were added as an indicator and titrated with 0.01 N silver nitrate till the end point, i.e., the reddish-brown color appeared (Ryan et al., 2001). The volume of silver nitrate used for titration was noted and the concentration of Cl− was calculated using the following formula (Ryan et al., 2001).
V = Volume used of titrant, i.e., Silver Nitrate.
N = Normality of Silver Nitrate.
V1 = Volume of Soil extract.
Percent variance analysis for incubated soil at 24th DAI was calculated to observe the effectiveness of applied treatments to combat salinity stress in soil. It was done by proceeding with the following equation (Takarina and Pin, 2017):
The pot experiment was conducted at a greenhouse (Botanical Garden, Government College University, Lahore) located at 31°33′20.54″ N and 74°19′40.56″ E near Mall Road Lahore, Pakistan. The temperature of the greenhouse ranged from 14°C to 20°C, relative humidity was around 40 ± 12% and ambient CO2 concentration varied from 0.028–0.067 vol%. The purpose of this experiment was to confirm the best rate of selected BCs from study 1 on wheat (Triticum aestivum L.) crops under NaCl stress. There were 20 treatments having Control, SBc, ZnBc, MnBc, and FeBc (each BC at the rate of 0.1% of soil w/w) at four levels of brackish water (BW) (0, 5, 10, and 15 dSm−1) applied to the pots (7.5 × 10 cm size) having soil (3 Kg) with four replicates (n = 4). As wheat is a glycophytic crop and could not tolerate the higher concentration of salt stress that’s why we have chosen the 10dSm−1 as a standard rate from previous experiment and took a higher (15dSm−1) and lower rate (5dSm−1). Ten seeds of wheat (cultivar name ~ Faisalabad 2008) were sown with four replicates. After 8 days of germination, four plants per pot were maintained. Then, NaCl stress was applied in the form of BW to the plants through irrigation in 12 equal intervals till harvesting. After 60 days of germination, plants were carefully harvested; then, fresh weight and root and shoot length were measured.
One plant pot−1 was separated and the roots and shoots were subjected to air dried and then oven dried at 70°C for 72 h. Then, plant samples were digested with HNO3 + HClO4 (2:1) for the analysis of Na, K, Fe, Zn, and Mn on a multi-sequential atomic absorption spectrophotometer (Thermo Scientific ICE-3000 series) by following the method referred by Dad et al. (2020).
For the measurement of pH and EC of post-harvested soil, the same protocols were followed as discussed earlier in Section 2.2. For the measurement of cations in the soil such as Na, K, Fe, Zn, and Mn, the DTPA extraction method was used by following the same protocol as discussed earlier in Section 2.2.
Chlorophyll (chl.) concentration was measured by using fresh, fully expanded leaf material; the leaf sample (1 g) was grounded with the help of a pestle and mortar in 90% acetone. Absorbance was measured on a UV–Vis spectrophotometer (Spectro scan 80D) by using the following equations:
(A663) and (A645) represent absorbance values read at 645 and 663 nm wavelength, respectively (Strain and Svec, 1966).
Photosynthesis and transpiration rate of wheat plants were determined by using Infrared gas analyzer (LCA 4; ADC BioScientific Ltd., Hoddesdon, UK; Amitrano et al., 2021).
Malondialdehyde (MDA) concentration was measured by adding 5 mL of 20% trichloroacetic acid solution into the wheat fresh leaf (0.1 g) paste. The mixture was centrifuged at 10,000 rpm for 15 min. The collected supernatant (2.5 mL) was taken, and 1 mL of both solutions trichloroacetic acid (20% v/w) and thiobarbituric acid (0.5% v/w) were added into it. The solution was placed in an oven at 95°C for 30 min and then cooled in a water bath. Absorbance for MDA was measured at 532 nm and 600 nm wavelengths by using the Beer–Lambert equation (Jambunathan, 2010).
Hydrogen Peroxide (H2O2) in shoots of Triticum aestivum L. plants was measured by homogenizing 500 mg fresh tissues in 0.1% (w/v) tri-chloroacetic acid. This homogenized solution was centrifuged at 12,000×g for 15 min. Then, 1 mL supernatant was mixed with 1 mL of 10 mM potassium phosphate (K-P) buffer (7.0 pH) and 2 mL of 1 M potassium iodide (K.I) solution. The absorbance of the mixture was checked at 390 nm on UV–visible spectrophotometer (Spectroscan 80D). The concentration of H2O2 was calculated in μmolg−1 using the standard curve (Velikova et al., 2000).
Cell membrane permeability (CMP) was measured by adding a fresh leaf (0.1 g) into the test tubes containing 5 mL of distilled water. Test tubes were placed on a shaker for 4 h. Electrical conductivity (EC) of the solution was measured with an EC meter. Then, samples were autoclaved at 121°C for 20 min. The solution was cooled down to room temperature and the second reading of EC was taken. The first reading was divided by the second reading and multiplied by 100 to measure the CMP (Jambunathan, 2010).
Fresh shoot and root tissues (0.2 g) were taken and ground by using pestle and mortar. The exact weight of each sample was measured before it was thoroughly homogenized in 1.2 mL of 0.2 M K-P buffer (pH 7.8; 0.1 mM ethylene di-amine tetra acetic acid). The sample was centrifuged at 15,000 × g for 20 min at 4°C. The supernatant was removed from the sample, and the pellet was resuspended in 0.8 mL of the same buffer. This suspension was centrifuged for another 15 min at 15,000 × g. The combined supernatant was stored in the freezer and used to measure different antioxidant enzyme activities (Cakmak and Marschner, 1992).
Catalase (CAT) activity was measured by taking 1 mL above prepared extract, the extract was diluted 200 times with 7.0 pH K-P buffer solution, then 1 mL of 10 mM H2O2 was added in 2 mL of diluted extract. The absorbance was recorded at 240 nm on UV–visible spectrophotometer (Spectroscan 80D) and CAT was calculated in mol unit activity min−1 mg−1 protein at 25 ± 2°C (Cakmak and Marschner, 1992).
Ascorbate peroxidase (APX) activity was measured by a modified method of Nakano and Asada (1981). It was measured from the decrease in absorbance at 290 nm due to the oxidation of ascorbate. The assay mixture (1 mL) was prepared by the following protocol: 50 mM K-P buffer (pH 7), 0.5 mM H2O2, 0.5 mM ascorbate, and 10 μL of crude leaf extract. H2O2 was added to initiate the reaction mixture and the decrease in absorbance was measured for 3 min on a spectrophotometer (Spectroscan 80D). The extinction coefficient of 2.8 mM−1 cm−1 for the reduced ascorbate was used in measuring the enzyme activity that was expressed in terms of mol unit activity min−1 mg−1 protein.
Protein concentration was determined by the method of (Tan et al. (2016)). The sample extract was prepared by taking 0.1 g of shoot samples, and ground using 4 mL of 80% acetone. Then, 200 μL of sample extract was taken into a test tube and 1800 μL deionized water was added to it. Then, Bradford reagent (2 mL) was added, and the mixture was placed for incubation at room temperature for 10–20 min. After incubation, absorbance was measured at 595 nm wavelength by spectrophotometer (Spectroscan 80D). Protein concentration (mgg−1 F.W) was measured by a standard curve using different concentrations of bovine serum albumin (BSA).
Total phenolic in roots and shoots was colorimetrically measured by following Singleton et al. (1999). The reaction mixture was prepared by adding 20 μL of sample extract, 100 μL Folin–Ciocalteu’s reagent, deionized water (1,580 μL), and 300 μ Na2CO3 (1 N). The mixture was placed in the dark at room temperature for 2 h. The absorbance of the mixture and gallic acid standards were measured at 760 nm on a spectrophotometer (Spectroscan 80D). The concentration of total phenolics was presented in μgg−1 F.W.
All parameters were statistically analyzed through Microsoft Excel 2013® (Microsoft Cooperation, Redmond, WA, USA) and Statistix@8.1® software package (Copyright 2005, Analytical Software, USA) was used to design a two-way analysis of variance (Khan et al., 2018). Least significant difference test (LSD) was performed to compare the means of different treatments at p ≤ 0.05 by using Statistix@8.1® (Steele and Grabau, 1997). Principal component analysis (PCA) was performed for incubation experiment to evaluate best-applied treatments through XLSTAT version 2021 (Rabiya et al., 2022) and a graphical representation of datasets was supported by using Sigma plot 14.0 (Ishfaq et al., 2021). All the results were the means of four replicates (n = 4) with standard error (SE).
In SBc, there was not any proper band formation occurred in the range of 4,000–2,500 cm−1 (Figure 1). While, a very sharp peak (3,652.80 to 2,713.05 cm−1) was observed in Fe-enriched biochar demonstrating the formation of C=O and O-H acidic functional groups (Figure 1). Similarly, slightly sharp peaks (3,662.42 to 2,812.75 cm−1; 3,593.47 to 2,960.02 cm−1) were also examined in the Zn and Mn enriched BCs respectively, due to the formation of functional groups (C=O and O-H) (Figure 1).
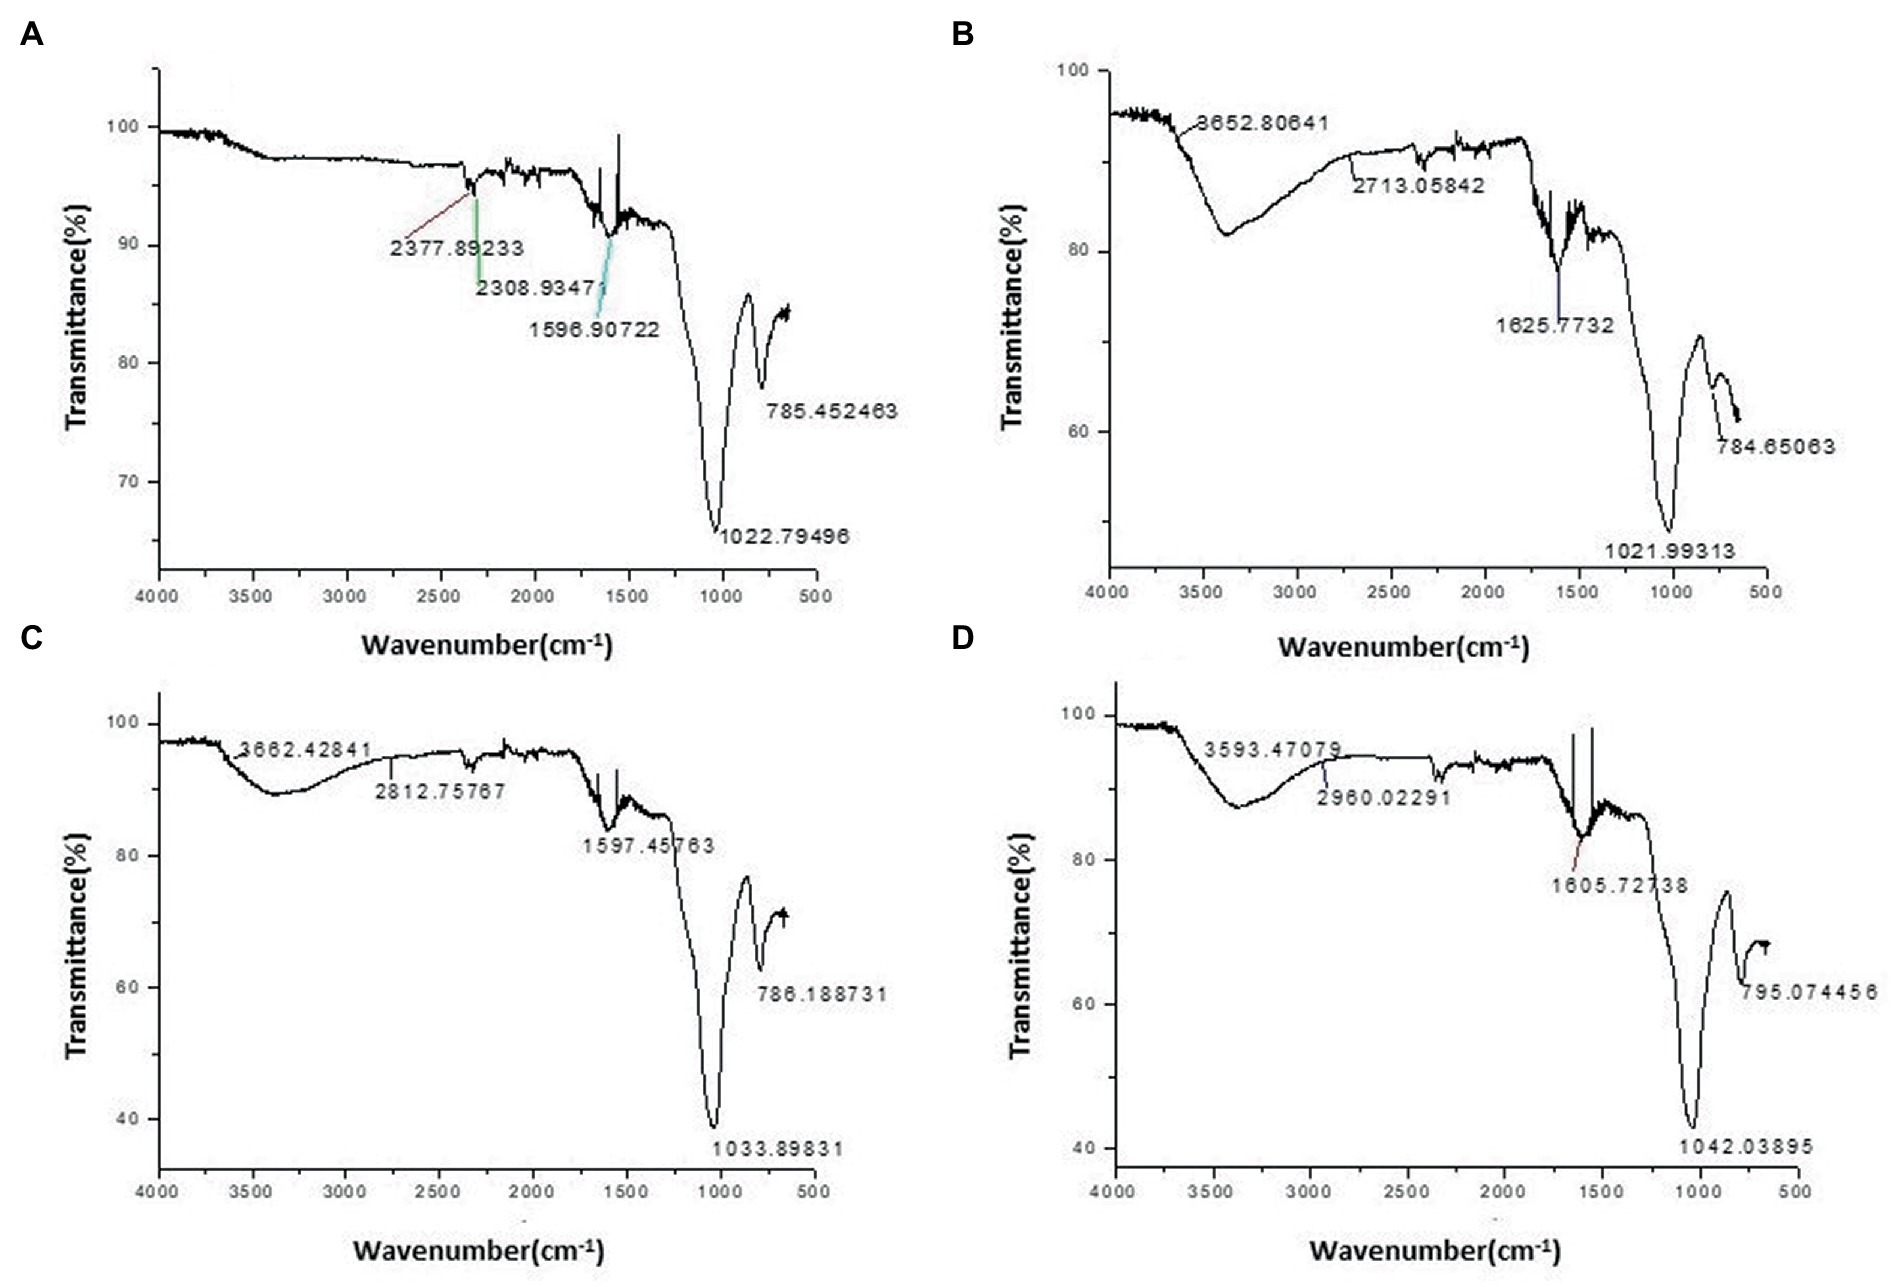
Figure 1. Fourier-Transform Infrared (FTIR) characterization of (A) Simple rice husk biochar (SBc), (B) iron biochar (FeBc), (C) Zinc biochar (ZnBc), and (D) Manganese biochar (MnBc).
The physicochemical properties of the incubated soil were significantly (p ≤ 0.05) influenced by the applications of SBc and MECBs under various BW levels (Table 2). It was noticed that the pH of soil gradually became acidic (≤ 6 pH) in soil samples treated with MECBs when compared with SBc at10, 20, 30, and 40 dSm−1 levels of BW (Table 2). Moreover, the data about pH variation in soil remained non-significant within each sampling time. While, it is demonstrated that the trend of salinity stress competitively decreased under an acidic environment induced by MECBs relative to the basic environment; however at the highest salinity level, the maximum reduction in Na+ (23%) and Cl− (27%) was observed under the application of 40 dSm−1 BW + 0.5% ZnBc when compared with 40 dSm−1 BW + 0.5% SBc at 16th DAI (Table 2). The values of soil EC increased in the order of MnBc ≤ SBc ≤ ZnBc ≤ FeBc based on the terminal investigations of the incubated study (Table 2).
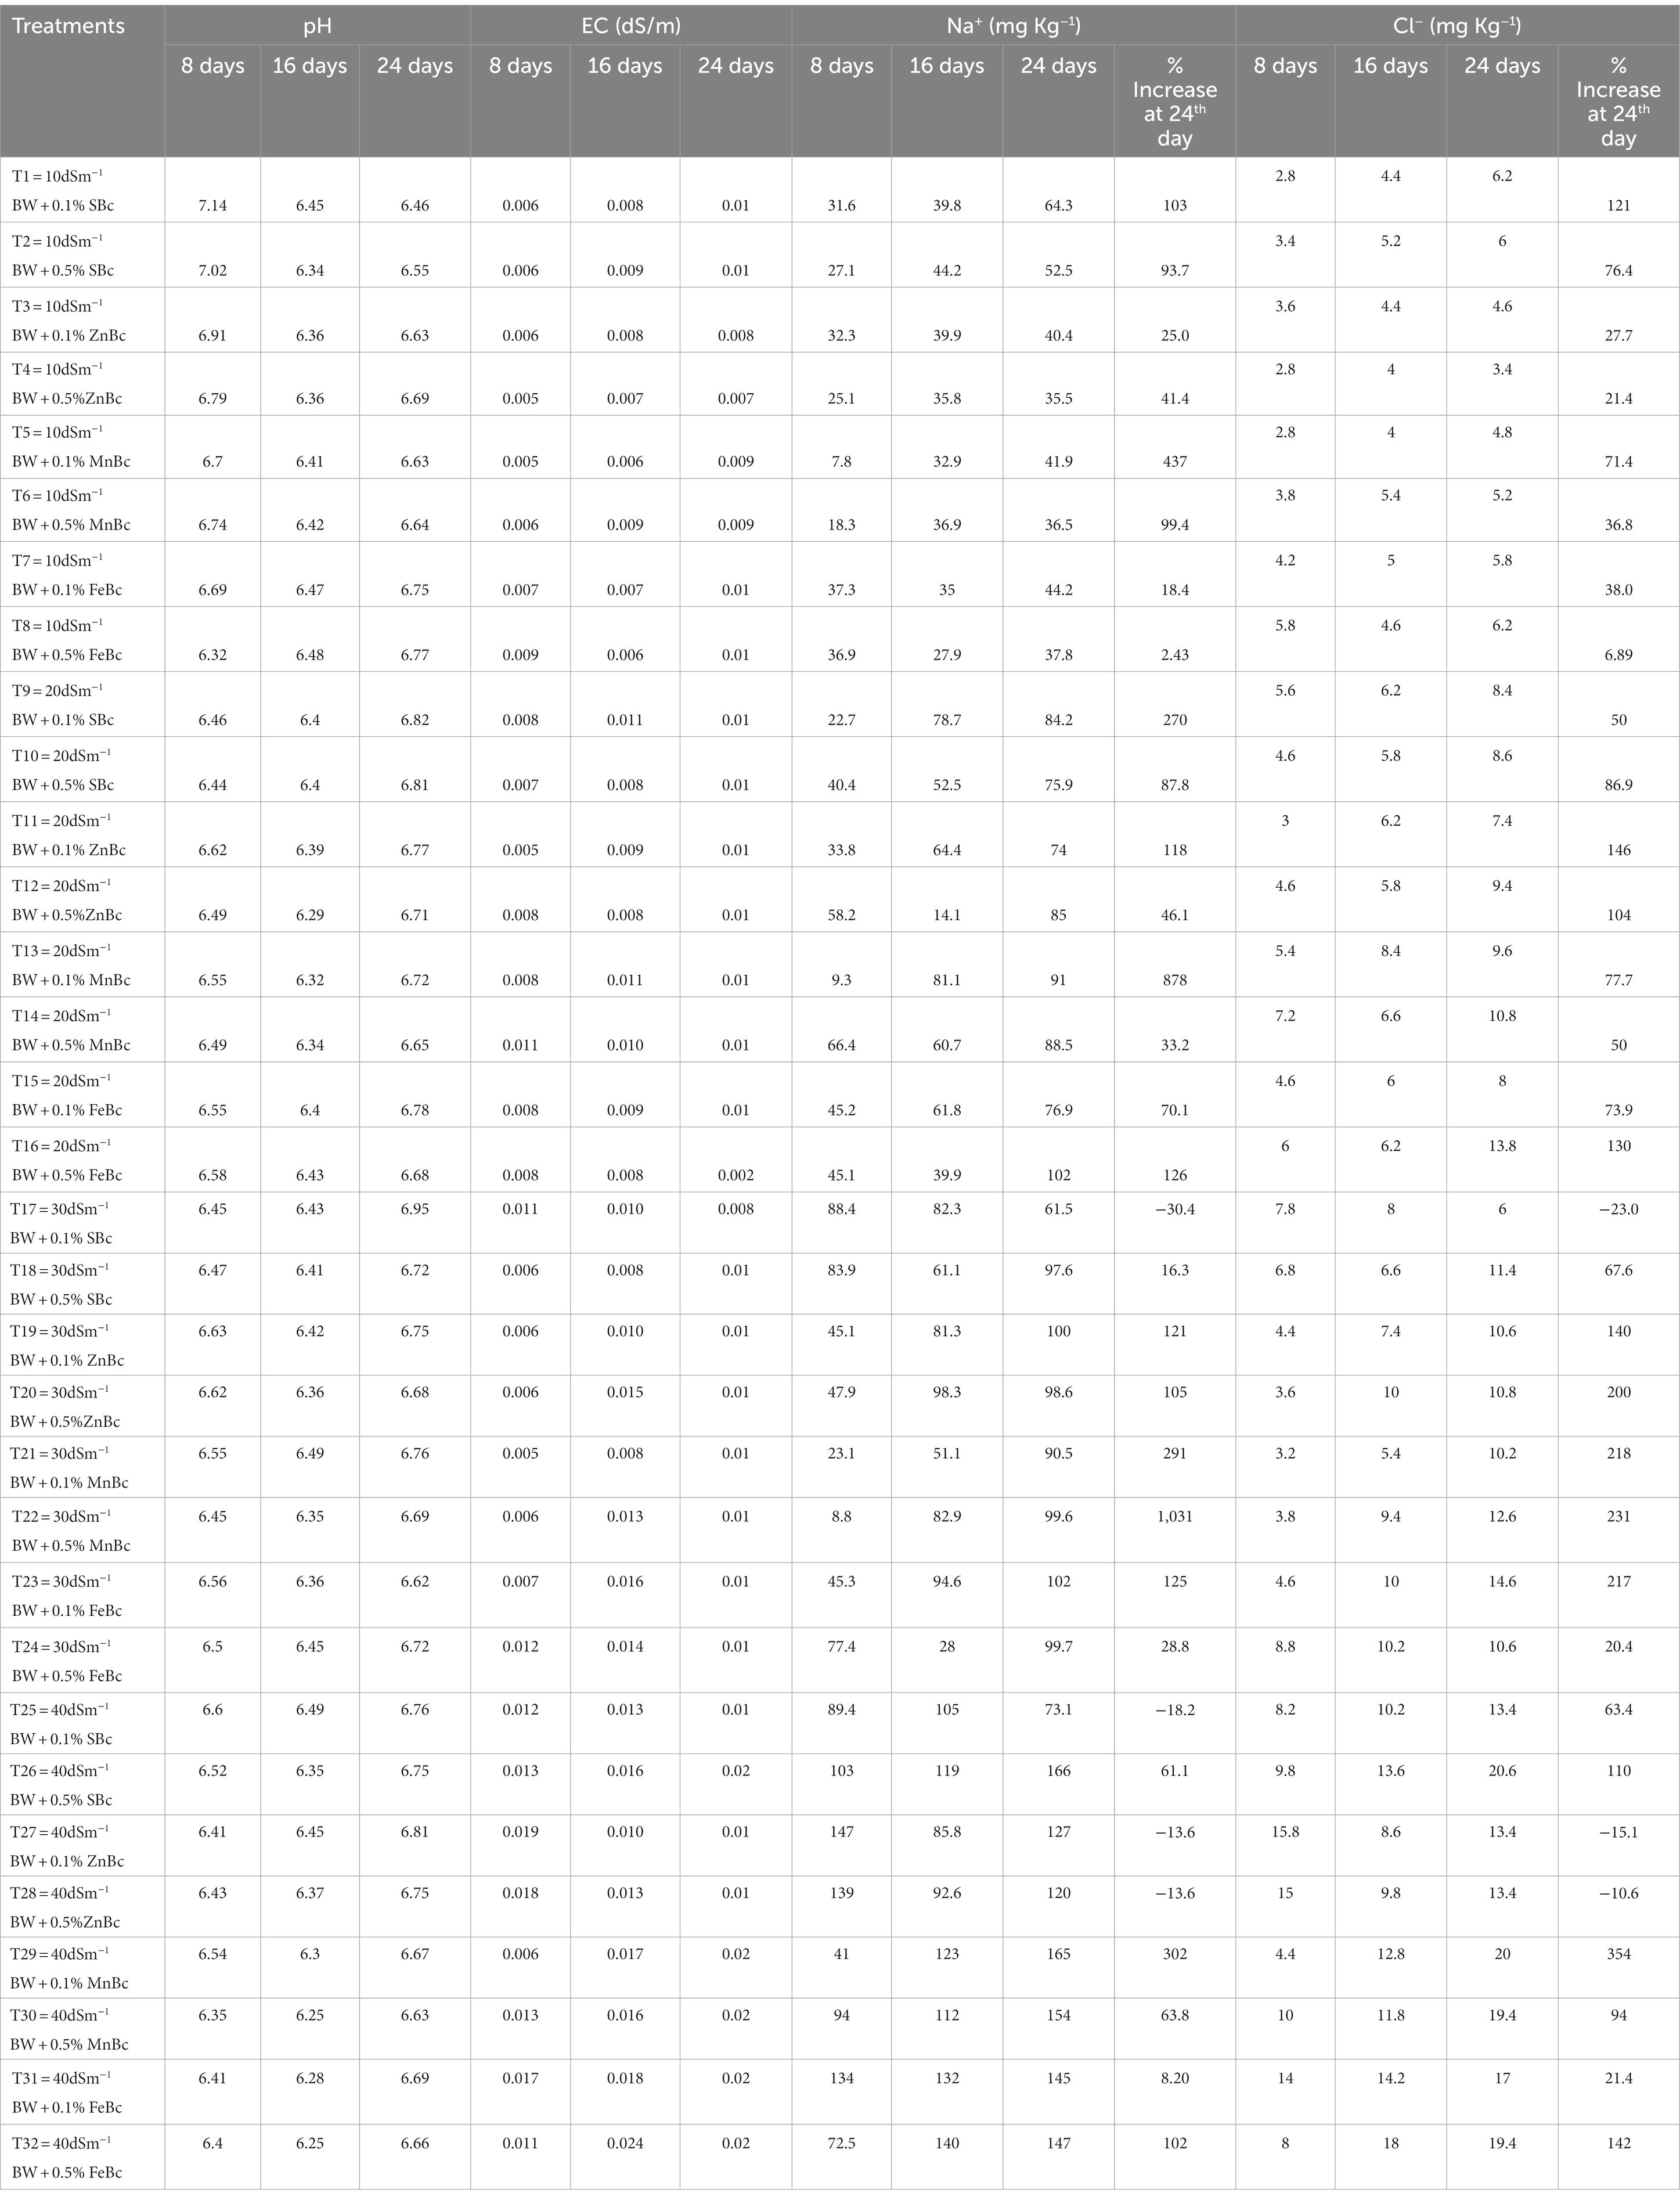
Table 2. A change in soil pH, electrical conductivity (EC), Na+, and Cl− concentrations studied at different time intervals with various rates of brackish water (BW) and rice husk biochars such as simple biochar (SBc), zinc biochar (ZnBc), manganese biochar (MnBc), and iron biochar (FeBc) under an incubation trial.
Application of SBc and MECBs effectively influenced the soil health parameters by regulating the toxicity of salinity stress (Na+ and Cl−) as shown in Table 2. However, it was noticed that the maximum adsorption of Na+ and Cl− was shown at the 8th DAI (Table 2). As the experiment goes on, the adsorption trend was gradually decreasing (Table 2); while, maximum desorption was shown with SBc and minimum desorption with the application of FeBc under different rates of BW at 24th DAI (Table 2). Moreover, the minimum desorption was observed in Na+ (5%) and Cl− (8%) at 24th DAI when compared with 16th DAI under the application of 40 dSm−1 BW + 0.5% FeBc (Table 2). Interestingly, it was investigated that applied rates (0.1 and 0.5%) of SBc and MECBs showed non-significant results in the regulation of salinity stress; so, it was more convenient and eco-friendlier to combat abiotic stresses through applying a low rate (0.1%) of different sorts of BCs (Table 2). Generally, the addition of SBc and MECBS efficiently performed to lower the salinity status in incubated soil; but the results were well pronounced with the application of ZnBc and FeBc in incubated saline soil (Table 2).
Physicochemical parameters of incubated soil were examined by constructing the biplot of PCA to investigate the influence of MECBs under different levels of salinity stress (Figure 2). The biplot of PCA contributed 78.93% of the variance; where, whereas PC1 and PC2 contributed 60.26 and 18.67%, respectively in the total variance (Figure 2). PCA evaluated that the EC, Na+, and Cl− at 8th DAI were highly positively correlated to each other; so, it was revealed that ion movement (EC) in soil increased with the increase in salinity stress (40 dSm−1 of BW) (Figure 2; Table 2). Moreover, by increasing the period of incubation, salinity stress significantly increased the EC of soil as clearly shown in Figure 2 and Table 2. So, EC, pH, Na+, and Cl− of the 16th and 24th DAI were highly positively correlated to each other because the desorption trend started after the 8th DAI. Interestingly it can observe in the first quadrant of the PCA biplot, the 40 dSm−1 BW + 0.1% ZnBc and 40 dSm−1 BW + 0.5% FeBc treatments were at the top and far away from all the analyzed salinity parameters which efficiently demonstrated the highly positive effect of FeBc and ZnBc to minimize the existence of salinity stress (Na+ and Cl−) in incubation experiment (Figure 2). However, results were well pronounced with the applications of 40 dSm−1 BW + 0.1% FeBc and ZnBc specifically in fundamental parameters (pH and EC) of soil to combat salinity stress (Figure 2).
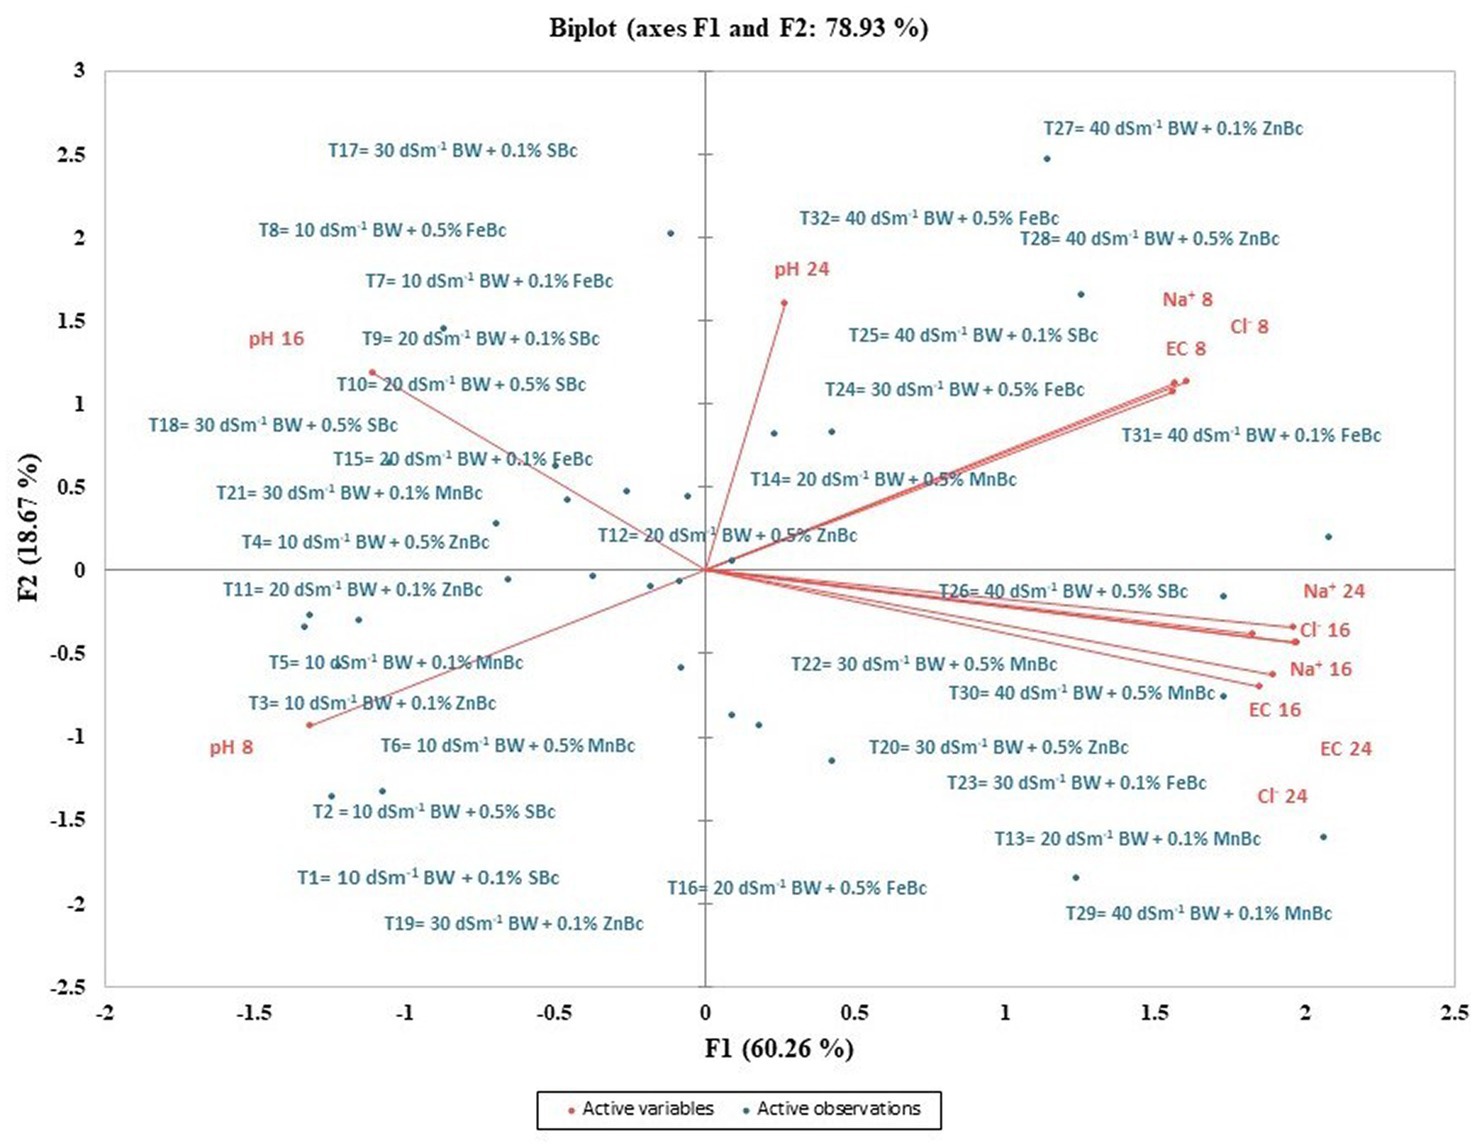
Figure 2. Principal component analysis (PCA) of different parameters of post-harvest soil of incubation study and F1 and F2 are PCA main factors which significantly participated to generate PCA biplot. However, active variables are Ph, EC and concentrations of Na+ and Cl−; while, active observations are BW—brackish water; SBc—simple biochar; MnBc—manganese biochar; ZnBc—zinc biochar; FeBc—iron biochar with different application rates.
Application of BW significantly (p ≤ 0.05) decreased the availability of essential nutrients in the soil and T. aestivum L. (Figure 3; Table 3). However, the effect of salinity stress was significantly (p ≤ 0.05) regulated by the addition of MECBs (Figure 3; Table 3). Interestingly, maximum Fe uptake (3-folds each) was examined in root and shoot under the application of FeBc +15 dSm−1 BW when compared with control +15 dSm−1 BW (Figure 3).
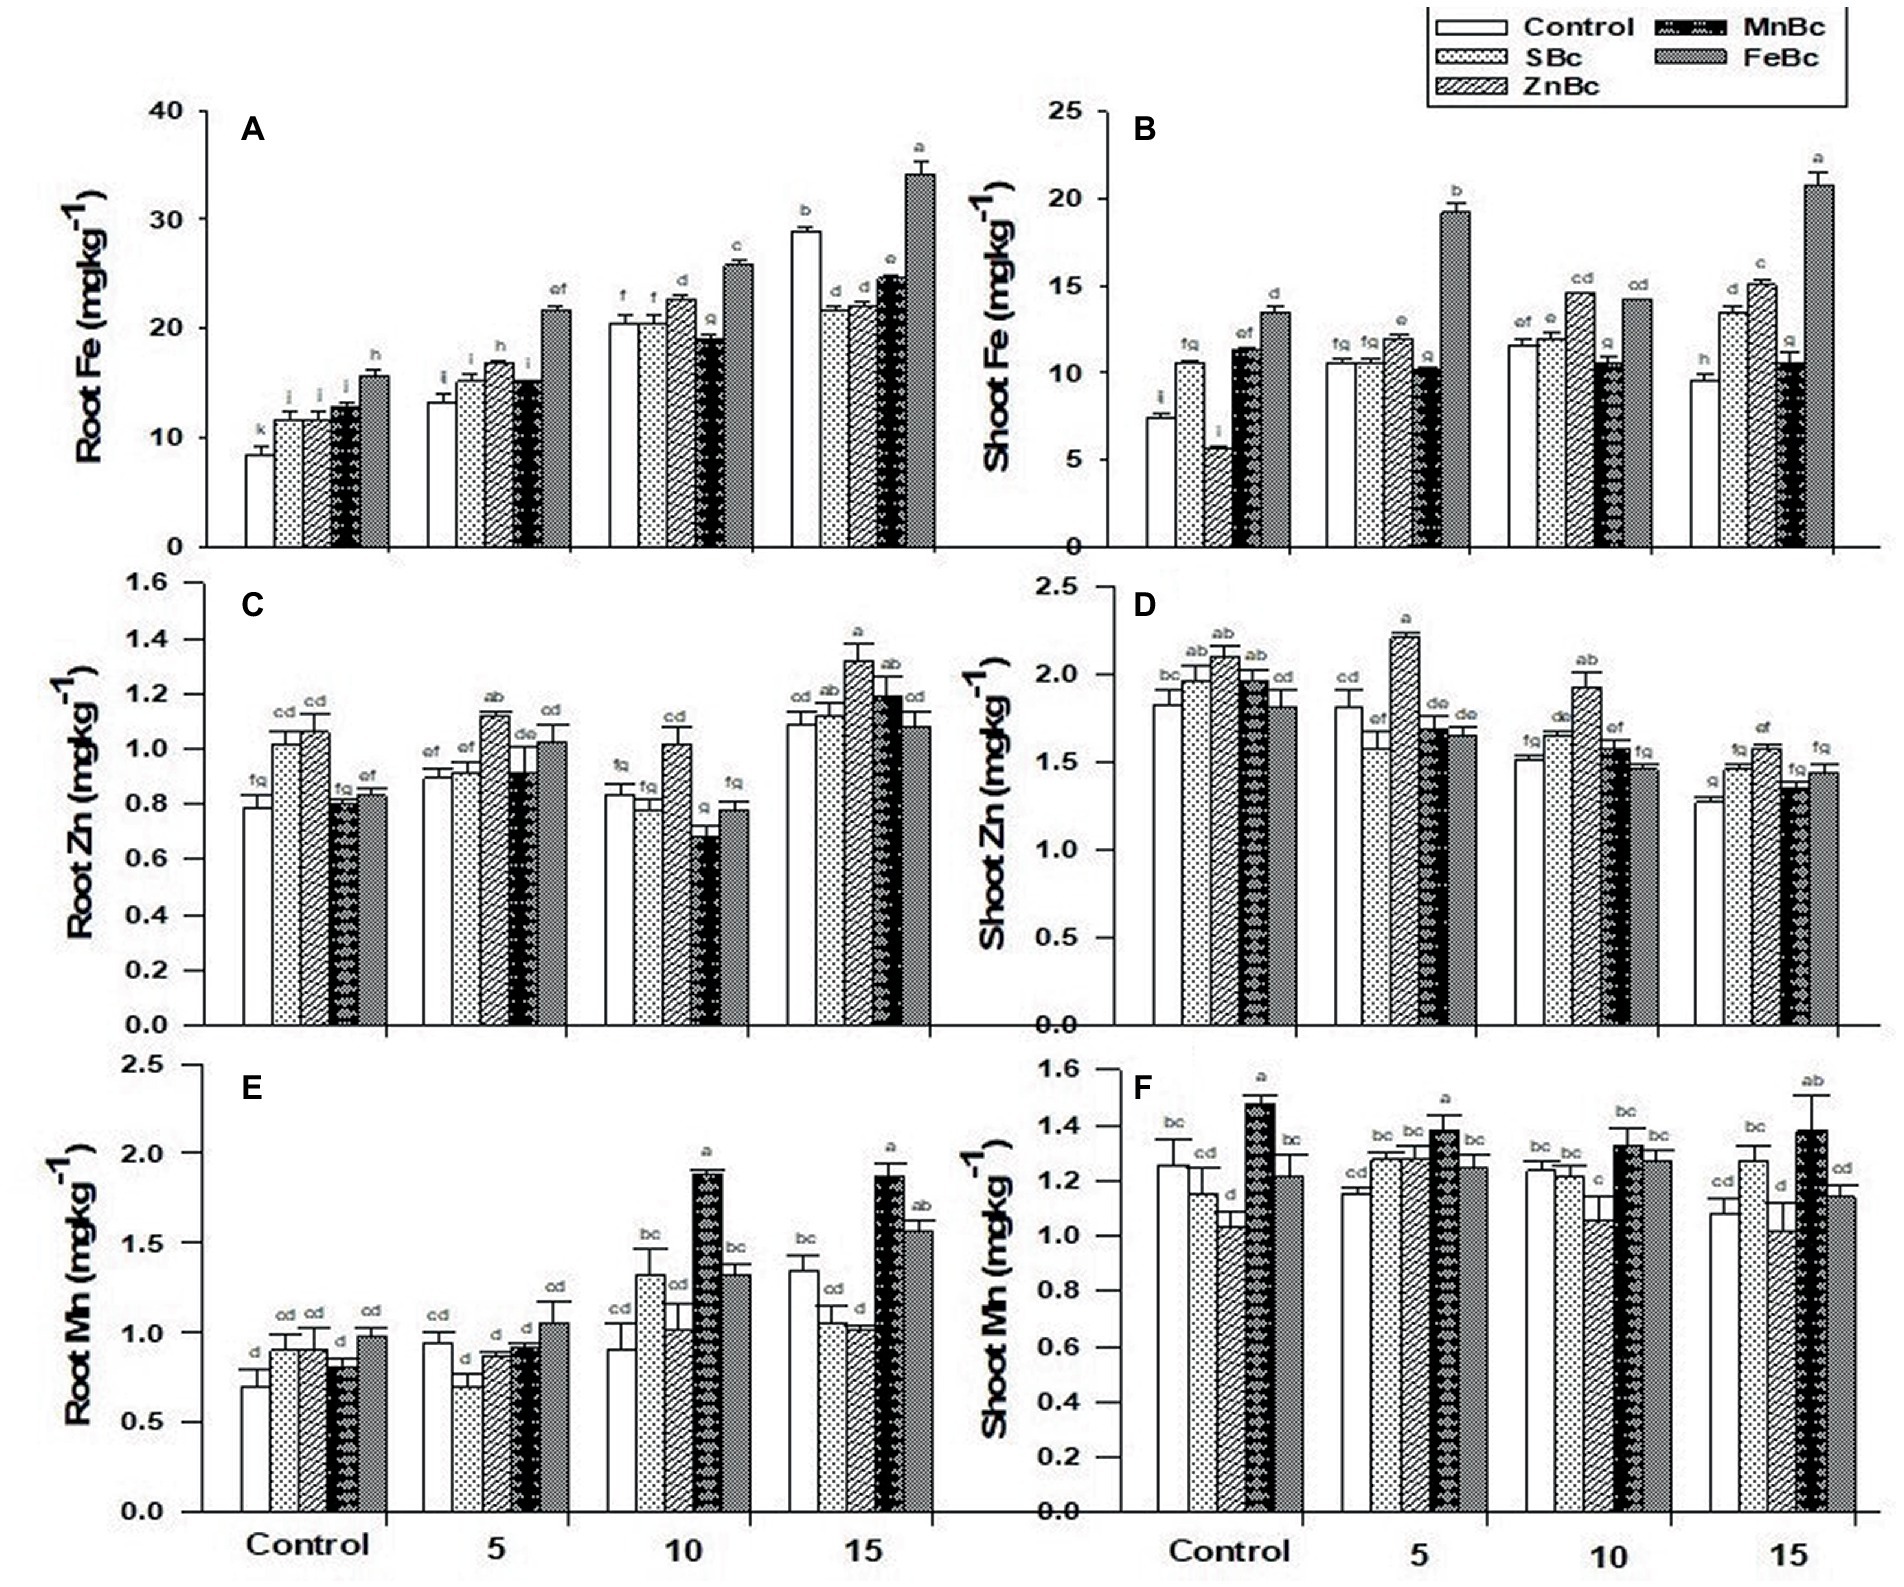
Figure 3. (A) Root Fe (mgkg−1), (B) Shoot Fe (mgkg−1), (C) Root Zn (mgkg−1), (D) Shoot Zn (mgkg−1), (E) Root Mn (mgkg−1), and (F) Shoot Mn (mgkg−1) of T. aestivum L. grown under various treatments such as T1 = DW, T2 = DW + 0.1% SBc, T3 = DW + 0.1% ZnBc, T4 = DW + 0.1% MnBc, T5 = DW + 0.1% FeBc, T6 = 5dSm−1 BW, T7 = 5dSm−1 BW + 0.1% SBc, T8 = 5dSm−1 BW + 0.1% ZnBc, T9 = 5dSm−1 BW + 0.1% MnBc, T10 = 5dSm−1 BW + 0.1% FeBc, T11 = 10dSm−1 BW, T12 = 10dSm−1 BW + 0.1% SBc, T13 = 10dSm−1 BW + 0.1% ZnBc, T14 = 10dSm−1 BW + 0.1% MnBc, T15 = 10dSm−1 BW + 0.1% FeBc, T16 = 15dSm−1 BW, T17 = 15dSm−1 BW + 0.1% SBc, T18 = 15dSm−1 BW + 0.1% ZnBc, T19 = 15dSm−1 BW + 0.1% MnBc and T20 = 15dSm−1 BW + 0.1% FeBc where control = DW and 5, 10 and 15 are representing the rates of dSm−1 of BW. Values are the average of four replicates ± standard error (SE). Mean bars showing similar lower case alphabetic letters represented non-significant (p ≤ 0.05) to each other while different letters represented significant (p ≤ 0.05) difference declared by Two-Factors Factorial (ANOVA) using LSD test at p ≤ 0.05.
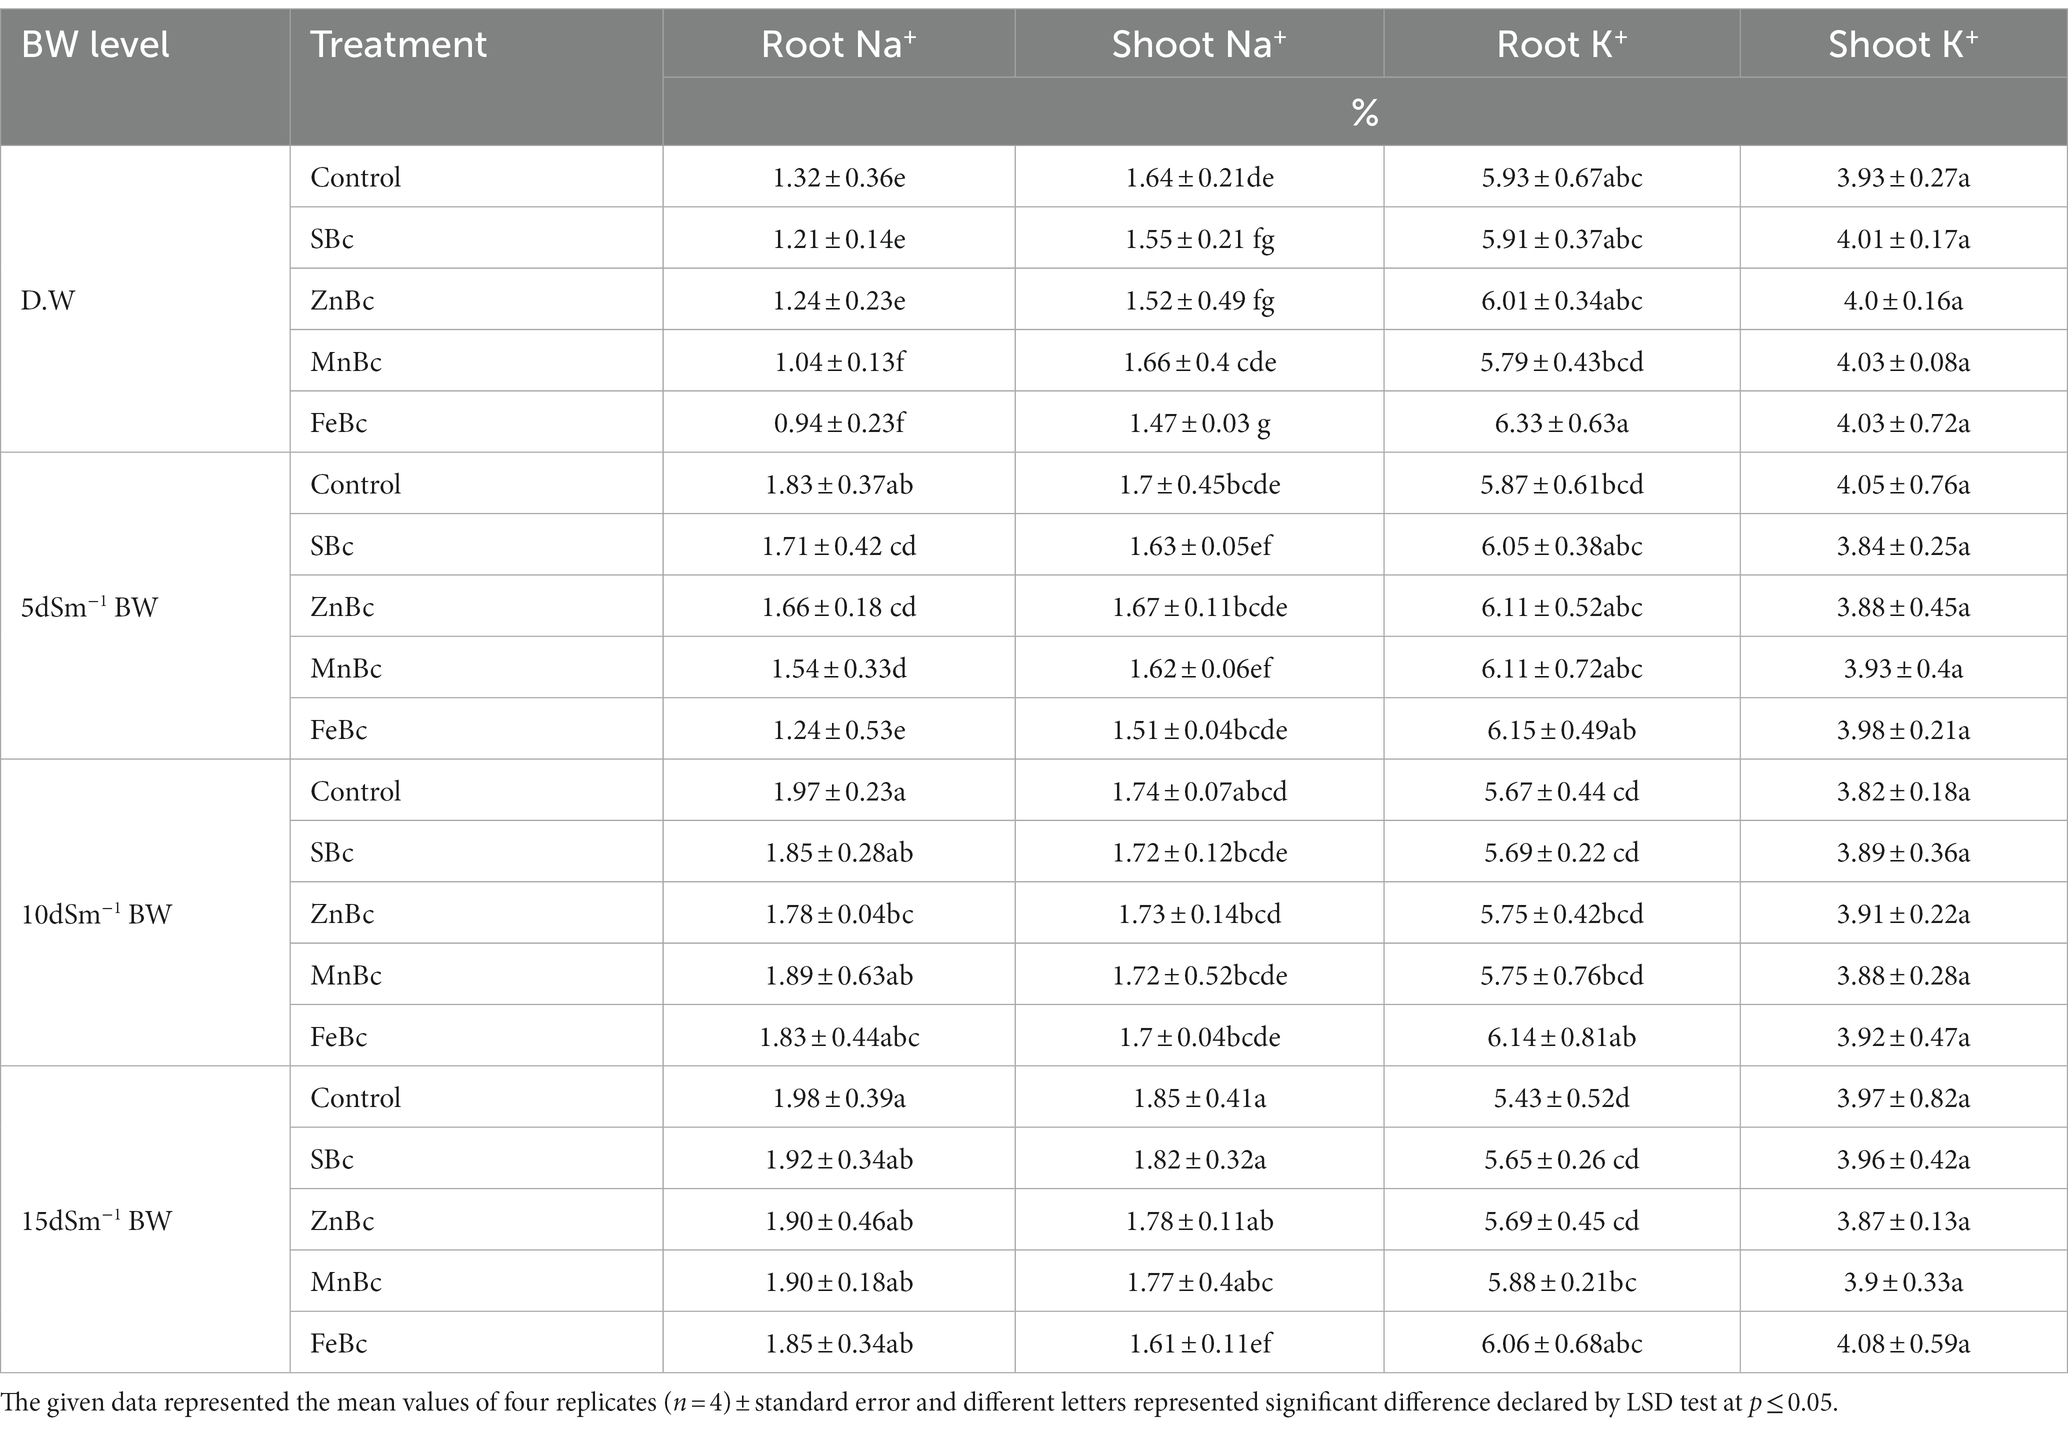
Table 3. Sodium (Na+) and potassium (K+) concentrations in root and shoot of T. aestivum L. reported with different levels of distilled water (D.W), brackish water (BW), and rice husk biochars such as simple biochar (SBc), zinc biochar (ZnBc), manganese biochar (MnBc), and iron biochar (FeBc) in a pot trial.
Similarly, the influence of ZnBc +15 dSm−1 BW pronounced significant (p ≤ 0.05) results to uptake of Zn through root (94%) and shoot (74%) when compared with control +15 and 5 dSm−1 BW, respectively (Figure 3). Application of MnBc +10 dSm−1 BW and MnBc +15 dSm−1 BW also significantly (p ≤ 0.05) influenced the maximum uptake of Mn in root (2-folds) and shoot (68%) of T. aestivum L. relative to their respective controls +10 and 15 dSm−1 BW (Figure 3). However, the availability of K+ in T. aestivum L. was significantly (p ≤ 0.05) influenced by the addition of MECBs (Table 3). Interestingly, the uptake of K+ was examined maximum (11%) in the root of the wheat plant under FeBc +15 dSm−1 BW when compared with control +15 dSm−1 BW; similarly, the maximum increase in uptake of shoot K+ (6%) was also observed under FeBc +15 dSm−1 BW when compared to control +15 dSm−1 of BW (Table 3). Sodium uptake by the roots and shoots of T. aestivum L. increased with the increased levels of BW application (Table 3). However, the application of MECBs significantly (p ≤ 0.05) reduced the uptake of Na+ by the root and shoot of the wheat plant (Table 3). The addition of FeBc +5 dSm−1 BW and FeBc +15 dSm−1 BW efficiently reduced the uptake of Na+ in root (32%) and shoot (13%) when compared with respective controls +5 and 15 dSm−1 BW (Table 3).
Brackish water application significantly (p ≤ 0.05) reduced the growth and photosynthetic parameters of T. aestivum L. (Table 4). However, FeBc +15 dSm−1 BW application increased (53%) the fresh weight of the shoot, and an increase in fresh root weight (40%) was also measured as compared to control +15 dSm−1 BW. Applications of FeBc +15 dSm−1 BW significantly increased (2-folds) the photosynthetic rate in T. aestivum L. when related to control +15 dSm−1 BW; while the transpiration rate of the plant was significantly decreased (49%) by the addition of FeBc +15 dSm−1 BW when compared to control +15 dSm−1 BW (Table 4). Similarly, a maximum increase (75%) in chl. a was observed under the application of FeBc +15 dSm−1 BW when compared to control +15 dSm−1 BW; interestingly, leaf chl. b was also efficiently increased (3-folds) by the application of FeBc +15 dSm−1 BW as compared to control +15 dSm−1 BW (Table 4).
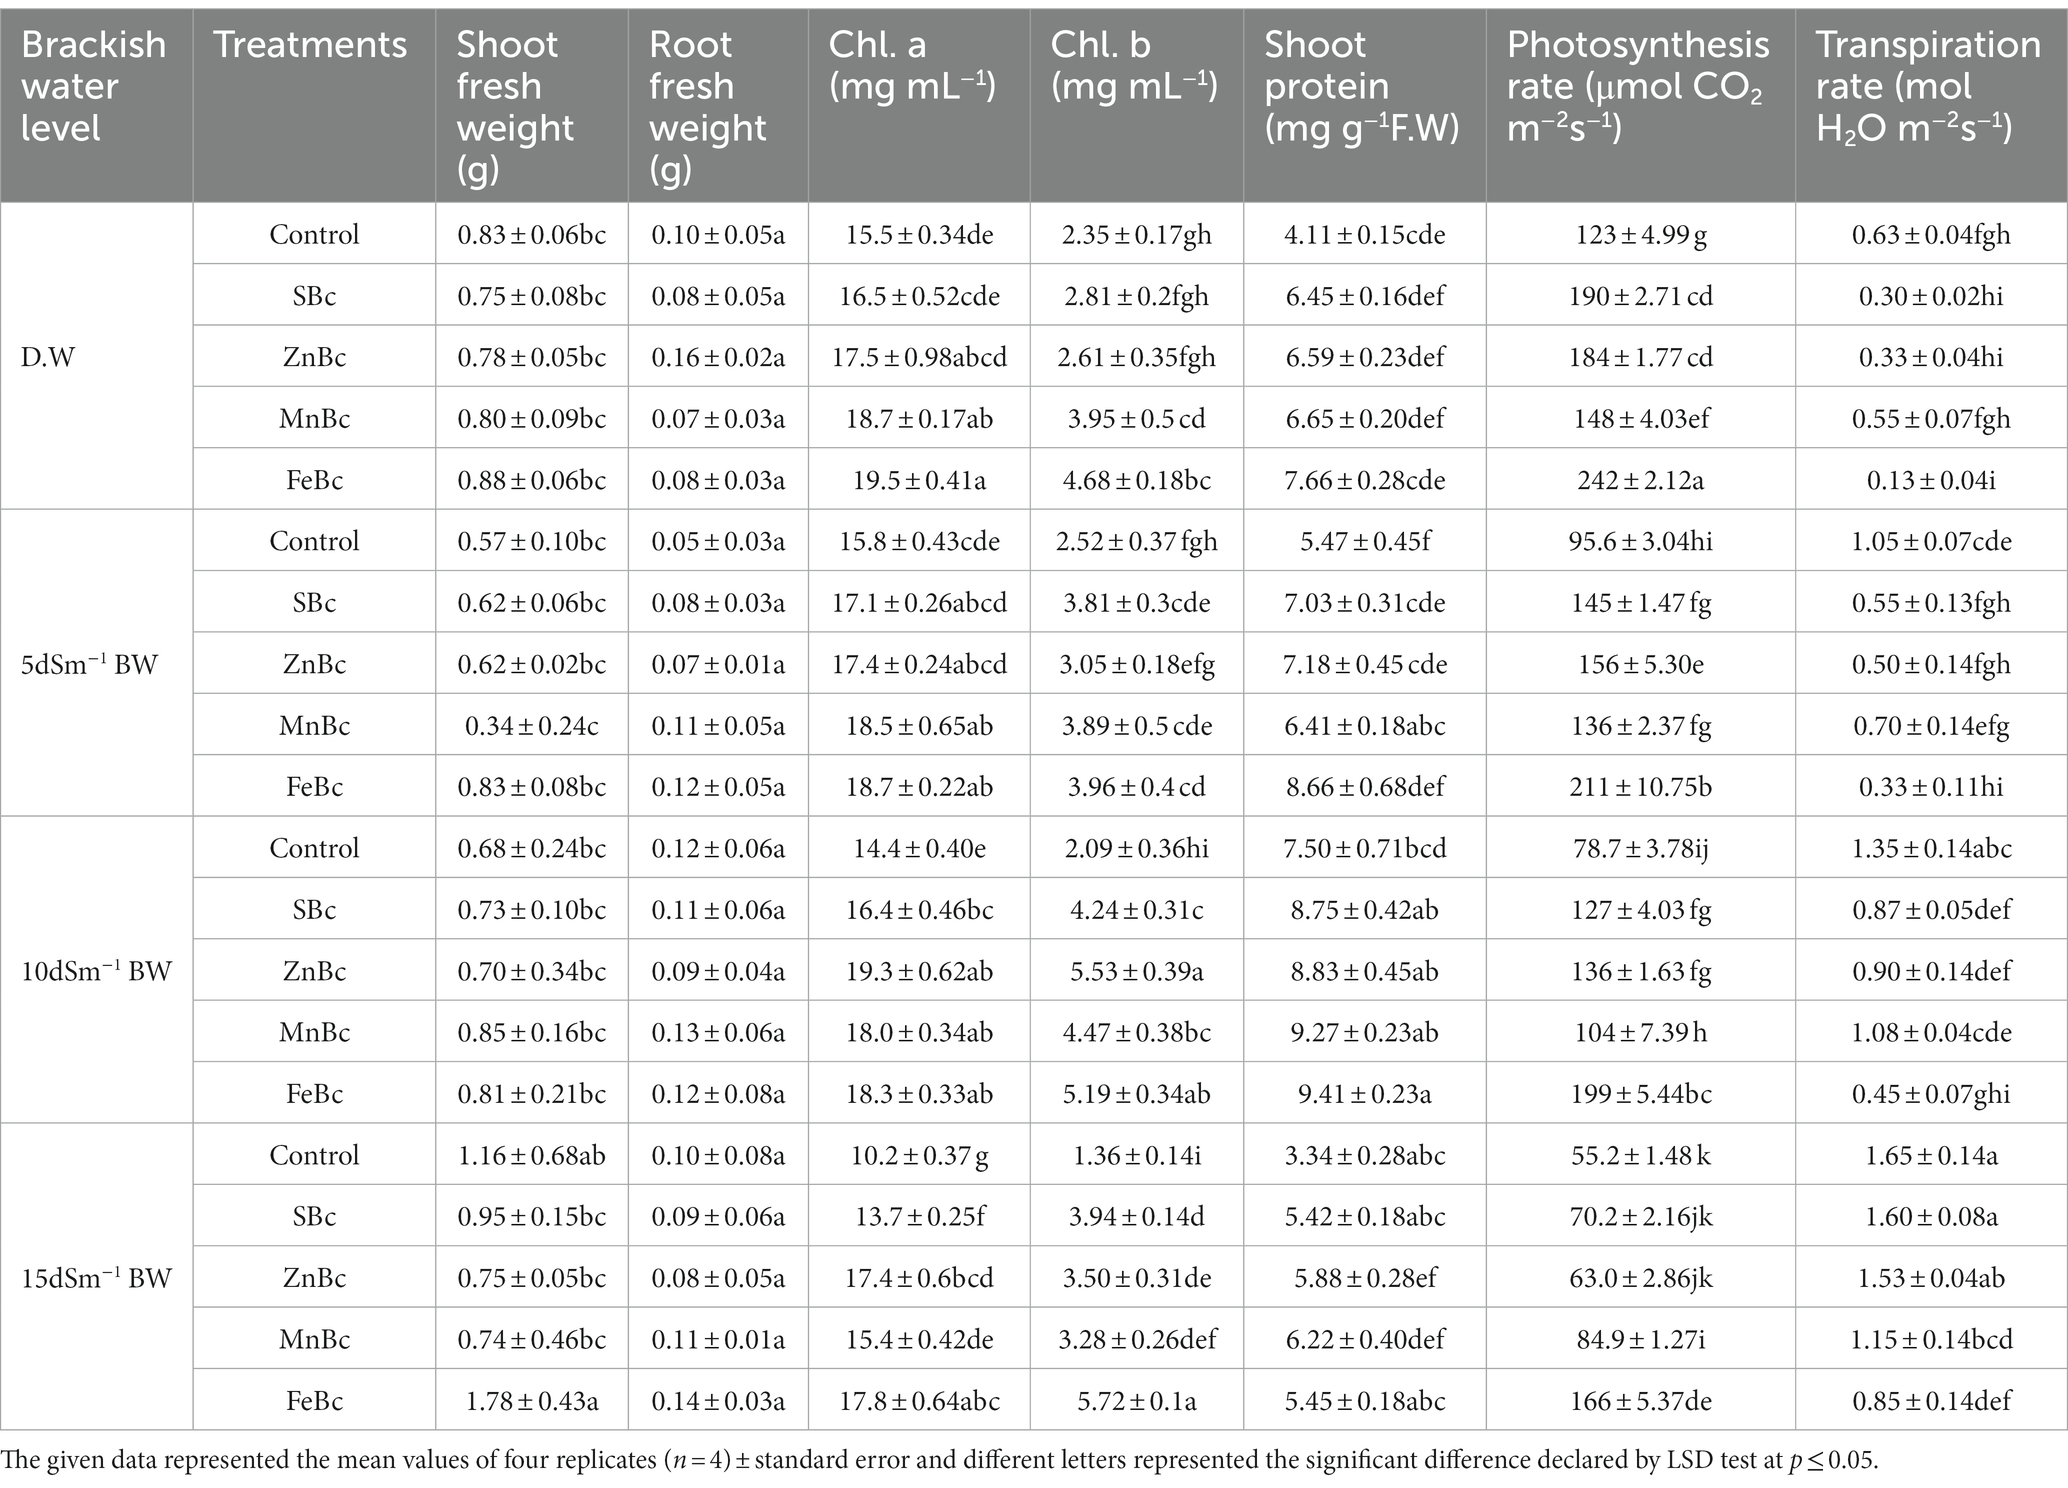
Table 4. Root and shoot fresh weight, the contents of shoot chl. a, chl. b, shoot protein and its photosynthetic and transpiration rate measured in T. aestivum L. grown with different levels of distilled water (D.W), brackish water (BW) and rice husk biochars such as simple biochar (SBc), zinc biochar (ZnBc), manganese biochar (MnBc) and iron biochar (FeBc) in a pot trial.
The application of FeBc +15 dSm−1 BW revealed a maximum reduction (45%) in the production of shoot malondialdehyde when compared with control +15 dSm−1 BW. While, the burst production of shoot H2O2 was also significantly decreased (53%) by the addition of FeBc +10 dSm−1 BW as compared with control +10 dSm−1 BW (Figure 4). Interestingly, a similar trend was observed in shoot CMP, where maximum reduction (63%) in CMP was observed by the addition of FeBc +10 dSm−1 BW relative to its control +10 dSm−1 BW (Figure 4).
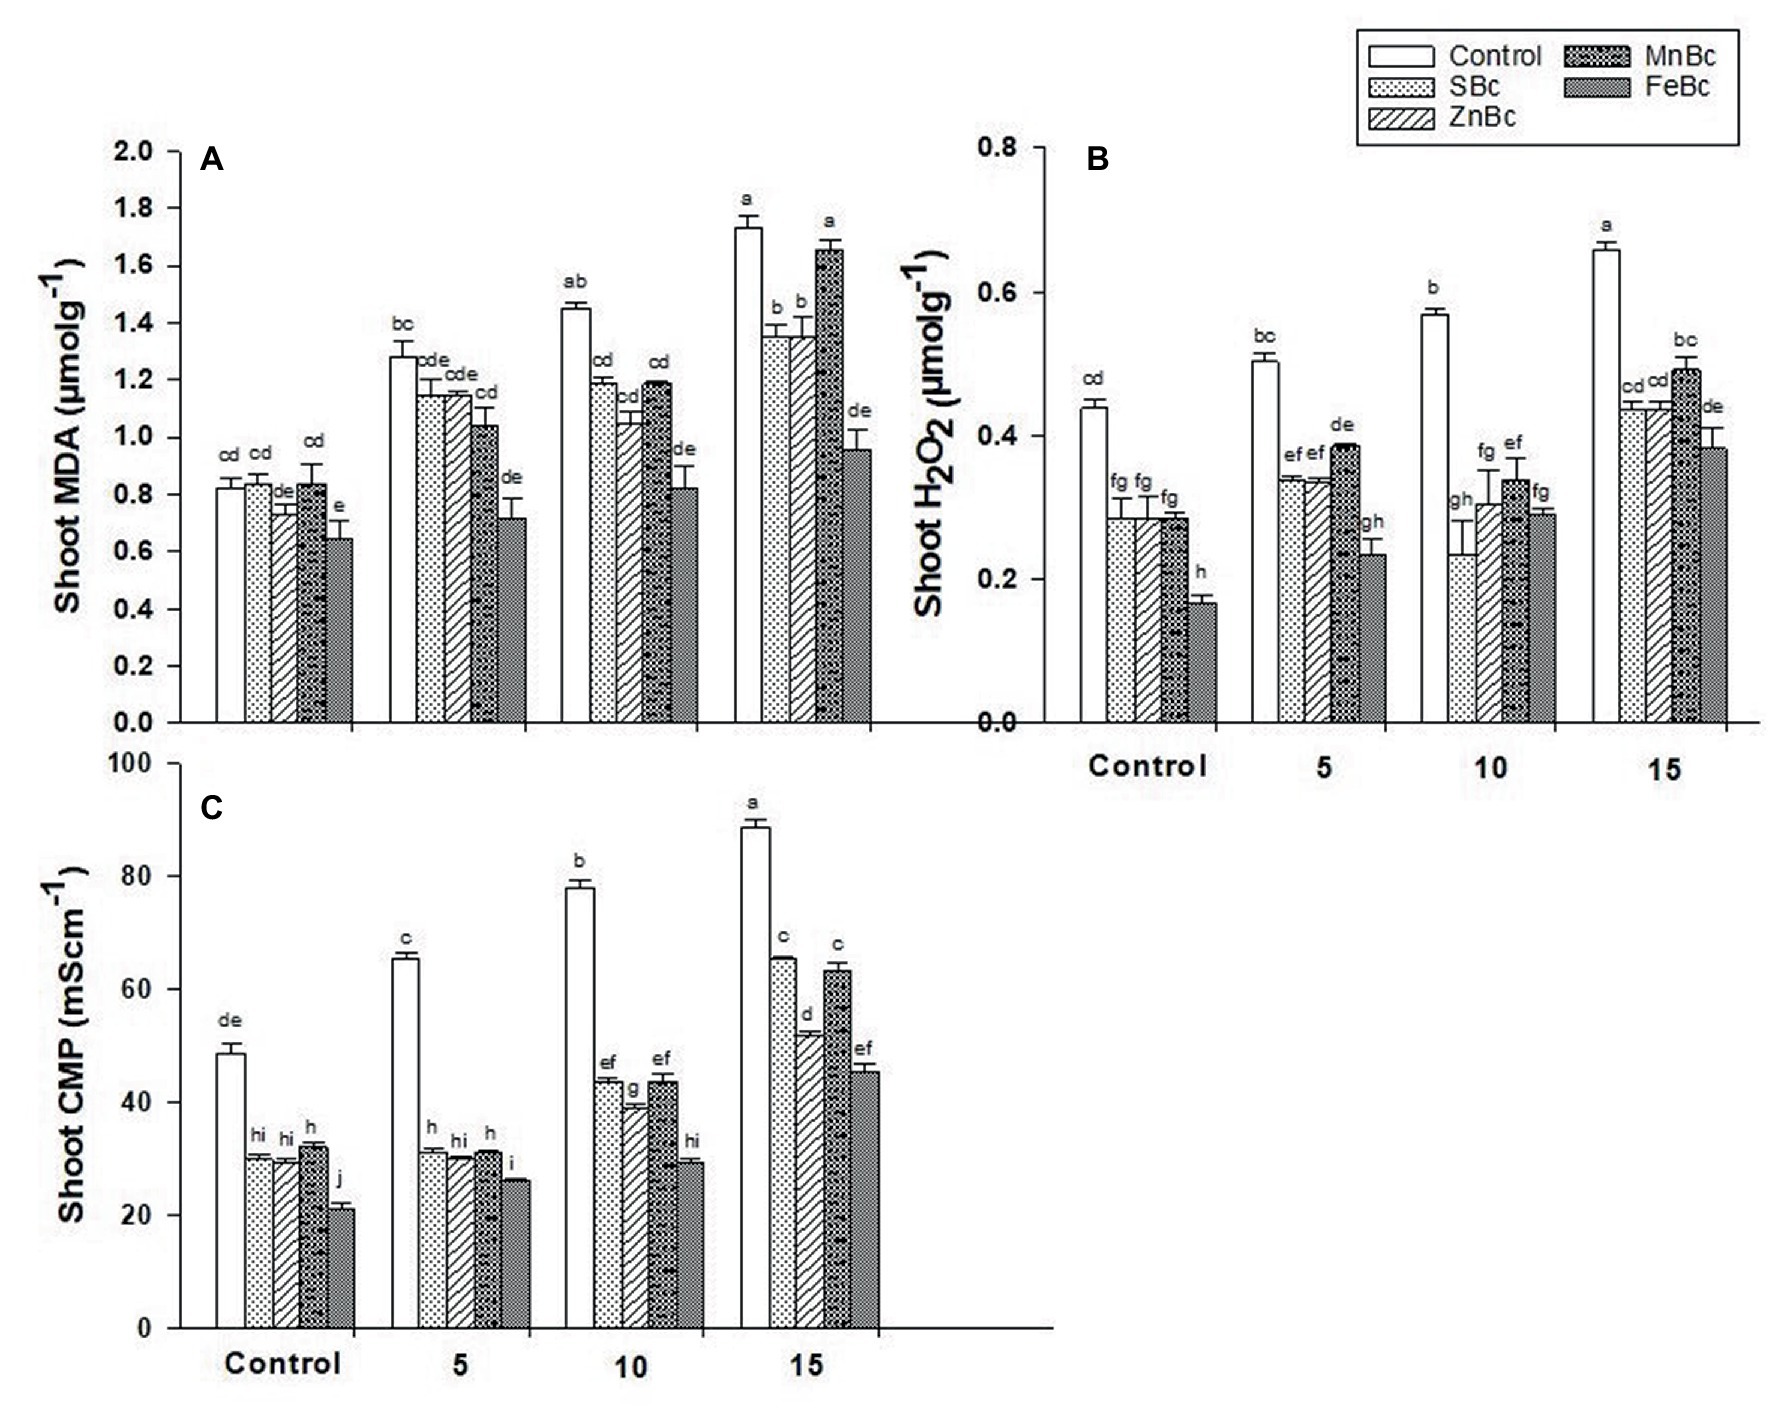
Figure 4. Concentrations of (A) Shoot MDA, (B) Shoot H2O2 and (C) Shoot CMP of T. aestivum L. grown under various treatments such as T1 = DW, T2 = DW + 0.1% SBc, T3 = DW + 0.1% ZnBc, T4 = DW + 0.1% MnBc, T5 = DW + 0.1% FeBc, T6 = 5dSm−1 BW, T7 = 5dSm−1 BW + 0.1% SBc, T8 = 5dSm−1 BW + 0.1% ZnBc, T9 = 5dSm−1 BW + 0.1% MnBc, T10 = 5dSm−1 BW + 0.1% FeBc, T11 = 10dSm−1 BW, T12 = 10dSm−1 BW + 0.1% SBc, T13 = 10dSm−1 BW + 0.1% ZnBc, T14 = 10dSm−1 BW + 0.1% MnBc, T15 = 10dSm−1 BW + 0.1% FeBc, T16 = 15dSm−1 BW, T17 = 15dSm−1 BW + 0.1% SBc, T18 = 15dSm−1 BW + 0.1% ZnBc, T19 = 15dSm−1 BW + 0.1% MnBc and T20 = 15dSm−1 BW + 0.1% FeBc where control = DW and 5, 10 and 15 are representing the rates of dSm−1 of BW. Values are the average of four replicates ± standard error (SE). Mean bars showing similar lower case alphabetic letters represented non-significant (p ≤ 0.05) to each other while different letters represented significant (p ≤ 0.05) difference declared by Two-Factors Factorial (ANOVA) using LSD test at p ≤ 0.05.
Similarly, the activities of antioxidant enzymes were also significantly (p ≤ 0.05) triggered by the first-order interaction of MECBs (Figure 5). Brackish water application significantly (p ≤ 0.05) decreased the efficiency of the antioxidant defense system in the root and shoot of T. aestivum L. relative to MECBs (Figure 5). However, the maximum (30%) APX activity in shoot was observed under FeBc +15 dSm−1 BW when compared to control +15 dSm−1 BW; similarly, FeBc +15 dSm−1 BW showed maximum effect in activating root APX (4-folds) relative to control +15 dSm−1 (Figure 5). While, a maximum increase in CAT activity (52%) was noted in the shoot with the application of FeBc +10 dSm−1 BW when compared to control +10 dSm−1 BW; similarly in the case of root, maximum catalase activity (1-fold) was also noted under FeBc +10 dSm−1 BW relative to control +10 dSm−1 BW (Figure 5).
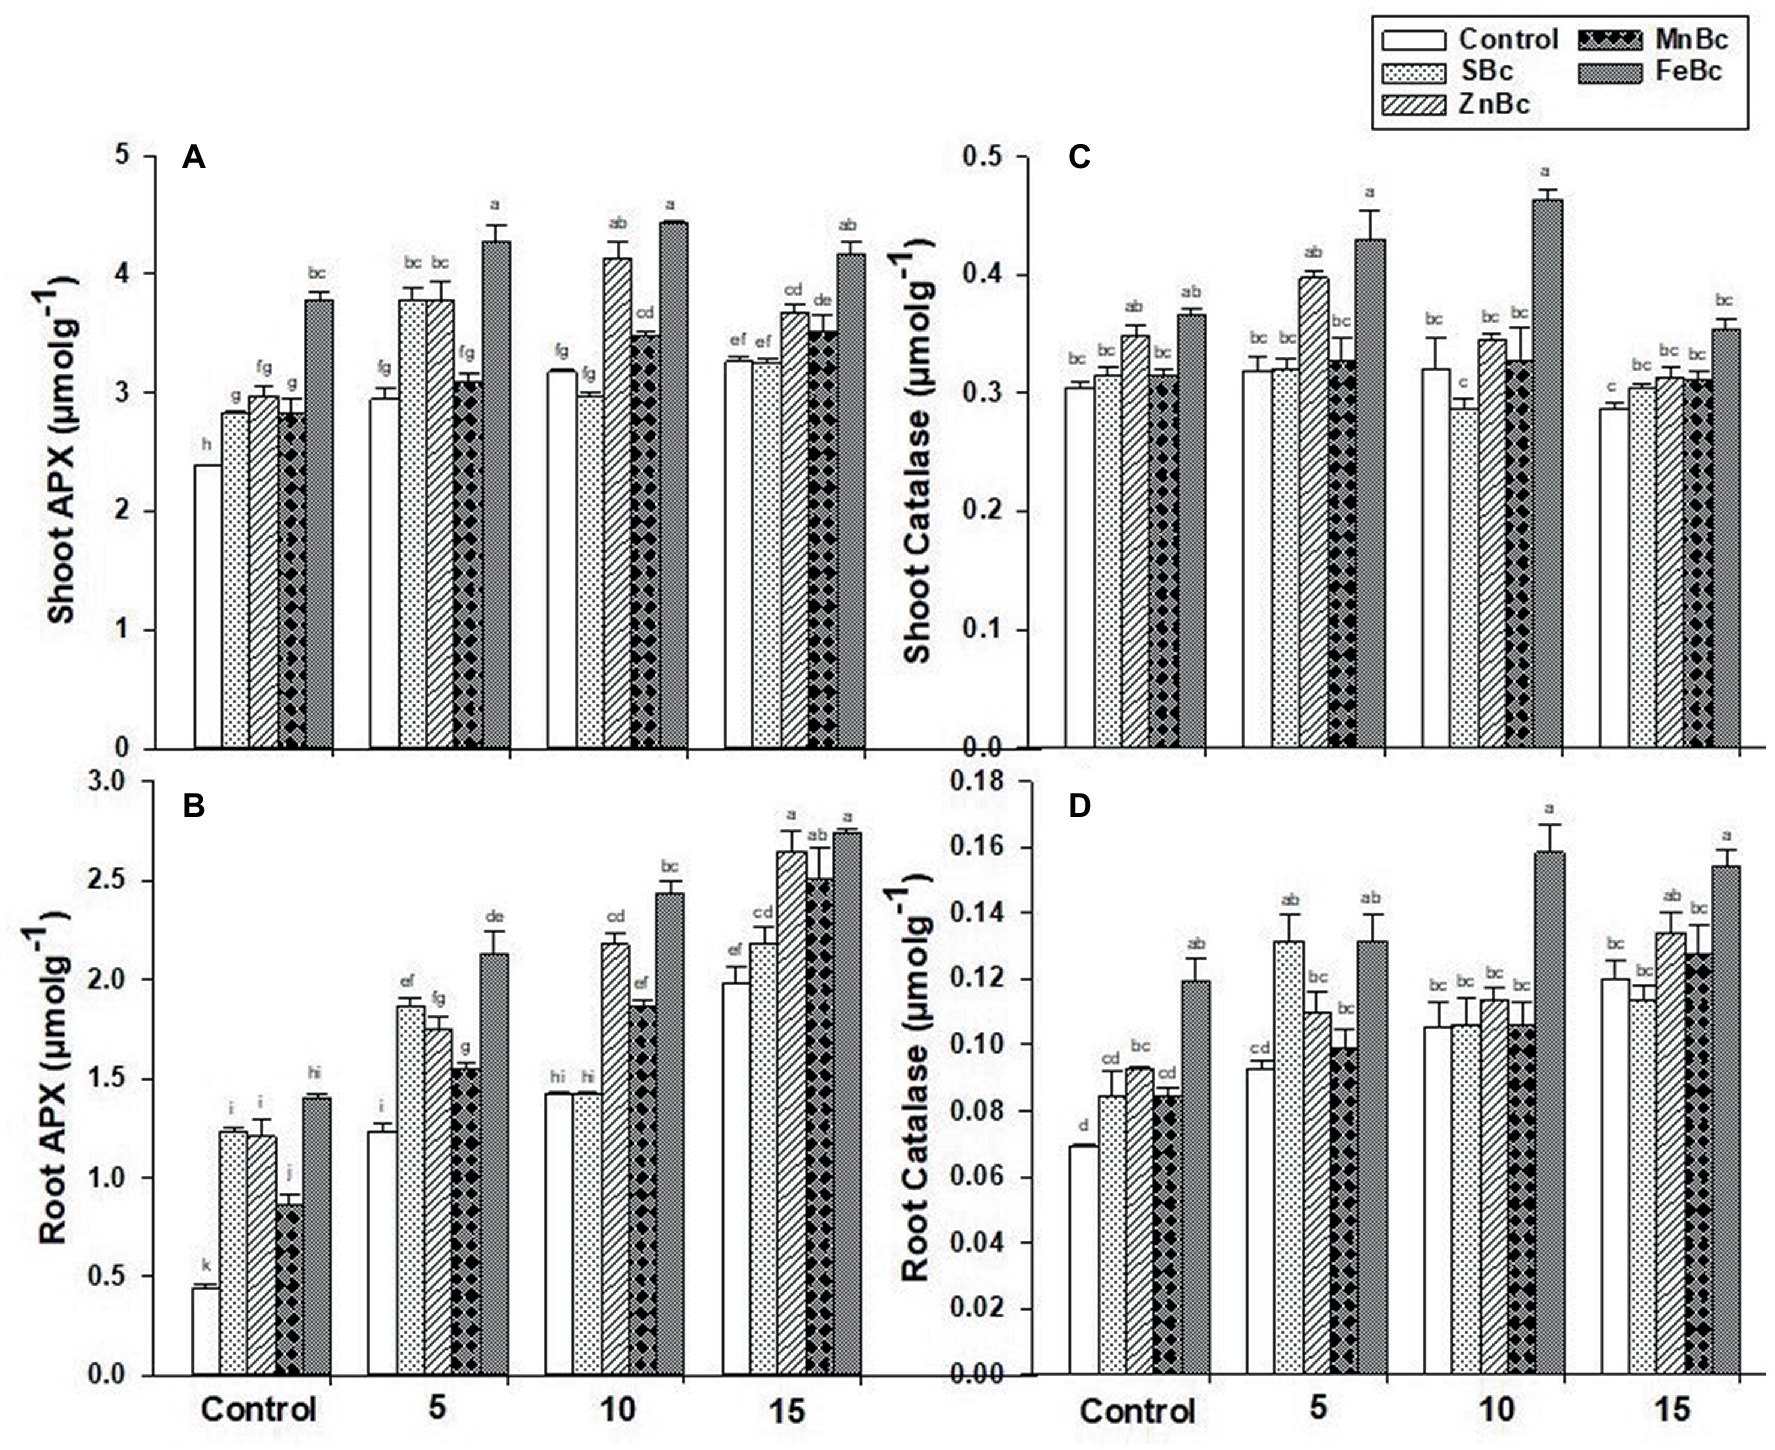
Figure 5. (A) Shoot APX, (B) Root APX, (C) Shoot Catalase, (D) Root Catalase of T. aestivum L. grown under various treatments such as T1 = DW, T2 = DW + 0.1% SBc, T3 = DW + 0.1% ZnBc, T4 = DW + 0.1% MnBc, T5 = DW + 0.1% FeBc, T6 = 5dSm−1 BW, T7 = 5dSm−1 BW + 0.1% SBc, T8 = 5dSm−1 BW + 0.1% ZnBc, T9 = 5dSm−1 BW + 0.1% MnBc, T10 = 5dSm−1 BW + 0.1% FeBc, T11 = 10dSm−1 BW, T12 = 10dSm−1 BW + 0.1% SBc, T13 = 10dSm−1 BW + 0.1% ZnBc, T14 = 10dSm−1 BW + 0.1% MnBc, T15 = 10dSm−1 BW + 0.1% FeBc, T16 = 15dSm−1 BW, T17 = 15dSm−1 BW + 0.1% SBc, T18 = 15dSm−1 BW + 0.1% ZnBc, T19 = 15dSm−1 BW + 0.1% MnBc and T20 = 15dSm−1 BW + 0.1% FeBc where control = DW and 5, 10 and 15 are representing the rates of dSm−1 of BW. Values are the average of four replicates ± standard error (SE). Mean bars showing similar lower case alphabetic letters represented non-significant (p ≤ 0.05) to each other while different letters represented significant (p ≤ 0.05) difference declared by Two-Factors Factorial (ANOVA) using LSD test at p ≤ 0.05.
The application of MECBs significantly (p ≤ 0.05) enhanced the protein and phenolic contents in T. aestivum L. by efficiently regulating the effects of BW (Table 4; Figure 6). The results of protein content in the shoot of T. aestivum L. were well pronounced by the applications of MECBs (Table 4). However, significant increase (72%) in shoot protein content was observed under FeBc +10 dSm−1 BW when compared with control +10 dSm−1 BW; while, maximum increase (86%) in protein content was observed under MnBc +15 dSm−1 BW when compared with control +15 dSm−1 BW in shoot (Table 4). Interestingly, the maximum concentration of total phenolic in the root (20%) and shoot (26%) was also observed under FeBc +15 dSm−1 BW in T. aestivum L. when compared to control +15 dSm−1 BW (Figure 6).
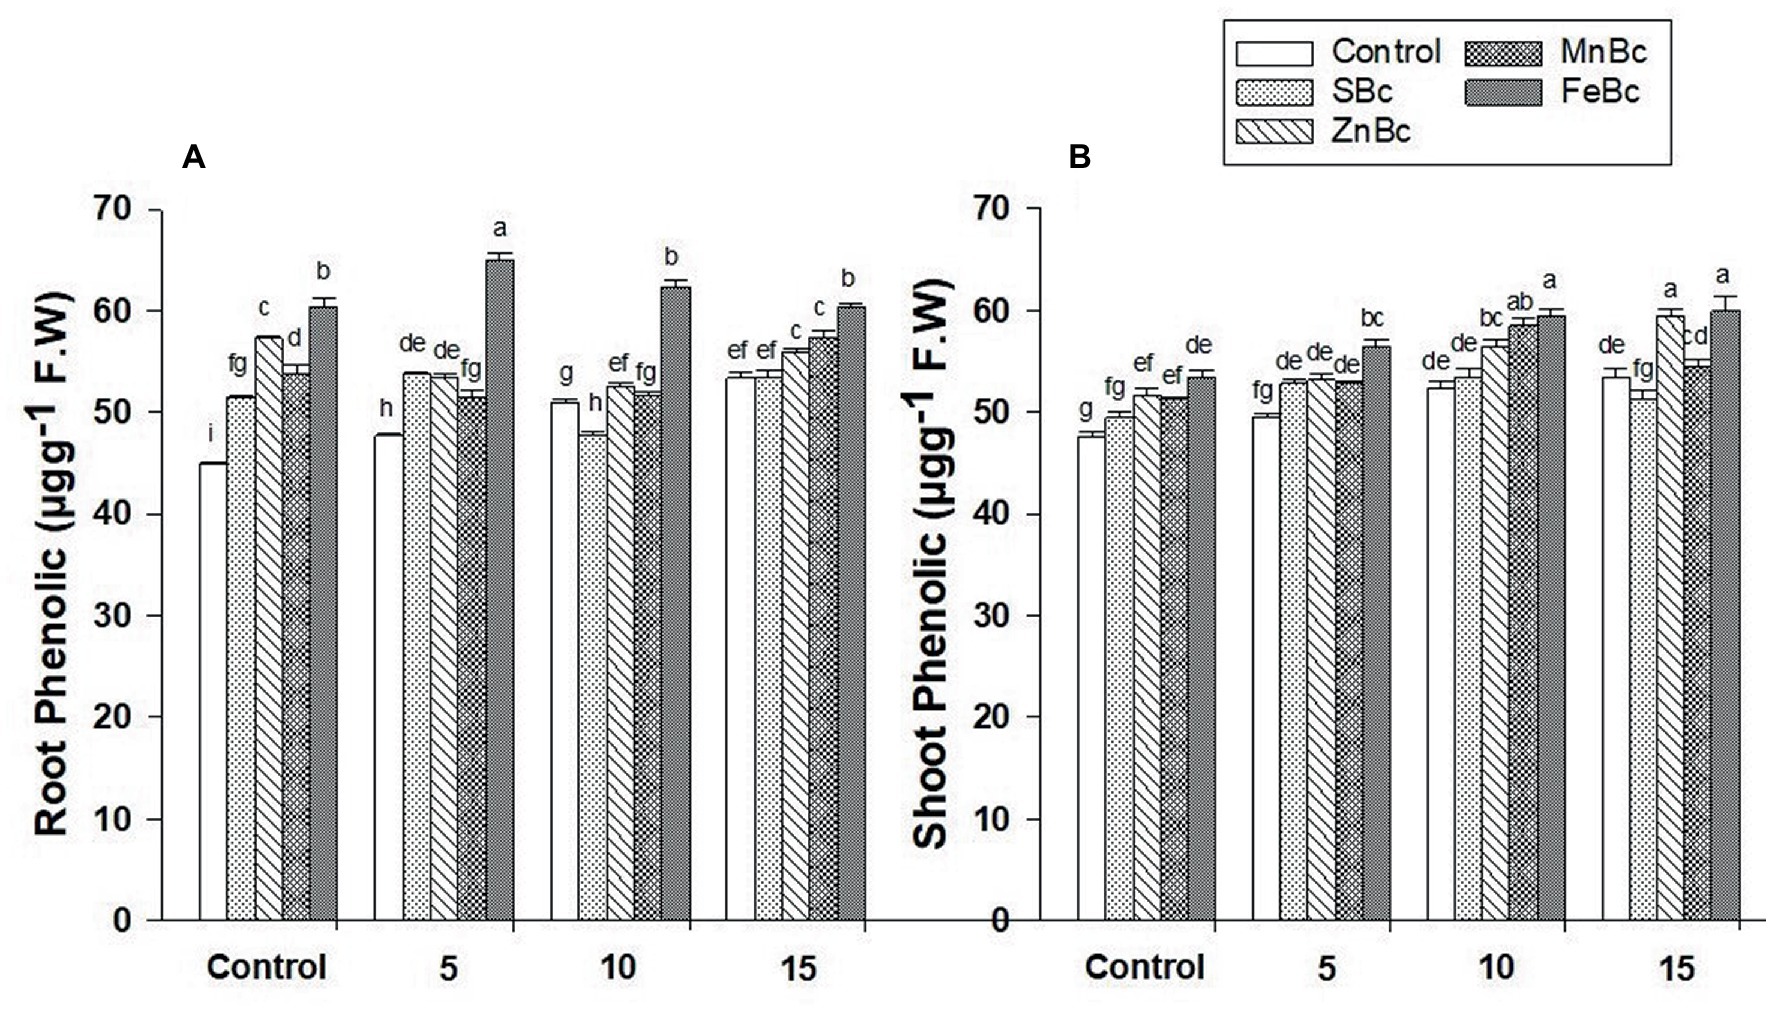
Figure 6. (A) Root Phenolic and (B) Shoot Phenolic of T. aestivum L. grown under various treatments such as T1 = DW, T2 = DW + 0.1% SBc, T3 = DW + 0.1% ZnBc, T4 = DW + 0.1% MnBc, T5 = DW + 0.1% FeBc, T6 = 5dSm−1 BW, T7 = 5dSm−1 BW + 0.1% SBc, T8 = 5dSm−1 BW + 0.1% ZnBc, T9 = 5dSm−1 BW + 0.1% MnBc, T10 = 5dSm−1 BW + 0.1% FeBc, T11 = 10dSm−1 BW, T12 = 10dSm−1 BW + 0.1% SBc, T13 = 10dSm−1 BW + 0.1% ZnBc, T14 = 10dSm−1 BW + 0.1% MnBc, T15 = 10dSm−1 BW + 0.1% FeBc, T16 = 15dSm−1 BW, T17 = 15dSm−1 BW + 0.1% SBc, T18 = 15dSm−1 BW + 0.1% ZnBc, T19 = 15dSm−1 BW + 0.1% MnBc and T20 = 15dSm−1 BW + 0.1% FeBc where control = DW and 5, 10 and 15 are representing the rates of dSm−1 of BW. Values are the average of four replicates ± standard error (SE). Mean bars showing similar lower case alphabetic letters represented non-significant (p ≤ 0.05) to each other while different letters represented significant (p ≤ 0.05) difference declared by Two-Factors Factorial (ANOVA) using LSD test at p H 0.05.
The physicochemical properties of soil were significantly affected by the application of BW (Table 2). Brackish water with excessive Na+ and Cl− is a major environmental stress that not only increased the availability of Na+ and Cl− in soil but also in the cytosol of plants at a toxic level (Tanveer and Yousaf, 2020). Furthermore, Zhang et al. (2019) reported that the soil EC was significantly enhanced with the increase in the level of BW. Due to the unique properties of FeBc, it acts as an incredible soil conditioner; hence it significantly influenced the pH, EC, and Na+ of soil (Table 5). Similarly, the application of SBc and remaining MECBs also improved the physicochemical properties of soil by mitigating the adverse impacts of saline stress as shown in the PCA biplot (Figure 2; Supplementary Table S1). A similar study reported that biochar is a powerful adsorbent of Na+ and Cl− ions mitigating salinity stress in soil (Patel et al., 2017) as it provides electrostatic interactions by forming OH− groups (Saffari et al., 2016). Thus, the retention of Na+ and Cl− ions is significantly attributed by van der walls forces (physical adsorption) under the addition of minerals-enriched biochar (Parkash and Singh, 2020). Moreover, MECBs may provide additional benefits to soil health and plant growth by providing essential nutrients such as Fe, Zn, and Mn (Cao et al., 2016). However, the specific effects of MECBs on bioavailable Na+ in soil may depend on various factors such as soil type, Bc composition, and management practices. Some studies have investigated the effects of Bc on soil Na+ levels. For example, Zhang et al. (2016) found that adding Bc to saline-alkali soil reduced soil Na+ levels and increased soil organic matter content. Similarly, Zhao et al. (2018) reported that applying biochar reduced soil Na+ levels in sodic soil. Overall, while there is limited research on the specific effects of MECBs on bioavailable Na+ in soil, Bc has been shown to improve soil properties and may have potential to reduce soil Na+ levels in certain contexts. Similarly, it was clearly shown in the PCA biplot, the variation in values of pH and EC were non-significant among the different time intervals (8th, 16th, and 24th day of incubation) (Figure 2; Table 2). The overall scenario of EC revealed that the movement of ions (Na+ and Cl−) efficiently increased with time which might be due to the increased availability of essential nutrients in soil treated by SBc and MECBs under salinity stress (Table 2). Likewise, a similar study reported that the salinity and biochar application increased the pH of the soil, but this change in pH remained non-significant (Zhang et al., 2019).
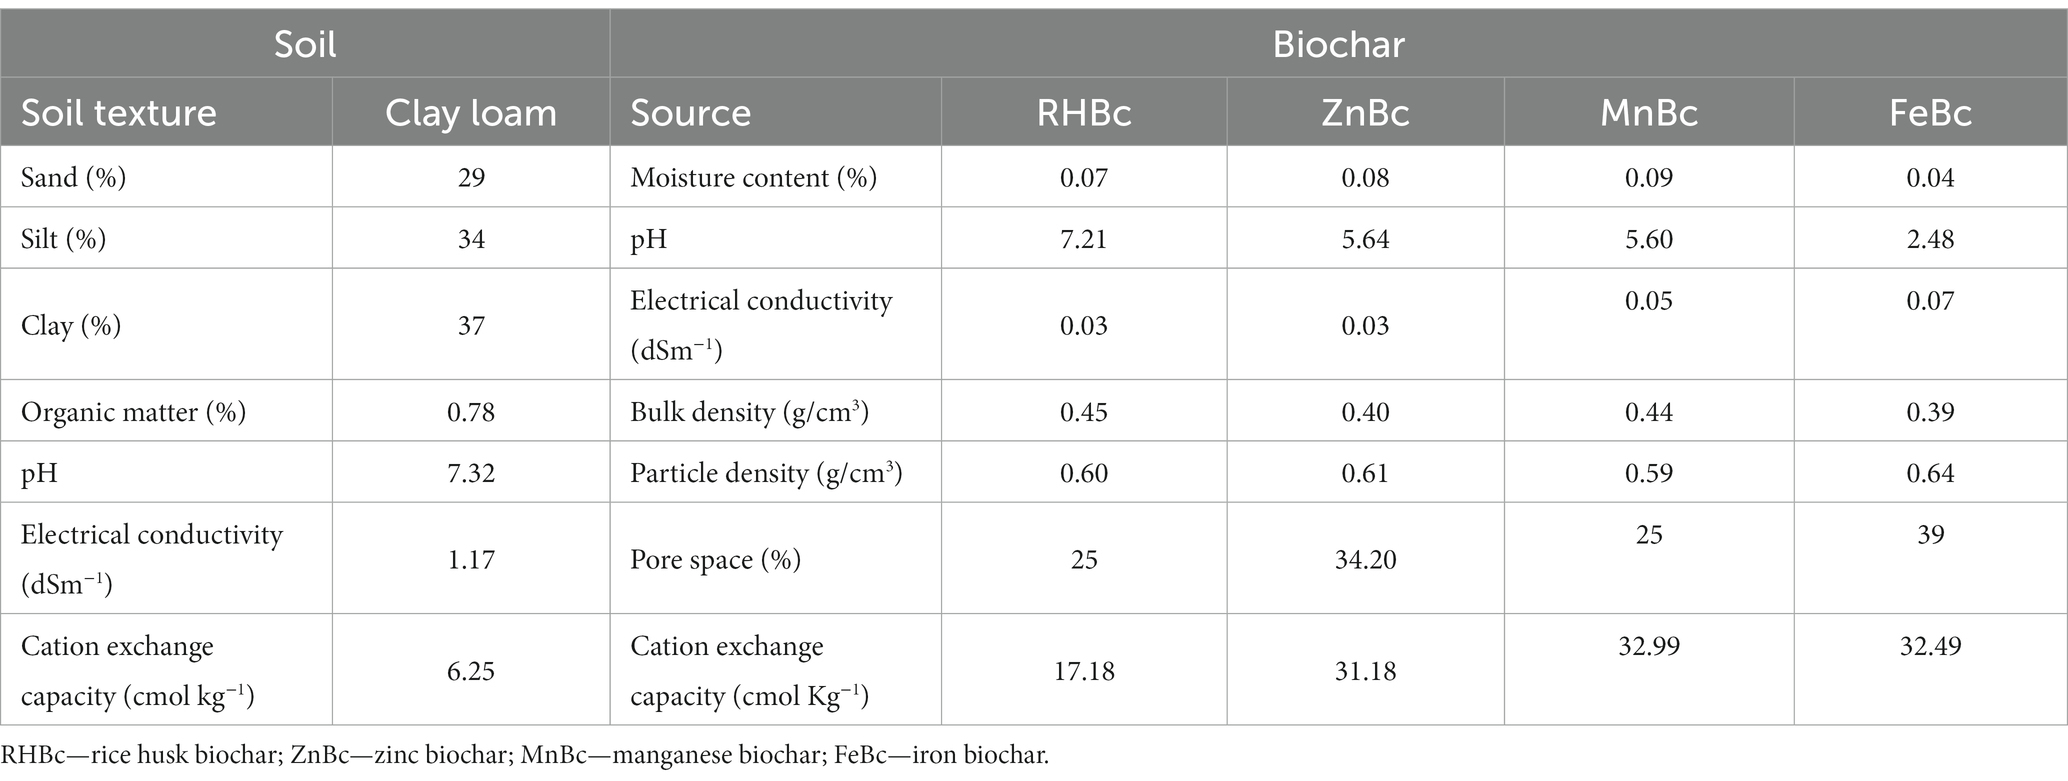
Table 5. Characterization of bhal soil and all sorts of biochar.
Moreover, results revealed that K+/Na+ homeostasis in wheat roots were significantly (p ≤ 0.05) influenced by the addition of MECBs especially FeBc (Table 3). Although, the presence of optimized biochar improved soil properties; so, more uptake of ions was examined by the roots of T. aestivum L.; however, there was non-significant change in shoot K+ concentration reported with applid treatments (Figure 3; Table 3). Different studies suggested that Na+ accumulation is a common response of plants to salt stress, while K+ concentration remains relatively constant in plant’s shoot (Flowers and Colmer, 2008; Wang et al., 2012). The exact mechanisms underlying this response are still under investigation, but it is thought to involve selective ion transporters and channels in the plasma membrane of root and shoot cells. Zhang et al. (2018) examined that K+ ions are essential for plants and oxidative stress is efficiently decreased by the enhanced K+ content in plant roots. Generally, Na+ and K+ balance effectively regulates the salt stress which might be due to the presence of high concentrations of Fe, Zn, and Mn in soil and T. aestivum L. (Figure 3; Supplementary Table S1); thus, endorsing ion balance (Zhang et al., 2018). As, MECBs are acidic in nature; so, its application significantly (p ≤ 0.05) influenced the pH (acidic) of soil which played a vital role in activating the effect of biochar in NaCl sorption (Supplementary Table S1). Although, EC is decreased in soil with biochar addition which might cause a decrease in soil evaporation through high water holding capacity but increased salt leaching, soil porosity, and hydraulic conductivity (Dahlawi et al., 2018). Interestingly, the same trend was investigated in this proposed study under salinity stress (Supplementary Table S1).
The growth and physiology of T. aestivum L. were significantly (p ≤ 0.05) affected under salinity stress (Table 4). It might be due to the more uptake of Na+ and Cl− ions from root to shoot which inhibit cell division because excess of Na+ and Cl− ions have the ability to attach with the plant cell wall ultimately reducing its overall growth (Muro-González et al., 2020). Furthermore, it leads to the inhibition of K+ influx which adversely affects the photosynthetic machinery of the plant thus causing stomatal closure, damaged thylakoid membranes, disturbed ionic and osmotic homeostasis, oxidative damage, and disruption in the synthesis of secondary metabolites; a similar trend for photosynthetic rate was investigated in this research study (Table 4; Khoshbakht et al., 2018; Muro-González et al., 2020; Zhao et al., 2020). However, the transpiration rate also significantly (p ≤ 0.05) decreased in T. aestivum L. through the addition of MEBs; thus, growth and physiology were improved efficiently by increasing the soil’s water holding capacity under salinity stress (Table 4). Thus, salt stress is positively regulated by the activation of Medicago sativa GSK-3 kinase (present in plastid) through moderating sugar metabolism (Zhao et al., 2020). Salt stress is also efficiently tolerated through two major enzymes (Fad6 and GPAT) which localized in the plastid to balance the fluidity of thylakoid membrane thus moderating fatty acid metabolism (Suo et al., 2017). Recovery of PSII is also associated with some genes such as RUB and RCI present in chloroplasts through more K+ influx under high salinity; however, the production of ROS mainly in the apoplast, chloroplast, mitochondria, and peroxisomes also significantly scavenged due to normalization of photosynthetic machinery (Calderon et al., 2013). Similarly, the results of photosynthetic activities were highly consistent with this mode of action (Table 4). However, Farooq et al. (2020) has been reported salinity tolerance (30%) in Vigna unguiculata L. (Walp. Plant) with application of simple organic-originated biochar when compared to control. Moreover, Taqdees et al. (2022) also reported increased chl. a and b (70% and 76%) through the application of Zn and Si amended biochar, respectively under salinity stress.
Salinity stress significantly (p ≤ 0.05) caused oxidative damage in the wheat plant through uncontrolled production of reactive oxygen compounds (Figure 4). Salinity stress causes stomatal closure in the shoot of plants which leads to burst production of ROS under high Na+ concentration (Rejeb et al., 2015). Thus, oxidative damage induced in plants by the Mehler reaction (PSI), production of singlet oxygen (PSII) in the thylakoid membrane, and H2O2 production due to the inhibition of water splitting manganese-complex which allow more electrons to leak from PSI-II resulting high rates of CMP (Lee et al., 2013). Similarly, this trend of electrolyte leakage has also been reported in this proposed study (Figure 4) and also previous studies under salinity stress (Dong et al., 2017; Kotagiri and Kolluru, 2017; Hniličková et al., 2019).
The application of MECBs significantly (p ≤ 0.05) triggered the activities of antioxidant enzymes which efficiently scavenged ROS production under salinity stress (Figure 5). The presence of minerals (Zn, Fe, Mn) act as structural components of APX and CAT which prevent the plant from oxidative damage; moreover, Zn and Fe as a cofactor also trigger the activities of antioxidants to scavenge the free radicles which ultimately protects the proteins and lipids from being further damaged (Marreiro et al., 2017). Thus, reduced Na+ and increased K+ uptake efficiently stimulates the ascorbate mutant (vtc2-I) which converts H2O2 into an H2O molecule; which further triggers the activities of APX and CAT through efficiently scavenging production of ROS in plants (Haruta et al., 2014) and the findings of this proposed study were highly consistent to this mechanism (Figure 5). Interestingly, Kul et al. (2021) reported that oxidative damage in tomato plants was efficiently recovered by the application of rice husk biochar (5%) by efficiently influencing SOD (6.1%) and CAT (6.9%) under NaCl stress.
As to cope the oxidative damage; non-enzymatic mechanisms were also triggered inside the plant body which further lowered the effects of ROS by producing a greater number of hydroxyl (OH−) groups under salinity stress (Feng et al., 2018). The application of MECBs significantly increased the content of proteins and total phenolic; while the results were well pronounced in T. aestivum L. with the application of FeBc under different rates of BW (Table 4; Figure 6). Thus, more salt stress is tolerated by the activation of mitochondrial genes (AOXI and Mn-SOD) causing improvement in metabolic activities and flow of water (reduced osmotic stress) in plants, which efficiently improved the overall growth and physiology of plants (Zhao et al., 2020). A similar study examined the increase in contents of total phenolics (1.7-folds) in summer savory plants treated with organic material pyrolyzed biochar (2%) under NaCl stress (Mehdizadeh et al., 2019a,b). Moreover, similar results with the application of ZnO nanoparticles have also been reported by Noohpisheh et al. (2021) in cultivars of Trigonella foenum-graecum under salinity stress.
The current study demonstrated that the combined amendment of rice husk biochar and different minerals (Zn, Fe, and Mn) significantly improved the physicochemical parameters of salt-affected soil and thus improved the physiology and overall growth of T. aestivum L. This could be attributed to the multiple benefits of stress tolerance, enhanced nutrient supply, water retention, and plant growth improvement. However, results were well pronounced with the application of FeBc +15 dSm−1 BW. Hence, it was demonstrated that abiotic stresses (salinity stress, etc.) in the environment can efficiently be tolerated through the application of different rates of biochar; while, the adsorption efficiency could be doubled by optimizing it with different minerals (Zn, Fe, and Mn) especially Fe to enhance soil fertility and crop yield.
The original contributions presented in the study are included in the article/Supplementary material, further inquiries can be directed to the corresponding authors.
W-u-DK conceived the idea and designed the research. MM, W-u-DK, and AK conducted the experiment and analyzed the data. MM, W-u-DK, SR, and WG developed the full draft and analyzed the data. W-u-DK, AK, SR, and WG revised and critically reviewed the manuscript. All authors contributed to the subsequent development, approved the final manuscript, and reviewed the manuscript carefully.
Authors remained highly thankful to the National Natural Science Foundation of China (Grant No. 51709265) and the Agricultural Science and Technology and Innovation program (Grant No. CAAS-ASTIP) for funding this research. Similarly, authors also endorsed the funding provided by Punjab Agricultural Research Board in their project, PARB project no. 894 to carry out extensive laboratory work. Authors are also thankful to the Office of Research, Innovation and Commercialization (ORIC) GC University Lahore, for financial assistance to MM during this research work.
Authors are highly thankful to the Zafar Siddique, Director, Botanical Garden, Government College University Lahore for their support in carrying out the experiment.
The authors declare that the research was conducted in the absence of any commercial or financial relationships that could be construed as a potential conflict of interest.
All claims expressed in this article are solely those of the authors and do not necessarily represent those of their affiliated organizations, or those of the publisher, the editors and the reviewers. Any product that may be evaluated in this article, or claim that may be made by its manufacturer, is not guaranteed or endorsed by the publisher.
The Supplementary material for this article can be found online at: https://www.frontiersin.org/articles/10.3389/fsufs.2023.1102930/full#supplementary-material
Abbas, G., Rehman, S., Saqib, M., Amjad, M., Murtaza, B., Siddiqui, M. H., et al. (2022). Resistance to NaCl salinity is positively correlated with iron and zinc uptake potential of wheat genotypes. Crop Pasture Sci. 73, 546–555. doi: 10.1071/CP21478
Abd El-Mageed, T. A., Rady, M. M., Taha, R. S., Abd El-Azeam, S., Simpson, C. R., and Semida, W. M. (2020). Effects of integrated use of residual sulfur-enhanced biochar with effective microorganisms on soil properties, plant growth and short-term productivity of Capsicum annuum under salt stress. Sci. Hortic. 261:108930. doi: 10.1016/j.scienta.2019.108930
Ali, S., Rizwan, M., Qayyum, M. F., Ok, Y. S., Ibrahim, M., Riaz, M., et al. (2017). Biochar soil amendment on alleviation of drought and salt stress in plants: a critical review. Environ. Sci. Pollut. Res. 24, 12700–12712. doi: 10.1007/s11356-017-8904-x
Amini, S., Ghadiri, H., Chen, C., and Marschner, P. (2016). Salt-affected soils, reclamation, carbon dynamics, and biochar: a review. J. Soils Sediments 16, 939–953. doi: 10.1007/s11368-015-1293-1
Amitrano, C., Rouphael, Y., Pannico, A., De Pascale, S., and De Micco, V. (2021). Reducing the evaporative demand improves photosynthesis and water use efficiency of indoor cultivated lettuce. Agronomy 11:1396. doi: 10.3390/agronomy11071396
Bakhoum, G. S., Sadak, M. S., and Badr, E. A. (2020). Mitigation of adverse effects of salinity stress on sunflower plant (Helianthus annuus L.) by exogenous application of chitosan. Bull. Natl. Res. Centre 44, 1–11. doi: 10.1186/s42269-020-00343-7
Bolton, L., Joseph, S., Greenway, M., Donne, S., Munroe, P., and Marjo, C. E. (2019). Phosphorus adsorption onto an enriched biochar substrate in constructed wetlands treating wastewater. Ecol. Eng. 142:100005. doi: 10.1016/j.ecoena.2019.100005
Cakmak, I., and Marschner, H. (1992). Magnesium deficiency and high light intensity enhance activities of superoxide dismutase, ascorbate peroxidase, and glutathione reductase in bean leaves. Plant Physio 98, 1222–1227. doi: 10.1104/pp.98.4.1222
Calderon, R. H., García-Cerdán, J. G., Malnoë, A., Cook, R., Russell, J. J., Gaw, C., et al. (2013). A conserved rubredoxin is necessary for photosystem II accumulation in diverse oxygenic photoautotrophs. J. Biol. Chem. 288, 26688–26696. doi: 10.1074/jbc.M113.487629
Cao, X., Harris, W., and Lehmann, J. (2016). Biochar-based nano-composites for environmental applications. J. Mater. Chem. A 4, 6191–6209.
Dad, F. P., Khan, W. U., Tanveer, M., Ramzani, P. M., Shaukat, R., and Muktadir, A. (2020). Influence of iron-enriched biochar on cd sorption, its ionic concentration and redox regulation of radish under cadmium toxicity. Agriculture 11:1. doi: 10.3390/agriculture11010001
Dahlawi, S., Naeem, A., Rengel, Z., and Naidu, R. (2018). Biochar application for the remediation of salt-affected soils: challenges and opportunities. Sci. Total Environ. 625, 320–335. doi: 10.1016/j.scitotenv.2017.12.257
Dong, Y., Wang, W., Hu, G., Chen, W., Zhuge, Y., Wang, Z., et al. (2017). Role of exogenous 24-epibrassinolide in enhancing the salt tolerance of wheat seedlings. J. Soil Sci. Plant Nutr. 17, 554–569. doi: 10.4067/S0718-95162017000300001
Farooq, M., Rehman, A., Al-Alawi, A. K., Al-Busaidi, W. M., and Lee, D. J. (2020). Integrated use of seed priming and biochar improves salt tolerance in cowpea. Sci. Hortic. 272:109507. doi: 10.1016/j.scienta.2020.109507
Farrar, M. B., Wallace, H. M., Xu, C. Y., Nguyen, T. T., Tavakkoli, E., Joseph, S., et al. (2019). Short-term effects of organo-mineral enriched biochar fertiliser on ginger yield and nutrient cycling. J. Soils Sediments 19, 668–682. doi: 10.1007/s11368-018-2061-9
Feng, W., Kita, D., Peaucelle, A., Cartwright, H. N., Doan, V., Duan, Q., et al. (2018). The FERONIA receptor kinase maintains cell-wall integrity during salt stress through Ca2+ signaling. Curr. Biol. 28, 666–675.e5. doi: 10.1016/j.cub.2018.01.023
Flowers, T. J., and Colmer, T. D. (2008). Salinity tolerance in halophytes. New Phytol. 179, 945–963. doi: 10.1111/j.1469-8137.2008.02531.x
Hafeez, B. M., Khanif, Y. M., and Saleem, M. (2013). Role of zinc in plant nutrition-a review. Am. J. Exp. Agric. 3, 374–391. doi: 10.9734/AJEA%2F2013%2F2746
Hailegnaw, N. S., Mercl, F., Pračke, K., Száková, J., and Tlustoš, P. (2019). Mutual relationships of biochar and soil pH, CEC, and exchangeable base cations in a model laboratory experiment. J. Soils Sediments 19, 2405–2416. doi: 10.1007/s11368-019-02264-z
Haruta, M., Sabat, G., Stecker, K., Minkoff, B. B., and Sussman, M. R. (2014). A peptide hormone and its receptor protein kinase regulate plant cell expansion. Science 343, 408–411. doi: 10.1126/science.1244454
Hniličková, H., Hnilička, F., Orsák, M., and Hejnák, V. (2019). Effect of salt stress on growth, electrolyte leakage, Na+ and K+ content in selected plant species. Plant Soil Environ. 65, 90–96. doi: 10.1016/j.ecoena.2019.100005
Hussain, S., Khalid, M. F., Hussain, M., Ali, M. A., Nawaz, A., Zakir, I., et al. (2018). “Role of micronutrients in salt stress tolerance to plants” in Plant nutrients and abiotic stress tolerance. eds. M. Hasanuzzaman, M. Fujita, H. Oku, K. Nahar, and B. Hawrylak-Nowak (Singapore: Springer), 363–376.
Ippolito, J. A., Laird, D. A., and Busscher, W. J. (2012). Environmental benefits of biochar. J. Environ. Qual. 41, 967–972. doi: 10.2134/jeq2012.0151
Ishfaq, M., Wakeel, A., Shahzad, M. N., Kiran, A., and Li, X. (2021). Severity of zinc and iron malnutrition linked to low intake through a staple crop: a case study in east-Central Pakistan. Environ. Geochem. Health 43, 4219–4233. doi: 10.1007/s10653-021-00912-3
Jambunathan, N. (2010). Determination and detection of reactive oxygen species (ROS), lipid peroxidation, and electrolyte leakage in plants. Methods Mol Biol 639, 292–298. doi: 10.1007/978-1-60761-702-0_18
Khan, W. U., Aziz, T., Maqsood, M. A., Farooq, M., Abdullah, Y., Ramzani, P. M., et al. (2018). Silicon nutrition mitigates salinity stress in maize by modulating ion accumulation, photosynthesis, and antioxidants. Photosynthetica 56, 1047–1057. doi: 10.1007/s11099-018-0812-x
Khan, M. A., Islam, E., Shirazi, M. U., Mumtaz, S., Mujtaba, S. M., Khan, M. A., et al. (2010). Physiological responses of various wheat genotypes to salinity. Pak. J. Bot. 42, 3497–3505.
Khan, W. U., Shaukat, R., Farooq, M. A., Ashraf, M. N., Nadeem, F., Tanveer, M., et al. (2022). Iron-doped biochar regulated soil nickel adsorption, wheat growth, its physiology and elemental concentration under contrasting abiotic stresses. Sustainability 14:7852. doi: 10.3390/su14137852
Khoshbakht, D., Asghari, M. R., and Haghighi, M. (2018). Effects of foliar applications of nitric oxide and spermidine on chlorophyll fluorescence, photosynthesis and antioxidant enzyme activities of citrus seedlings under salinity stress. Photosynthetica 56, 1313–1325. doi: 10.1007/s11099-018-0839-z
Kizito, S., Luo, H., Lu, J., Bah, H., Dong, R., and Wu, S. (2019). Role of nutrient-enriched biochar as a soil amendment during maize growth: exploring practical alternatives to recycle agricultural residuals and to reduce chemical fertilizer demand. Sustainability 11:3211. doi: 10.3390/su11113211
Kotagiri, D., and Kolluru, V. C. (2017). Effect of salinity stress on the morphology and physiology of five different coleus species. Biomed. Pharmacol. J. 10, 1639–1649. https://dx.doi.org/10.13005/bpj/1275
Krishna, T. P., Maharajan, T., and Ceasar, S. A. (2022). The role of membrane transporters in the biofortification of zinc and iron in plants. Biol. Trace Elem. Res. 201, 464–478. doi: 10.1007/s12011-022-03159-w
Kul, R., Arjumend, T., Ekinci, M., Yildirim, E., Turan, M., and Argin, S. (2021). Biochar as an organic soil conditioner for mitigating salinity stress in tomato. Soil Sci. Plant Nutr. 67, 693–706. doi: 10.1080/00380768.2021.1998924
Lee, Y., Rubio, M. C., Alassimone, J., and Geldner, N. (2013). A mechanism for localized lignin deposition in the endodermis. Cells 153, 402–412. doi: 10.1016/j.cell.2013.02.045
Li, R., Wang, J. J., Gaston, L. A., Zhou, B., Li, M., Xiao, R., et al. (2018). An overview of carbothermal synthesis of metal–biochar composites for the removal of oxyanion contaminants from aqueous solution. Carbo 129, 674–687. doi: 10.1016/j.carbon.2017.12.070
Lockyer, S., White, A., and Buttriss, J. L. (2018). Biofortified crops for tackling micronutrient deficiencies–what impact are these having in developing countries and could they be of relevance within Europe? Nutr. Bull. 43, 319–357. doi: 10.1111/nbu.12347
Malik, A., Tayyab, H., Ullah, A., and Talha, M. (2021). Dynamics of salinity and land use in Punjab Province of Pakistan. Pak. J. Agric. Res. 34, 16–22. doi: 10.17582/journal.pjar/2021/34.1.16.22
Mansoor, S., Ali Wani, O., Lone, J. K., Manhas, S., Kour, N., Alam, P., et al. (2022). Reactive oxygen species in plants: from source to sink. Antioxidants 11:225. doi: 10.3390/antiox11020225
Marreiro, D. D., Cruz, K. J., Morais, J. B., Beserra, J. B., Severo, J. S., and De Oliveira, A. R. (2017). Zinc and oxidative stress: current mechanisms. Antioxidants 6:24. doi: 10.3390/antiox6020024
Mehdizadeh, L., Moghaddam, M., and Lakzian, A. (2019a). Effect of biochar on growth characteristics and sodium to potassium ratio of summer savory (Satureja hortensis L.) under NaCl stress. Environ. Stresses Crop Sci. 12, 595–606. doi: 10.22077/escs.2019.1419.1308
Mehdizadeh, L., Moghaddam, M., and Lakzian, A. (2019b). Response of summer savory at two different growth stages to biochar amendment under NaCl stress. Arch. Agron. Soil Sci. 65, 1120–1133. doi: 10.1080/03650340.2018.1554248
Moradi, S., Rasouli-Sadaghiani, M. H., Sepehr, E., Khodaverdiloo, H., and Barin, M. (2019). Soil nutrients status affected by simple and enriched biochar application under salinity conditions. Environ. Monit. Assess. 191, 257–213. doi: 10.1007/s10661-019-7393-4
Mumtaz, S., Saleem, M. H., Hameed, M., Batool, F., Parveen, A., Amjad, S. F., et al. (2021). Anatomical adaptations and ionic homeostasis in aquatic halophyte Cyperus laevigatus L. under high salinities. Saudi J. Biol. Sci. 28, 2655–2666. doi: 10.1016/j.sjbs.2021.03.002
Munir, M., Hussain, M., Farooq, M., Nawaz, A., Hussain, S., and Yasmeen, A. (2021). Nitrogen fertilization in wheat under salt stress: impact on growth and yield. Plan. Theory 10:113.
Muro-González, D. A., Mussali-Galante, P., Valencia-Cuevas, L., Flores-Trujillo, K., and Tovar-Sánchez, E. (2020). Morphological, physiological, and genotoxic effects of heavy metal bioaccumulation in Prosopis laevigata reveal its potential for phytoremediation. Environ. Sci. Pollut. Res. 27, 40187–40204. doi: 10.1007/s11356-020-10026-5
Nakano, Y., and Asada, K. (1981). Hydrogen peroxide is scavenged by ascorbate-specific peroxidase in spinach chloroplasts. Plant Cell Physiol. 22, 867–880. doi: 10.1093/oxfordjournals.pcp.a076232
Noohpisheh, Z., Amiri, H., Mohammadi, A., and Farhadi, S. (2021). Effect of the foliar application of zinc oxide nanoparticles on some biochemical and physiological parameters of Trigonella foenum-graecum under salinity stress. Plant Biosyst. 155, 267–280. doi: 10.1080/11263504.2020.1739160
Parkash, V., and Singh, S. (2020). Potential of biochar application to mitigate salinity stress in eggplant. HortScience 55, 1946–1955. doi: 10.21273/HORTSCI15398-20
Patel, A., Khare, P., and Patra, D. D. (2017). “Biochar mitigates salinity stress in plants” in Plant Adaptation Strategies in Changing Environment. eds. V. Shukla, S. Kumar, and N. Kumar (Singapore: Springer) doi: 10.1007/978-981-10-6744-0_6
Rabiya, U. E., Ali, M., Farooq, M. A., Siddiq, Z., Alamri, S. A., Siddiqui, M. H., et al. (2022). Comparative efficiency of silica gel, biochar, and plant growth promoting bacteria on Cr and Pb availability to Solanum melongena L. in contaminated soil irrigated with wastewater. Front. Plant Sci. 13,:950362. doi: 10.3389/fpls.2022.950362
Rani, S., Sharma, M. K., and Kumar, N. (2019). Impact of salinity and zinc application on growth, physiological and yield traits in wheat. Curr. Sci. 116:1324. doi: 10.18520/cs/v116/i8/1324-1330
Rejeb, K. B., Benzarti, M., Debez, A., Bailly, C., Savouré, A., and Abdelly, C. (2015). NADPH oxidase-dependent H2O2 production is required for salt-induced antioxidant defense in Arabidopsis thaliana. J. Plant Physiol. 174, 5–15. doi: 10.1016/j.jplph.2014.08.022
Rout, G. R., and Sahoo, S. (2015). Role of iron in plant growth and metabolism. Rev. Agric. Sci. 3, 1–24. doi: 10.7831/ras.3.1
Saffari, M., Saffari, V. R., Aliabadi, M. M., Haghighi, M. J., and Moazallahi, M. (2016). Influence of organic and inorganic amendments on cadmium sorption in a calcareous soil. Main Group Metal Chem. 39, 195–207. doi: 10.1515/mgmc-2016-0028
Singleton, V. L., Orthofer, R., and Lamuela-Raventós, R. M. (1999). Analysis of total phenols and other oxidation substrates and antioxidants by means of folin-ciocalteu reagent. Methods Enzymol. 299, 152–178. doi: 10.1016/S0076-6879(99)99017-1
Steele, C. C., and Grabau, L. J. (1997). Planting dates for early‐maturing soybean cultivars. Agronomy 89, 449–453. doi: 10.2134/agronj1997.00021962008900030013x
Strain, H. H., and Svec, W. A. (1966). Extraction, separation, estimation, and isolation of the chlorophylls. Chlorophylls, 21–66. doi: 10.1016/B978-1-4832-3289-8.50008-4
Suo, J., Zhao, Q., David, L., Chen, S., and Dai, S. (2017). Salinity response in chloroplasts: insights from gene characterization. Int. J. Mol. Sci. 18:1011. doi: 10.3390/ijms18051011
Takarina, N. D., and Pin, T. G. (2017). Bioconcentration factor (BCF) and translocation factor (TF) of heavy metals in mangrove trees of Blanakan fish farm. Makara J. Sci. 21:4. doi: 10.7454/mss.v21i2.7308
Tan, X. F., Liu, Y. G., Gu, Y. L., Xu, Y., Zeng, G. M., Hu, X. J., et al. (2016). Biochar-based nano-composites for the decontamination of wastewater: a review. Bioresour. Technol. 212, 318–333. doi: 10.1016/j.biortech.2016.04.093
Tanveer, M., and Yousaf, U. (2020). “Plant single-cell biology and abiotic stress tolerance” in Plant life under changing environment (Cambridge, MA: Academic Press), 611–626.
Taqdees, Z., Khan, J., Kausar, S., Afzaal, M., and Akhtar, I. (2022). Silicon and zinc nanoparticles-enriched miscanthus biochar enhanced seed germination, antioxidant defense system, and nutrient status of radish under NaCl stress. Crop Pasture Sci. 73, 556–572. doi: 10.1071/CP21342
Thomas, E., Borchard, N., Sarmiento, C., Atkinson, R., and Ladd, B. (2020). Key factors determining biochar sorption capacity for metal contaminants: a literature synthesis. Biochar 2, 151–163. doi: 10.1007/s42773-020-00053-3
Torabian, S., Farhangi-Abriz, S., and Rathjen, J. (2018). Biochar and lignite affect H+-ATPase and H+-PPase activities in root tonoplast and nutrient contents of mung bean under salt stress. Plant Physiol. Biochem. 129, 141–149. doi: 10.1016/j.plaphy.2018.05.030
USDA. (2023). Available at: https://ipad.fas.usda.gov/countrysummary/Default.aspx?id=PK&crop=Wheat
Velikova, V., Yordanov, I., and Edreva, A. (2000). Oxidative stress and some antioxidant systems in acid rain-treated bean plants: protective role of exogenous polyamines. Plant Sci. 151, 59–66. doi: 10.1016/S0168-9452(99)00197-1
Wang, L., Li, X., Gao, Y., Shen, Q., and Guo, S. (2012). NaCl improves growth and photosynthesis of the halophyte Suaeda salsa, by altering ion accumulation and enhancing photosynthetic capacity. J. Plant Physiol. 169, 429–433. doi: 10.1016/j.jplph.2011.11.011
Xiao, L., Li, M. H., Dai, J., Motelica-Heino, M., Chen, X. F., Wu, J. L., et al. (2020). Assessment of earthworm activity on cu, cd, Pb and Zn bioavailability in contaminated soils using biota to soil accumulation factor and DTPA extraction. Ecotoxicol. Environ. Saf. 195:110513. doi: 10.1016/j.ecoenv.2020.110513
Yasmin, H., Mazher, J., Azmat, A., Nosheen, A., Naz, R., Hassan, M. N., et al. (2021). Combined application of zinc oxide nanoparticles and biofertilizer to induce salt resistance in safflower by regulating ion homeostasis and antioxidant defence responses. Ecotoxicol. Environ. Saf. 218:112262. doi: 10.1016/j.ecoenv.2021.112262
Zhang, J., Bai, Z., Huang, J., Hussain, S., Zhao, F., Zhu, C., et al. (2019). Biochar alleviated the salt stress of induced saline paddy soil and improved the biochemical characteristics of rice seedlings differing in salt tolerance. Soil Tillage Res. 195:104372. doi: 10.1016/j.still.2019.104372
Zhang, Y., Fang, J., Wu, X., and Dong, L. (2018). Na+/K+ balance and transport regulatory mechanisms in weedy and cultivated rice (Oryza sativa L.) under salt stress. BMC Plant Biol. 18, 1–14. doi: 10.1186/s12870-018-1586-9
Zhang, Y., Liu, X., Li, X., Wan, Y., Zhou, J., Tan, Z., et al. (2016). Effects of biochar application on saline-alkali soil chemical properties and crop yield. Appl. Soil Ecol. 99, 1–9.
Zhang, X., Liang, X., Wu, Y., Ma, X., Shi, Y., Han, R., et al. (2020). Salt stress decreases phosphorus use efficiency in maize by affecting phosphate transport and signaling. Front. Plant Sci. 11:616.
Zhao, X., Wang, H., Liao, S., Huang, L., and Cao, X. (2018). Effects of biochar on sodic soil properties and winter wheat yield in Northeast China. Catena 165, 125–132.
Keywords: incubation trial, minerals, brackish water, photosynthesis, antioxidants
Citation: Mukhtar MS, Khan W-u-D, Khan AU, Rahman SU and Guo W (2023) Enhancing the wheat growth through micronutrients enriched biochar under salt stress. Front. Sustain. Food Syst. 7:1102930. doi: 10.3389/fsufs.2023.1102930
Edited by:
Izhar Ali, Guangxi University Nanning, ChinaReviewed by:
Salar Farhangi-Abriz, University of Tabriz, IranCopyright © 2023 Mukhtar, Khan, Khan, Rahman and Guo. This is an open-access article distributed under the terms of the Creative Commons Attribution License (CC BY). The use, distribution or reproduction in other forums is permitted, provided the original author(s) and the copyright owner(s) are credited and that the original publication in this journal is cited, in accordance with accepted academic practice. No use, distribution or reproduction is permitted which does not comply with these terms.
*Correspondence: Waqas-ud-Din Khan, ZHIud2FxYXN1ZGRpbkBnY3UuZWR1LnBr; Wei Guo, Z3Vvd2VpMTEyNEAxNjMuY29t
Disclaimer: All claims expressed in this article are solely those of the authors and do not necessarily represent those of their affiliated organizations, or those of the publisher, the editors and the reviewers. Any product that may be evaluated in this article or claim that may be made by its manufacturer is not guaranteed or endorsed by the publisher.
Research integrity at Frontiers
Learn more about the work of our research integrity team to safeguard the quality of each article we publish.