
95% of researchers rate our articles as excellent or good
Learn more about the work of our research integrity team to safeguard the quality of each article we publish.
Find out more
ORIGINAL RESEARCH article
Front. Sustain. Food Syst. , 13 April 2023
Sec. Climate-Smart Food Systems
Volume 7 - 2023 | https://doi.org/10.3389/fsufs.2023.1062435
This article is part of the Research Topic Analysis and Modelling of Coupled Human-Nature Processes in Water Resources Systems View all 8 articles
 Anna Malagó†
 Fayçal Bouraoui*†
Nitrogen and phosphorus are key to human life and crop production. However, excessive nutrient losses from agriculture affect air, soil, and water quality, with significant negative effects on terrestrial and aquatic ecosystems. Domestic nutrient emissions, in particular untreated wastewater, also negatively affect water ecosystems. European policies had a crucial role in contrasting nutrient pollution, but the assessment of the impact of these regulations requires an understanding of nutrient inputs and losses from land to sea. In this study, we quantified nutrient inputs in a cross-continental domain (Europe–Africa–Asia) in all regions discharging into the European seas. We reconstructed the time series for the 1979–2019 periods of high spatial resolution anthropogenic nutrient pressures including nitrogen atmospheric deposition, mineral fertilizers and organic N and P fertilizers, N and P from sewer connection, and improved and unconnected systems from urban and rural populations. We investigated regional differences and how existing legislation has affected nutrient inputs.
Crop production at a global scale has doubled since 2010 to meet the increased food demand of a growing population (Liu et al., 2014). This increase in crop production has been made possible by the availability of synthetic fertilizers. With the intensification of animal breeding activities to adjust for a change in the human diet, large amounts of manure are produced and spread on arable land, often not based on agronomic criteria but as a means to dispose of the manure (Bernal et al., 2015; Köninger et al., 2021). Due to poor management, large portions of the mineral and manure fertilizers are lost in the environment, severely affecting air, soil, and water pollution. Leip et al. (2011) reported that only 60% of N applied to cropland in Europe is removed by crops, while the rest is lost to the environment, and Van Grinsven et al. (2014) showed that, despite the increase in nitrogen use efficiency in EU agriculture since 1990, environmental targets have not been reached.
Agriculture is not the only factor responsible for nutrient emissions. Domestic emissions from human settlements and industries also contribute to significant amounts of nutrient release into the environment (Jenny et al., 2016; Macedo et al., 2022). The increase in population has also resulted in a larger amount of human waste being produced (Lopez Barrera and Hertel, 2021). While strong regulation is in place in EU27+UK to ensure that human waste is properly collected and treated, numerous countries bordering European seas are lacking proper collection, treatment, and disposal (Powley et al., 2016).
Several international, European, and national policies have been implemented to reduce the negative effects of excess nutrients since 1990 (De Vries et al., 2021; Bouraoui et al., 2022). The milestone directives are the Nitrates Directive (EC, 1991a), aiming to protect water quality pollution in Europe by nitrate from agricultural sources, and the Urban Waste Water Treatment Directive (EC, 1991b), adopted to protect the environment from discharges of wastewater from households and industries. The Water Framework Directive (EC, 2001) was introduced for harmonizing water protection regulations and to improve the ecological and chemical status of all waters. After 8 years, the Marine Strategy Framework Directive entered into force (EC, 2008) to protect the marine environment, complementing existing Marine Conventions including OSPAR, HELCOM, Black Sea, and Barcelona. The EU's common agricultural policy (CAP) also promotes sustainable agriculture protecting our natural capital. More recently, the European Green Deal launched a new growth strategy for EU27 to make the economy sustainable and create sustainable growth responding to climate change challenges and environmental degradation. It is also important to mention that the European Air Quality Directive (EC, 2001) aims at reducing levels of nitrogen dioxide in the atmosphere. Despite the large body of regulations, directives, and conventions, pollution by nutrients remains widespread in Europe (Wassen et al., 2022). In addition, the current policies often target a single nutrient, although agricultural application of nitrogen (N) and phosphorus (P) is coupled, and their impacts on ecosystems depend on their stoichiometric balance (Penuelas et al., 2020; Wassen et al., 2020). It is also important to highlight that many of these policies generally focus on ecological and environmental impacts targeting end-of-pipe concentrations, instead of focusing on sources.
In this context, the understanding of nutrient fate as affected by policy implementation requires a long-term time series of nutrient inputs from agriculture and domestic activities. This study aims to estimate spatialized nitrogen (N) and phosphorus (P) inputs from diffuse and point sources expanding the earlier work of Malagò and Bouraoui (2021). In particular, the reconstruction of nutrient inputs from agriculture and domestic release was extended to cover the 1979–2019 period. We focused on the area draining into the major European seas. After describing the methodological approach, we discuss the temporal and spatial impacts of the implementation of European policies.
The study area covers the entire Europe, and partly North Africa, Middle East, and Eastern Europe, including all the basins that drain into all European seas, for a total area of 8.7 Mkm2 (Figure 1 and Tables 1, 2). The domain is represented as a raster grid of 149907 cells of 5 arc-minutes (around 10 km2 at the equator). The grid cells are further subdivided into hydrologic response units (HRUs) that comprise unique combinations of land use, soil, and slope for a total of 621713 HRUs.
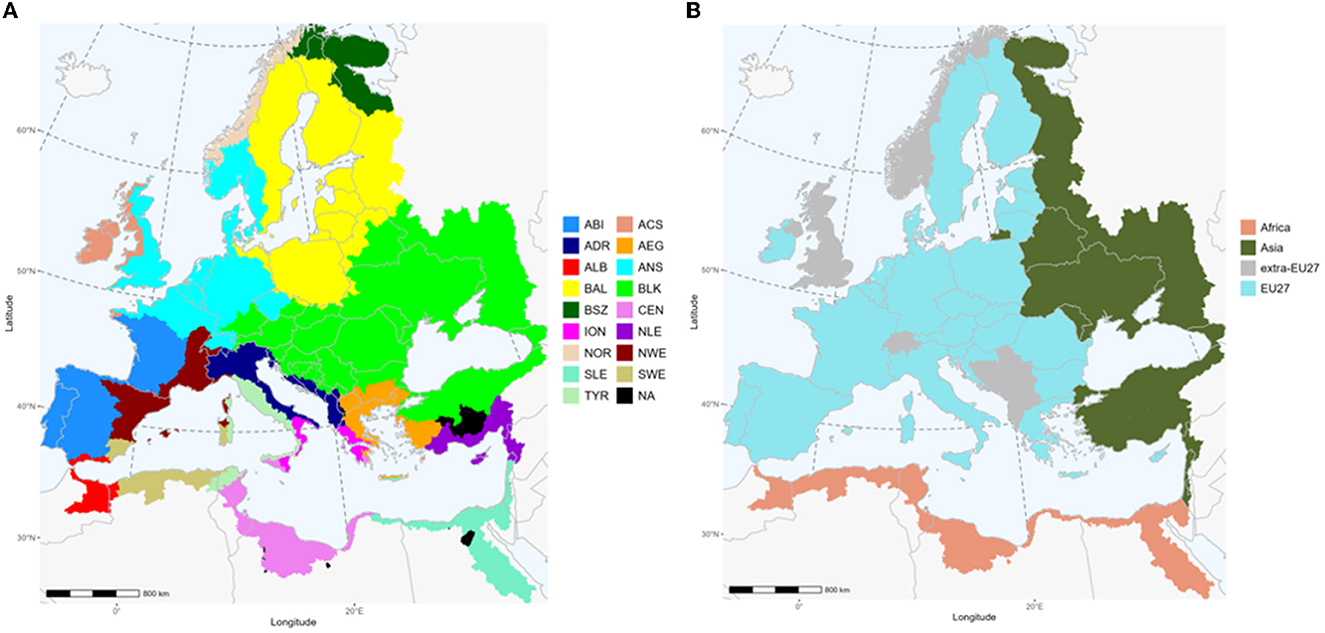
Figure 1. Study area showing the 17 marine regions (A) (excluding the areas that do not drain into the seas) and the continents (B).
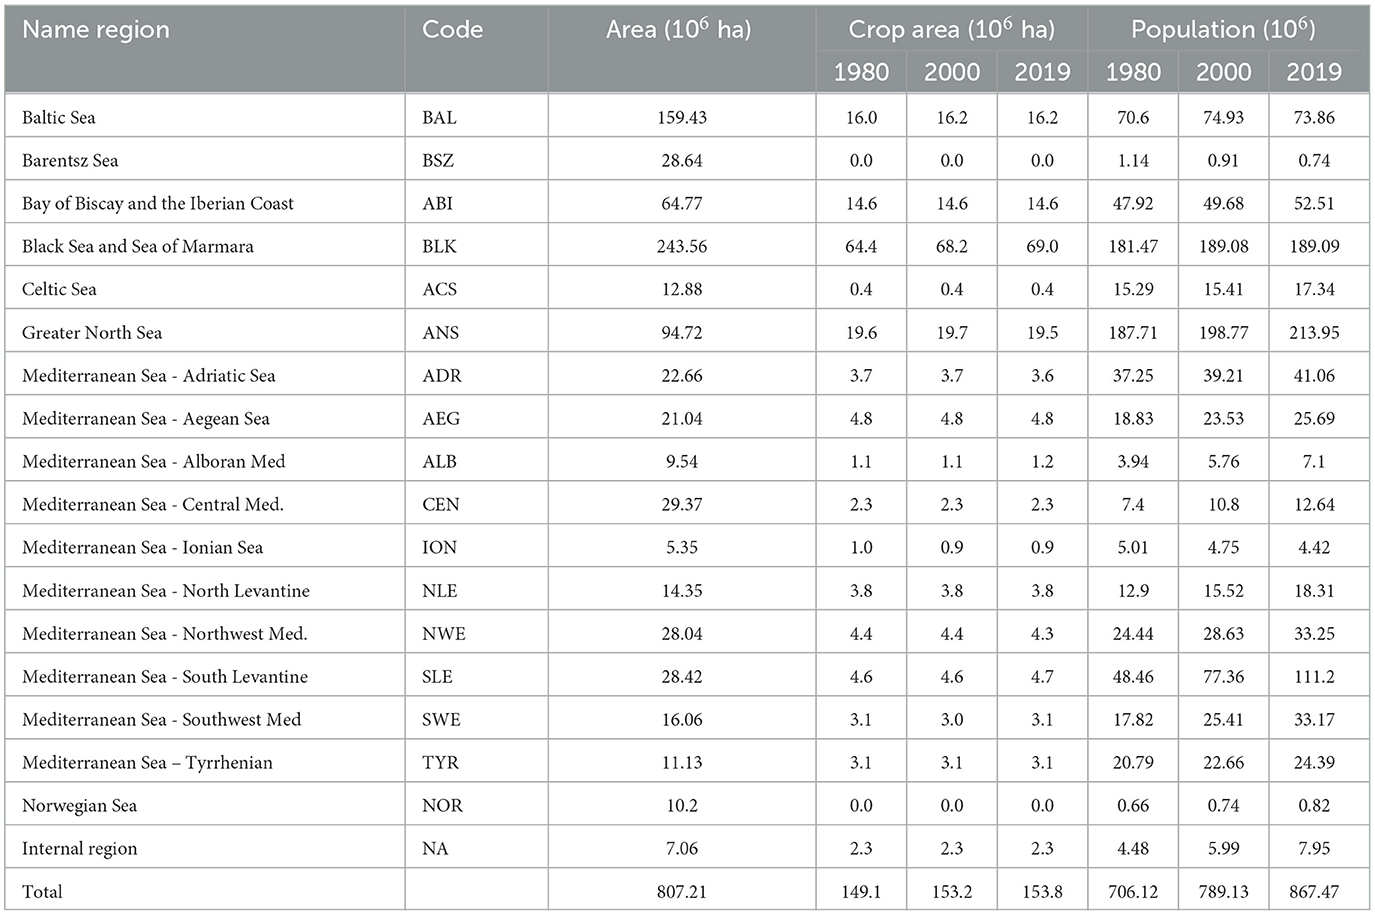
Table 1. Description of the study area by marine region.
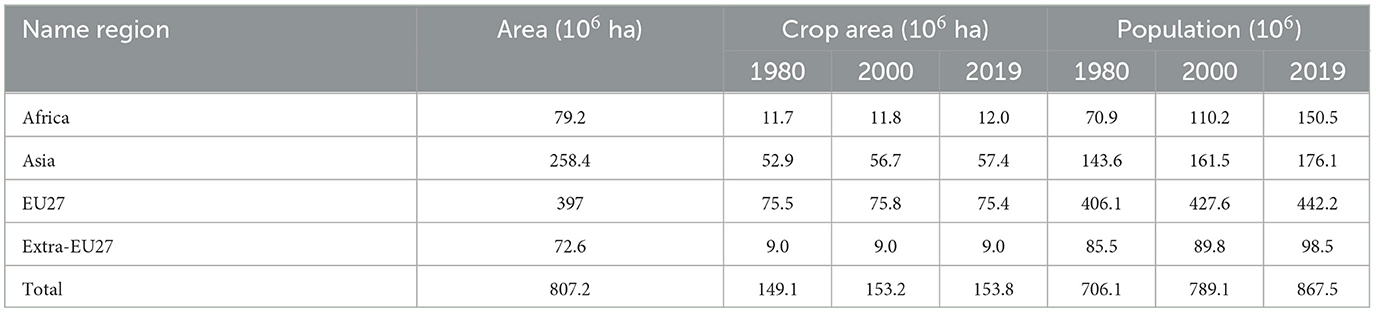
Table 2. Description of the study area by continent.
The land use map was derived from a 100 m x 100 m raster map built from the combination of the GLOBCOVER 2009 map (Arino et al., 2012) and the Spatial Production Allocation Model (SPAM) (You et al., 2014). The crop mix and areas were retrieved for the period 1979–2019 from FAOSTAT (FAOSTAT, 2022). The land use changes were analyzed in the period 1979–2019 every 5 years using the Mann-Kendall trend test and the Sen Slope using R software (R Core Team, 2011). We obtained country-crop statistical results including the significance of the change and the corresponding amount of change with respect to the year 2005, that is, the reference year for the land use distribution as described by Malagò and Bouraoui (2021). The crop area of land use in 2005 was thus increased or reduced every 5 years including only significant changes. These significant changes were considered as the target areas to reach decreasing or increasing crop area in the grid cell with the largest area of the considered crop.
The terrain slope was calculated from the digital elevation model retrieved from GTOPO30 (LP DAAC, 2004) with a grid cell of 30 arc seconds (~1 km) that was rescaled at 100 m × 100 m resolution. Soil type and characteristics were defined using the Harmonized World Soil Database (FAO/IIASA/ISRIC/ISSCAS/JRC, 2012).
In the following sections, we describe the reconstruction of the annual time series of nitrogen and phosphorus inputs from agriculture and domestic sources including atmospheric deposition (only for N), mineral fertilizers, manure, domestic emissions from wastewater treatment plants, domestic emissions from individual systems (septic tanks and latrines), open defecation, domestic emissions for population non-connected to sewage systems, industrial discharges, and P emissions from detergents. Since nitrogen fixation is highly related to the total N demand of plants and the available nitrogen in soils, to have a reasonable estimation of nitrogen fixation every year, a process-based model, for instance, the SWAT model (Arnold et al., 2012), is necessary (Yu and Zhuang, 2020). For that reason, the development of time series of nitrogen fixation input was not included in this study.
The N and P mineral fertilizers application at grid cells and HRUs was estimated to downscale the total amount of mineral fertilizers by crop categories at the country level for each year in the period 1979–2019. Based on the assumption that the relative importance of fertilization rate among crops, fodder, and grassland remained constant in time, a scaling-up approach was applied to reconstruct the time series using the FAOSTAT fertilizer datasets (FAOSTAT, 2021a). The rate among crops, fodder, and grassland was retrieved from the IFASTAT dataset for the year 2014 (IFASTAT, 2016). The national time series of mineral fertilizers for each crop were then spatialized in each grid cell and HRUs. In particular, the total mineral fertilizers were distributed every 5 years by crop categories proportionally to the N and P used by the plant to reach maturity. The national mineral fertilizer applied on fodder and grassland was spatialized based on the areas of fodder and grass in each cell.
The amount of nitrogen and phosphorus from manure was computed for each grid cell by multiplying the number of animals in each category (in heads) by the excretion coefficients per category (kg N or P/head year) as explained in Malagò and Bouraoui (2021). The procedure was updated using livestock from GeoNetwork rasters (GeoNetwork, 2007) at 0.05 decimal degrees resolution for the year 2010. We used these rasters as base rasters for distributing 16 categories of livestock (FAOSTAT, 2021b) in each country for the period 1979–2019.
The excretion coefficients for the different years were calculated using the N excretion coefficients given in Bouwman et al. (1997) and the slaughtered weights (kg/animal) from FAOSTAT (FAOSTAT, 2021c) following the procedure reported in Sheldrick et al. (2003). In particular, N excretion coefficients were changed between the years by multiplying the country-animal category N excretion coefficients of Bouwman et al. (1997) with the ratio between the FAOSTAT country-year-animal category and the continental-year-animal category slaughtered weights. N excretion coefficients also differ between a developed and developing country and stable and meadow type of production (Bouwman et al., 1997). We considered for each country that the stable manure was applied only on crops, while the meadow type of manure was applied on fodder, grassland, bare land, and shrub land cover classes proportionally to their areas. A similar procedure was applied to quantify the phosphorus from manure, considering that the excretion factor is a fraction of that of nitrogen.
The distribution of manure produced in stables and meadows for each category of livestock in each grid cell was calculated as follows: the manure produced in stables for each grid was distributed on cropland of the grid cell with a maximum limit of 50 kg/ha. The remaining part was distributed together with meadow-type manure on fodder with a limit of 50 kg/ha and the remaining part on grassland, bare land, and shrub land cover classes inside the same grid cell. The manure produced in meadows for each livestock class was distributed proportionally to the area of fodder, grassland, bare land, and shrub land cover in each grid cell. In each cell with cropland, the manure was distributed proportionally to N and P uptake calculated for the year 2005 using the SPAM dataset (You et al., 2014).
Atmospheric deposition was retrieved from the ISIMIP dataset (Lamarque et al., 2013a,b; Tian et al., 2018). The dataset includes monthly values of NHx (reduced N as NH3, aerosol and wet deposited ) and NOy (oxidized nitrogen NO, HNO3, and NO2) at a resolution of 0.5° gridded data for the period 1860–2016 and future projections until 2099. In this study, we consider the sum of NH and NOy. The data were resampled at 5 arc-minutes resolution and aggregated annually. For the period 1979–2016, we used historical data, while for years 2017, 2018, and 2019, we used projections.
Nutrient inputs from human settlements, i.e., wastewater treatment plants, industries, and phosphorus from detergents, were estimated considering urban and rural populations, emission rates per person, the percentage of the population connected to the wastewater treatment plants system, and the level of treatment. The methodologies to define the nutrient-specific emissions (kg/person) at the grid cell level consisted of determining the nutrient emission at the country level and then down scaling the value using population density as a proxy.
We distinguished between rural and urban populations inside each grid cell using the GHSL datasets (Dijkstra and Poelman, 2014) at a resolution of 1 km. The rural and urban population distribution provided by the GHSL dataset refers to years 1975, 1990, 2000, and 2015 and includes the eight classes identified by the following index: 30 (urban center), 23 (dense urban), 22 (semi-dense urban cluster), 21 (suburban or peri-urban), 13 (rural cluster), 12 (low density rural), 11 (very low density rural), and 10 (water). The rasters were resampled at 5 arc-minutes, and for each grid cell, we grouped the classes 30, 23, 22, and 21 under urban and the remaining under rural. The urban and rural populations of GHSL were then rescaled using the FAOSTAT statistics on the rural and urban population yearly counts for each country from 1979 to 2018 (FAOSTAT, 2021d). For the year 2019, we considered the same values as those for 2018.
Point source emissions were estimated according to the method described by Malagò and Bouraoui (2021). The procedure includes three steps: a collection of national statistics of household connection to sewers, connection to wastewater treatment plants, and treatment level. A downscaling approach based on rural and urban population density is used to estimate at the grid level the pollutant load from the domestic use of water. The N and P emissions from human excretion are related to the meat and vegetable protein intake taken from the FAO database (Herridge et al., 2008). Additional details are found in Malagò and Bouraoui (2021).
Because the information about the use of sodium triphosphate (STP) in detergents is very limited, we used selected countries around our study area that have no ban or limitation on the use of STP in detergents including Albania, Bosnia and Herzegovina, Bulgaria, Croatia, Cyprus, Czech Republic, Estonia, Greece, Hungary, Latvia, Lithuania, the former Yugoslavia Republic of Macedonia, Malta, Republic of Moldova, Poland, Portugal, Romania, Serbia, Slovakia, Spain, Ukraine, and United Kingdom. We updated the estimation of 2005 provided by Malagò and Bouraoui (2021), with a new estimation for the year 2010 where we used values from RPA (2006) and Schreiber et al. (2003) for European countries. The following regression between STP/detergent and annual Global gross Domestic Product (GDP) was used when data were not available for a specific country-year:
Where, STP is the number of detergents (kg/cap/year) and GDP is the Global gross Domestic Product ($/cap/year, 2010 prices).
For countries with a known ban, the upper allowed limit by the ban was used.
Due to the lack of national data, the nitrogen and phosphorus industrial emissions were estimated at 15% of domestic emissions as suggested by Morée et al. (2013). They were also assumed to follow the same spatial distribution as that of domestic emissions.
We reconstructed the rate of connection to sewers, connection to wastewater treatment plants, and scattered dwellings, for both urban and rural populations at the country level for the period 1970–2019. We also estimated wastewater treated from the non-connected population.
The procedure starts with the reconstruction of the total connected treated population (CONNT) using a statistical approach based on a relationship between the percentage of the connected treated population (CONNT) and GDP ($/cap/year, 2010 prices). Then, all other categories (population connected for treatment at levels 1, 2, and 3, scattered dwellings, treated not connected, and not connected for urban and rural populations) were reconstructed filling the gaps using an interpolation method by year and country starting in sequence from the population treated at different levels to the unconnected population.
Two different sources of information were used:
- For European countries, we used the EUROSTAT connection dataset that provides by country (period 1970–2018) the total connection rate of the population to wastewater treatment plants by treatment level and unconnected population (EUROSTAT, 2021). We completed this dataset by adding the EUROSTAT data for the year 1990 from the REFIT project (REFIT, 2019).
- For non-EU countries, we used the JMP dataset (JMP, 2019) that provides, for the period 2000–2017, by country and by urban and rural populations the rate of the following categories: sewer connected, septic tanks, open defecation, and unimproved systems.
The best fit between the population connected treated (CONNT) and GDP ($/cap/year) was investigated based on several regression models, and the best model was selected for each country. Finally, for each country, we obtained the predicted emission of the urban and rural populations according to the following categories: sewer-connected, septic tanks, latrine or other systems, open defecation, and unimproved systems.
The country values by years were then spatialized at the grid cell level using a rescaling approach. The rescaling procedure for connected urban and rural populations consisted of the selection of the grid cell with the highest population in a moving window of five grid cells. The procedure was repeated until the target value of the population connected was reached. The unconnected population was then a non-assigned population from the previous steps.
The nutrient emissions were then used together with the predicted connection rates as explained by Malagò and Bouraoui (2021) for the calculation of N and P loads. Finally, the yearly N and P loads were spatialized based on grid cell urban and rural connected and unconnected categories previously described.
In Malagò and Bouraoui's (2021) study, a global high-resolution nutrient flows compilation centered on the year 2005 was developed focusing mainly on assessing potential nutrient delivery to rivers, identifying environmental hotspots, and providing uncertainty analysis. Instead, in the current study, we provide new insights through the analysis of multi-decadal changes in nutrient inputs highlighting geographical and historical regulation effort differences. In particular, we summarize the results by grid cell, marine regions, and continents using the input categories, diffuse sources, and point sources. In the diffuse sources, we consider the sum of atmospheric deposition (only for N), mineral fertilizers, and manure, while in the point sources, we consider nutrient emissions collected in sewerage systems; emissions from other systems that are disconnected from sewerage systems; and emissions from industrial discharges and P detergents (only for P).
There were significant regional differences in nitrogen and phosphorus inputs at the grid cell scale across the years, as illustrated in Figure 2. After an increase in the use of N diffuse sources in western Europe, corresponding to an intensification of crop production, we can observe a generalized decrease in nitrogen use coinciding with the implementation of the Nitrates Directive and a greening of the Common Agriculture Policy. For P diffuse sources, after an increase in western Europe until 2000, there is a consistent decrease in P use for EU27. Concerning point sources, emissions are spatially spreading in Spain and Portugal due to the increase in connection rates. A similar pattern is observed for North Africa and the Middle East (see SI for maps).
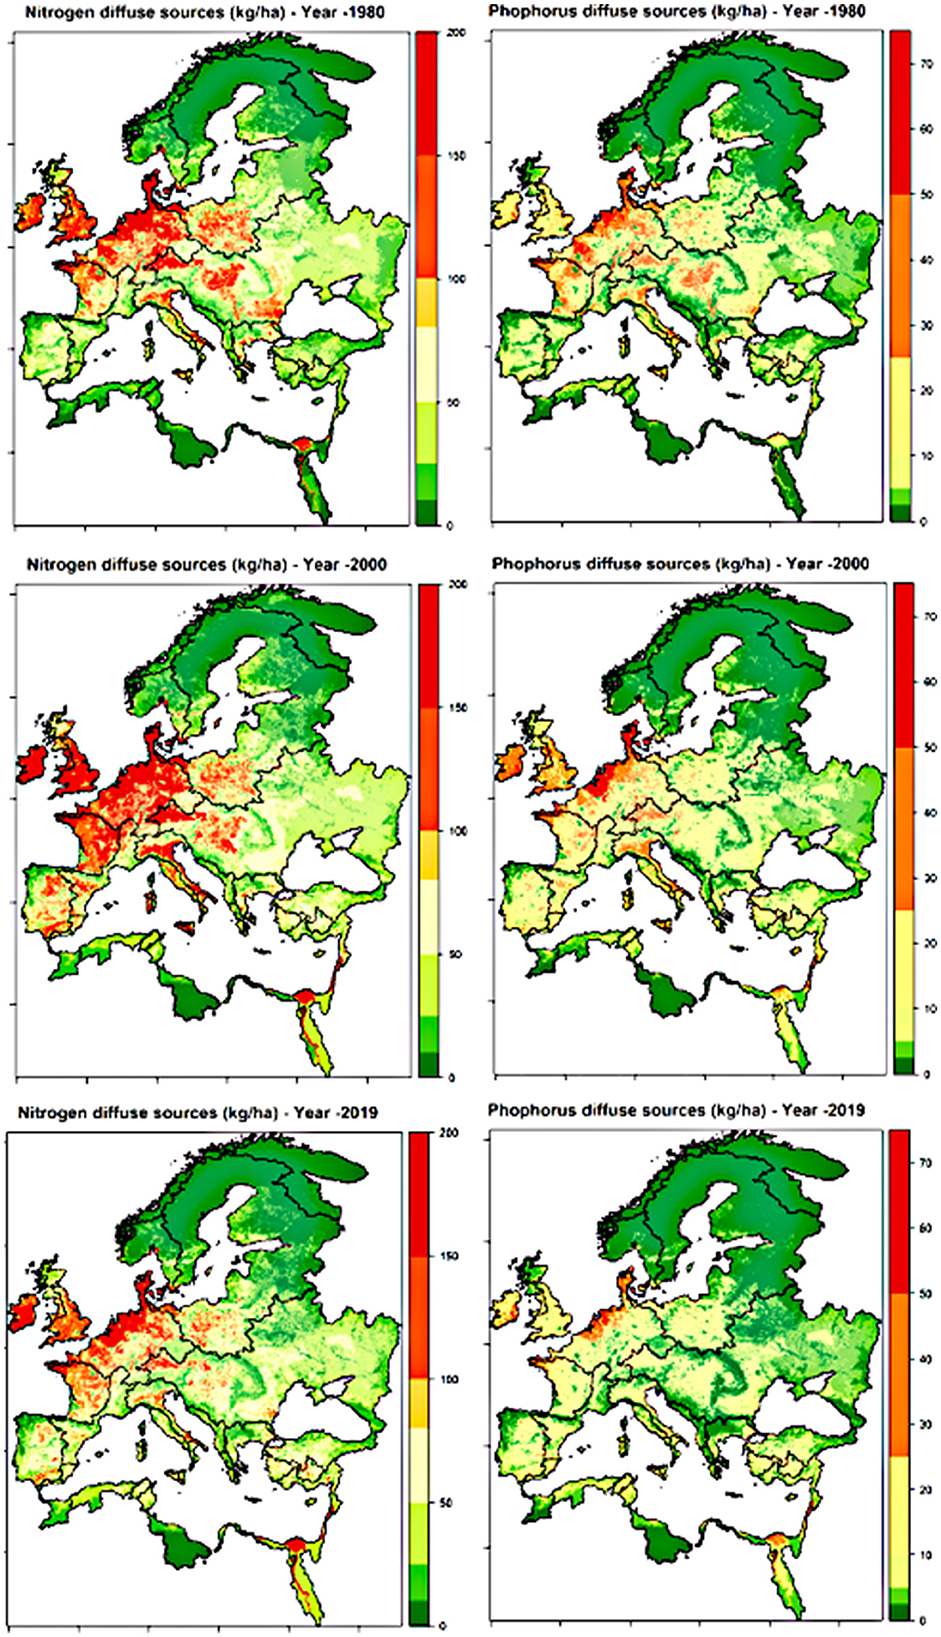
Figure 2. Spatial variation of N and P diffuse sources for the years 1980, 2000, and 2019 (Point sources maps in the SI).
Figure 3 represents the change of N mineral fertilizer and N emissions collected in sewerage systems (kg/capita) in the year 2019 with respect to 2015 (short term), 2000 (medium term), and 1980 (long term). In the short term, N mineral fertilizer increased by more than 50% in the eastern part of the study area. A similar pattern is observed in the medium term, but not in the long term where higher differences are observed in the western part. Concerning N emissions collected in sewerage systems, there are long-term negative changes, indicating a reduction of emission with respect to those of 1980, more marked in the eastern part of the study area, while no significant differences are observed in the short term.
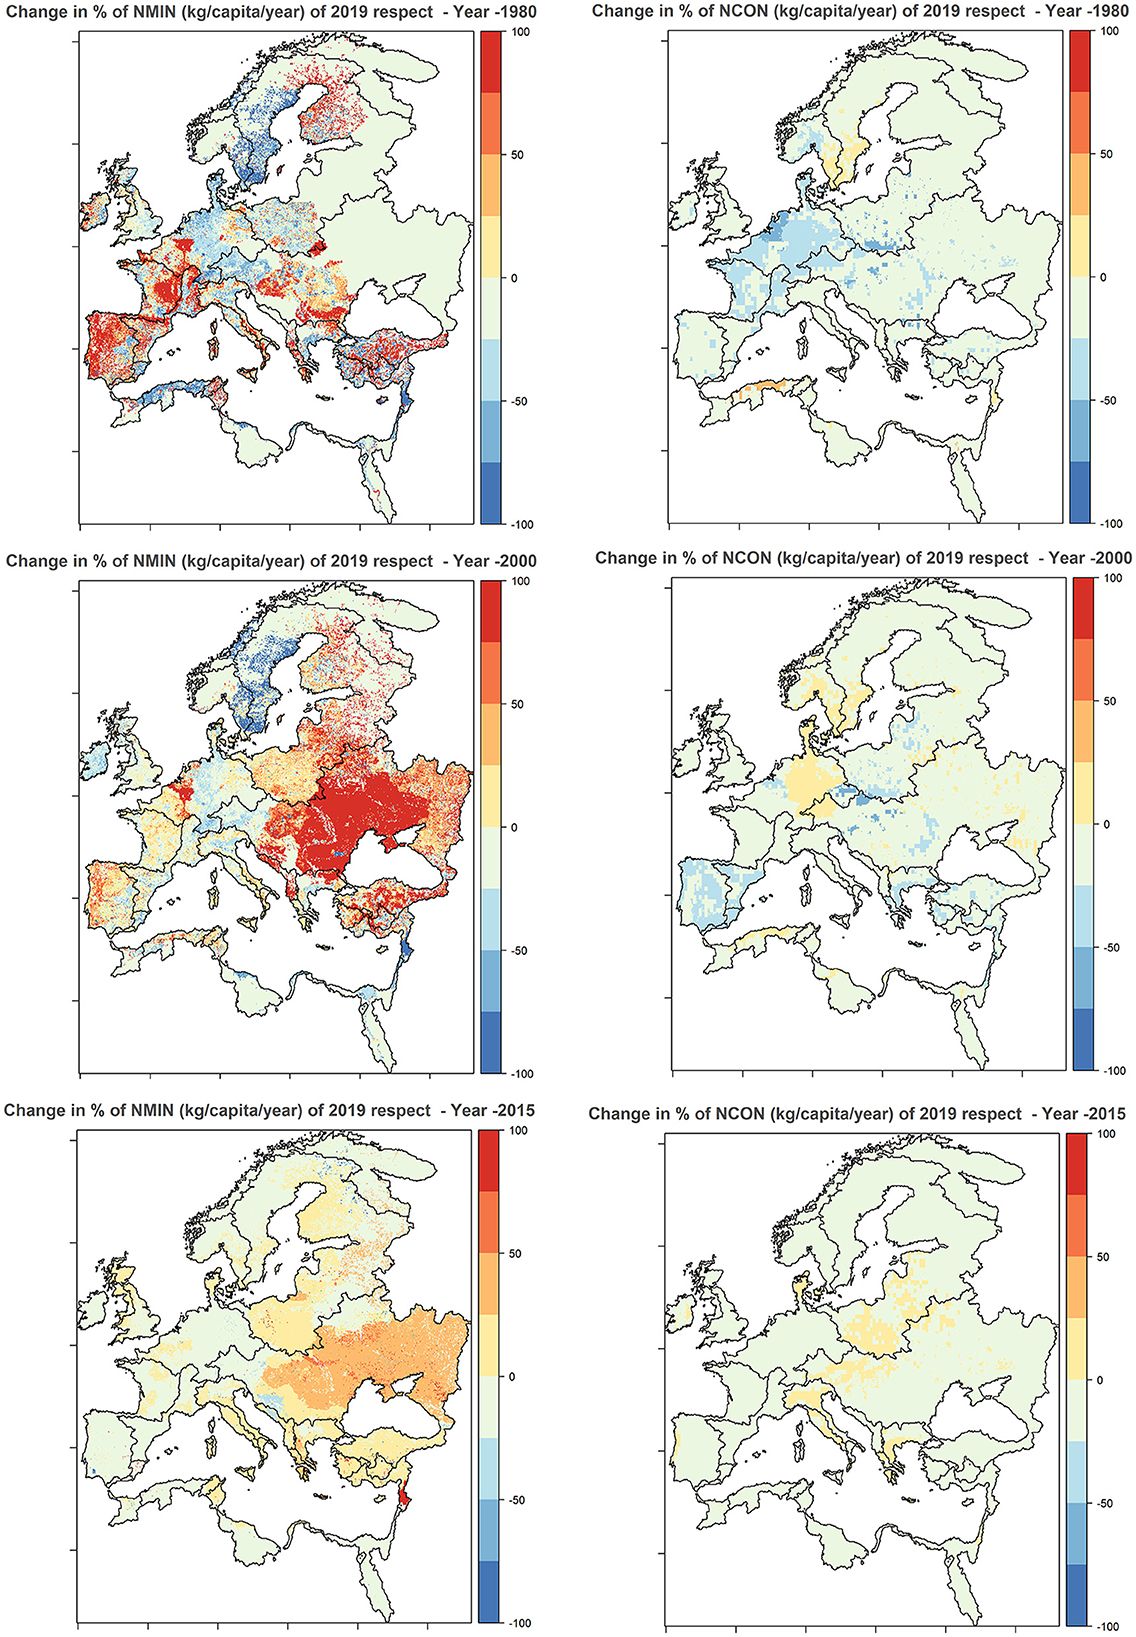
Figure 3. On the left, spatial variation of changes (%) of N mineral fertilizer (kg/capita) in the year 2019 with respect to 1980, 2000, and 2015. On the right, spatial variation of changes (%) of N emissions collected in sewerage systems (kg/capita) in the year 2019 with respect to 1980, 2000, and 2015.
The annual nitrogen and phosphorus inputs aggregated by marine regions are reported for selected areas in Figures 4, 5, and the full plots are available in the SI. The largest amount of total nitrogen inputs was observed in the Black Sea and Sea of Marmara (BLK) with inputs around 10 Mton (year 2019), followed by the Greater North Sea with 9 Mton (year 2019). The largest share of nitrogen inputs is represented by manure and mineral fertilizers in all regions except for the Barentsz Sea (BSZ) and the Norwegian Sea (NOR) where the nitrogen from atmospheric deposition is the dominant contribution (48 and 43% of total nitrogen inputs for the year 2019, respectively).
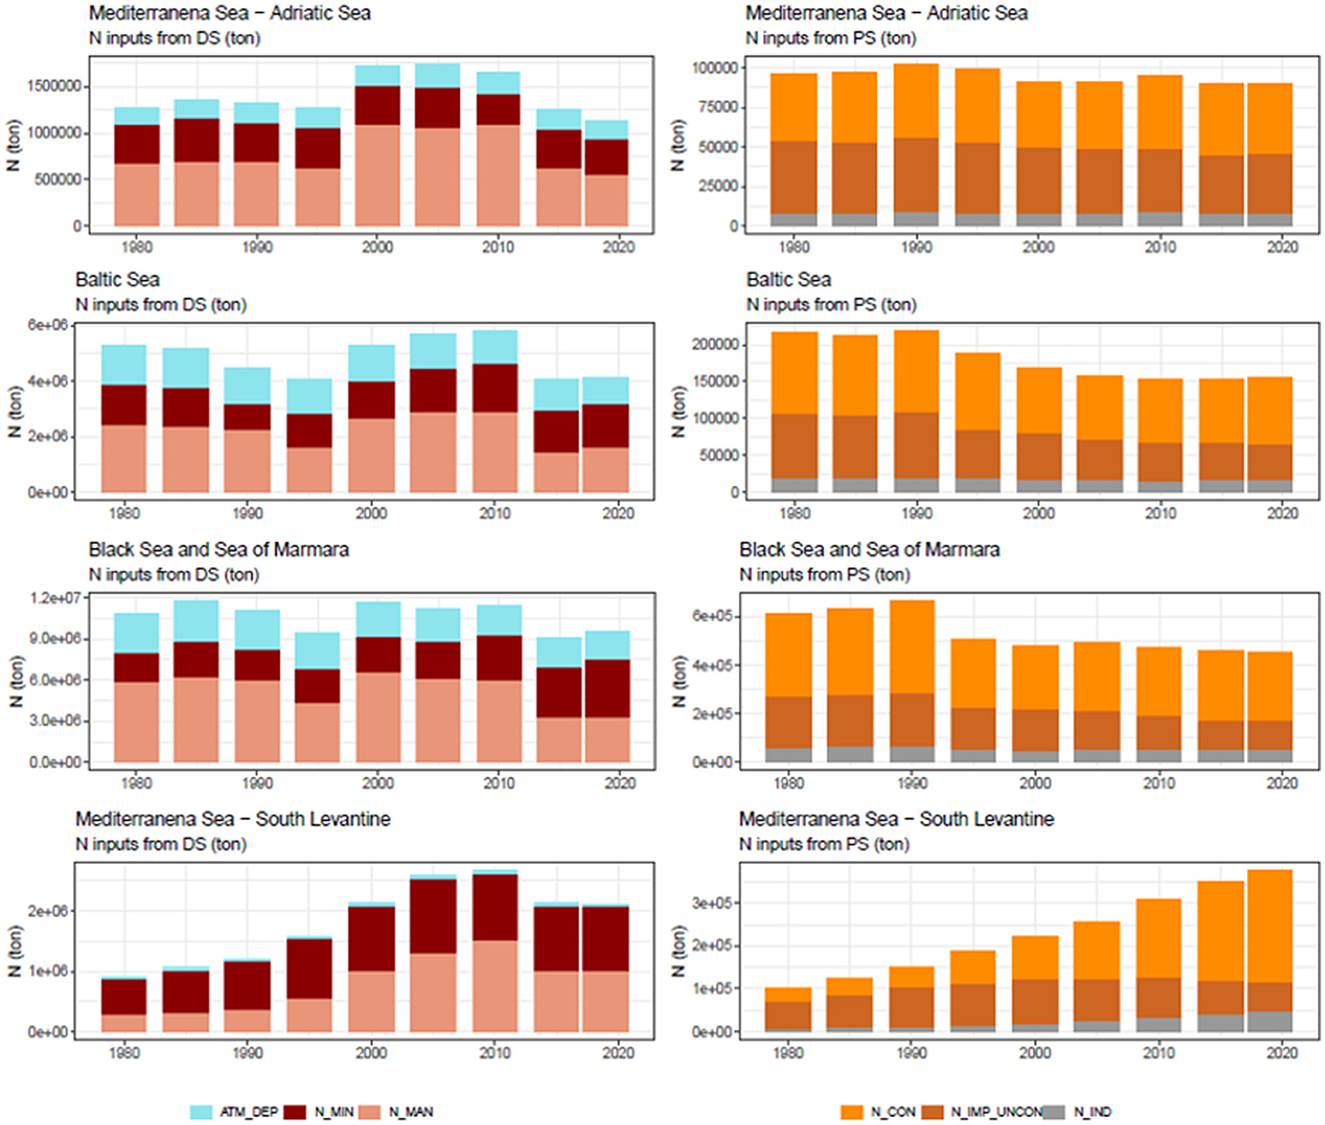
Figure 4. Nitrogen inputs (ton) by selected marine regions in the study area. On the left, diffuse sources: ATM_DEP atmospheric deposition, N_MIN nitrogen mineral fertilizer, and N_MAN nitrogen manure; on the right, point sources: N_CON nitrogen emissions collected in sewerage systems; N_IMP_UNCON nitrogen emissions from other systems that are not connected from sewerage systems; and N_IND nitrogen contribution from industrial discharges.
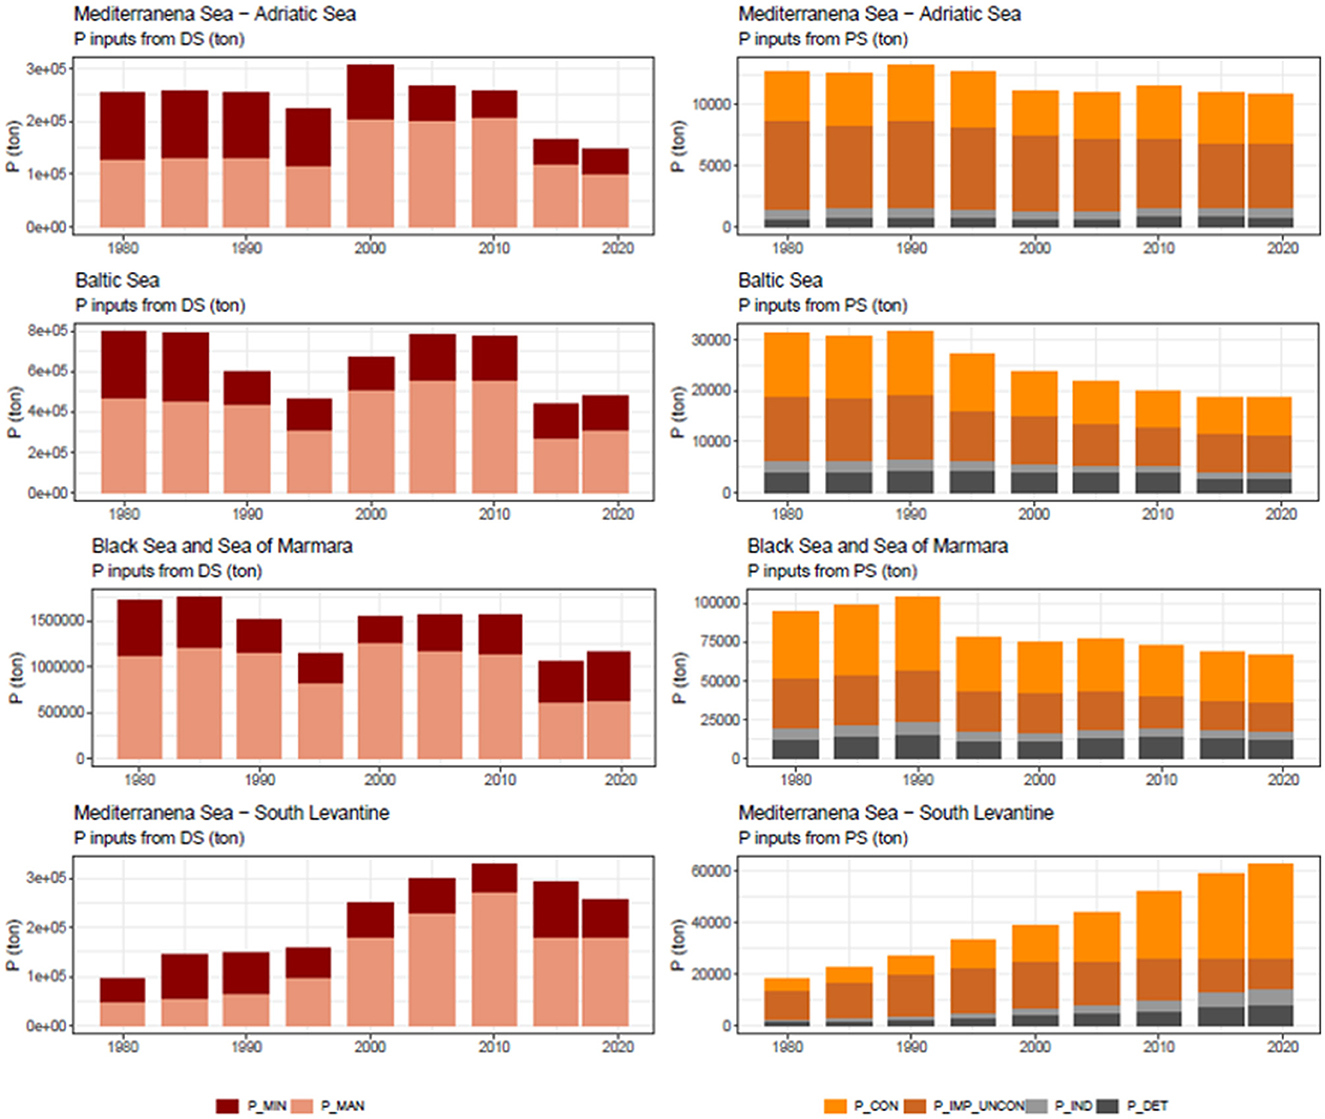
Figure 5. Phosphorus inputs (ton) by selected marine regions in the study area. On the left, diffuse sources: P_MIN P mineral fertilizer and P_MAN P manure; on the right, point sources: P_CON P emissions collected in sewerage systems; P_IMP_UNCON P emissions from other systems that are disconnected from sewerage systems; P_IND P contribution from industrial discharges; and P_DET P emissions from detergents.
In the Adriatic Sea, there is a decrease in the inputs from diffuse sources after 2010, dominated by the sharp decrease of manure application with respect to the previous 10 years and an increment of mineral fertilizers. Point source emissions have also slightly decreased in the Adriatic Sea region. A similar trend is observed in the Baltic Sea, with a decrease in N emissions from wastewater treatment plants due to higher treatment levels and emissions from unconnected people from the wastewater treatment plant. Diffuse sources for the period 2010–2019 are in the same range as those for the year 1995, however, with a different distribution of sources (decrease of atmospheric deposition and increase of mineral fertilizers). Inputs of N from diffuse sources have decreased from 1980 in the Black Sea and Sea of Marmara with a sharp decrease of atmospheric deposition and N from manure, while the N mineral fertilization has increased. Point source emissions have also decreased from 1995, remaining stable until today. For the South Levantine (regional discharge sea of the Nile River), there is a significant increase of N from diffuse sources and manure N (atmospheric deposition is relatively insignificant), as well as N inputs from point sources. The highest specific N inputs from diffuse sources are observed in the Celtic Sea (ACS) and Greater North Sea (ANS), while N from point sources increased significantly from 1980 in Med. South Levantine (SLE) to values larger than 10 kg/ha in 2019 (SI). The same behavior was observed for P, with an increase of P from point sources in the Southwest Med. (SWE) both in terms of kg/ha and kg/capita. Due to their low population density, the Barentsz Sea (BSZ) and Norwegian Sea regions (NOR) exhibit the highest values in kg/capita.
Concerning phosphorus emission in the Adriatic Sea (Figure 5), there is a sharp decrease in the amount of mineral P usage, while manure P is back to the 1980s levels. There is also a continuous decrease of P emission from point sources and, in particular, P release from unconnected people. There was a shift from the unconnected to the connected population in the past 30 years with an increase in the treatment level. This decrease coincides with the implementation of the UWWT directive, putting strict regulation on the size of treatment level for settlements larger than the 2000 population equivalent. We see a significant decrease in P emissions in the Baltic Sea with a decrease in all components of point sources. The same was observed for P diffuse emissions that have decreased with respect to 1980. Similar behavior was observed in the Black Sea and Sea of Marmara. Concerning the South Levantine, there was a large increase in manure P production and a relatively smaller increase in the use of mineral P. On the other hand, there is a large increase in point source inputs and emissions from wastewater treatment plants. The higher connection rate not accompanied by an increase in the treatment level partly explains this large increase. In addition, it is important to note the large increase in the population in North Africa resulting in an overall increase of P domestic emissions. Phosphorus from domestic emissions connected to sewerage systems progressively increased in Med. South Levantine (SLE) and reached a value of around 1.5 kg/ha in 2019. We can also notice the steady increase in the Alboran Med (ALB) of total point sources, both in terms of kg/ha and kg/capita. P from unconnected and improved systems decreased from 1980 to 2019, in almost all regions (SI).
The N/P ratio increased significantly during the whole period in the Med. Adriatic Sea (ADR), Med. Ionian Sea (ION), Med. South Levantine (NLE), and Med. Tyrrhenian Sea (TYR) (refer to SI). In Med. South Levantine (SLE), N/P from diffuse sources decreased in the period 1995–2015. Concerning the point sources, the N/P ratio increased quickly in the last 20 years in all regions except in the Barentsz Sea (BSZ), Norwegian Sea (NOR), and Med. Tyrrhenian (TYR). It is noteworthy that albeit the interpretation of the results should be done with caution as the N:P ratio from the inputs may not correctly show the limiting nutrient of the system, it indicates a trend in the mid- to long-term N/P ratio in receiving waters.
Figure 6 shows the fertilization by major crop type aggregated by continents (the national time series are provided in the Supplementary material). There is a steady increase starting in 1960 in N mineral fertilizers in Asia and Africa. For Asia, there is an increase in the use of mineral P until 2010, followed by stagnation. In Africa, P fertilizers increased slowly with respect to other continents, however, in the opposite direction to that of P removed by crops. It is important to note that for Africa, the N and P removed by crops significantly exceed the number of applied nutrients, indicating serious mining of soil fertility. In Asia, the amount of applied N fertilizer exceeds that removed by crops, while the amount of applied P is always lower than the amount removed. For Europe, after an increase of N mineral fertilizer until 1990, there was a sharp decrease with a tendency to increase during the recent years. Concerning P, after a steady increase in mineral phosphorus use until 1990, there is a constant decrease. Starting in 1990, there is a balance between N fertilization and N removal, while P removal increased steadily for the same period.
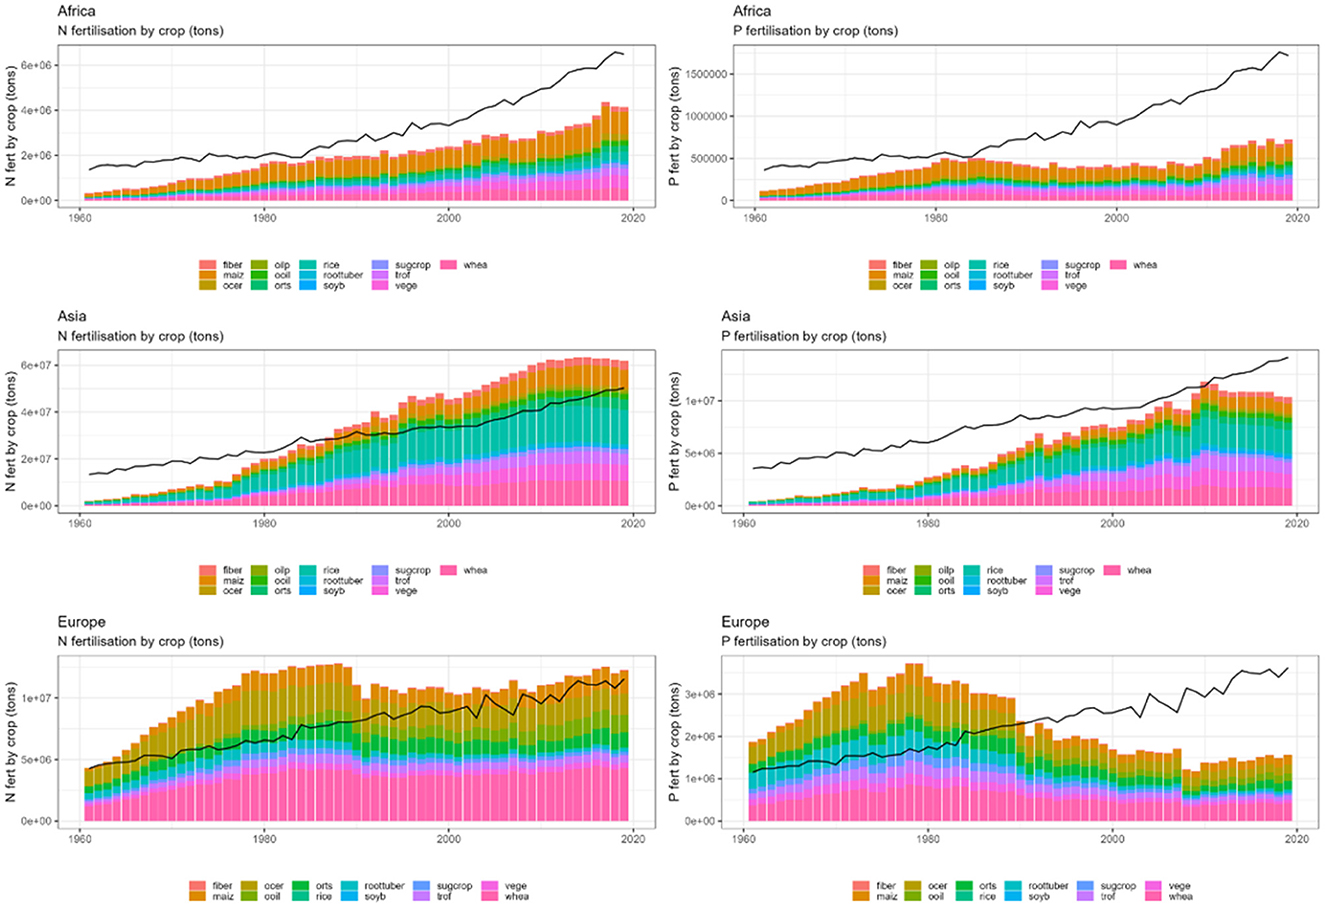
Figure 6. Long time series of reconstructed nitrogen and phosphorus mineral fertilization by continent and crops. The black line represents the N and P removed by crops.
A national fact sheet, summarizing domestic emissions from individual systems not connected and connected to sewage systems, industry, and P-detergents, is provided in the Supplementary material including the best-fitted curve of the percentage of connected people; time series 1979–2019 of predicted connected treated, GDP, urban, and rural population; and N and P loads by classes of the urban and rural populations.
The annual nitrogen and phosphorus inputs from point and diffuse sources aggregated by continents are reported in Figures 7, 8. In the last 10 years in EU-27, diffuse sources were similar on average as to those of 1980–1995, however, with a different distribution of sources (decrease of atmospheric deposition and increase of mineral fertilizers). We also observed the same pattern for extra-EU. In Asia, N inputs from diffuse sources were quite stable, but the distribution of sources changed from 1980 with a sharp increase in mineral fertilizers. In Africa, there is a significant increase in N from diffuse sources, in particular, manure and mineral fertilizers, while the contribution of atmospheric deposition is negligible. N from point sources also increased significantly from 1980 in Africa, with a rapid increase of N emissions from wastewater treatment plants and a decrease of N from unconnected systems. In EU-27, N from point sources decreased from 1995 to 2010, remaining stable thereafter. In Asia and extra-EU, N from point sources has been stable since 1995.
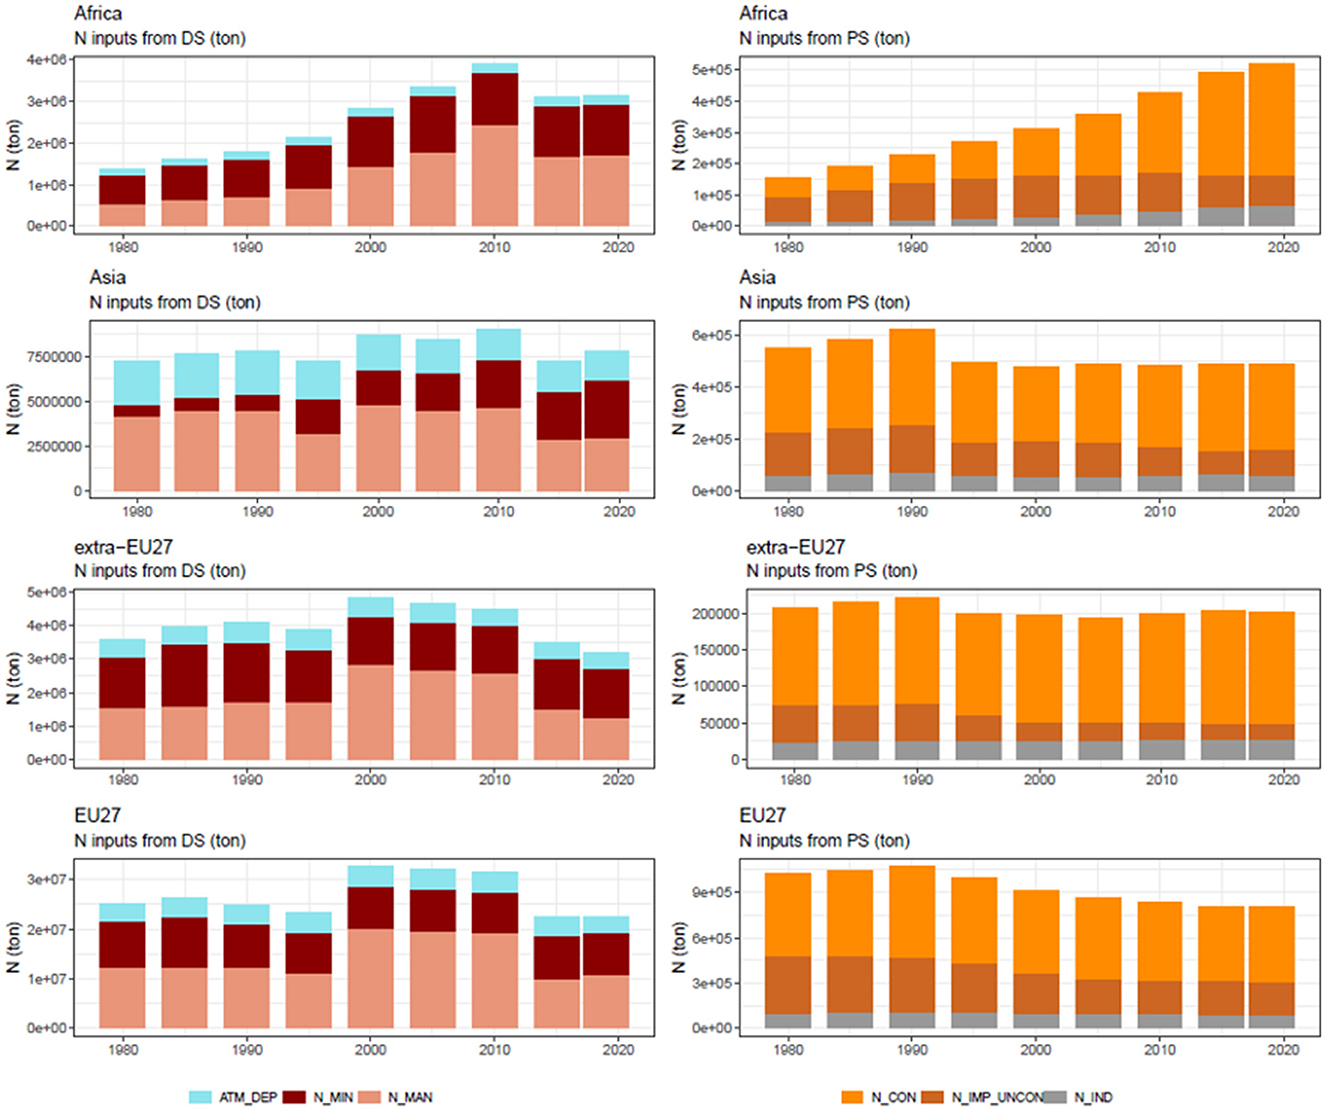
Figure 7. Nitrogen inputs (ton) by selected continents in the study area. On the left, diffuse sources: ATM_DEP atmospheric deposition, N_MIN N mineral fertilizer, and N_MAN N manure; on the right, point sources: N_CON N emissions collected from sewerage systems; N_IMP_UNCON N emissions from other systems that are disconnected from sewerage systems; and N_IND N contribution from industrial discharges.
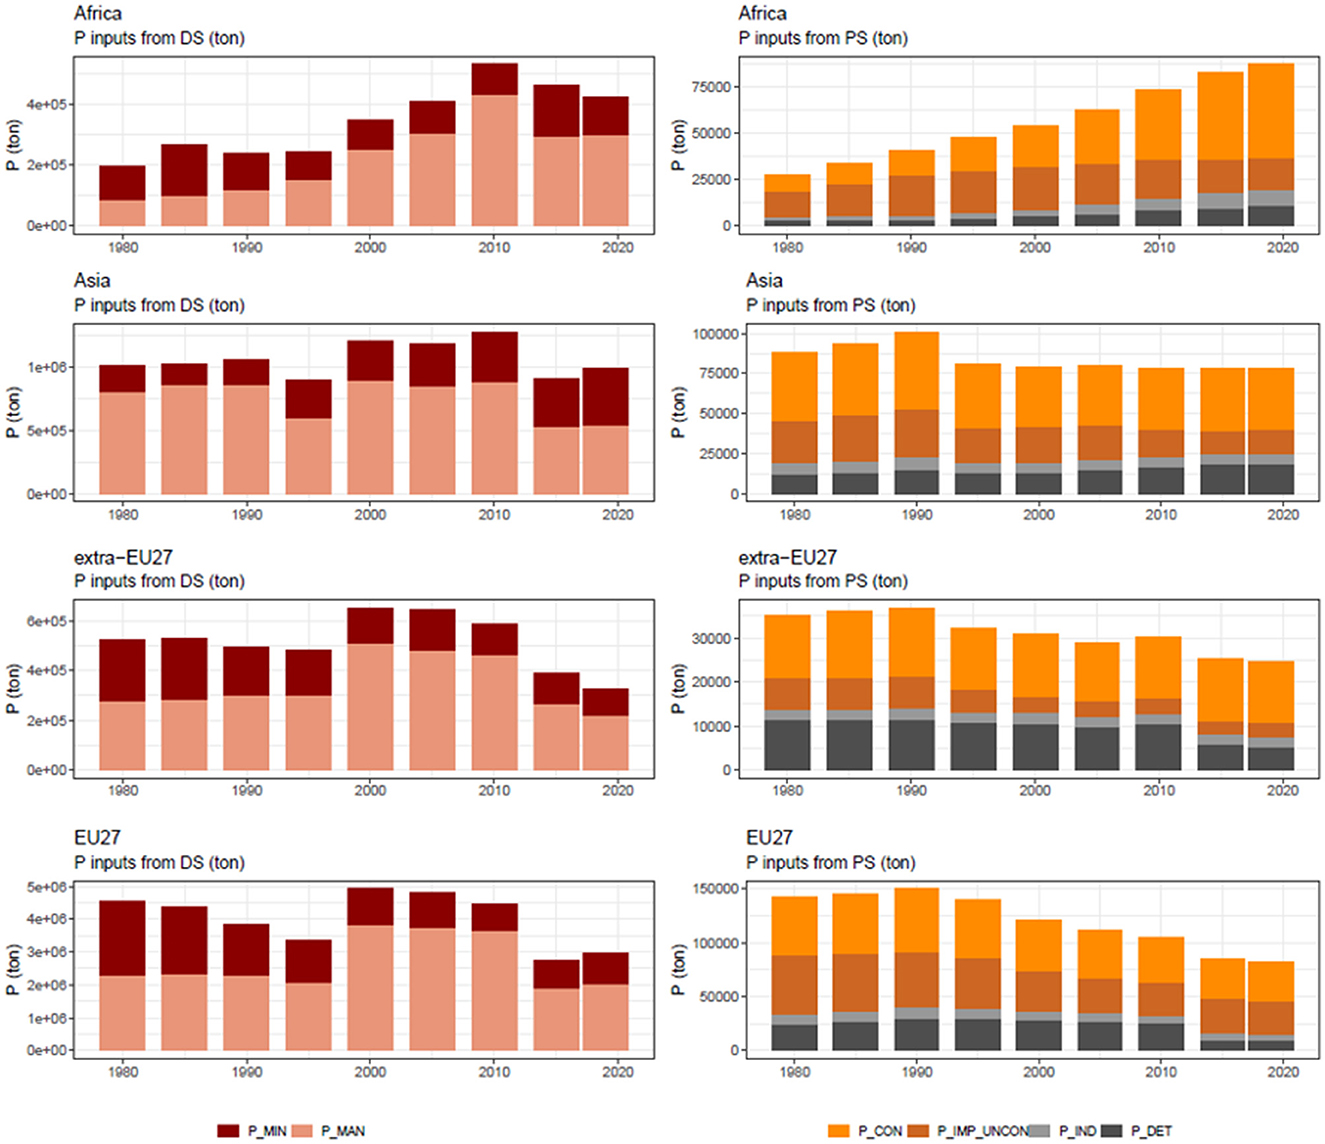
Figure 8. Phosphorus inputs (ton) by selected continents in the study area. On the left, diffuse sources: P_MIN P mineral fertilizer and P_MAN P manure; on the right, point sources: P_CON P emissions collected in sewerage systems; P_IMP_UNCON P emissions from other systems that are disconnected from sewerage systems; P_IND P contribution from industrial discharges; and P_DET P emissions from detergents.
Considering each source of nitrogen input, the specific atmospheric deposition accounted for a maximum value of 10 kg/ha in EU27, followed by Asia. A progressive decrease in the atmospheric deposition in kg/capita was observed in each continent from 1980, except in Africa. In Asia, the nitrogen atmospheric deposition decreased from 10 kg/capita to 6 kg/capita from 1980 to 2019. We also observed an increase in atmospheric deposition per unit area in Africa partly due to a rapid rise in population, leading to an increase in vehicle emissions, burning of waste, and industrial output. Nitrogen mineral fertilizers increased in Asia both in kg/ha and kg/capita indicating an intensification of agriculture and maybe an increase of production higher than the increase in population. In Africa, the application of mineral fertilizers slowly increased from 1980 to 2005 but not in kg/capita indicating that agriculture is intensifying but not as fast as population growth which might lead to a problem of food shortage in northern Africa. The time series of nitrogen manure in EU27, extra-EU27, and Asia have similar behaviors: two peaks were observed in 2000 and 2010 with a constant value in between. The highest peak in EU27 is around 50 kg/ha. In Africa, nitrogen manure increased both in kg/ha and kg/capita, indicating a change in diet with the increase in animal protein intake. Nitrogen from domestic emissions connected to sewerage systems increased in Africa from around 0.8 kg/capita in 1980 to 2.4 kg/capita in 2019, while the amount of nitrogen from unconnected and improved systems decreased, due to the increase of connection to sewerage systems, however, not with the adequate treatment level. The opposite was observed in EU27 where the treatment level is increasing, resulting in a decrease in emission per capita.
Concerning phosphorus inputs, the largest contribution was observed in EU27 (around 3 Mton in 2019, 60% of total inputs in the study area) followed by Asia (1 Mton in 2019, 22% of total inputs), Africa (0.6 Mton in 2019, 11% of total inputs), and extra-EU (0.4 Mton in 2019). The largest share in the study area is represented by manure and mineral fertilizers (~60 and 32%, respectively, of total inputs in 2019), while P from domestic emissions connected to sewerage systems, industry, and detergents contributed ~4% of total inputs (year 2019). A decrease of P inputs through diffuse sources occurred in the last 10 years in EU27, with manure values back to those of the period 1980–1995 while mineral fertilizers decreased. Similar behaviors were observed in extra-EU27. In Asia, we observed a decrease of P from diffuse sources in the last 10 years with values the same as those of 1980–2015, but with a different distribution of sources (higher mineral fertilizers). In Africa, P inputs from diffuse sources significantly increased with a large manure P contribution and a smaller increase in mineral P. A similar pronounced increase was observed in Africa for P from point sources. P released from wastewater treatment plants is the main contributor and is steadily increasing. A similar trend is observed for discharges from industries and P-detergents. In EU27, P emission from point sources decreased from 1990. This decrease is particularly marked for P emission from detergents after 2015, reflecting the increasing number of countries banning phosphorus-based detergents in the EU. In Asia, P from point sources remained stable from 1995. P mineral fertilizer application rate is steadily decreasing in EU27 due to the saturation of soils with P and farmers adjusting their fertilization strategy accordingly. In Africa, the phosphorus fertilizer application rate increased but not in kg/capita. This implies that agriculture is intensifying, while the decrease in application per capita shows that the increase in production is slower than the increase in population. Phosphorus from detergents (kg/ha or kg/capita) increased significantly from 1980 in Africa and Asia, while it decreased after 2010 in EU27. A similar behavior was observed in extra-EU27 probably because this region includes the United Kingdom which withdrew from the EU in 2020.
N/P of diffuse sources (Figure 9) increased significantly in EU27 and extra-EU27 while they decreased in Africa until 2015. The ratio of N/P from point sources increased in all continents and, in particular, in EU27, which is probably explained by the higher removal rate for phosphorus than nitrogen.
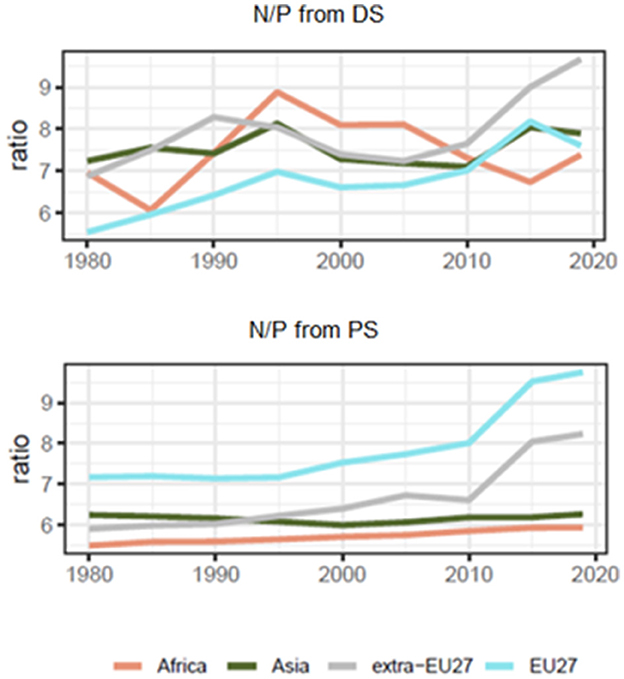
Figure 9. N/P ratio for N inputs by continents. DS: diffuse sources; PS: point sources.
The time series analysis of inputs clearly showed the effectiveness of the UWWTP directive in reducing the amount of N and P from point sources in Europe compared to the other regions. This was also observed by Bouraoui and Grizzetti (2011) analyzing the change of nutrient pressure from point sources in the period 1990–2005, as well as by Oenema et al. (2011) who pointed out how by the end of 2005, the wastewater collecting system was in place for the 93% of the total pollution load in Europe. In Africa, we observed instead a strong increase of nutrient point source emissions from 1980. This is also the case in the South Levantine marine region, where N and P inputs from wastewater treatment plants increased exponentially from 1980 due to a higher connection rate of a growing population, however, with a low level of treatment (Haddaoui and Mateo-Sagasta, 2021). In particular, Wahaab and Badawy (2004) report that all the existing sewage treatment plants in the Nile River need improvements since the plants receive large amounts of wastewater due to excessive household water consumption and leakage from the systems estimated around 70%.
It is noteworthy how the banning STP in detergents has a positive effect in reducing P inputs in the countries where the ban is applied. The Air Quality Directive also seems to have an impact on reducing nitrogen inputs in Europe, in particular, in the Baltic Sea and Black Sea marine regions. This is in accordance with Erisman et al. (2011) who highlighted how the emissions of NOx in the EU-27 have decreased on average by about 31% between 1990 and 2005. We also observed a reduction of manure application in Europe in the last decade showing the effectiveness of the Nitrates Directive and, in particular, how Member States have efficiently implemented Action Programmes that include restrictions on the quantity, timing, and location of application of fertilizers, setting a maximum limit of application of manure to 170 kg N/ha (or derogation asked by Member States).
However, the asynchronous timing of these legislations addressing point and diffuse sources could lead to asynchronicity in the response of riverine concentration to mitigation measures. Indeed, there is now strong evidence of the apparent disconnection across time between management actions and N or P concentration reduction in aquatic ecosystems (Ascott et al., 2021). This highlights the need to advocate the integration of legacy storage dynamics and time lags into policymaking. This is further exacerbated by the alterations of the N:P ratio in emissions due to human activities (from point sources and diffuse sources) during the past 40 years.
In this context, the need for a harmonization of nutrient regulations across continents seems necessary. Indeed, the existing regulation has halted the increase of nutrient emission in EU27; however, a similar trend was not observed in non-EU27 countries, in particular, for countries bordering the Mediterranean Sea. To be effective, the implementation of the Barcelona Convention (and other conventions) requires joint efforts across continents to control nutrient emissions into the seas in order to protect and restore the ecosystems. For that reason, at the end of 2021, contracting parties to the Barcelona Convention signed a declaration endorsing a new strategy from 2022 to 2027 to achieve a healthy, clean, sustainable, and climate-resilient Mediterranean Sea in line with the European Green Deal.
The harmonization of nutrient regulations should consider the regional differences in the N and P inputs considering the specific characteristics of the territory (soil type, climate, and topography), as well as the agriculture practices, fate and efficiency of N and P inputs, and legacy. The major challenge will be to control nutrient emissions without affecting crop production, in particular, in developing countries. However, this challenge is not unsurmountable, and better use of manure and wastewater could help maintain or boost agricultural production, reducing pressure on the environment.
The study quantified the impact of EU nutrient policy implementation analyzing reconstructed time series of nutrient inputs in the 1979–2019 period. This research expands the previous work of Malagò and Bouraoui (2021) and provides new evidence for effective nutrient pollution control. The reconstructed high spatial resolution anthropogenic nutrient pressures include long time series across 40 years of nitrogen atmospheric deposition, mineral fertilizers and organic N and P fertilizers, N and P from sewer connection, and improved and unconnected systems from the urban and rural populations.
The study showed the positive effects of the UWWTP directive and the banning of STP in detergents in reducing inputs in Europe compared to North Africa and Eastern Europe. The Air Quality Directive and the Nitrates Directive had also a clear impact in reducing nitrogen inputs from diffuse sources. However, it also showed the asynchronous timing effects of these legislations, leading to the need for new harmonized nutrient regulations that consider regional physical properties, agricultural practices, and N and P legacy. In addition, to protect the European Seas, there is the need to ensure that all neighboring territories contribute to the effort of reduction.
The raw data supporting the conclusions of this article will be made available by the authors, without undue reservation.
All authors listed have made a substantial, direct, and intellectual contribution to the work and approved it for publication.
The authors declare that the research was conducted in the absence of any commercial or financial relationships that could be construed as a potential conflict of interest.
All claims expressed in this article are solely those of the authors and do not necessarily represent those of their affiliated organizations, or those of the publisher, the editors and the reviewers. Any product that may be evaluated in this article, or claim that may be made by its manufacturer, is not guaranteed or endorsed by the publisher.
The Supplementary Material for this article can be found online at: https://www.frontiersin.org/articles/10.3389/fsufs.2023.1062435/full#supplementary-material
Arino, O., Perez, R. J. J., Kalogirou, V., Bontemps, S., Defourny, P., Van Bogaert, E., et al. (2012). Global Land Cover Map for 2009 (GlobCover 2009). Louvain: UCLouvain.
Arnold, J. G., Moriasi, D. N., Gassman, P. W., Abbaspour, K. C., White, M. J., Srinivasan, R., et al. (2012). Swat: model use, calibration, and validation. Trans. ASABE 55, 1491–1508. doi: 10.13031/2013.42256
Ascott, M. J., Gooddy, D. C., Fenton, O., Vero, S., Ward, R. S., Basu, N. B., et al. (2021). The need to integrate legacy nitrogen storage dynamics and time lags into policy and practice. Sci. Total Environ. 781, 146698. doi: 10.1016/j.scitotenv.2021.146698
Bernal, M. P., Bescós, B., Burgos, L., Bustamante, M., Clemente, R., Fabbri, C., et al. (2015). Evaluation of Manure Management Systems in Europe (LIFE09 ENV/ES/000453). SARGA.
Bouraoui, F., and Grizzetti, B. (2011). Long term change of nutrient concentrations of rivers discharging in European seas. Sci. Total Environ. 409, 4899–4916. doi: 10.1016/j.scitotenv.2011.08.015
Bouraoui, F., Panagos, P., Malagó, A., Pistocchi, A., and Didion, C. (2022). Regulations on nitrate use and management. Nitrate Handb. 19, 405–423. doi: 10.1201/9780429326806-24
Bouwman, A. F., Lee, D. S., Asman, W. A. H., Dentener, F. J., Van Der Hoek, K. W., Olivier, J. G. J., et al. (1997). A global high-resolution emission inventory for ammonia. Global Biogeochem. Cycles 11, 561–587. doi: 10.1029/97GB02266
De Vries, D., Schulte-Uebbing, W., Kros, L., Cees Voogd, H., and Louwagie, J. G. (2021). Spatially explicit boundaries for agricultural nitrogen inputs in the European Union to meet air and water quality targets. Sci. Total Environ. 786, 147283. doi: 10.1016/j.scitotenv.2021.147283
Dijkstra, L., and Poelman, H. (2014). A Harmonised Definition of Cities and Rural Areas: The New Degree of Urbanisation. Available online at: https://ec.europa.eu/regional_policy/en/information/publications/working-papers/2014/a-harmonised-definition-of-cities-and-rural-areas-the-new-degree-of-urbanisation
EC. (1991a). European Commission Directive 91/676/EEC Concerning the Protection of Waters against Pollution Caused by Nitrates from Agricultural Sources (Nitrates Directive); OJ (1991) L375/1. Brussels: European Commission.
EC. (1991b). Council Directive 91/271/EEC of 21 May 1991 Concerning Urban Waste-Water Treatment [WWW Document]. Available online at: https://eur-lex.europa.eu/legal-content/EN/TXT/?uri=CELEX:31991L0271 (accessed April 1, 2021).
EC. (2001). Directive 2001/81/Ec of the European Parliament and of the Council [WWW Document]. Available online at: https://eur-lex.europa.eu/legal-content/EN/TXT/?uri=celex%3A32001L0081 (accessed March 10, 2022).
EC. (2008). Directive 2008/56/Ec of the European Parliament and of the Council of 17 June 2008 Establishing a Framework for Community Action in the Field of Marine Environmental Policy (Marine Strategy Framework Directive). Available online at: https://eur-lex.europa.eu/legal-content/EN/TXT/?uri=CELEX%3A32008L0056 (accessed April 1, 2021).
Erisman, J. W., Van, G. H., Grizzetti, B., Bouraoui, F., Powlson, D., Sutton, M. A., et al. (2011). The European Nitrogen Problem in a Global Perspective. Cambridge: Cambridge University Press.
EUROSTAT. (2021). ESTAT Connection Dataset [WWW Document]. Available online at: https://ec.europa.eu/eurostat/databrowser/product/page/ENV_WW_CON (accessed February 23, 2022).
FAO/IIASA/ISRIC/ISSCAS/JRC. (2012). Harmonized World Soil Database (version 1, 2.). FAO, Rome, Italy IIASA, Laxenburg, Austria.
FAOSTAT. (2021a). Fertilizers by Nutrient [WWW Document]. Available online at: http://www.fao.org/faostat/en/#data/RFN (accessed May 2, 2020).
FAOSTAT. (2021b). Live Animals [WWW Document]. Available online at: http://www.fao.org/faostat/en/#data/QA (accessed May 2, 2020).
FAOSTAT. (2021c). Livestock Primary [WWW Document]. Available online at: http://www.fao.org/faostat/en/#data/QL (accessed May 2, 2020).
FAOSTAT. (2021d). Annual Population [WWW Document]. Available online at: http://www.fao.org/faostat/en/#data/OA (accessed May 2, 2020).
FAOSTAT. (2022). Datasets [WWW Document]. Available online at: https://www.fao.org/faostat/en/#data (accessed March 5, 2022).
Haddaoui, I., and Mateo-Sagasta, J. (2021). A review on occurrence of emerging pollutants in waters of the MENA region. Environ. Sci. Pollut. Res. 28, 68090–68110. doi: 10.1007/s11356-021-16558-8
Herridge, D. F., Peoples, M. B., and Boddey, R. M. (2008). Global inputs of biological nitrogen fixation in agricultural systems. Plant Soil. 311, 1–8. doi: 10.1007/s11104-008-9668-3
IFASTAT. (2016). Fertilizer Use by Crop [WWW Document]. Available online at: https://www.ifastat.org/faq (accessed May 2, 2020).
Jenny, J. P., Normandeau, A., Francus, P., Taranu, Z. E., Gregory-Eaves, I., Lapointe, F., et al. (2016). Urban point sources of nutrients were the leading cause for the historical spread of hypoxia across European lakes. Proc. Natl. Acad. Sci. U. S. A. 113, 12655–12660. doi: 10.1073/pnas.1605480113
JMP. (2019). Joint Monitoring Programme for Water Supply, Sanitation and Hygiene. Estimates on the Use of Water, Sanitation and Hygiene by Country (2000-2017) [WWW Document]. Available online at: https://washdata.org/ (accessed February 23, 2020).
Köninger, J., Lugato, E., Panagos, P., Kochupillai, M., Orgiazzi, A., Briones, M. J. I., et al. (2021). Manure management and soil biodiversity: towards more sustainable food systems in the EU. Agric. Syst. 194, 103251. doi: 10.1016/j.agsy.2021.103251
Lamarque, J. F., Dentener, F., McConnell, J., Ro, C. U., Shaw, M., Vet, R., et al. (2013a). Multi-model mean nitrogen and sulfur deposition from the atmospheric chemistry and climate model intercomparison project (ACCMIP): evaluation of historical and projected future changes. Atmos. Chem. Phys. 13, 7997–8018. doi: 10.5194/acp-13-7997-2013
Lamarque, J. F., Shindell, D. T., Josse, B., Young, P. J., Cionni, I., Eyring, V., et al. (2013b). The atmospheric chemistry and climate model intercomparison Project (ACCMIP): overview and description of models, simulations and climate diagnostics. Geosci. Model Dev. 6, 179–206. doi: 10.5194/gmd-6-179-2013
Leip, A., Britz, W., Weiss, F., and De Vries, W. (2011). Farm, land, and soil nitrogen budgets for agriculture in Europe calculated with CAPRI. Environ. Pollut. 159, 3243–3253. doi: 10.1016/j.envpol.2011.01.040
Liu, Y., Pan, X., and Li, J. (2014). A 1961–2010 record of fertilizer use, pesticide application and cereal yields: a review. Agron. Sustain. Dev. 351, 83–93. doi: 10.1007/s13593-014-0259-9
Lopez Barrera, E., and Hertel, T. (2021). Global food waste across the income spectrum: implications for food prices, production and resource use. Food Policy 98, 101874. doi: 10.1016/j.foodpol.2020.101874
LP DAAC. (2004). Global 30 Arc-Second Elevation Data Set GTOPO30. Land Process Distributed Active Archive Center. Available online at: https://www.usgs.gov (accessed October 10, 2016).
Macedo, H. E., Lehner, B., Nicell, J., Grill, G., Li, J., Limtong, A., et al. (2022). Global distribution of wastewater treatment plants and their released effluents into rivers and streams earth system science data discussions. Earth Syst. Sci. Data 14, 559–577. doi: 10.5194/essd-14-559-2022
Malagò, A., and Bouraoui, F. (2021). Global anthropogenic and natural nutrient fluxes: from local to planetary assessments. Environ. Res. Lett. 16, 54074. doi: 10.1088/1748-9326/abe95f
Morée, A. L., Beusen, A. H. W., Bouwman, A. F., and Willems, W. J. (2013). Exploring global nitrogen and phosphorus flows in urban wastes during the twentieth century. Global Biogeochem. Cycles 27, 836–846. doi: 10.1002/gbc.20072
Oenema, O., Bleeker, A., Braathen, N. A., Bull, K., Cermak, P., Geupel, M., et al. (2011). Nitrogen in Current European Policies, The European Nitrogen Assessment. Cambridge: Cambridge University Press.
Penuelas, J., Janssens, I. A., Ciais, P., Obersteiner, M., and Sardans, J. (2020). Anthropogenic global shifts in biospheric N and P concentrations and ratios and their impacts on biodiversity, ecosystem productivity, food security, and human health. Glob. Chang. Biol. 26, 1962–1985. doi: 10.1111/gcb.14981
Powley, H. R., Dürr, H. H., Lima, A. T., Krom, M. D., and Van Cappellen, P. (2016). Direct discharges of domestic wastewater are a major source of phosphorus and nitrogen to the Mediterranean Sea. Environ. Sci. Technol. 50, 8722–8730. doi: 10.1021/acs.est.6b01742
REFIT. (2019). Commission Staff Working Document Evaluation of the Council Directive 91/271/EEC of 21 May 1991, concerning urban waste-water treatment [WWW Document]. Available online at: https://ec.europa.eu/environment/water/water-urbanwaste/pdf/UWWTD Evaluation SWD 448-701 web.pdf (accessed April 1, 2021).
RPA. (2006). Non-Surfactant Organic Ingredients and Zeolite-based Detergents [WWW Document]. Available online at: https://ec.europa.eu/docsroom/documents/14124/attachments/1/translations/ (accessed February 23, 2022).
Schreiber, H., Constantinescu, L. T., Cvitanic, I., Drumea, D., Jabucar, D., Juran, S., et al. (2003). Environmental Research of the Federal Ministry of the Environment, Nature Conservation and Nuclear Safety Harmonised Inventory of Point and Diffuse Emissions of Nitrogen and Phosphorus for a Transboundary River Basin. Cambridge: Cambridge University Press.
Sheldrick, W., Keith Syers, J., and Lingard, J. (2003). Contribution of livestock excreta to nutrient balances. Nutr. Cycl. Agroecosystems 66, 119–131. doi: 10.1023/A:1023944131188
Tian, H., Yang, J., Lu, C., Xu, R., Canadell, J. G., Jackson, R. B., et al. (2018). The global N2O model intercomparison project. Bull. Am. Meteorol. Soc. 99, 1231–1251. doi: 10.1175/BAMS-D-17-0212.1
Van Grinsven, H. J. M., Spiertz, J. H. J., Westhoek, H. J., Bouwman, A. F., and Erisman, J. W. (2014). Nitrogen use and food production in European regions from a global perspective. J. Agric. Sci. 152, 9–19. doi: 10.1017/S0021859613000853
Wahaab, R. A., and Badawy, M. I. (2004). Water quality assessment of the River Nile system: An overview. Biomed. Environ. Sci. 2004 17, 87–100.
Wassen, M. J., Schrader, J., Eppinga, M. B., Sardans, J., Berendse, F., Beunen, R., et al. (2022). The EU needs a nutrient directive. Nat. Rev. Earth Environ. 35, 287–288. doi: 10.1038/s43017-022-00295-8
Wassen, M. J., Schrader, J., van Dijk, J., and Eppinga, M. B. (2020). Phosphorus fertilization is eradicating the niche of northern Eurasia's threatened plant species. Nat. Ecol. Evol. 51, 67–73. doi: 10.1038/s41559-020-01323-w
You, L., Wood-Sichra, U., Fritz, S., Guo, Z., See, L., Koo, J., et al (2014). Spatial Production Allocation Model (SPAM) 2005 v2.0. Available online at: http://mapspam.info (accessed September 1, 2016).
Keywords: European directives, Europe, time series, nitrogen, phosphorus
Citation: Malagó A and Bouraoui F (2023) Forty years of anthropogenic nutrient pressures: agriculture and domestic nitrogen and phosphorus inventory in view of sustainable nutrient management. Front. Sustain. Food Syst. 7:1062435. doi: 10.3389/fsufs.2023.1062435
Received: 13 October 2022; Accepted: 08 March 2023;
Published: 13 April 2023.
Edited by:
Yaoping Wang, The University of Tennessee, Knoxville, United StatesReviewed by:
Andrey Sharov, Papanin Institute for Biology of Inland Waters (RAS), RussiaCopyright © 2023 Malagó and Bouraoui. This is an open-access article distributed under the terms of the Creative Commons Attribution License (CC BY). The use, distribution or reproduction in other forums is permitted, provided the original author(s) and the copyright owner(s) are credited and that the original publication in this journal is cited, in accordance with accepted academic practice. No use, distribution or reproduction is permitted which does not comply with these terms.
*Correspondence: Fayçal Bouraoui, ZmF5Y2FsLmJvdXJhb3VpQGVjLmV1cm9wYS5ldQ==
†These authors have contributed equally to this work
Disclaimer: All claims expressed in this article are solely those of the authors and do not necessarily represent those of their affiliated organizations, or those of the publisher, the editors and the reviewers. Any product that may be evaluated in this article or claim that may be made by its manufacturer is not guaranteed or endorsed by the publisher.
Research integrity at Frontiers
Learn more about the work of our research integrity team to safeguard the quality of each article we publish.