 Jun Wu
 Wenpeng Jia
 Yile Ba1
 Yunbo Zhang
 Jian Li
- 1School of Economics and Management, Beijing University of Chemical Technology, Beijing, China
- 2China People's Police University, Beijing, China
- 3School of Economics and Management, Beijing University of Technology, Beijing, China
Nowadays, the freshness level of agriproducts has become one of the major concerns for consumers. The demand for fresh agriproducts in the market has been increasing more than ever. However, the circulation losses of fresh agriproducts is significant during logistic processes, such as long-distance transportation. Statistics show that 20–25% of perishable agriproducts deteriorate in the circulation loop in developing countries, whereas in developed countries, this can be controlled at <5%. Developing countries must improve their cold-chain logistics and reduce post-production losses of this kind of agriproduct. The freshness-keeping effort for fresh agriproducts and the coordination mechanism of the supply chain have become two of the hot topics in this field. Based on the existing research, this study describes the freshness-keeping effort as a joint effort function of the supplier and the manufacturer, and studies the optimization and coordination of a three-echelon fresh agriproduct supply chain. In this research, four decision-making scenarios are modeled and analyzed, including decentralized decision-making, centralized decision-making, and two kinds of collaborative decision-making. Then, the profit distributions of two collaborative decision-making scenarios and centralized decision-making scenarios are calculated using the average tree solution. The study suggests that different cooperation styles of enterprises in the agriproduct supply chain have a different impact on the freshness level of the final product received by consumers. Both the final freshness level and the price of the product depend on the joint freshness-keeping efforts of the supplier and the manufacturer. The cooperation of enterprises in the three-echelon fresh agriproduct supply chain is conducive to the improvement of the final freshness level of agriproducts and the maximization of the supply chain's total profit. In such a three-echelon fresh agriproduct supply chain, the use of average tree solution can effectively distribute the profit and promote cooperation among different parties.
1. Introduction
Each year, various kinds of fresh products are traded across countries, including not only agriproducts such as apples, corn, and soybeans but also marine products such as lobsters. China and the United States are the top two countries with the highest yield and bilateral trade of agriproducts worldwide. Considering such a scenario, if a customer decides to purchase some fruit in a supermarket, they may be unaware that the apple in their hands was just sent from New Zealand a couple of hours ago. Many factors can contribute to the quantity and quality losses of fresh products, such as long-distance transportation, improper packaging, and storage methods. Although many kinds of freshness-keeping methods have been adopted in logistics, approximately two-thirds of the loss occurs during the processes of food supply chains (Yu and Xiao, 2017). When these fresh products are delivered to the target markets, customers will select and decide whether to purchase or not. If the fresh product suffers more from quantity loss, it brings a huge loss to the retailer. Similarly, if it suffers more from quality loss, this will damage consumers' confidence and result in a lower amount of sales. With the improvement of people's living quality, consumers are paying more attention to the quality of fresh products other than just the quantity. High-quality products are naturally favored by customers and could bring more profits to the whole industrial chain. To effectively reduce the quantity and quality loss of fresh products, an efficient cold-chain logistics system has been introduced in the industry. Many firms in the fresh product supply chain have established their own cold-chain logistic systems or have outsourced the service to third-party logistic providers to reduce the potential losses in the circulation of fresh products, especially during the processes of transportation, storage, and trade.
One typical characteristic of fresh products or deteriorating products is that they are perishable, which is one of the major considerations in relating companies' business decision-making and the infrastructure policy of governments (He et al., 2018). Many scholars conducted related research regarding this from several perspectives. In some research, the perishable characteristic is defined, in terms of quantity losses, as the quantity of such fresh products that will deteriorate during the process of transportation. The amount delivered at the final market is less than that at the beginning (Rahdar and Nookabadi, 2014; Bai et al., 2017; Yu and Xiao, 2017). Some researchers define deterioration in terms of quality losses in the freshness level of fresh products, such as the degree of surface gloss and a decrease in nutrition over time (Yu and Xiao, 2017). In recent literature, it has become more common for scholars to take both the quantity loss and the quality loss into consideration at the same time (Yu and Xiao, 2017). For example, the rates of quantity and quality loss were assumed to be time-related (Qin et al., 2014). Both quantity and quality loss were regarded as a function of transportation time (Cai et al., 2010, 2013; Zulvia et al., 2020). The quantity and quality of fresh agriproducts affect the market demand. The market demand may be affected by price, advertising level, and product quality (Chemonog and Avinadav, 2019; Chemonog, 2020).
One efficient measure that can reduce quality and quantity loss is adopting a freshness-keeping effort (Ma et al., 2019; Liu C. et al., 2021; Liu M. et al., 2021). As storage and transportation facilities for fresh products have gradually improved, some necessary factors should be taken into consideration (Giri and Sarker, 2017; Chen et al., 2018; Zhong and Sun, 2022). Under certain freshness-keeping conditions, deteriorating products such as food, flowers, fruits, and cold meat will deteriorate in quality and quantity, resulting in a negative impact on market demand (Nadia et al., 2021). Therefore, many firms decide to improve their freshness-keeping abilities. Some companies provide freshness-keeping services, and some firms provide a controlled warehouse atmosphere for fresh agriproducts and other deteriorating products (Herbon et al., 2014; Xu et al., 2017). Some studies focus on the roles of different enterprises in the supply chain coordination contract (Rahdar and Nookabadi, 2014; Wu et al., 2015). Some scholars conducted supply chain research from an economic perspective, such as Wu et al. (2020, 2022a,b), and Zhang et al. (2022), and in their research, many factors were introduced and analyzed, which inspired our modeling process.
Coordination is another efficient method to increase collaboration among different enterprises in the supply chain. Several kinds of coordination incentive schemes are found in previous research, such as buyback (Wu, 2013; Vipin and Amit, 2021), price discounts (Luo et al., 2014; Taleizadeh et al., 2019), revenue-sharing contracts (Shafiq and Savino, 2019; Bonari et al., 2021), and so on. Among those incentive schemes, revenue-sharing combined with other types of contracts is one of the most widely used contracts in the fresh agriproduct supply chain (Xiao et al., 2011; Bart et al., 2021). To precisely reflect the basic characteristics of the supply chain, most existing works on coordination are based on a two-echelon supply chain, whether it is the green supply chain, closed-loop supply chain, or fresh agriproducts supply chain (Xie et al., 2017; Motlagh et al., 2018; Qiu et al., 2022). Some scholars tried to better describe the practical realities and enhance the applicability of the proposed model by adopting a three-echelon supply chain, which is a good way to solve such a complex problem (Zhang and Liu, 2012; Panda et al., 2014; Lan et al., 2018).
2. Problem description, notations, and assumptions
This study focuses on a typical three-echelon fresh agriproduct supply chain, which consists of one supplier, one manufacturer, and one retailer. The fresh agriproduct supply chain has its own uniqueness compared to the traditional manufacturing supply chain. This three-echelon fresh agriproduct supply chain system works as shown in Figure 1.

Figure 1. Three-echelon fresh agriproduct supply chain.
This study considers the impact of multiple factors, such as the selling price and the freshness of the products, on the market demand for deteriorating products.
The following notations in Table 1 are used to develop the models.
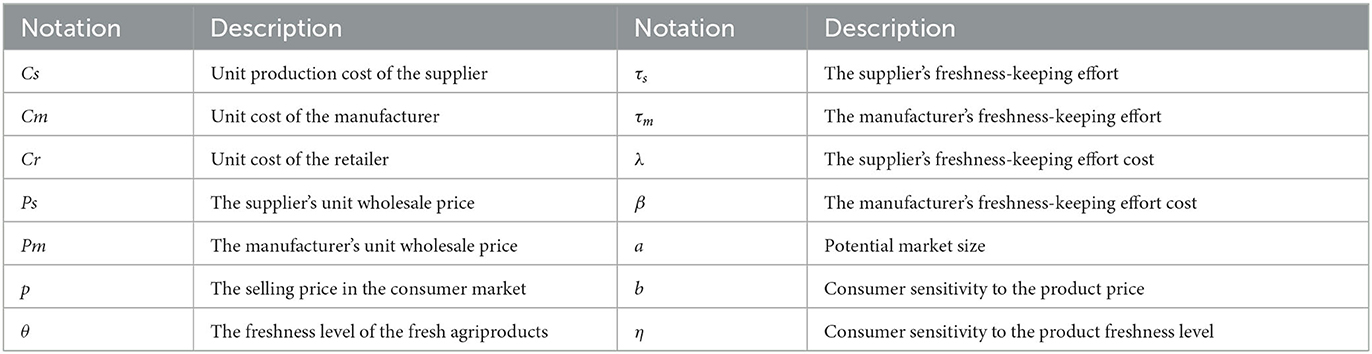
Table 1. Notations.
The research assumptions are as follows.
(1) The supply chain members are all rational and risk neutral.
(2) There is complete information within the channel for the supply chain members.
(3) The supplier sells the fresh agriproduct at a wholesale price Ps to the manufacturer with a unit production cost Cs. The manufacturer produces batches of agriproducts through processing, packaging, storage, and so on, and other expenses incurred in this process are recorded as Cm. Then, the manufacturer sells these products to the retailer at a price Pm. Finally, the retailer sells the products to the consumer at the market with the retail price p. The expenses incurred by the retailer are recorded as Cr (Cai et al., 2013; Luo et al., 2014).
(4) The freshness-keeping effort taken by the supplier to maintain the freshness of agriproducts during the supply is set to τs. The freshness-keeping effort taken by the manufacturer in the processing, packaging, storage, and so on of agriproducts is set to τm (Bai et al., 2017).
(5) The freshness-keeping cost coefficient of the supplier is λ and the manufacturer's freshness-keeping cost factor is β. Given that the marginal cost of the freshness-keeping effort is strictly increasing, and in this study represent the freshness-keeping costs of the supplier and the manufacturer, respectively. Since the retailer is closest to the consumer market, the unit cost of the retailer's freshness preservation measures is Cr (Cai et al., 2010; Bai et al., 2017).
(6) The products shipped to the retailer can meet the full demand of the consumer market.
(7) The market demand for fresh agriproducts is related to the market selling price of agriproducts p and the freshness θ, and the demand function is set to D = a−bp+ηθ (Lan et al., 2018; Moon et al., 2020).
(8) The freshness of the final products is determined by the freshness-keeping efforts of the supplier and manufacturer, and the linear function θ = τs+τm represents the final freshness. Thus, the market demand function can be expressed as D = a−bp + η(τs + τm), where a is the potential market size, b is the consumer's sensitivity coefficient to the selling price, and η is the consumer's sensitivity coefficient to the freshness θ. This demand function means that consumer market demand for agriproducts decreases as prices rise, and increases with the final freshness of the products.
3. Method and modeling approach
In a three-echelon fresh agriproduct supply chain, the supplier, manufacturer, and retailer combine in a way similar to an organism. In fact, the retailer, supplier, and manufacturer are upstream players. In other words, different decision-making will result in different unit wholesale prices, selling prices, and freshness levels, as well as the profits of each player in the supply chain. Consequently, this study considers four different decision-making scenarios, namely, decentralized decision-making, centralized decision-making, and two kinds of collaborative decision-making (collaborative decision-making of the supplier and manufacturer and collaborative decision-making of the manufacturer and retailer). This study uses the abbreviations DC, C, SM, and MR to represent the above four scenarios.
3.1. Equilibrium decisions under the scenario DC
The study first focuses on decentralized decision-making, which refers to the independent decisions made by each enterprise in the supply chain from its own perspective in order to maximize its own profits. The decision sequences for this scenario are as follows: first, the supplier of fresh agriproducts will determine the wholesale price Ps of fresh agriproducts and the freshness-keeping effort τs according to their own business conditions. Second, to maximize profit, the manufacturer will determine the price and freshness-keeping effort of the fresh agriproducts sold to the retailer based on the wholesale price of the supplier and the business costs. Finally, the retailer will determine the final market price according to the manufacturer's sales price, its own operation cost, and the market demand, and will then maximize the profit in this decision-making process. The structure of such a scenario is shown in Figure 2.
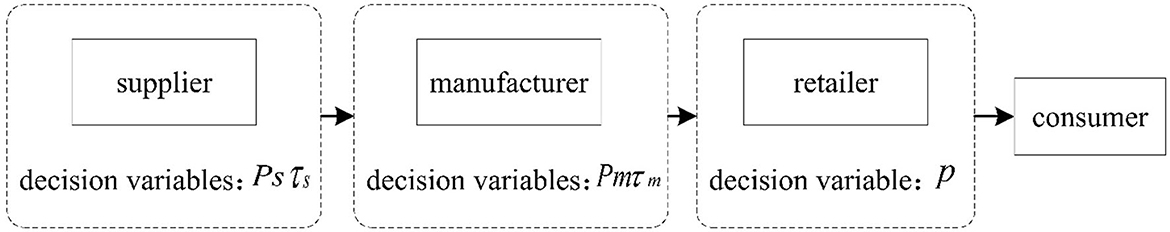
Figure 2. Supply chain model under the scenario DC.
In scenario DC, the individual profit functions of the supplier, manufacturer, and retailer are obtained as follows:
Decentralized decision-making is a fully informative, multistage, dynamic decision-making process for the supplier, the manufacturer, and the retailer. In a decentralized system with three members, each member makes their own decisions separately to maximize their own profit. We consider this scenario to be a Stackelberg game, with the supplier as the leader. The supplier first sets the wholesale price and the freshness-keeping effort. Then, the manufacturer determines the freshness-keeping effort and the selling price to the retailer. Finally, the retailer decides the market price based on the manufacturer's announced decisions. In the following, we use the backward sequential decision-making approach to analyze the optimal response function. In other words, we first solve the optimal pricing of the retailer, return it to the manufacturer's profit function to find the manufacturer's optimal pricing and freshness-keeping effort, and finally return to the profit function of the fresh supplier to find the supplier's optimal pricing and freshness-keeping effort.
The following proposition provides the optimal solutions and the profits of supply chain members in scenario DC.
Proposition 1. In scenario DC, the optimal selling price is obtained as
and the freshness-keeping efforts are
In addition, the corresponding profits of the supplier, manufacturer, and retailer are
Proof. As the first-order condition for maximization is obtained as , we obtain . The profit function of the retailer is strictly concave. We substitute the value of p in Equation 2, and the profit function of the manufacturer is obtained as . The profit function of the manufacturer is concave because and , . We let the first-order condition for optimization and , then, we obtain and . Finally, we substitute the values in Equation 3, and the profit function of the supplier is obtained as . The profit function of the supplier is concave because and ,. We let the first-order condition for optimization and , then, we obtain and . By using back-substitution, we obtain all the remaining values, which are presented in Proposition 1.
The social welfare function of the scenario DC can be written as
3.2. Equilibrium decisions under the scenario C
Centralized decision-making indicates that all the enterprises in the fresh agriproduct supply chain take the profit maximization of the entire supply chain as their goal, and jointly determine the final market price of the products through mutual coordination among enterprises. In a centralized decision-making process, the final market price maximizes the profits throughout the supply chain. The structure of such a scenario is shown in Figure 3.

Figure 3. Supply chain model under the scenario C.
In scenario C, the profit function of the entire supply chain is obtained as follows:
The following proposition provides the optimal outcomes in scenario C.
Proposition 2. In scenario C, the optimal freshness-keeping effort and selling price at the consumer market are obtained as
and the equilibrium profit of the entire supply chain is
Proof. The first-order conditions for maximization are obtained as follows:,,. Let ,,, we obtain , and . By using back-substitution, we obtain the profit of the entire supply chain as presented in Proposition 2. The social welfare function of scenario C can be written as
3.3. Equilibrium decisions under the scenario SM
Collaborative decision-making refers to the neighboring enterprises in the supply chain in the form of contracts or alliances joining the entire supply chain decision-making process, with cooperative relations of enterprises to maximize the profits of the alliance as the goal, through mutual coordination between enterprises to determine the price of products sold to downstream enterprises or consumer markets. This study considers two collaborative decision-making scenarios: the collaborative decision-making between the supplier and manufacturer and the collaborative decision-making between the manufacturer and retailer.
The collaborative decision-making between the supplier and manufacturer, which is the SM scenario, refers to the joint decision-making of the supplier and manufacturer to determine the wholesale price sold to the retailer to maximize the profits of the supplier and manufacturer. The structure of such a scenario is shown in Figure 4.
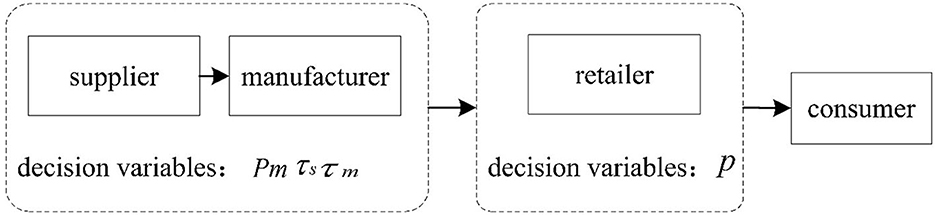
Figure 4. Supply chain model under the scenario SM.
In scenario SM, the profit function of the alliance of the supplier and manufacturer and the profit function of the retailer are obtained as follows:
The following proposition provides the optimal solutions and the profits of supply chain members in scenario SM.
Proposition 3. In scenario SM, the optimal selling price and the freshness-keeping effort are obtained as
and the profit of the alliance of the supplier and manufacturer is
and the profit of the retailer is
Proof. The first-order condition for maximization is obtained as follows: let , we obtain . The profit function of the retailer is strictly concave.
Then we substitute the value in Equation 7. We get . The first-order conditions for optimization are , and . Let ,,, we obtain , and . By using back-substitution, we obtain all the remaining values, which are presented in Proposition 3.
The social welfare function of the scenario C can be written as
3.4. Equilibrium decisions under the scenario MR
Collaborative decision-making between the manufacturer and the retailer indicates that the manufacturer and retailer make joint decisions to determine the selling price of products sold to the consumer market in order to maximize the profits of the manufacturer and retailer. The structure of such a scenario is shown in Figure 5.
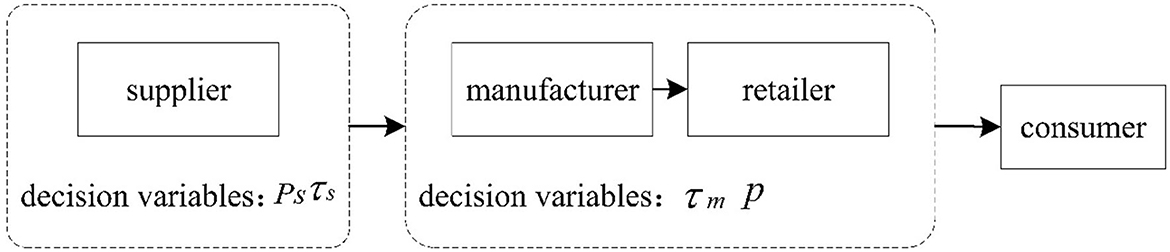
Figure 5. Supply chain model under the scenario MR.
In scenario MR, the profit function of the supplier and the profit function of the alliance of the manufacturer and retailer are obtained as follows:
The following proposition provides the optimal solutions and the profits of supply chain members in scenario MR.
Proposition 4. In scenario MR, the optimal selling price and the freshness-keeping effort are obtained as
and the corresponding profit of the supplier is
and the profit of the alliance of the manufacturer and retailer is
Proof. The first-order condition for maximization is obtained as follows: ,. Let and , we get and . We substitute the values in Equation 10. Then, we obtain . The first-order condition for optimization is obtained as and . Let and , we obtain and . By using back-substitution, we obtain all the remaining values, which are presented in Proposition 4.
The social welfare function of the scenario C can be written as
The equilibrium solution pairs in the four scenarios are shown in Table 2.
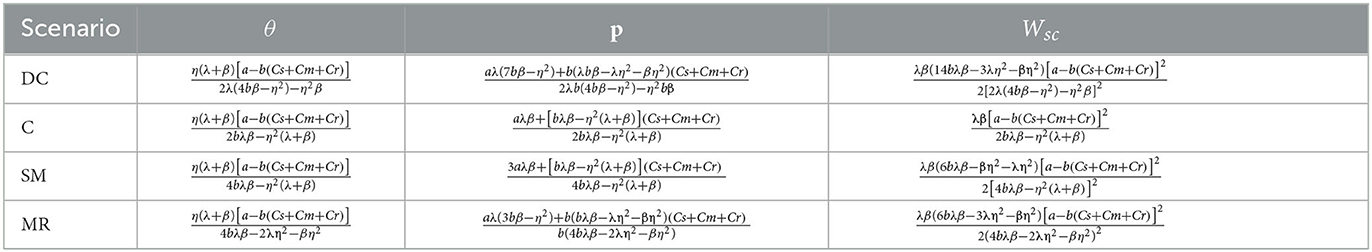
Table 2. Equilibrium solution comparison in four decision-making modes.
4. The average tree solution
The fresh agriproduct supply chain discussed in this study is a cooperative problem with a restrictive structure. Based on the average tree solution, we examine the rationality and feasibility of the distribution of the profits of the supply chain.
There are four types of alliances that are formed:
first, under scenario DC, all the enterprises make their own decisions independently. Thus, we use ({S}, {M}, {R}) to represent this scenario.
Second, under the scenario SM, the supplier and manufacturer combine as an alliance, and the retailer makes its own decisions. Thus, we use ({S, M}, {R}) to represent this scenario.
Third, under the scenario MR, the manufacturer and retailer combine as an alliance, and the supplier makes its own decisions. Thus, we use ({R, M}, {S}) to represent this scenario.
Finally, under scenario C, all the enterprises make the decision together. Thus, we use ({S, M, R}) to represent this scenario.
Note: A = 2λ(4bβ−η2)−βη2,B = 4bλβ−(λ+β)η2,C = Cs+Cm+Cr,D = 4bλβ−2λη2−βη2, E = 2bλβ−(λ+ β)η2.
Here, we use the average tree solution to distribute the profits that the supply chain gains. The profits of different enterprises are shown in Tables 3–5.
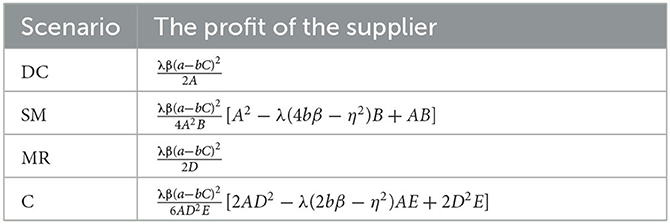
Table 3. Profits for the supplier under different decision-making scenarios.
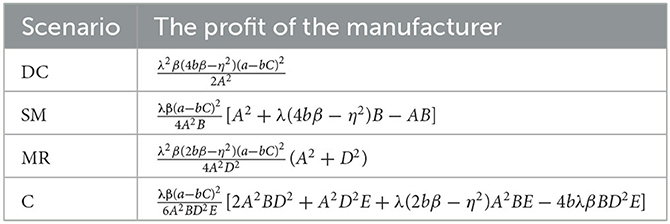
Table 4. Profits for the manufacturer under different decision-making scenarios.
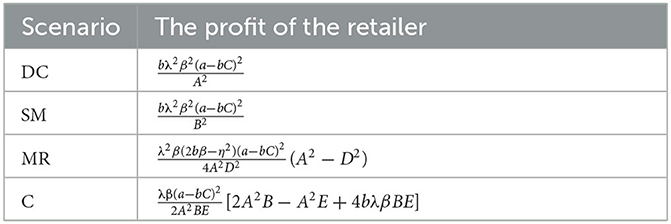
Table 5. Profits for the retailer under different decision-making scenarios.
To better illustrate the use of average tree solutions, we use a numerical example where the default values of parameters are used as follows: a = 100, b = 2, η = 2, Cs = Cm = Cr = 10, λ = β = 4. The parameters related to the demand function and the costs are considered based on previous studies (Zhang and Liu, 2012; Dey and Saha, 2018; Li et al., 2018). The profits of different enterprises are shown in Table 6.
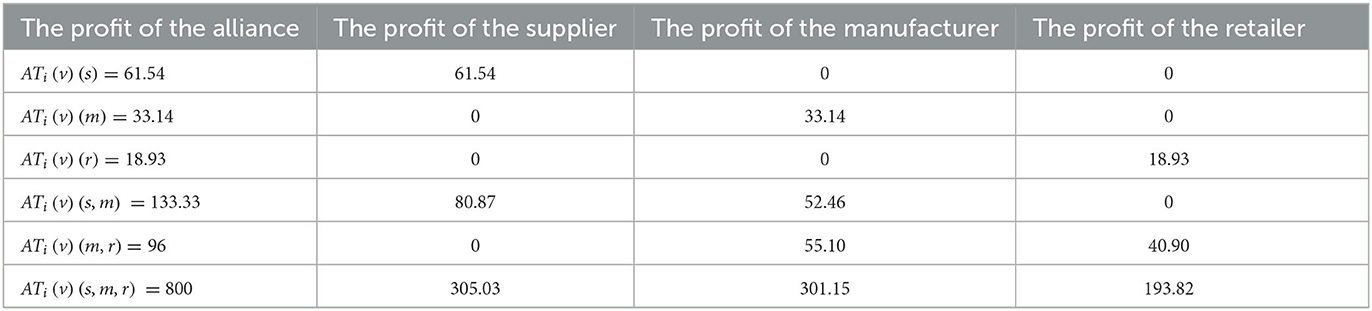
Table 6. Profits of different members.
The result shows that all of the supply chain members can obtain the maximum profit in the scenario of centralized decision-making, which is much greater than the profit in the scenarios of decentralized decision-making and collaborative decision-making. This indicates that the best option for each member is to join the alliance and pursue maximum profit. That is to say, all three members should be willing to choose centralized decision-making when it comes to agriproducts' freshness-keeping.
5. Discussion and conclusion
This study describes the freshness-keeping effort as a joint effort function of fresh suppliers and manufacturers, and studies the optimization and coordination of a three-echelon fresh agriproduct supply chain. Four decision-making scenarios are modeled, including decentralized decision-making, centralized decision-making, collaborative decision-making of the supplier and manufacturer, and collaborative decision-making of the manufacturer and retailer. Three scenarios and the profit distribution are calculated using the average tree solution, namely, the two collaborative and centralized decision-making scenarios. This study suggests that different cooperation styles of enterprises in the agriproduct supply chain have a different impact on the freshness level of the final product received by consumers. Both the final freshness level and the price of the product depend on the joint freshness-keeping efforts of the supplier and the manufacturer. The cooperation of enterprises in the three-echelon supply chain is conducive to the improvement of the final freshness level of agriproducts and the maximization of the supply chain's total profit and social welfare. In such a three-echelon fresh agriproduct supply chain, the use of an average tree solution can effectively distribute the profits and promote cooperation among different parties.
The result of this study indicates that the cooperation fashion of different companies in the fresh agriproduct supply chain has a significant impact on the freshness of the final product. In decentralized decision-making, the freshness level of agriproducts is lowest because, in this decision-making style, each enterprise in the supply chain is deciding to maximize its own profits. Compared with the increase in market demand brought about by improving the freshness of the product, the supplier and the manufacturer prefer to invest less in freshness-keeping efforts to reduce the cost of preservation caused by various measures. The freshness level of agriproducts under centralized decision-making is highest because, under centralized decision-making, all the enterprises in the supply chain reach consent on product pricing and freshness-keeping efforts, through cooperation and consultation, to maximize the total profits of the whole supply chain. Therefore, the freshness level of products is highest in this decision-making scenario. The freshness of agriproducts in the collaborative scenario is somewhere in between the abovementioned two types of decision-making, for there are two decision-makers involved in this scenario, and each has its own target. One decision-maker is the alliance of the supplier and manufacturer, which prefers to jointly determine the wholesale price and freshness-keeping measures adopted through cooperation, consultation, and so on. The other is the retailer, which prefers to determine the final retail price sold to the market based on the wholesale price to maximize its own profit.
This research also finds that the supply chain profit and social welfare in each decision-making scenario are positively correlated with the freshness level of agriproducts. The profit of the supply chain under centralized decision-making is significantly higher than that of collaborative decision-making and decentralized decision-making under the same freshness level of different agriproducts. This means the overall profit of the supply chain would be maximized if different parties can form such a large alliance and make the decision together. In fact, negotiation within the alliance involves many factors, and it is much easier for the adjacent upstream and downstream enterprises in the supply chain to form alliances, which is very common in reality. The result shows that collaborative decision-making can increase the overall profit of the supply chain, and the two companies that ally will profit more from the cooperation. Therefore, from a horizontal comparison point of view, the improvement of the freshness level of agriproducts is conducive to the increase of social welfare. From the perspective of longitudinal comparison, the supply chain profit under centralized decision-making is higher than that under collaborative decision-making, which in turn is higher than that under decentralized decision-making. This indicates that more enterprises participating in the alliance is more conducive to the improvement of profit and social welfare.
This research was inspired by and based on the results of many other works of literature. Using a new model, we achieved some similar results to other researchers. For example, Moon et al. (2020) found that joint investment was always advisable for supply chain members; the authors also proposed revenue-sharing coupled with investment cost-sharing (to improve fairness) to promote cooperation among supply chain members and to increase the final freshness of the product. In this research, we found that the cooperation of enterprises in the three-echelon supply chain is conducive to improving the freshness of agriproducts and the total social welfare, and that the use of the average tree solution can effectively distribute profits and promote cooperation among enterprises. We conclude that the consistency in the results of different research and different research methods is valuable and interesting, which may well mean that we are moving in the right direction in this field.
Research on this problem could be extended in several directions. For instance, as the freshness level can be affected by products' natural properties, surveys that estimate the parameter values of the freshness level and that explore their dependency would be worth conducting. Meanwhile, other than social welfare, concepts such as consumer surplus and joint investment could also be considered in this problem to evaluate the overall profit of the supply chain and to scrutinize the details of joint efforts. Future research should also introduce more factors in modeling, such as the losses caused by COVID-19 (Wu et al., 2020) to better describe reality.
Data availability statement
The original contributions presented in the study are included in the article/supplementary material, further inquiries can be directed to the corresponding author.
Author contributions
JW and JL: conceptualization. WJ and XL: methodology and writing—original draft preparation. WJ and YB: formal analysis. JW, YB, and JL: resources. JW and YZ: writing—review and editing. JW: supervision and project administration. All authors have read and agreed to the published version of the manuscript.
Funding
This study was supported by the National Social Science Foundation of China (Grant No. 22BGL111) and the National Natural Science Foundation of China (Grant No. 71932002).
Conflict of interest
The authors declare that the research was conducted in the absence of any commercial or financial relationships that could be construed as a potential conflict of interest.
Publisher's note
All claims expressed in this article are solely those of the authors and do not necessarily represent those of their affiliated organizations, or those of the publisher, the editors and the reviewers. Any product that may be evaluated in this article, or claim that may be made by its manufacturer, is not guaranteed or endorsed by the publisher.
References
Bai, Q., Chen, M., and Xu, L. (2017). Revenue and promotional cost-sharing contract vs. two-part tariff contract in coordinating sustainable supply chain systems with deteriorating items. Int. J. Prod. Econ. 187, 85–101. doi: 10.1016/j.ijpe.2017.02.012
Bart, N., Chernonog, T., and Avinadav, T. (2021). Revenue-sharing contracts in supply chains: A comprehensive literature review. Int. J. Prod. Res. 59, 6633–6658. doi: 10.1080/00207543.2020.1821929
Bonari, D. M., Bakhshi, A., Aghsami, A., and Jolai, F. (2021). Green supply chain management through call option contract and revenue-sharing contract to cope with demand uncertainty. Clean. Logist. Supply Chain 2, 100010. doi: 10.1016/j.clscn.2021.100010
Cai, X., Chen, J., Xiao, Y., Xu, X., and Yu, G. (2010). Optimization and coordination of fresh product supply chains with freshness-keeping effort. Prod. Oper. Manag. 19, 261–278. doi: 10.1111/j.1937-5956.2009.01096.x
Cai, X., Chen, J., Xiao, Y., Xu, X., and Yu, G. (2013). Fresh-product supply chain management with logistics outsourcing. Omega 41, 752–765. doi: 10.1016/j.omega.2012.09.004
Chemonog, T. (2020). Inventory and marketing policy in a supply chain of a perishable product. Int. J. Prod. Econ. 219, 259–274. doi: 10.1016/j.ijpe.2019.06.019
Chemonog, T., and Avinadav, T. (2019). Pricing and advertising in a supply chain of perishable products under asymmetric information. Int. J. Prod. Econ. 209, 249–264. doi: 10.1016/j.ijpe.2017.10.002
Chen, J., Dong, M., and Xu, L. (2018). A perishable product shipment consolidation model considering freshness-keeping effort. Transport. Res. E. 115, 56–86. doi: 10.1016/j.tre.2018.04.009
Dey, K., and Saha, S. (2018). Influence of procurement decisions in two-period green supply chain. J. Clean. Prod. 190, 388–402. doi: 10.1016/j.jclepro.2018.04.114
Giri, B. C., and Sarker, B. R. (2017). Improving performance by coordinating a supply chain with third party logistics outsourcing under production disruption. Comput. Ind. Eng. 103, 168–177. doi: 10.1016/j.cie.2016.11.022
He, Y., Huang, H., Li, D., Shi, C., and Wu, S. J. (2018). Quality and operations management in food supply chains: A literature review. J. Food Quality 2018, 7279491. doi: 10.1155/2018/7279491
Herbon, A., Levner, E., and Cheng, T. C. E. (2014). Perishable inventory management with dynamic pricing using time–temperature indicators linked to automatic detecting devices. Int. J. Prod. Econ. 147, 605–613. doi: 10.1016/j.ijpe.2013.07.021
Lan, Y., Li, Y., and Papier, F. (2018). Competition and coordination in a three-tier supply chain with differentiated channels. Eur. J. Oper. Res. 269, 870–882. doi: 10.1016/j.ejor.2018.02.032
Li, Q. Q., Xiao, T. J., and Qiu, Y. Z. (2018). Price and carbon emission reduction decisions and revenue-sharing contract considering fairness concerns. J. Clean. Prod. 190, 303–314. doi: 10.1016/j.jclepro.2018.04.032
Liu, C., Chen, W., Zhou, Q., and Mu, J. (2021). Modelling dynamic freshness-keeping effort over a finite time horizon in a two-echelon online fresh product supply chain. Eur. J. Oper. Res. 293, 511–528. doi: 10.1016/j.ejor.2020.12.035
Liu, M., Dan, B., Zhang, S., and Ma, S. (2021). Information sharing in an E-tailing supply chain for fresh produce with freshness-keeping effort and value-added service. Eur. J. Oper. Res. 290, 572–584. doi: 10.1016/j.ejor.2020.08.026
Luo, C., Leng, M., Huang, J., and Liang, L. (2014). Supply chain analysis under a price-discount incentive scheme for electric vehicles. Eur. J. Oper. Res. 235, 329–333. doi: 10.1016/j.ejor.2013.11.021
Ma, X., Wang, S., Islam, S. M. N., and Liu, X. (2019). Coordinating a three-echelon fresh agricultural products supply chain considering freshness-keeping effort with asymmetric information. Appl. Math. Model. 67,337–356. doi: 10.1016/j.apm.2018.10.028
Moon, I., Jeong, Y. J., and Saha, S. (2020). Investment and coordination decisions in a supply chain of fresh agricultural products. Oper. Res. Int. J. 20, 2307–2331. doi: 10.1007/s12351-018-0411-4
Motlagh, H. S. M., Nematollahi, M., and Nouri, M. (2018). Coordination of green quality and green warranty decisions in a two-echelon competitive supply chain with substitutable products. J. Clean. Prod. 196, 961–984. doi: 10.1016/j.jclepro.2018.06.123
Nadia, P. Z., Behrooz, Karimi., and Jafar, R. (2021). Dynamic pricing and inventory control policies in a food supply chain of growing and deteriorating items. Ann. Oper. Res. 2021, 1–40. doi: 10.1007/s10479-021-04239-1
Panda, S., Modak, N. M., and Basu, M. (2014). Disposal cost sharing and bargaining for coordination and profit division in a three-echelon supply chain. Int. J. Manag. Sci. Eng. Manag. 9, 276–285. doi: 10.1080/17509653.2014.903810
Qin, Y., Wang, J., and Wei, C. (2014). Joint pricing and inventory control for fresh produce and foods with quality and physical quantity deteriorating simultaneously. Int. J. Prod. Econ. 152, 42–48. doi: 10.1016/j.ijpe.2014.01.005
Qiu, R., Yu, Y., and Sun, M. (2022). Supply chain coordination by contracts considering dynamic reference quality effect under the O2O environment. Comput. Ind. Eng. 163, 107802. doi: 10.1016/j.cie.2021.107802
Rahdar, M., and Nookabadi, A. S. (2014). Coordination mechanism for a deteriorating item in a two-level supply chain system. Appl. Math. Model. 38, 2884–2900. doi: 10.1016/j.apm.2013.11.019
Shafiq, M., and Savino, M. M. (2019). Supply chain coordination to optimize manufacturer's capacity procurement decisions through a new commitment-based model with penalty and revenue-sharing, Int. J. Prod. Econ. 208, 512–528. doi: 10.1016/j.ijpe.2018.12.006
Taleizadeh, A. A., Haghighi, F., and Niaki, S. T. A. (2019). Modeling and solving a sustainable closed loop supply chain problem with pricing decisions and discounts on returned products. J. Clean. Prod. 207, 163–181. doi: 10.1016/j.jclepro.2018.09.198
Vipin, B., and Amit, R. K. (2021). Wholesale price vs. buyback: A comparison of contracts in a supply chain with a behavioral retailer. Comput. Ind. Eng. 162, 107689. doi: 10.1016/j.cie.2021.107689
Wu, D. (2013). Coordination of competing supply chains with news-vendor and buyback contract. Int. J. Prod. Econ. 144, 1–13. doi: 10.1016/j.ijpe.2011.11.032
Wu, Q., Mu, Y., and Feng, Y. (2015). Coordinating contracts for fresh product outsourcing logistics channels with power structures. Int. J. Prod. Econ. 160, 94–105. doi: 10.1016/j.ijpe.2014.10.007
Wu, X. H., Cao, S. Y., Tan, L., and Xu, Z. (2020). Comprehensive economic loss assessment of COVID-19 epidemic disaster based on dynamic CGE model. China Soft Sci. 12, 33–44. doi: 10.3969/j.issn.1002-9753.2020.12.004
Wu, X. H., Deng, H., Huang, Y. X., and Guo, J. (2022a). Air pollution, migration costs, and urban residents' welfare: A spatial general equilibrium analysis from China. Struct. Chang. Econ. Dyn. 63, 396–409. doi: 10.1016/j.strueco.2022.05.010
Wu, X. H., Tian, Z. Q., Kuai, Y., Song, S. F., and Marson, S. M. (2022b). Study on spatial correlation of air pollution and control effect of development plan for the city cluster in the Yangtze River Delta. Socio-Economic Plan. Sci. 83, 101213. doi: 10.1016/j.seps.2021.101213
Xiao, T., Yang, D., and Shen, H. (2011). Coordinating a supply chain with a quality assurance policy via a revenue-sharing contract. Int. J. Prod. Res. 49, 99–120. doi: 10.1080/00207543.2010.508936
Xie, J., Liang, L., Liu, L., and Ieromonachou, P. (2017). Coordination contracts of dual-channel with cooperation advertising in closed-loop supply chains. Int. J. Prod. Econ. 183, 528–538. doi: 10.1016/j.ijpe.2016.07.026
Xu, X., Bai, Q., and Chen, M. (2017). A comparison of different dispatching policies in two-warehouse inventory systems for deteriorating items over a finite time horizon. Appl. Math. Model. 41, 359–374. doi: 10.1016/j.apm.2016.08.024
Yu, Y., and Xiao, T. (2017). Pricing and cold-chain service level decisions in a fresh agri-products supply chain with logistics outsourcing. Comput. Ind. Eng. 111, 56–66. doi: 10.1016/j.cie.2017.07.001
Zhang, C., and Liu, L. (2012). Research on coordination mechanism in three-level green supply chain under non-cooperative game. Appl. Math. Model. 37, 3369–3379. doi: 10.1016/j.apm.2012.08.006
Zhang, W., Yan, S., Li, J., Tian, X., and Taketoshi, Y. (2022). Credit risk prediction of SMEs in supply chain finance by fusing demographic and behavioral data. J. Transport. Res. E. 158, 102611. doi: 10.1016/j.tre.2022.102611
Zhong, Y., and Sun, H. X. (2022). Game theoretic analysis of prices and low-carbon strategy considering dual-fairness concerns and different competitive behaviours. Comput. Ind. Eng. 169, 108195. doi: 10.1016/j.cie.2022.108195
Keywords: agri-product supply chain, freshness, joint efforts, coordination, average tree solution
Citation: Wu J, Jia W, Ba Y, Liu X, Zhang Y and Li J (2023) Coordination mechanism of the three-echelon supply chain of fresh agriproduct with joint efforts. Front. Sustain. Food Syst. 7:1045770. doi: 10.3389/fsufs.2023.1045770
Received: 16 September 2022; Accepted: 02 March 2023;
Published: 03 April 2023.
Edited by:
Ernesto D. R. Santibanez Gonzalez, University of Talca, ChileReviewed by:
Subrata Saha, Aalborg University, DenmarkHuajun Tang, Macau University of Science and Technology, Macao SAR, China
Xianhua Wu, Shanghai Maritime University, China
Copyright © 2023 Wu, Jia, Ba, Liu, Zhang and Li. This is an open-access article distributed under the terms of the Creative Commons Attribution License (CC BY). The use, distribution or reproduction in other forums is permitted, provided the original author(s) and the copyright owner(s) are credited and that the original publication in this journal is cited, in accordance with accepted academic practice. No use, distribution or reproduction is permitted which does not comply with these terms.
*Correspondence: Yunbo Zhang, MjAyMjQwMDIzN0BidWN0LmVkdS5jbg==