 Pablo Baldassini1,2,3*
 Walter Baethgen4
 Gonzalo Camba Sans2,3Andres Quincke1
 Virginia M. Pravia5
 José Terra5
 Ignacio Macedo5
 Gervasio Piñeiro3,6,7José Paruelo1,2,3,8
- 1Instituto Nacional de Investigación Agropecuaria, INIA La Estanzuela, Colonia, Uruguay
- 2Departamento de Métodos Cuantitativos y Sistemas de Información, Facultad de Agronomía, Universidad de Buenos Aires, Buenos Aires, Argentina
- 3LART-IFEVA, Universidad de Buenos Aires, CONICET, Buenos Aires, Argentina
- 4International Research Institute for Climate and Society (IRI), Columbia University, Palisades, NY, United States
- 5Instituto Nacional de Investigación Agropecuaria, INIA Treinta y Tres, Treinta y Tres, Uruguay
- 6Cátedra de Ecología, Facultad de Agronomía, Universidad de Buenos Aires, Buenos Aires, Argentina
- 7Departamento de Sistemas Ambientales, Facultad de Agronomía, Universidad de la República, Montevideo, Uruguay
- 8IECA, Facultad de Ciencias, UdelaR, Montevideo, Uruguay
Carbon net emission is a critical aspect of the environmental footprint in agricultural systems. However, the alternatives to describe soil organic carbon (SOC) changes associated with different agricultural management practices/land uses are limited. Here we provide an overview of carbon (C) stocks of non-forested areas of Uruguay to estimate SOC changes for different soil units affected by accumulated effects of crop and livestock production systems in the last decades. For this, we defined levels based on SOC losses relative to the original (reference) SOC stocks: 25% or less, between 25% and 50%, and 50% or more. We characterized the reference SOC stocks using three approaches: (1) an equation to derive the potential SOC capacity based on the clay and fine silt soil content, (2) the DayCent model to estimate the SOC stocks based on climate, soil texture and C inputs from the natural grasslands of the area, (3) an estimate of SOC using a proxy derived from remote sensing data (i.e., the Ecosystem Services Supply Index) that accounts for differences in C inputs. Depending on the used reference SOC, the soil units had different distributions of SOC losses within the zones defined by the thresholds. As expected, the magnitude of SOC changes observed for the different soil units was related to the relative frequency of annual crops, however, the high variability observed along the gradient of land uses suggests a wide space for increasing SOC with agricultural management practices. The assessment of the C stock preserved (CSP) belowground and the potential for increasing C accumulation or sequestration (CAP) are critical components of the C footprint of a given system. Thus, we propose a methodological road map to derive indicators of CSP and CAP at the farm level combining both, biogeochemical simulation models and conceptual models based on remote sensing data. We recognize at least three critical issues that require scientific and political consensus to implement the use of this propose: (1) how to define reference C stocks, (2) how to estimate current C stocks over large areas and in heterogeneous agricultural landscapes, and (3) what is a reasonable/acceptable threshold of C stocks reduction.
1. Introduction
The identification of greenhouse gas (GHG) emission sources in agriculture, carbon sequestration spots and the quantification of the net contribution of GHG to climate change are at the center of the debate (Smith, 2012). Agricultural practices can have a large impact on the magnitude and sign of net GHG emissions and therefore, agricultural production has often been vilified based on its C footprint, particularly due to enteric methane emissions from livestock (Friedlingstein et al., 2019; Clark et al., 2020) or C stock reductions in the biota and soils due to deforestation or management practices (Villarino et al., 2017; Smith et al., 2020). Carbon net emission is undoubtedly a critical aspect of agricultural production, but a comprehensive characterization of the environmental footprint of agriculture [i.e., the changes associated with land use and management practices that occur during the primary production process, which represent between 70% and 90% of the environmental impacts (Notarnicola et al., 2017)] must include other dimensions such as habitat and biodiversity preservation, and the supply and regulation of ecosystem services.
Regarding the C dimension of the environmental footprint, our ability to quantify the different fluxes involved is variable. For instance, there are simple alternatives to estimate methane emissions [FAO (Organización de las Naciones Unidas para la Alimentación y la Agricultura), 2014, 2016], the amount of C released by deforestation and land use changes (Houghton et al., 2000), or the C sequestration derived from forest restoration or afforestation (Bastin et al., 2019). However, assessments of changes at large scale in soil organic carbon (SOC) stocks associated with different agricultural management practices/land uses are very limited. Berhongaray and Alvarez (2013) and Villarino et al. (2014) showed that simple alternatives to estimate SOC net emissions such as those proposed by the IPCC (2006) (i.e., Tier 1 and 2) do not perform well when compared against observed data in the Argentine Pampas.
In the 2020 Global C budget, Friedlingstein et al. (2022) present a wide range for soil C stocks ranging from 1,500 to 2,400 GtC. Uncertainties to define C stocks are partially associated with the fact that direct field measurements do not easily account for the spatial and temporal variability of SOC (Dungait et al., 2012). The magnitude of these uncertainties is critical for establishing good global C budgets: the upper limit of the SOC stocks in soils in the Global C budget (2,400 Gt C) is higher than the corresponding to the permafrost (1,700 Gt C), and one order of magnitude higher than the total oil reserves (175–265 Gt C; Friedlingstein et al., 2022). Belowground C stocks are especially important in “Open Ecosystems” such as grasslands, savannas and shrublands (Bond, 2019; Terrer et al., 2021), which are biomes profoundly modified by agriculture. However, published SOC concentration maps for these areas present large differences (Feeney et al., 2022).
Biogeochemical models have often been an alternative to evaluate changes in C stocks (e.g., Caride et al., 2012; Lugato et al., 2014; Pravia et al., 2019; Baldassini and Paruelo, 2020; Baethgen et al., 2021). There is a growing trend in using SOC simulation models in applied studies, for example to evaluate sustainable alternative land uses, agroecological transitions, GHG mitigation or soil restoration (Six et al., 2004; Heimann and Reichstein, 2008). Campbell and Paustian (2015) summarized the approaches to simulate C stocks and provided a detailed description of the conceptual basis. Among the available semi-mechanistic biogeochemical models, Century (Parton et al., 1988) is one of the most widely used worldwide (e.g., Smith et al., 1997; Gottschalk et al., 2012; Lugato et al., 2014; Abramoff et al., 2018; Woolf and Lehmann, 2019). The Century model (and DayCent, its daily time step version, Del Grosso et al., 2001) has been successfully calibrated and evaluated in different agricultural systems of southern South America, including native grasslands (Álvarez, 2001; Pineiro et al., 2006), different crop-pasture rotations (Caride et al., 2012; Baethgen et al., 2021) and dry forests (Baldassini and Paruelo, 2020).
In addition to field measurements and mechanistic biogeochemical models, there are different approaches to characterize current SOC stocks. One set of approaches compiled field SOC data and derived models to generalize C stocks over the space. For example, Sanderman et al. (2018) used a machine learning-based model to describe SOC data derived from a global database of historical land use data combined with climatic, landform and lithology covariates. In the same way, there are other datasets (e.g., SoilGrids—Hengl et al., 2017, OpenLandMap—Hengl and Wheeler, 2018, GSOCmap—FAO, 2022) that can be used for mapping different soil properties at global scale. These products combined local soil sampling information and biophysical covariables using different mapping methods (e.g., digital soil mapping methods as regression kriging or machine learning techniques as Random Forest). However, the spatial interpolation process may be biased associated with the low density of sampling points at national or regional levels, suggesting the need for more detailed information to achieve better precision.
Open Ecosystem soils, mainly Mollisols, can store large stocks of recalcitrant carbon that remain sequestered when they are grazed by domestic herbivores. However, C stocks are vulnerable to being released to the atmosphere, principally as CO2, under alternative uses (Caride et al., 2012; Baethgen et al., 2021). The C sequestration in soil organic matter (SOM) is considered one of the main proposed strategies to capture CO2 (Lal, 2004a, 2006; Chabbi et al., 2017). The effects of agricultural management practices and grazing strategies on SOC stocks depend on their impact on N dynamics and net primary production (Piñeiro et al., 2010; Cotrufo et al., 2019). Open Ecosystem soils store more SOC in mineral-associated organic matter (MAOM), which is more persistent but has a higher nitrogen demand and saturates. Thus, the C:N ratio of the MAOM fraction is lower than in the Particulate Organic Matter (POM) fraction, but the C accumulation in the MAOM fraction can be saturated (Chung et al., 2008; Stewart et al., 2009; Mayzelle et al., 2014; Pravia, 2017; Rodrigues et al., 2022). The saturation level is strongly associated with texture, particularly to the fine soil particles (>2 microns) fraction (Hassink, 1997; Feng et al., 2013). Alvarez and Berhongaray (2021) estimated the carbon capacity of Argentine Pampean soils using models based on soil texture, both available in the literature and locally developed from SOC estimates. Their local model based on quantile regression showed that climate and the clay + fine silt fraction were the main predictors of the potential SOC storage capacity.
In the absence of erosion, SOC dynamics in agricultural soils is mainly determined by C inputs (Kuzyakov and Domanski, 2000; Mandal et al., 2007; Maillard and Angers, 2014). Consequently, C inputs over a given period of time are a proxy of SOC (Bolinder et al., 2007). Paruelo et al. (2016) showed that an Ecosystem Services Supply Index (ESSI) built from estimates of total annual C gains and its seasonality, was a good predictor of SOC stocks in agricultural areas of the Argentine Pampas. Also, Staiano et al. (2021) and Schwint et al. (2022) used the same index to describe SOC changes in a land cover gradient in the semiarid Chaco and in The Río de la Plata Grasslands (RPG), respectively. Machine learning approaches to derive dynamic digital maps also included historical values of vegetation indices (NDVI) to account for C inputs (Heuvelink et al., 2021). These approaches allow using remote sensing, in particular satellite imagery, to assess SOC dynamics over large regions (e.g., heterogeneous landscapes) and over time under the same observation protocol (Paruelo, 2008). Such assessment is a key step for decisions and policies that aim to preserve or increase C sequestration and reduce net C emissions from the agricultural sector.
The Río de la Plata Grasslands (RPG) region occupies the vast and continuous plains of central-eastern Argentina, Uruguay and southern Brazil that surround the Río de la Plata estuary and its major tributaries. This region covers about 853,000 km2 and it is one of the largest, most diverse, and less transformed grassland areas in the world (Henwood, 2010), despite the important land cover transformation that they experienced over the last 5 decades (Oyarzabal et al., 2020). Within this region, Uruguay presents the largest proportion of remaining grasslands [close to 53% according to Paruelo et al. (2022)]. The area that has been transformed is devoted to tree plantations (mainly Eucalyptus), annual crops (mainly soybeans, wheat and canola) and perennial sown pastures (Baeza et al., 2014; Baeza and Paruelo, 2020). An important proportion of the crop production area is under pasture-crop rotation. These characteristics give this region a central role as an area with potential for soil C sequestration, soil C preservation and for reducing C net emissions from agriculture (Hutchinson et al., 2007) which are key aspects for climate change mitigation policies (Lal, 2004b).
Both field and simulation data show that agricultural management practices may either reduce or increase SOC stocks in the RPG (Piñeiro et al., 2009, 2010; Caride et al., 2012; Baethgen et al., 2021). SOC increases are associated with management practices that increase N availability and/or C gains (e.g., N fertilization, grazing system, legume crops and service or cover crops, length of the pasture phase of the rotation, irrigation, among others; Baldocchi and Penuelas, 2019; Schlesinger, 2022). Due to C saturation the best-preserved soils may present lower potential rates of C sequestration, while more degraded soils that have lost SOC stocks, may sequester considerable amounts of C when they are properly managed (Pravia, 2017; Pravia et al., 2019; Baethgen et al., 2021). The C footprint must therefore consider the ability of an agricultural management strategy to both preserve and increase SOC stocks. Walker et al. (2022) evaluated the current, potential, and unrealized C storage in woody plant biomass and soil. Their analyses focused on woody systems, explicitly excluding agricultural and Open Ecosystem areas. The study is based on setting a two-dimensional space defined by the potential C storage and the current C storage (Figure 1). Within this space it is possible to identify areas where the management objectives should be to maintain (green areas), to increase and maintain (yellow areas) and to restore SOC stocks (red areas). Making this scheme operational requires three key elements: (a) methodological alternatives to characterize both potential and current SOC stocks with a solid conceptual basis, (b) proper calibration and evaluation of those indicators, and (c) a wide social and political consensus for defining the situations require C maintenance, C increase or C restoration.
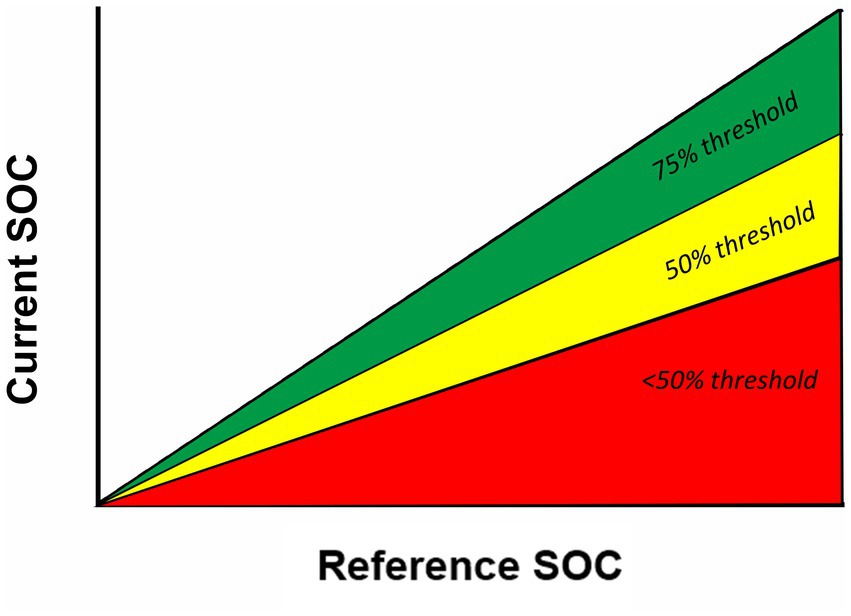
Figure 1. Two dimensional space defined by the reference C storage and the current C stocks, consisting of three categories defined by thresholds delineated by the ratio of current (y axis) to reference (x axis) carbon storage. Modified from Walker et al. (2022).
In this article we provide an overview of C stocks of non-woody areas of Uruguay based on different approaches. Our work is based on the conceptual framework presented by Walker et al. (2022) (Figure 1) adapted to non-forest ecosystems. We estimated the original (reference) SOC stocks based on three approaches. First, we used Feng et al. (2013) equation to derive the potential SOC capacity based on the clay + fine silt fraction soil content. Secondly, we used DayCent (Del Grosso et al., 2001) to estimate the C stocks considering the input from pristine grasslands biomass of the area. Finally, we derived an estimate of SOC under current conditions from a proxy derived from remote sensing data (the Ecosystem Services Supply Index or ESSI, Paruelo et al., 2016) that account for differences in C inputs. The SOC estimate from the ESSI represents the equilibrium SOC (EqSOC) under current management practices during the last 20 years. The ability of ESSI to estimate equilibrium SOC stocks was locally evaluated using SOC data obtained from a long-term experiment. We used, as our third estimate of reference SOC, the EqSOC values corresponding to the 95th percentile within each of the soil units considered in this research. Finally, we propose a methodological road map to derive indicators of C conservation and net emissions at the farm level combining both, biogeochemical models and conceptual models based on remote sensing data.
2. Materials and methods
2.1. Spatial unit of analysis
We used the Uruguayan soil map at scale 1:1,000,000 (Altamirano et al., 1976), which arises from the generalization of a survey of soil associations at scale 1:100,000, generated through the interpretation of aerial photos from 1967 at a scale of 1:40,000. The 1:1,000,000 soil map defines 99 soil units which are found in several regions of the country resulting in 321 soil polygons. For each one of the 99 unique soil units a “dominant soil type” and one or more “associated soil types” were defined, based on the area covered in the corresponding soil unit. For the dominant soil type of each soil unit, a physical–chemical characterization of the finer fraction (less than 2 microns) of the different layers was available, including data of thickness, texture (sand, silt and clay content), organic carbon, total nitrogen, pH and cation exchange capacity. The soil units were grouped into 20 agroecological regions, defined on the basis of climatic homogeneity, physiography and soil type, land cover, and on a range of limitations and land use capability [FAO (Organización de las Naciones Unidas para la Alimentación y la Agricultura), 1997; Supplementary Figure 1]. In this work, we grouped the 20 agroecological regions into 11 agroecological zones (Supplementary Figure 1) based on the similarity of their characteristics and their geographical location. For each soil polygon we estimated reference SOC stocks using three methods: quantile regression obtained from Feng et al. (2013), simulations derived from DayCent model (Del Grosso et al., 2001), and estimations using the Ecosystem Services Supply Index (ESSI, Paruelo et al., 2016). All geospatial operations were performed using QGIS 3.10, R studio and the Google Earth Engine platform (Gorelick et al., 2017).
2.2. Reference SOC stocks
2.2.1. Potential SOC or SOC capacity using the model of Feng et al.
We estimated the potential SOC or SOC capacity, defined as the upper limit of the stable carbon associated with the fine soil fraction, using the model fitted by boundary line analysis proposed by Feng et al. (2013):
The original model was fitted using the upper 10% of the Carbon data from a worldwide synthesis using a boundary line analysis or quantile regression. This analysis corresponds to a regression model that fitted a function to the most extreme values of the dataset, representing the maximum attainable SOC values. The model assumes that those potential values of SOC in the fine fraction can be achieved if the carbon inputs and turnover rates match those of the sites with the highest SOC stabilization used for fitting the model. As input, the model uses textural data of the finer soil fraction, corresponding to % of clay and fine silt. The fine silt fraction (0.002–0.020 mm) was not available in the Uruguayan soil type descriptions, and it was therefore estimated as a fraction of the total silt content, i.e., 0.002–0.050 mm (Alvarez and Berhongaray, 2021). The regression model fitted by the authors for the Argentine Pampean Region, enabled a good estimation of the fine silt with high goodness of fit (clay + fine silt (%) = 0.676 * (% clay + silt) ^ 1.01; value of p < 0.0001; R2 = 0.92).
The potential SOC was estimated for each soil unit based on the dominant soil type descriptions. For each of them, the weighted average of % clay + silt was calculated for the upper 20 cm of the soil considering the thickness of each layer. At the same time, a bulk density of 1.25 g/cm3 and its corresponding scaling factors were used to convert the data from mg C/g soil to stock at 20 cm in Mg C/ha.
2.2.2. SOC DayCent simulations
We used the DayCent model version 4.5 (Del Grosso et al., 2001) to estimate the C stocks in the upper 20 cm of the soil expected under the original grassland of the area and with low stocking rate. This model simulates the C dynamics and other elements in grasslands, forests, savannas and crop/crop-pasture systems. The DayCent is similar to the Century model (Parton, 1996), but it runs at a daily instead of monthly time step. The flows between different pools are controlled by environmental conditions (i.e., temperature, soil water content and soil texture) and by litter composition (i.e., lignin content and C/N ratio) that control the productivity and decomposition rates. The plant growth submodel is mainly determined by temperature and plant available water (Parton, 1996) and the parameters of the model were set for local composition of C3/C4 grass species. In this case, we assumed a composition of 75% of temperate species and 25% of warm species. The model had been previously calibrated for the Western Sedimentary Soils agroecological region (Baethgen et al., 2021), specifically to simulate changes in C from a long-term agricultural experiment (see section 2.3) under different agricultural management practices (e.g., crop sequences, pasture proportion in the rotation, and fertilization level). Historical climate data (i.e., precipitation and minimum and maximum temperature) were obtained from INIA’s database,1 which provides daily information from 1975 to 2021. Atmospheric deposition (dry and wet) is the main input of N, and it was estimated as a linear function of annual rainfall. More information of the model characteristics is available at: https://www2.nrel.colostate.edu/projects/daycent/.
We simulated the SOC content in the upper 20 cm of the soil until temporal stabilization for each agroecological region considering the soil characteristics of the dominant soil type in each soil unit (Supplementary Table 1). A total of 1,000 years of light grazing by native herbivores were simulated, considering stable conditions during the whole simulation period based on climate observed in the last 50 years, and in vegetation structure and species composition. Once stabilized, we observed a strong relationship between SOC content and the % of clay + silt across all the agroecological regions, which was estimated at 0.717 Mg C/ha for each unit of clay + silt (%) of increment (value of p = 0.0003, R2 = 0.78). We used this factor to correct the SOC content of the soil units belonging to the same agroecological zone based on their content of clay + silt.
2.2.3. SOC from ESSI p95
From the estimation of the EqSOC at MODIS scale (250 m) for the 2000–2022 period (see section 2.3), we calculated the 95th percentile (p95) for each soil polygon (from the 1:1,000,000 soil map). This value was used as a reference of the upper limit that the EqSOC could reach within a specific soil polygon. For each soil polygon we estimated EqSOC (p95) by calculating the 95th percentile of all the MODIS pixel values inside each soil polygon. The resulting values of estimated SOC were corrected by the clay + silt content of each soil unit using the correction factor derived from DayCent model simulations (see section 2.2.2).
2.3. SOC-ESSI calibration
We used measured SOC data from a long-term agricultural experiment (established in 1963 and still operational) which consists of 21 plots (250 × 20 m) with 7 different crop or crop-pasture sequences located in La Estanzuela Experimental Station (Instituto Nacional de Investigación Agropecuaria [INIA], the Uruguayan National Agricultural Research Institute) situated in southwestern Uruguay (34°20′ S, 57°41′ W, 82 masl; Baethgen et al., 2021). In this study we used 4 of those sequences: (a) continuous winter and summer annual grain crops, (b) 66% of the time with grain crops and the remaining 33% with pastures, (c) 50% of the time with grain crops and 50% with pastures, and (d) 33% of the time with grain crops and 66% with pastures (Baethgen et al., 2021). We also considered SOC data measured in 5 plots (30 × 10 m) of a natural grassland relict in the same experimental station located at 4 km from the long-term experiment. SOC content was calculated for an equivalent soil mass of 250 kg/m2 (Gifford and Roderick, 2003) which represents a depth of 20 cm with a reference bulk density of 1.25 g/cm3.
We extracted the annual mean and standard deviation of the NDVI (NDVIm and NDVIsd, respectively) from the Harmonized Sentinel 2 surface reflectance (Level 2A) satellite images for an area of 2 × 4.6 km that included the plots with the SOC data described above, from 1 July 2017 to 30 June 2022. We masked the pixels affected by clouds, cirrus and shadows using the cloud probability dataset (Copernicus Sentinel Data, 2022) and obtained the monthly median NDVI value at 10 m spatial resolution, based on data obtained every 5 days. The annual NDVIm and NDVIsd were estimated from the monthly median NDVI values, averaged for each plot and for the whole period (2017–2022) and scaled from 0 to 1 for the SOC-ESSI calibration. We adjusted a multiple regression analysis with the SOC data as the dependent variable and the NDVIm and the NDVIsd as the independent variables. Both independent variables were statistically significant for explaining the SOC variation at 20 cm depth (R2 = 0.86, NDVIm value of p < 0.0001, NDVIsd value of p < 0.05), but the NDVIm explained 88% of the observed SOC variation while the NDVIsd accounted for the remaining 12%. Thus, we changed the ESSI calculation which was originally calculated as ESSI = NDVIm − NDVIsd (Paruelo et al., 2016; Staiano et al., 2021) to a calculation that considers the relative weights of the ESSI components for estimating SOC: ESSI = NDVIm * 0.88 − NDVIsd * 0.12, and used this equation for the SOC-ESSI calibration.
From the SOC-ESSI calibration, we generated estimates of the Equilibrium SOC (EqSOC) at the Sentinel 2-pixel level (10 m) for the area that included the plots with SOC data (2 × 4.6 km) for the 2017–2022 period. EqSOC does not strictly represent the current C stocks, but an estimate of the long term (approximately 50 years) value of a particular pixel given the average C dynamics captured by the ESSI. It has been demonstrated that after of 40 years the SOC reaches the equilibrium, with interannual changes of less than 1% (Villarino et al., 2017). Thus, to obtain an estimate of EqSOC that considers the changes in the carbon input dynamics over the last decades and for the whole study area (Uruguay), we performed a calibration between the ESSI calculated from the Sentinel data and the ESSI calculated from MODIS satellite images (available from 2000 to the present) to estimate EqSOC for the period 2000–2022. We calculated the ESSI from MODIS using the MOD13Q1 product (250 m of spatial resolution and 16 day of revisit time) where pixels affected by clouds, cirrus and shadows were masked with the quality band available in this product. The procedure was the same as for the Sentinel data, where the NDVIm and NDVIsd values were scaled and then weighted by 0.88 and 0.12, respectively for the ESSI calculation. We then performed a linear regression analysis between the mean ESSI from Sentinel 2 and the mean ESSI from MODIS for the period 2017–2022, by averaging the ESSI values from Sentinel pixels inside each MODIS pixel present in the Sentinel image subset. This analysis resulted in a significant relationship (value of p < 0.0001, R2 = 0.77, see Supplementary Figure 2). Finally, we obtained the EqSOC at the MODIS scale for Uruguay for the 2000–2022 period by applying the regression parameters of the ESSI Sentinel-ESSI MODIS relationship and the SOC-ESSI calibration to the ESSI values estimated with MODIS data. We considered only pixels with crops and grassland, discarding pixels with native forests, tree plantations, water or urban infrastructure applying a mask derived from Baeza and Paruelo (2020).
2.4. SOC maps and data analysis
The EqSOC was compared with the three reference values: the potential SOC capacity derived from Feng et al. (2013), the SOC derived from the DayCent simulations, and the 95th percentile (p95) values of EqSOC for each soil polygon. This comparison was performed by considering all the EqSOC values of each soil polygon and calculating the 50th percentile (p50). The resulting values were corrected considering the clay + silt content of each soil polygon given the relationship between SOC and the clay + silt content derived from DayCent model simulations (see section 2.2.2). To compare the EqSOC and the potential SOC, the EqSOC values had to be converted into the SOC fraction captured in the fine soil portion (clay and fine silt) which is the fraction obtained by the model from Feng et al. (2013). Thus, we multiplied the EqSOC values estimated from each soil polygon by 0.75, which is a coefficient derived from averaging the conversion coefficients obtained through a meta-analysis by Gregorich et al. (2006) and Wiesmeier et al. (2014) for obtaining SOC in the fine soil fraction for cropland and grassland soils (Alvarez and Berhongaray, 2021).
The data analysis was conducted for each soil polygon (n = 321 soil polygons on the 1:1,000,000 soil map) for which we estimated absolute and relative differences between current EqSOC and the three reference SOC values: (a) Potential SOC capacity, (b) SOC simulated with the DayCent model, and (c) the 95th percentile of EqSOC derived from the ESSI-SOC calibration. The relative differences were calculated as: Rel. Diff = (EqSOC − Reference SOC) × 100/Reference SOC. We also calculated the proportion of area with annual crops in each soil polygon by using the MapBiomas land cover map (Vallejos et al., 2021; Baeza et al., 2022) for the year 2018 to explore the possible relation between SOC differences and the expansion of crop production. On the other hand, we obtained the proportion of MODIS pixels that had negative, positive and no trends in the ESSI during the 2000–2022 period in each soil polygon. The sign of the trend reflected the changes in C inputs throughout the period. The ESSI trends were calculated performing a linear regression of the annual ESSI values as the dependent variable and the years between 2000 and 2022 as the independent variable and considering a significance level of 5% for defining significant temporal trends.
We plotted the current EqSOC values against each estimator of the reference SOC for all soil polygons as shown by Walker et al. (2022) (Figure 1) establishing three thresholds corresponding to 25%, 50%, and >50% of the difference between current EqSOC and references SOC. We also mapped these differences at the soil polygon level for the whole study area.
3. Results
3.1. SOC-ESSI calibration
The ESSI calculated from the annual mean and standard deviation of the NDVI derived from Sentinel data captured a high proportion of the spatial variability in observed SOC stocks (R2 = 0.86, Figure 2). The generalization over the whole country, based on MODIS data, generated a median value of 48.2 Mg C/ha. The 95th (EqSOC p95) and 50th (EqSOC) percentiles are displayed in Figure 3.
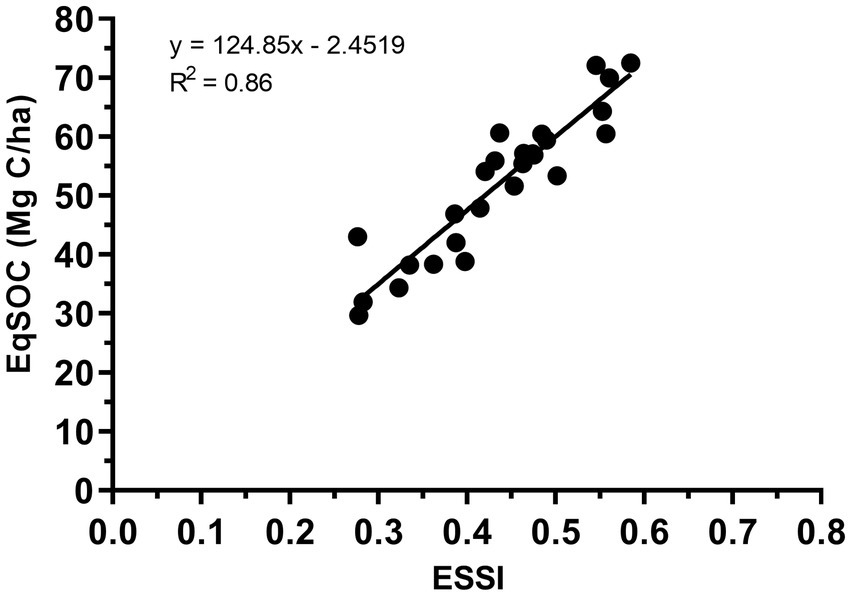
Figure 2. Linear regression between carbon stock (EqSOC, in Mg C/ha) and the average Ecosystem Services Supply Index (ESSI) value between 2017 and 2022 estimated from information obtained from Sentinel satellites. The SOC stock values were obtained from a long-term agricultural experiment established in 1963 and still operational (Baethgen et al., 2021).
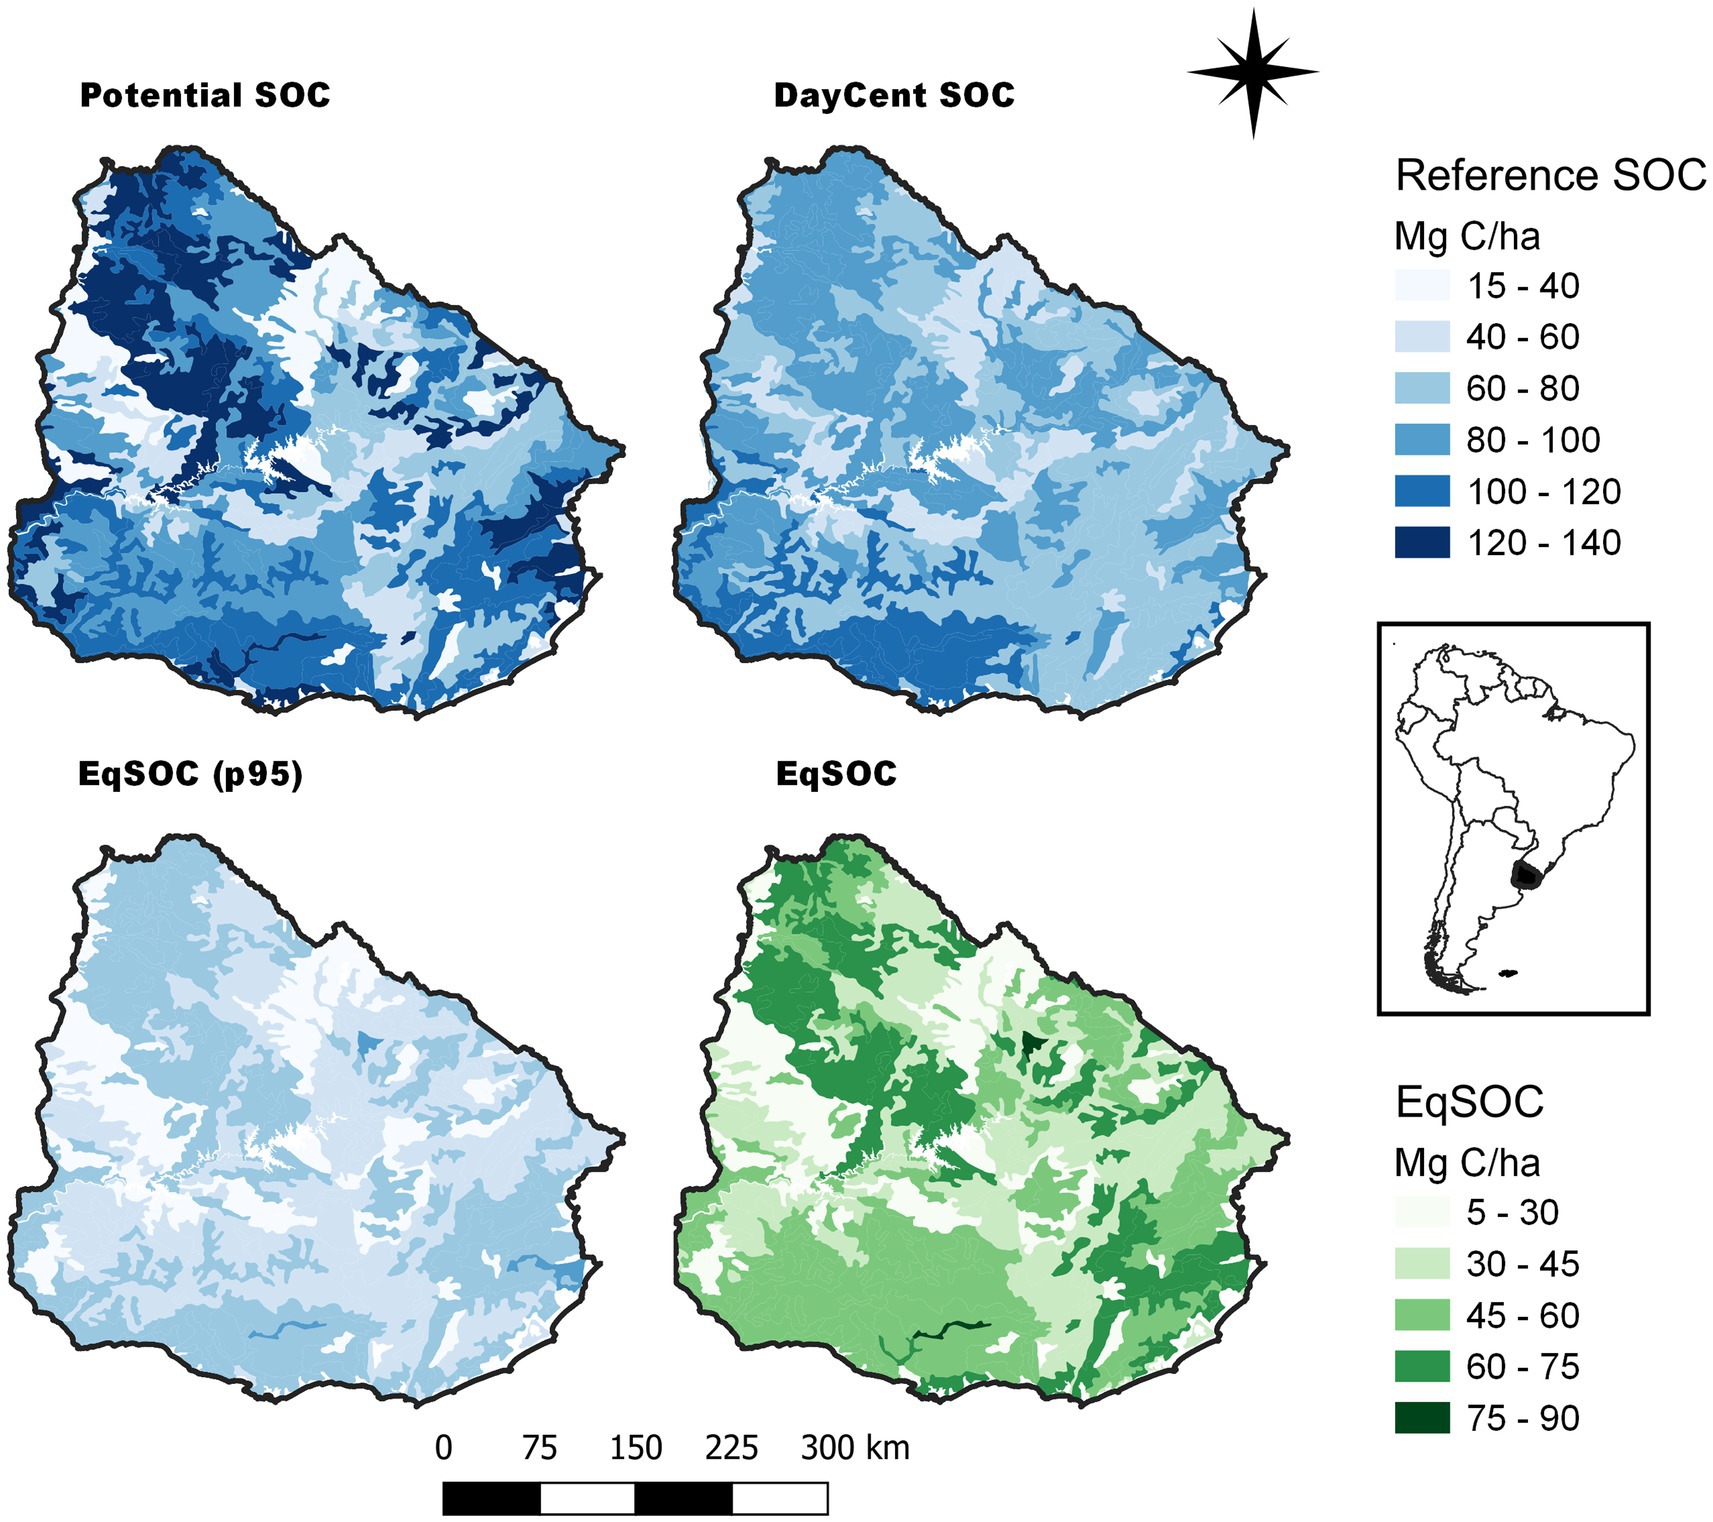
Figure 3. Maps of reference SOC stocks of each soil polygon obtained using three methods: Feng et al. (2013), DayCent model (Del Grosso et al., 2001), and from the 95th percentile (p95) of EqSOC from the ESSI-SOC calibration (EqSOC p95). The EqSOC was estimated from the ESSI (Ecosystem Services Supply Index, Paruelo et al., 2016) and represents the equilibrium SOC under current management practices (i.e., in the last 20 years). The estimation of the current SOC corresponds to the 50th percentile (p50) of EqSOC of all the pixels inside each soil polygon. Only situations with crops and grassland were considered, discarding areas with native forests, tree plantations, water or urban infrastructure through applying a mask derived from Baeza and Paruelo (2020).
3.2. Reference SOC stocks
As expected, the highest reference SOC stocks were those derived from Feng et al. (2013) (Figure 3; Table 1). SOC values for the first 20 cm ranged from 33 to 130 Mg C/ha (p1 and p99). This approach considered exclusively the capacity of the fine fraction of soils to hold C compounds, as opposed to the balance of inputs and outputs and the effect of climate and C in the vegetation (i.e., C/N ratio or lignin content) on C stabilization. The C stocks derived from DayCent simulations represent a pre-European settlement condition and considered a grazing pressure expected from wild herbivore populations (Pineiro et al., 2006). The median values for the study area were 18% lower than the estimates of potential SOC capacity (Figure 3; Table 1). The differences between DayCent simulations and potential SOC capacity from Feng et al. (2013) represent the C deficit from the potential vegetation of the Open Ecosystems that once dominated the area (in average 18.5 Mg C/ha for the first 20 cm of the soil), a measure of the potential sequestration. The SOC DayCent simulations, however, presented higher values for the 1st percentile than the potential SOC capacity estimates. This may be because the lowest potential SOC capacity values (Feng et al., 2013) are found in sandy soils (i.e., low content of clay + silt), which in NE Uruguay are deep and can sustain relatively high production of native pastures (Figure 3). Contrary, SOC DayCent simulations presented lower values than potential SOC capacity estimates and higher discrepancies were found in NW Uruguayan soils (Figure 3). This may be due to two characteristics of these soils: they present high clay content that results in high estimated of potential SOC capacity, and low soil depth (i.e., 20 cm and sometimes less). The low depth determines that DayCent simulates low pasture production, due to the low total available water for plants. Hence, the C stock predicted by potential SOC capacity driven only by soil texture, was higher than the value predicted by DayCent simulations that considers low C input due to low soil depth. The last reference map corresponds to the SOC stocks of the top 5% of EqSOC (p95) values of the MODIS pixels included in each soil polygon (Figure 3; Table 1). The median values of the EqSOC p95 were on average 42% and 29% (42.4 and 23.9 Mg C/ha, respectively) lower than the references generated from potential SOC capacity and DayCent simulations, respectively.
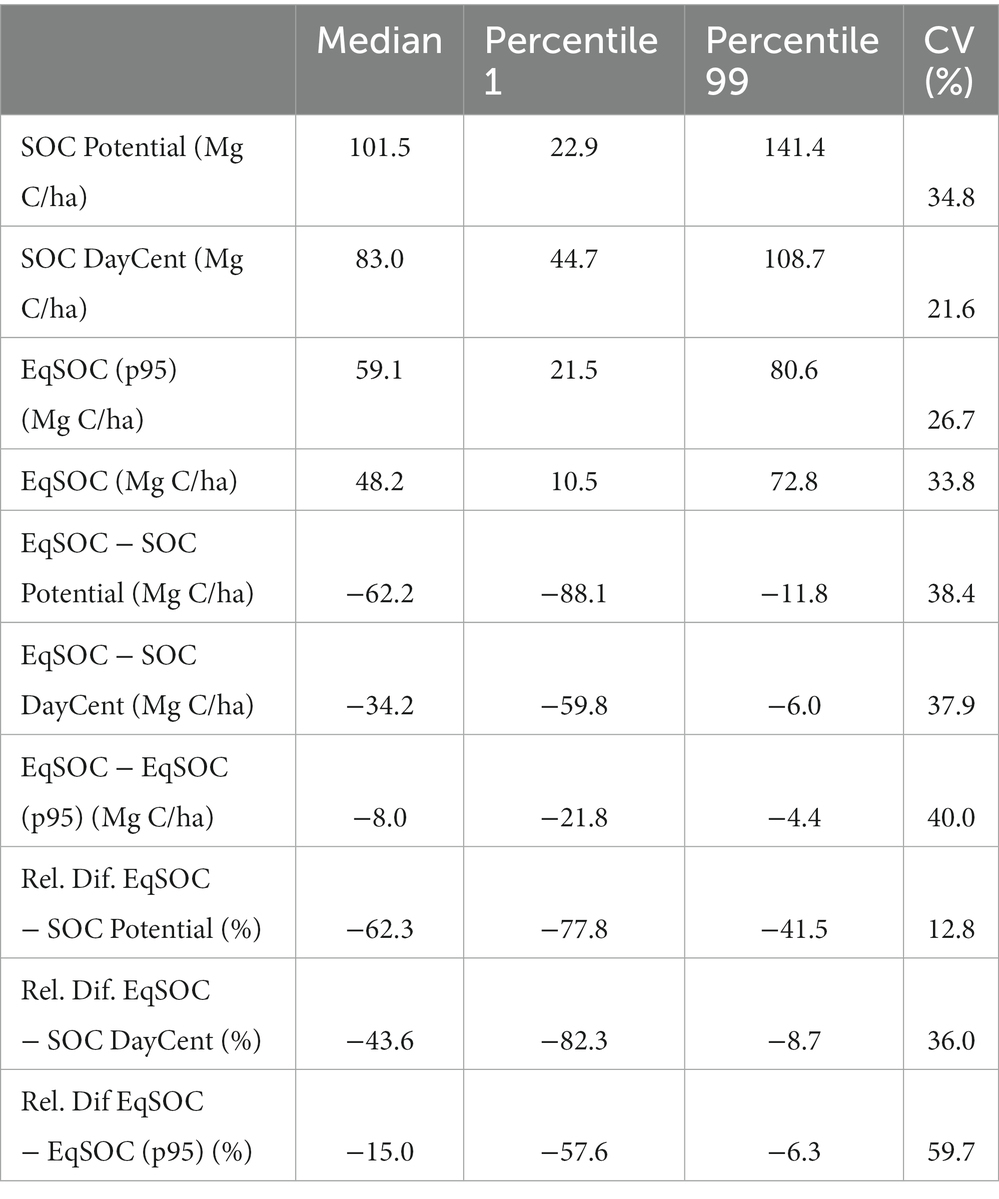
Table 1. Summary values corresponding to the median, p1, p99 and coefficient of variation for the current SOC (EqSOC), the three alternatives to define the reference SOC: potential, DayCent, and EqSOC p95, and the absolute and relative differences between them.
Though the magnitude of the differences between the median EqSOC of each soil polygon and the reference values varied in magnitude (Table 1) the spatial patterns were similar (Figure 4). The highest differences were observed for the polygons dominated by sandy soils, mainly in the NE and W regions of the country.
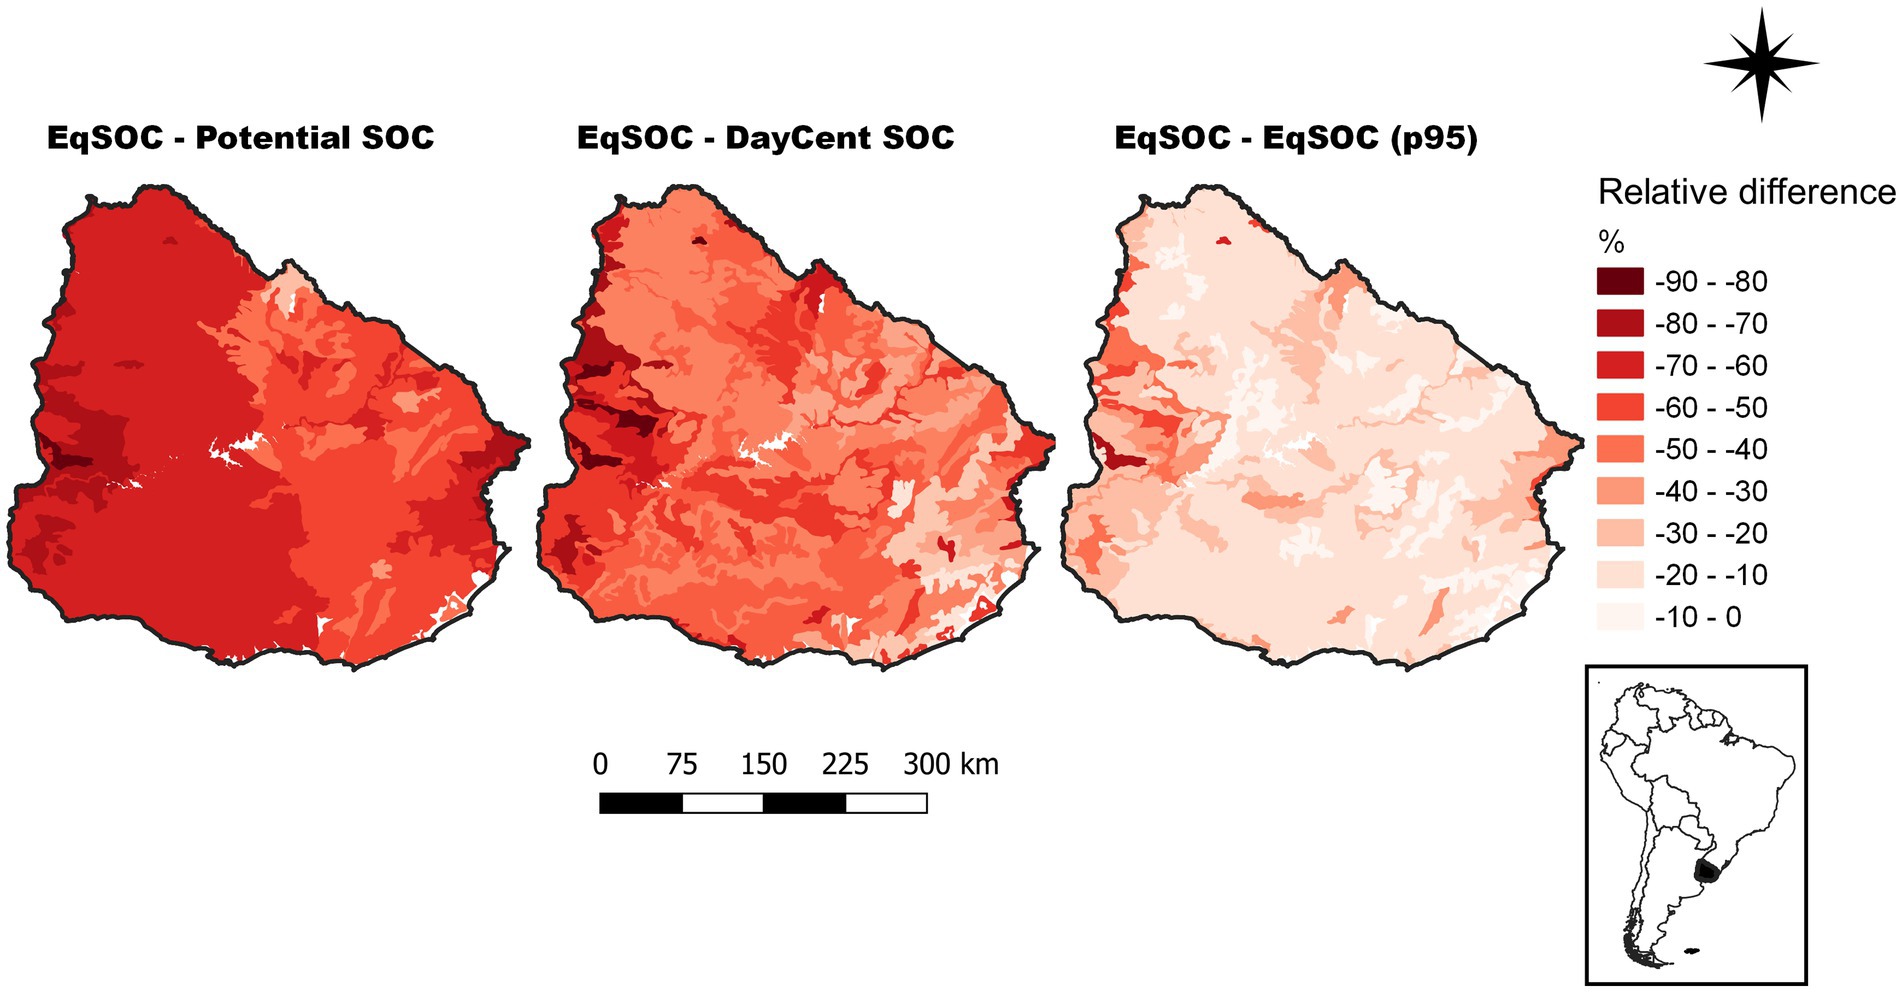
Figure 4. Relative differences between current EqSOC and the three approaches used to estimate reference SOC: (a) Potential SOC capacity, (b) SOC from the DayCent model, and (c) the 95th percentile of EqSOC from the ESSI-SOC calibration. The relative differences were calculated as: Rel. Diff = (EqSOC − Reference SOC) × 100/Reference SOC.
The soil polygons showed a different relationship between the references and the current SOC values (Figure 5), and also different distribution within the zones defined by the thresholds in Figure 1. The median EqSOC was mostly distributed in the yellow (8%) and red (92%) zones when the potential SOC is used as reference (Figures 5, 6). The opposite pattern resulted from using the EqSOC p95 as reference: in this case, most of the polygons (76%) were located in the green zone (less than 75% of the reference value; Figures 5, 6). The comparison of median EqSOC with SOC derived from DayCent simulations showed a wider distribution of the polygons in the space of reference-current SOC and a more even distribution of the soil polygons within the three zones (Figures 5, 6).
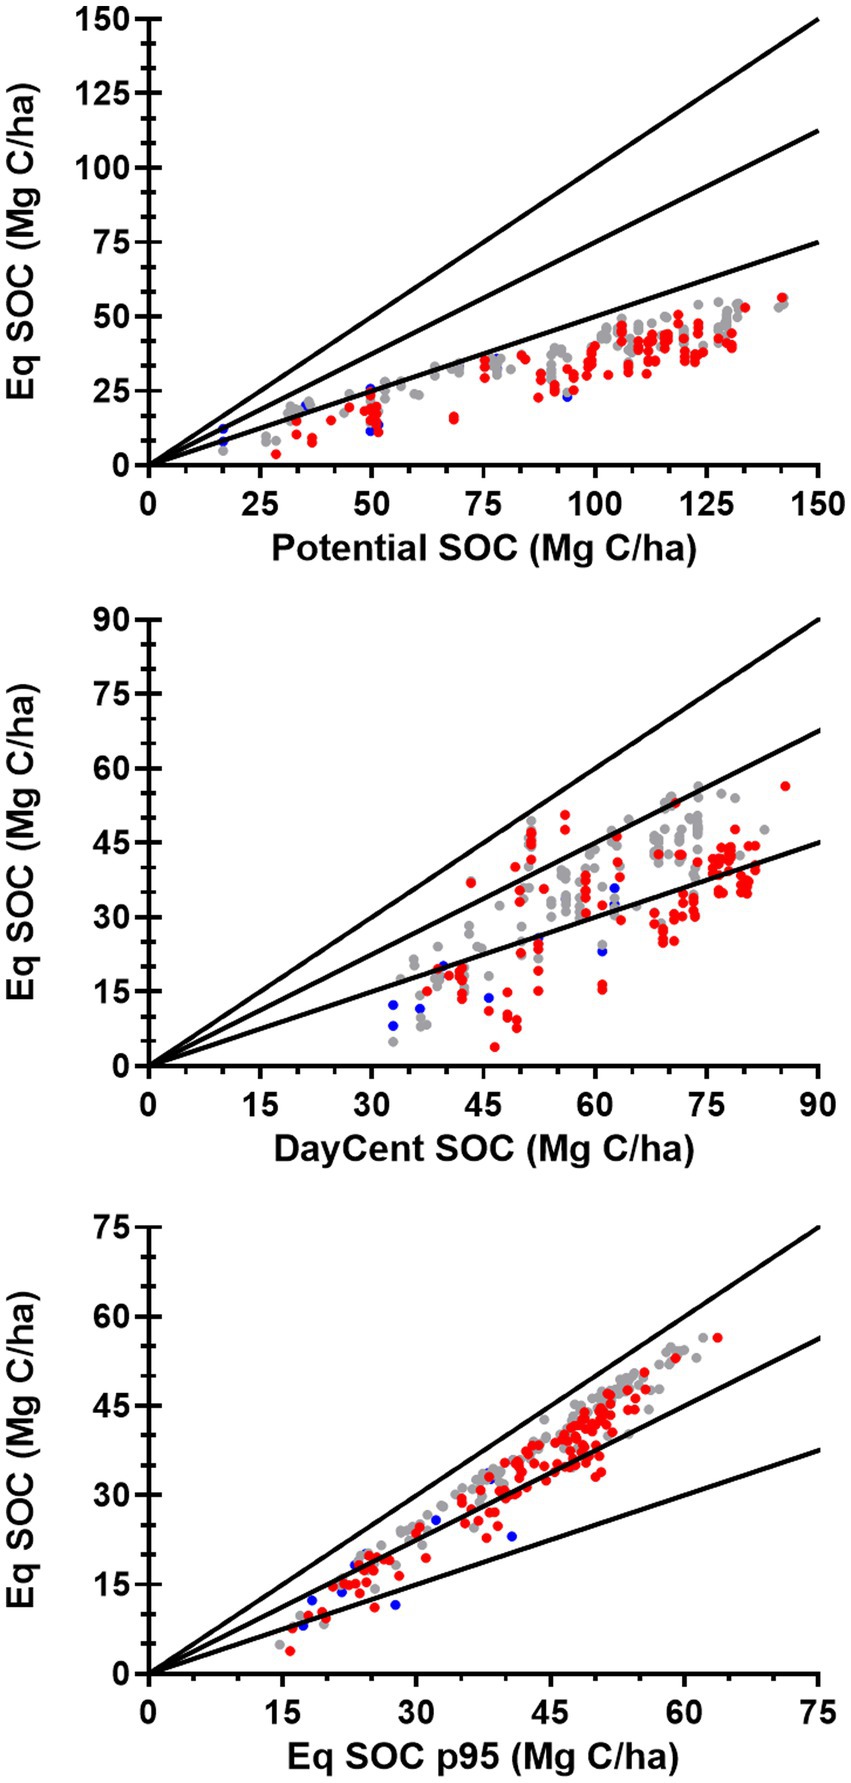
Figure 5. EqSOC for three methods to estimate the reference SOC stocks: potential SOC, DayCent SOC and EqSOC p95. We defined three areas delimited by threshold values CORRESPONDING to 25% (upper), 50% (middle) and <50% (lower) of difference between current EqSOC and reference SOC. Each point corresponds to a soil polygon and the colors represent situations in which significant negative trends of the ESSI predominate (red), significant positive trends predominate (blue), and where both negative and positive trends are balanced (gray).
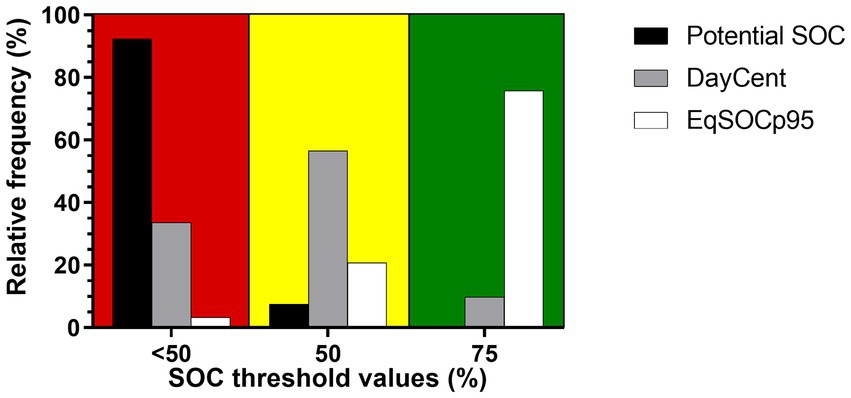
Figure 6. Relative frequency (%) of soil polygons located in each category defined by threshold values corresponding to 25%, 50%, and >50% of difference between current EqSOC and the three approaches to define the reference SOC: potential, DayCent, and EqSOC p95.
3.3. Current SOC stocks
The EqSOC calculated from ESSI over a 20-year period allowed to identify temporal trends in the index and on the equilibrium SOC expected for an individual pixel. The colors of the dots in Figure 5 display EqSOC values for each soil polygon and indicate the polygons where negative trends (SOC losses) were dominant (red), polygons dominated by positive trends (SOC gains; blue dots) and polygons where trends were negligible (gray dots). Using DayCent SOC values as reference (Figure 5), in 53% of the polygons the neutral trends were dominant, indicating the temporal preservation of SOC stocks, while in 41% of the soil polygons the trends were mostly negative. Also, 65% of the soil polygons that fell under the line corresponding to 50% of the reference DayCent SOC, had predominantly negative trends (red dots, Figure 5).
The proportion of area with annual crops in the soil polygon explained 31% of the variability observed in the difference between EqSOC and the reference DayCent SOC (Figure 7). An increase of 1% in the area with annual crops was associated with an average reduction of 0.283 Mg of C in the first 20 cm in the soil polygon. Interestingly, the regression intercept was negative (−25.42 Mg C/ha) reflecting lower SOC values compared to the reference situation, even in areas with no crops. This may be due to losses of SOC due to grazing management in the past in areas with no crops, and/or to overestimation of the reference SOC estimated with the DayCent model. The quantile regressions (p5 and p95) showed similar slopes (0.21 and 0.25, respectively) evidencing the expected loss in SOC due to converting grasslands into croplands. However, the regression intercepts showed a wide range of almost 38 Mg C/ha (3.47 in p5 and 41.46 in p95) reflecting a substantial variability within the same range of conversion of grasslands to croplands.
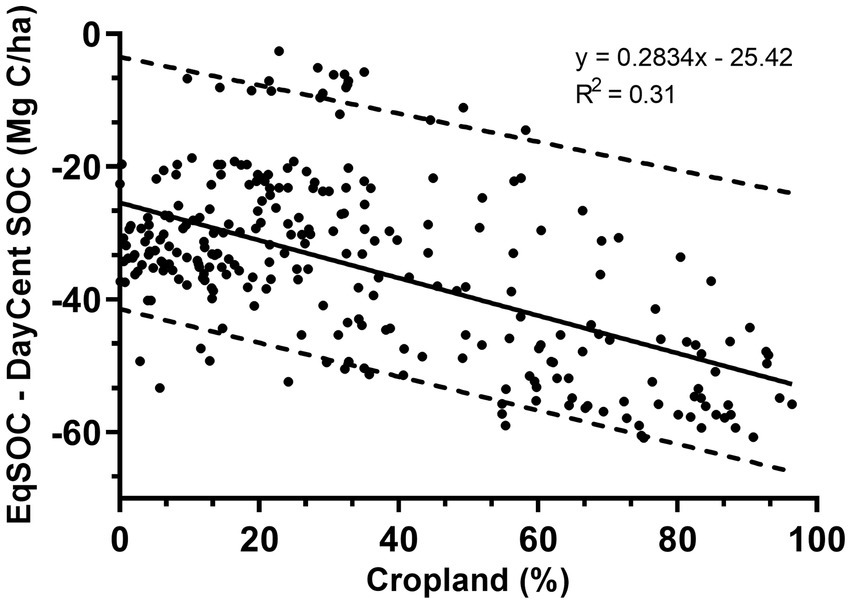
Figure 7. Difference between current EqSOC and the reference SOC estimated from DayCent model (in Mg C/ha) for each soil polygon along a gradient of relative cropland frequency (%) based on MapBiomas land cover map (Vallejos et al., 2021; Baeza et al., 2022) for the year 2018.
4. Discussion
4.1. Patterns of reference and current C stocks
The assessment of C stock preserved belowground is a critical component of the C footprint of a given system. An exclusive focus on increasing sequestration minimizes the importance of management actions that preserve SOC and avoid net CO2 emissions to the atmosphere, such as natural habitat preservation, adequate grazing management, well managed crop-pasture rotation, among others. Moreover, those systems that maintained C stocks similar to the reference values (C stocks preservation, CSP) level may have biophysical limitations to further increase C stocks due to saturation (Schlesinger, 1990; Hassink and Whitmore, 1997; Pravia et al., 2019; Rodrigues et al., 2022), i.e., their C accumulation potential (CAP) may be low. The C stock preserved (CSP) belowground and the potential for increasing C sequestration (CAP) indicate the status of a given land unit with respect to the difference between its current carbon content (EqSOC) and the reference SOC. Thus, certain land units could maintain their C stocks similar to the reference values (C stocks preservation, CSP) while others could show a C accumulation potential (CAP) if present smaller values than the reference SOC. Three critical issues that require scientific and political consensus to implement the use of the CSP criteria are: (1) how to define maximum or potential C stocks, (2) how to estimate current C stocks over large areas and in heterogeneous agricultural landscapes, and (3) what is a reasonable/acceptable level of reduction (e.g., in Figures 1, 5 a threshold of 25% were used). Defining and establishing the reference values and thresholds will contribute to differentiate those land units that should preserve SOC stocks from those that should and have the potential capacity to capture and store C to contribute to transitioning to net zero C emission.
In this article we used three alternatives to generate potential SOC stocks. Other models, either mechanistic [e.g., RothC, Socrates, Struc-C (Stockmann et al., 2013), Cycles (Kemanian et al., 2022) or empirically based (i.e., Sanderman et al., 2018)], can be used. Of course, the selection of the reference situation would determine the magnitude of the C deficit. Alvarez and Berhongaray (2021) used estimates of C capacity (both global and locally calibrated model) to estimate the C saturation deficit of the Argentine Pampa soils. They estimated an average C saturation deficit for the first 25 cm close to 70 Mg/ha, quite similar to the 62.3 value found for the first 20 cm in our study. Among the three alternatives used to estimate reference C stocks in our study, the strategy of using a mechanistic agroecosystem model such as DayCent simulations presented some advantages. First, even though DayCent does not explicitly consider a maximum value in SOC accumulation, it considers the capacity of the fine fraction of the soil to hold C, as well as the dynamics of C inputs and losses based on climate, vegetation and management drivers. In doing so it generates more realistic C scenarios than Feng et al. (2013). Secondly, it is a dynamic reference situation because the potential vegetation simulated and/or the management practices (i.e., grazing and fire) can be manipulated to simulate different situations. Third, it minimized some circularity associated with using the observed highest values (the 95th percentile) as a reference, as in the case of EqSOC p95.
The estimation of current SOC stocks can be based on different approaches. Field data based on a sampling protocol at the plot/paddock level is, clearly, the option that provides the highest precision. However, it may not be feasible to generate a nation-wide coverage due to costs and logistics. DayCent (or Century) proved to be an excellent alternative to simulate C stocks dynamics under different agricultural management systems of Uruguay (Pineiro et al., 2006; Baethgen et al., 2021). A proper characterization of the management history allows tracking changes in C stocks at the paddock level. Even though the precision of the SOC estimation of a given paddock depends on knowing the initial C stocks, simulations can track the trend of changes and provide a reliable estimation of the expected differences between paddocks under different management. A relatively large proportion of the information required to perform such simulations can be derived from secondary data (soil maps, climate databases) and land cover maps, such as those provided by the MapBiomas Pampa project (Vallejos et al., 2021; Baeza et al., 2022).
In this article we used a third approach to characterize current SOC stocks. We calibrated the relationship between an index associated to ecosystem services supply (ESSI) using current SOC data from a long-term experiment and native grasslands relicts. The ESSI captures differences in C inputs over an agricultural rotational period, through the estimation of annual C gains and its seasonality, thus being a good indicator of C inputs and, therefore, of SOC stocks. The index increases as the growing season integral of the NDVI augments (higher NDVI mean) and decreases as the system becomes more seasonal (higher NDVI standard deviation). The spatially explicit integration of this index over time allows capturing the spatial and temporal changes in SOC stocks. The local calibration carried out for the same soil and climate was generalized over the whole country using a correction based on the soil clay + silt content. Though using a different approach, estimations based on the NDVI dynamics considered (as DayCent) the effect of both, the soil texture (to account for C capacity) and C inputs in determining SOC stocks. As in the case of DayCent, SOC estimates based on ESSI (EqSOC) may not predict with accuracy absolute values but do provide a description of the equilibrium C stocks expected under a given land-use management. Also, this approach allows covering wide areas of territory, having spatially continuous information and detailed spatial resolution. Although other datasets could be used to characterize the current SOC (e.g., SoilGrids—Hengl et al., 2017, OpenLandMap—Hengl and Wheeler, 2018, GSOCmap—FAO, 2022), the EqSOC offers the advantage of not needing the interpolation of point data and, given that it is based on information derived from satellite-based remote sensing, it is easily updatable in the future.
As expected, the magnitude of SOC changes observed for the different soil polygons was related to the relative frequency of annual crops (Figure 7). In a review of long-term experiments, Powlson et al. (2022) found that in most cases SOC values under arable cropping were in the range 38–67% of pre-clearance values. The variability explained in our study (Figure 7) was only 31% and the range of C losses for intermediate levels of conversion of grasslands to croplands was ample. Several factors may account for the non-explained variability. The design of the agricultural system would certainly play a key role. This suggests that areas that were never used for annual crops can lose SOC due to poorly managed grazing strategies, and that areas used for crop production may be managed in such a way that maintain SOC stocks. The long-term experiment and model simulations showed that the length of the pasture phase of a pasture-annual crop rotation, the level of fertilization, the use of service crops and the use of no-till may explain the differences in C losses observed. Baethgen et al. (2021) showed for crop-pasture rotations that different management may result in differences greater than 30 Mg/ha after 60 years, which is similar to the range of variation observed in this work (Figure 7).
Despite their usefulness, the approaches outlined to characterize reference and current C stocks have shortcomings. Some of the limitations are intrinsic (it is impossible to know the C content that a soil had 100 years ago) and others are operational, although they can be reduced through a proper calibration and evaluation of the methodological approaches. Clearly, expanding geographically the calibration and independent empirical evaluation of DayCent, EqSOC and/or other models is a critical issue in a research agenda aimed to better define the C footprint of a given land unit (i.e., a paddock, a farm, an administrative unit, an agroecological region, or the whole country).
4.2. A road map to define a comprehensive C footprint of Uruguayan agricultural systems
A comprehensive definition of the C footprint of a given land unit should include at least the following elements (Figure 8):
• The magnitude of the C stock preserved with respect to the reference situation (C stocks preservation, CSP).
• The potential for increasing C sequestration based on C losses (Reference SOC-Current SOC), i.e., the C accumulation potential (CAP).
• The past trend of C sequestration from the temporal trends of EqSOC (Past Trends, PT).
• A C sequestration management plan based on the projected EqSOC under a proposed land use/land cover scenario (Future Scenarios, FS).
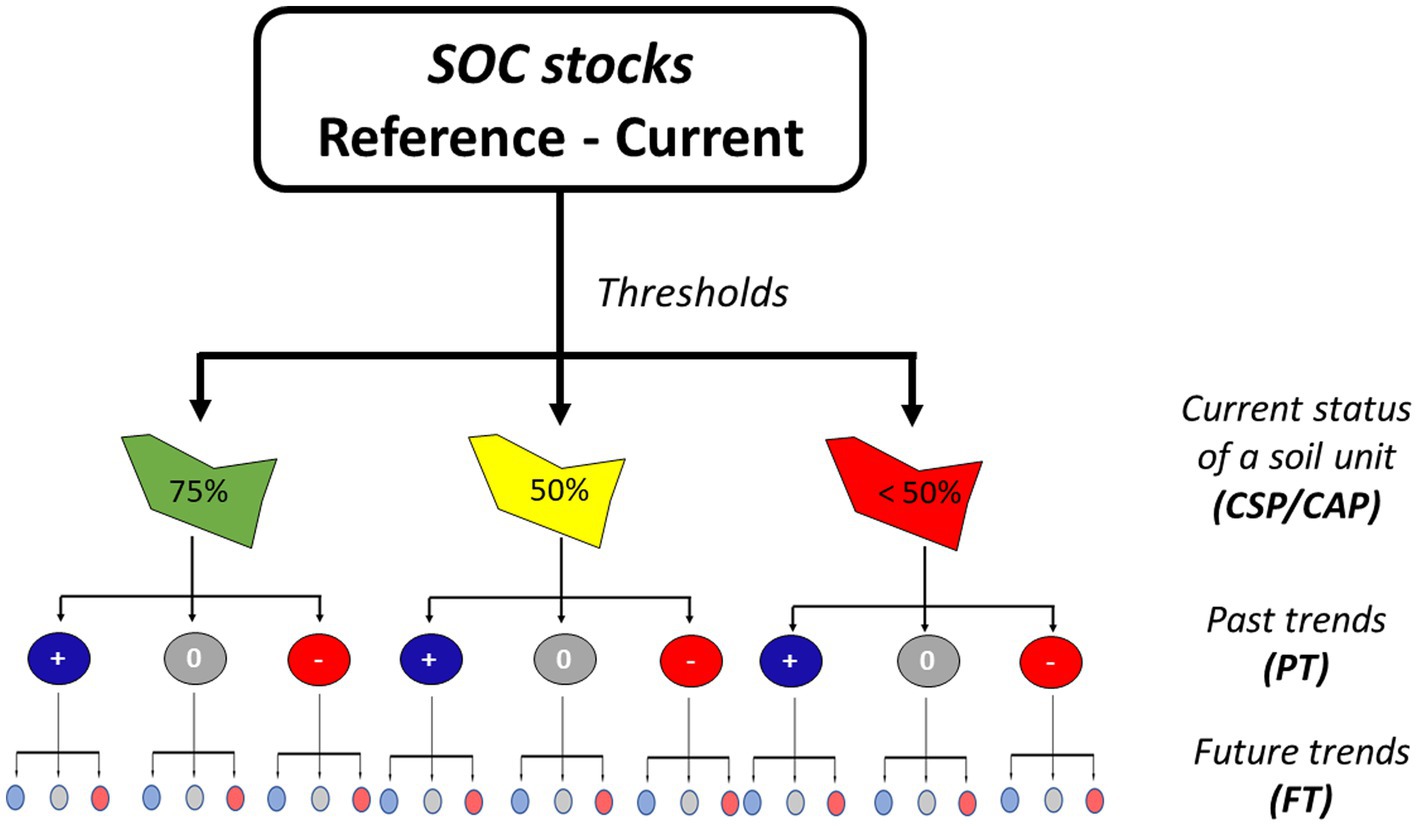
Figure 8. Methodological road map proposed to derive C footprint of a given land unit combining both biogeochemical models and conceptual models based on remotely sensed data. For this, some criteria should be considered to define C footprint and these include the magnitude of the C stock preserved with respect to the reference situation (C stocks preservation, CSP), the potential for increasing C sequestration based on C deficit [Reference SOC-Current SOC, the C accumulation potential (CAP)], the past trend of C sequestration from the temporal trends of EqSOC in the last few decades (Past Trends, PT) and a C sequestration/C preservation management plan based on the project EqSOC under a proposed land use/land cover scenario (Future Scenarios, FS).
In addition to being scientifically sound, the models and approaches used in integrative evaluations of C footprint require robust local calibration and evaluation. Moreover, they need to be accepted beyond the scientific community as a reference. The potential C sequestration (CAP) or the C saturation deficit is defined by the difference between reference and current C stocks. Here again, establishing a methodology to characterize both stocks become a technical-political definition. In this article we used three approaches to estimate reference SOC stocks (i.e., potential SOC or SOC capacity, DayCent simulations and ESSIp95), and we calculated their differences respect to current SOC (EqSOC). These differences indicate the carbon saturation deficit or the C accumulation potential (CAP) and represent the capacity of a given land unit to C sequestration. The magnitude of the C deficit will depend on the selected reference situation (i.e., potential SOC, DayCent or ESSIp95). Often the selection of a technical approach involves a tradeoff between simplicity and precision. Defining tiers (e.g., IPCC, 2006) proved to be a useful approach to move forward in evaluating environmental issues.
An objective characterization of the SOC trends (PT) in the last few years (e.g., in the last decade) can be used to assess the effect of management practices on the C footprint. By using an index (ESSI) based on remote sensing data (MODIS in our study) it was possible to track changes on C inputs to the soil stocks over periods that are longer than the most frequent agriculture rotational plans. Thus, the analysis of trends allows assessing to what extent the different land units are meeting the goals of preserving or capturing C, which can be used for monitoring and studying the degree of progress toward the proposed goals. Trends can be also derived (next Tier) from simulations and field data.
The expected trend in SOC sequestration on any land unit can be projected based on the expected changes in land use/land cover and/or in agricultural management practices. Thus, indicators of SOC sequestration (e.g., based on ESSI, and/or on calibrated simulation models) can be used to assign values of expected changes in SOC stocks to the planned sequences of land uses/land covers and/or to different agricultural management practices (Campbell and Paustian, 2015).
5. Final remarks
The use of indicators derived from locally calibrated and evaluated models is a practical approach to generate country-wide or regional assessments of the environmental performance of agricultural systems. A successful case of adapting models to generate indicators into a soil conservation policy is Uruguay’s Law of Soil and Water Conservation for Agricultural Purposes (Law N° 15.239). In this case a locally calibrated version of the Universal Soil Loss Equation (USLE-RUSLE; Wischmeier and Smith, 1978; Renard, 1997; Garcıa Préchac et al., 2004, 2005) was used to generate and evaluate soil management plans. Building trust on the models among the different stakeholders is not a simple task. In the case of Law N° 15.239 the process took more than 5 years (Zurbriggen et al., 2020; Freeman et al., 2021). Implementing an operational method for characterizing changes in SOC to inform public policy requires: building capacity, generating consensus, defining the implementation authority, and providing the elements (protocols and data) to audit the system. It may also require implementing a successful pilot experience. A critical point is the need to establish basic agreements at the policy-making level to define the evaluation of the environmental performance of the agricultural sector. A clear communication of the benefits for the society of keeping track of the environmental footprint (including the C footprint) in terms of welfare, food safety, access to markets, etc., would be essential.
Data availability statement
The original contributions presented in the study are included in the article/Supplementary material, further inquiries can be directed to the corresponding author.
Author contributions
PB, WB, GC, AQ, VP, JT, IM, GP, and JP: conception and design of study and revising the manuscript critically for important intellectual content. PB, WB, GC, and JP: analysis and/or interpretation of data and drafting the manuscript. All authors contributed to the article and approved the submitted version.
Funding
This research was supported by agrant from ANII-CONICETIA_2021_4_04.
Conflict of interest
The authors declare that the research was conducted in the absence of any commercial or financial relationships that could be construed as a potential conflict of interest.
Publisher’s note
All claims expressed in this article are solely those of the authors and do not necessarily represent those of their affiliated organizations, or those of the publisher, the editors and the reviewers. Any product that may be evaluated in this article, or claim that may be made by its manufacturer, is not guaranteed or endorsed by the publisher.
Supplementary material
The Supplementary material for this article can be found online at: https://www.frontiersin.org/articles/10.3389/fsufs.2023.1045734/full#supplementary-material
Footnotes
References
Abramoff, R., Xu, X., Hartman, M., O’Brien, S., Feng, W., Davidson, E., et al. (2018). The millennial model: in search of measurable pools and transformations for modeling soil carbon in the new century. Biogeochemistry 137, 51–71. doi: 10.1007/s10533-017-0409-7
Altamirano, A., da Silva, H., Duran, A., Echevarría, A., Panario, D., and Puentes, R. (1976). Carta de Reconocimiento de Suelos del Uruguay. Tomo I. Clasificación de Suelos Dirección de Suelos y Fertilizantes, Ministerio de Agricultura y Pesca, Montevideo, 96.
Álvarez, R. (2001). Estimation of carbon losses by cultivation from soils of the argentine Pampa using the century model. Soil Use Manage. 17, 62–66. doi: 10.1111/j.1475-2743.2001.tb00010.x
Alvarez, R., and Berhongaray, G. (2021). Soil organic carbon sequestration potential of Pampean soils: comparing methods and estimation for surface and deep layers. Soil Res 59, 346–358. doi: 10.1071/SR20257
Baethgen, W. E., Parton, W. J., Rubio, V., Kelly, R. H., and Lutz, M. (2021). Ecosystem dynamics of crop–pasture rotations in a fifty-year field experiment in southern South America: century model and field results. Soil Sci. Soc. Am. J. 85, 423–437. doi: 10.1002/saj2.20204
Baeza, S., Baldassini, P., Bagnato, C., Pinto, P., and Paruelo, J. (2014). Caracterización del uso/cobertura del suelo en Uruguay a partir de series temporales de imágenes MODIS. Agrociencia 18, 95–105. doi: 10.31285/AGRO.18.470
Baeza, S., and Paruelo, J. M. (2020). Land use/land cover change (2000–2014) in the Rio de la Plata grasslands: an analysis based on MODIS NDVI time series. Remote Sens. (Basel) 12:381. doi: 10.3390/rs12030381
Baeza, S., Vélez-Martin, E., De Abelleyra, D., Banchero, S., Gallego, F., Schirmbeck, J., et al. (2022). Two decades of land cover mapping in the Río de la Plata grassland region: The MapBiomas Pampa initiative. Remote Sens Applicat Soc Environ 28:100834. doi: 10.1016/j.rsase.2022.100834
Baldassini, P., and Paruelo, J. M. (2020). Deforestation and current management practices reduce soil organic carbon in the semi-arid Chaco, Argentina. Agr. Syst. 178:102749. doi: 10.1016/j.agsy.2019.102749
Baldocchi, D., and Penuelas, J. (2019). The physics and ecology of mining carbon dioxide from the atmosphere by ecosystems. Glob. Chang. Biol. 25, 1191–1197. doi: 10.1111/gcb.14559
Bastin, J. F., Finegold, Y., Garcia, C., Mollicone, D., Rezende, M., Routh, D., et al. (2019). The global tree restoration potential. Science 365, 76–79. doi: 10.1126/science.aax0848
Berhongaray, G., and Alvarez, R. (2013). The IPCC tool for predicting soil organic carbon changes evaluated for the pampas, Argentina. Agric. Ecosyst. Environ. 181, 241–245. doi: 10.1016/j.agee.2013.10.002
Bolinder, M. A., Janzen, H. H., Gregorich, E. G., Angers, D. A., and VandenBygaart, A. J. (2007). An approach for estimating net primary productivity and annual carbon inputs to soil for common agricultural crops in Canada. Agric. Ecosyst. Environ. 118, 29–42. doi: 10.1016/j.agee.2006.05.013
Bond, W. J. (2019). Open ecosystems: ecology and evolution beyond the forest edge Oxford University Press.
Campbell, E. E., and Paustian, K. (2015). Current developments in soil organic matter modeling and the expansion of model applications: a review. Environ. Res. Lett. 10:123004. doi: 10.1088/1748-9326/10/12/123004
Caride, C., Piñeiro, G., and Paruelo, J. M. (2012). How does agricultural management modify ecosystem services in the argentine pampas? The effects on soil C dynamics. Agric. Ecosyst. Environ. 154, 23–33. doi: 10.1016/j.agee.2011.05.031
Chabbi, A., Lehmann, J., Ciais, P., Loescher, H. W., Cotrufo, M. F., Don, A., et al. (2017). Aligning agriculture and climate policy. Nat. Clim. Chang. 7, 307–309. doi: 10.1038/nclimate3286
Chung, H., Grove, J. H., and Six, J. (2008). Indications for soil carbon saturation in a temperate agroecosystem. Soil Sci. Soc. Am. J. 72, 1132–1139. doi: 10.2136/sssaj2007.0265
Clark, M. A., Domingo, N. G., Colgan, K., Thakrar, S. K., Tilman, D., Lynch, J., et al. (2020). Global food system emissions could preclude achieving the 1.5 and 2 C climate change targets. Science 370, 705–708. doi: 10.1126/science.aba7357
Cotrufo, M. F., Ranalli, M. G., Haddix, M. L., Six, J., and Lugato, E. (2019). Soil carbon storage informed by particulate and mineral-associated organic matter. Nat. Geosci. 12, 989–994. doi: 10.1038/s41561-019-0484-6
Del Grosso, S. J., Parton, W. J., Mosier, A. R., Hartman, M. D., Brenner, J., and Ojima, D. S.. (2001). Simulated interaction of carbon dynamics and nitrogen trace gas fluxes using the DAYCENT model. Modeling carbon and nitrogen dynamics for soil management, CRC Press, Boca Raton, FL pp. 303–332.
Dungait, J. A., Hopkins, D. W., Gregory, A. S., and Whitmore, A. P. (2012). Soil organic matter turnover is governed by accessibility not recalcitrance. Glob. Chang. Biol. 18, 1781–1796. doi: 10.1111/j.1365-2486.2012.02665.x
FAO (Organización de las Naciones Unidas para la Alimentación y la Agricultura). (1997). Zonificación agroecológica. Guía general. (Boletín de suelos de la FAO, nro. 73) Roma: FAO.
FAO (Organización de las Naciones Unidas para la Alimentación y la Agricultura). (2014). Greenhouse gas emissions and fossil energy use from small ruminant supply chains: Guidelines for assessment: Draft for public review. Rome: FAO, 105.
FAO (Organización de las Naciones Unidas para la Alimentación y la Agricultura). (2016). Environmental performance of large ruminant supply chains: Guidelines for assessment: Version 1. Rome: FAO, 188.
Feeney, C. J., Cosby, B. J., Robinson, D. A., Thomas, A., Emmett, B. A., and Henrys, P. (2022). Multiple soil map comparison highlights challenges for predicting topsoil organic carbon concentration at national scale. Sci. Rep. 12, 1–13. doi: 10.1038/s41598-022-05476-5
Feng, W., Plante, A. F., and Six, J. (2013). Improving estimates of maximal organic carbon stabilization by fine soil particles. Biogeochemistry 112, 81–93. doi: 10.1007/s10533-011-9679-7
Freeman, K., Dias Pereira, L., Bullor, L., Perego, V. M. E., Escudero, D., Voss, F., et al. (2021). Up-skilling human capital for value-chain competitiveness in Uruguay (Vol. 5) Food and Agriculture Organization.
Friedlingstein, P., Jones, M. W., O'Sullivan, M., Andrew, R. M., Bakker, D. C., Hauck, J., et al. (2022). Global carbon budget 2021. Earth Syst Sci Data 14, 1917–2005. doi: 10.5194/essd-14-1917-2022
Friedlingstein, P., Jones, M. W., O'sullivan, M., Andrew, R. M., Hauck, J., Peters, G. P., et al. (2019). Global carbon budget 2019. Earth Syst Sci Data 11, 1783–1838. doi: 10.5194/essd-11-1783-2019
Garcıa Préchac, F., Clérici, C., Hill, M., and Brignoni, A. (2005). EROSION Versión 5.0, Programa de computación Para el uso de la USLE/RUSLE en la Región Sur de la Cuenca del Plata. Versión operativa en Windows DINAMA-UNDP. Proyecto URU/03/G31 y CSIC-UDELAR.
Garcıa Préchac, F., Ernst, O., Siri-Prieto, G., and Terra, J. A. (2004). Integrating no-till into crop–pasture rotations in Uruguay. Soil Tillage Res. 77, 1–13.
Gifford, R. M., and Roderick, M. L. (2003). Soil carbon stocks and bulk density: spatial or cumulative mass coordinates as a basis of expression? Glob. Chang. Biol. 9, 1507–1514. doi: 10.1046/j.1365-2486.2003.00677.x
Gorelick, N., Hancher, M., Dixon, M., Ilyushchenko, S., Thau, D., and Moore, R. (2017). Google earth engine: planetary-scale geospatial analysis for everyone. Remote Sens. Environ. 202, 18–27. doi: 10.1016/j.rse.2017.06.031
Gottschalk, P., Smith, J. U., Wattenbach, M., Bellarby, J., Stehfest, E., Arnell, N., et al. (2012). How will organic carbon stocks in mineral soils evolve under future climate? Global projections using RothC for a range of climate change scenarios. Biogeosciences 9, 3151–3171. doi: 10.5194/bg-9-3151-2012
Gregorich, E. G., Beare, M. H., McKim, U. F., and Skjemstad, J. O. (2006). Chemical and biological characteristics of physically uncomplexed organic matter. Soil Sci. Soc. Am. J. 70, 975–985. doi: 10.2136/sssaj2005.0116
Hassink, J. (1997). The capacity of soils to preserve organic C and N by their association with clay and silt particles. Plant and Soil 191, 77–87. doi: 10.1023/A:1004213929699
Hassink, J., and Whitmore, A. P. (1997). A model of the physical protection of organic matter in soils. Soil Sci. Soc. Am. J. 61, 131–139. doi: 10.2136/sssaj1997.03615995006100010020x
Heimann, M., and Reichstein, M. (2008). Terrestrial ecosystem carbon dynamics and climate feedbacks. Nature 451, 289–292. doi: 10.1038/nature06591
Hengl, T., Jesus, J., Heuvelink, G., Ruiperez Gonzalez, M., Kilibarda, M., Blagotic, A., et al. (2017). SoilGrids250m: global gridded soil information based on machine learning. PLoS One 12, 1–40. doi: 10.1371/journal.pone.0169748
Hengl, T., and Wheeler, I. (2018). Soil organic carbon content in x 5 g / kg at 6 standard depths (0, 10, 30, 60, 100 and 200 cm) at 250 m resolution (version v02) [data set] Zenodo.
Henwood, W. D. (2010). Toward a strategy for the conservation and protection of the world's temperate grasslands. Great Plains Res., 20, 121–134.
Heuvelink, G. B., Angelini, M. E., Poggio, L., Bai, Z., Batjes, N. H., van den Bosch, R., et al. (2021). Machine learning in space and time for modelling soil organic carbon change. Eur. J. Soil Sci. 72, 1607–1623. doi: 10.1111/ejss.12998
Houghton, R. A., Skole, D. L., Nobre, C. A., Hackler, J. L., Lawrence, K. T., and Chomentowski, W. H. (2000). Annual fluxes of carbon from deforestation and regrowth in the Brazilian Amazon. Nature 403, 301–304. doi: 10.1038/35002062
Hutchinson, J. J., Campbell, C. A., and Desjardins, R. L. (2007). Some perspectives on carbon sequestration in agriculture. Agric. For. Meteorol. 142, 288–302. doi: 10.1016/j.agrformet.2006.03.030
IPCC. (2006). IPCC guidelines for national greenhouse gas inventories. Institute for Global Environmental Strategies, Hayama, Kanagawa, Japan.
Kemanian, A. R., Shi, Y., White, C. M., Montes, F., Stöckle, C. O., Huggins, D. R., et al., (2022). The cycles Agroecosystem model: fundamentals, testing, and applications. Available at: https://ssrn.com/abstract=4188402
Kuzyakov, Y., and Domanski, G. (2000). Carbon input by plants into the soil review. J. Plant Nutr. Soil Sci. 163, 421–431. doi: 10.1002/1522-2624(200008)163:4<421::AID-JPLN421>3.0.CO;2-R
Lal, R. (2004a). Soil carbon sequestration impacts on global climate change and food security. Science 304, 1623–1627. doi: 10.1126/science.1097396
Lal, R. (2004b). Soil carbon sequestration to mitigate climate change. Geoderma 123, 1–22. doi: 10.1016/j.geoderma.2004.01.032
Lal, R. (2006). Soil carbon sequestration in Latin America. In R. Lal, et al. (eds.) Carbon sequestration in soils of Latin America. (New York, USA: Press, Binghamton), 77–92.
Lugato, E., Panagos, P., Bampa, F., Jones, A., and Montanarella, L. (2014). A new baseline of organic carbon stock in European agricultural soils using a modelling approach. Glob. Chang. Biol. 20, 313–326. doi: 10.1111/gcb.12292
Maillard, É., and Angers, D. A. (2014). Animal manure application and soil organic carbon stocks: a meta-analysis. Glob. Chang. Biol. 20, 666–679. doi: 10.1111/gcb.12438
Mandal, B., Majumder, B., Bandyopadhyay, P. K., Hazra, G. C., Gangopadhyay, A., Samantaray, R. N., et al. (2007). The potential of cropping systems and soil amendments for carbon sequestration in soils under long-term experiments in subtropical India. Glob. Chang. Biol. 13, 357–369. doi: 10.1111/j.1365-2486.2006.01309.x
Mayzelle, M. M., Krusor, M. L., Lajtha, K., Bowden, R. D., and Six, J. (2014). Effects of detrital inputs and roots on carbon saturation deficit of a temperate forest soil. Soil Sci. Soc. Am. J. 78, S76–S83. doi: 10.2136/sssaj2013.09.0415nafsc
Notarnicola, B., Tassielli, G., Renzulli, P. A., Castellani, V., and Sala, S. (2017). Environmental impacts of food consumption in Europe. J. Clean. Prod. 140, 753–765. doi: 10.1016/j.jclepro.2016.06.080
Oyarzabal, M., Andrade, B., Pillar, V. D., and Paruelo, J. (2020). “Temperate subhumid grasslands of southern South America” in Encyclopedia of the World's biomes. eds. M. I. Goldstein and D. A. DellaSala, vol. 3 (Elsevier), 577–593.
Parton, W. J. (1996). The CENTURY model. In Evaluation of soil organic matter models (pp. 283–291). Springer, Berlin, Heidelberg.
Parton, W. J., Stewart, J. W. B., and Cole, C. V. (1988). Dynamics of C, N, P and S in grassland soils:a model. Biogeochemistry 5, 109–131. doi: 10.1007/BF02180320
Paruelo, J. M. (2008). La caracterización funcional de ecosistemas mediante sensores remotos. Ecosistemas 17, 4–22.
Paruelo, J., Oesterheld, M., Altesor, A., Piñeiro, G., Rodriguez, C., Baldassini, P., et al. (2022). Grazers and fires. Their role in shaping the structure and functioning of the Río de la Plata Grasslands Ecologia Austral.
Paruelo, J. M., Texeira, M., Staiano, L., Mastrángelo, M., Amdan, L., and Gallego, F. (2016). An integrative index of ecosystem services provision based on remotely sensed data. Ecol. Indic. 71, 145–154. doi: 10.1016/j.ecolind.2016.06.054
Piñeiro, G., Paruelo, J., Jobbágy, G. E. G., Jackson, R. B., and Oesterheld, M. (2009). Grazing effects on belowground C and N stocks along a network of cattle exclosures in temperate and subtropical grasslands of South America; American Geophysical Union. Global Biogeochem. Cycles. 23, 1–14.
Pineiro, G., Paruelo, J. M., and Oesterheld, M. (2006). Potential long-term impacts of livestock introduction on carbon and nitrogen cycling in grasslands of southern South America. Glob. Chang. Biol. 12, 1267–1284. doi: 10.1111/j.1365-2486.2006.01173.x
Piñeiro, G., Paruelo, J. M., Oesterheld, M., and Jobbágy, E. G. (2010). Pathways of grazing effects on soil organic carbon and nitrogen. Rangel. Ecol. Manage. 63, 109–119. doi: 10.2111/08-255.1
Pravia, M. V. (2017). Soil carbon and nitrogen saturation in crop-pasture agricultural systems (PhD dissertation). Pennsylvania State University, University Park, Pennsylvania.
Pravia, M. V., Kemanian, A. R., Terra, J. A., Shi, Y., Macedo, I., and Goslee, S. (2019). Soil carbon saturation, productivity, and carbon and nitrogen cycling in crop-pasture rotations. Agr. Syst. 171, 13–22. doi: 10.1016/j.agsy.2018.11.001
Renard, K. G. (1997). Predicting soil erosion by water: A guide to conservation planning with the revised universal soil loss equation (RUSLE) United States Government Printing.
Rodrigues, L. A. T., Dieckow, J., Giacomini, S., Ottonelli, A. S., Zorzo, G. P. P., and Bayer, C. (2022). Carbon sequestration capacity in no-till soil decreases in the long-term due to saturation of fine silt plus clay-size fraction. Geoderma 412:115711. doi: 10.1016/j.geoderma.2022.115711
Sanderman, J., Hengl, T., Fiske, G., Solvik, K., Adame, M. F., Benson, L., et al. (2018). A global map of mangrove forest soil carbon at 30 m spatial resolution. Environ. Res. Lett. 13:055002. doi: 10.1088/1748-9326/aabe1c
Schlesinger, W. H. (1990). Evidence from chronosequence studies for a low carbon-storage potential of soils. Nature 348, 232–234. doi: 10.1038/348232a0
Schlesinger, W. H. (2022). Biogeochemical constraints on climate change mitigation through regenerative farming. Biogeochemistry 9-17:161. doi: 10.1007/s10533-022-00942-8
Schwint, E., Dieguez, H. D., Staiano, L., Berhongaray, G., Baldassini, P., and Paruelo, J. (2022). Evaluación de un índice satelital para estimar el carbono orgánico del suelo a nivel regional. XXVIII Congreso Argentino de la Ciencia del Suelo. Buenos Aires, Argentina.
Six, J., Bossuyt, H., Degryze, S., and Denef, K. (2004). A history of research on the link between (micro) aggregates, soil biota, and soil organic matter dynamics. Soil Tillage Res. 79, 7–31. doi: 10.1016/j.still.2004.03.008
Smith, P. (2012). Soils and climate change. Curr. Opin. Environ. Sustain. 4, 539–544. doi: 10.1016/j.cosust.2012.06.005
Smith, C. C., Espírito-Santo, F. D., Healey, J. R., Young, P. J., Lennox, G. D., Ferreira, J., et al. (2020). Secondary forests offset less than 10% of deforestation-mediated carbon emissions in the Brazilian Amazon. Glob. Chang. Biol. 26, 7006–7020. doi: 10.1111/gcb.15352
Smith, P., Smith, J. U., Powlson, D. S., McGill, W. B., Arah, J. R. M., Chertov, O. G., et al. (1997). A comparison of the performance of nine soil organic matter models using datasets from seven long-term experiments. Geoderma 81, 153–225. doi: 10.1016/S0016-7061(97)00087-6
Staiano, L., Sans, G. H. C., Baldassini, P., Gallego, F., Texeira, M. A., and Paruelo, J. M. (2021). Putting the ecosystem services idea at work: applications on impact assessment and territorial planning. Environ Dev 38:100570. doi: 10.1016/j.envdev.2020.100570
Stewart, C. E., Paustian, K., Conant, R. T., Plante, A. F., and Six, J. (2009). Soil carbon saturation: implications for measurable carbon pool dynamics in long-term incubations. Soil Biol. Biochem. 41, 357–366. doi: 10.1016/j.soilbio.2008.11.011
Stockmann, U., Adams, M. A., Crawford, J. W., Field, D. J., Henakaarchchi, N., Jenkins, M., et al. (2013). The knowns, known unknowns and unknowns of sequestration of soil organic carbon. Agric. Ecosyst. Environ. 164, 80–99. doi: 10.1016/j.agee.2012.10.001
Terrer, C., Phillips, R. P., Hungate, B. A., Rosende, J., Pett-Ridge, J., Craig, M. E., et al. (2021). A trade-off between plant and soil carbon storage under elevated CO2. Nature 591, 599–603. doi: 10.1038/s41586-021-03306-8
Vallejos, M., Gallego, F., Barbieri, A., Bruzzone, L., Ramos, S., and Baeza, S. (2021). MapBiomas pampa sudamericano: una iniciativa trinacional para conocer los cambios en el uso y cobertura del suelo. Revista INIA, N° 65:88.
Villarino, S. H., Studdert, G. A., Baldassini, P., Cendoya, M. G., Ciuffoli, L., Mastrángelo, M., et al. (2017). Deforestation impacts on soil organic carbon stocks in the semiarid Chaco region, Argentina. Sci. Total Environ. 575, 1056–1065. doi: 10.1016/j.scitotenv.2016.09.175
Villarino, S. H., Studdert, G. A., Laterra, P., and Cendoya, M. G. (2014). Agricultural impact on soil organic carbon content: testing the IPCC carbon accounting method for evaluations at county scale. Agric. Ecosyst. Environ. 185, 118–132. doi: 10.1016/j.agee.2013.12.021
Walker, W. S., Gorelik, S. R., Cook-Patton, S. C., Baccini, A., Farina, M. K., Solvik, K. K., et al. (2022). The global potential for increased storage of carbon on land. Proc. Natl. Acad. Sci. 119:e2111312119. doi: 10.1073/pnas.2111312119
Wiesmeier, M., Hübner, R., Spörlein, P., Geus, U., Hangen, E., Reischl, A., et al. (2014). Carbon sequestration potential of soils in Southeast Germany derived from stable soil organic carbon saturation. Glob. Chang. Biol. 20, 653–665. doi: 10.1111/gcb.12384
Wischmeier, W. H., and Smith, D. D. (1978). Predicting rainfall erosion losses: A guide to conservation planning (no. 537) Department of Agriculture, Science and Education Administration.
Woolf, D., and Lehmann, J. (2019). Microbial models with minimal mineral protection can explain long-term soil organic carbon persistence. Sci. Rep. 9, 1–8. doi: 10.1038/s41598-019-43026-8
Keywords: carbon sequestration, remote sensing, soil organic carbon, DayCent, ecosystem services, agricultural emissions
Citation: Baldassini P, Baethgen W, Camba Sans G, Quincke A, Pravia VM, Terra J, Macedo I, Piñeiro G and Paruelo J (2023) Carbon stocks and potential sequestration of Uruguayan soils: a road map to a comprehensive characterization of temporal and spatial changes to assess carbon footprint. Front. Sustain. Food Syst. 7:1045734. doi: 10.3389/fsufs.2023.1045734
Edited by:
Bruno José Rodrigues Alves, Brazilian Agricultural Research Corporation (EMBRAPA), BrazilReviewed by:
Gerald Moser, University of Giessen, GermanyErnesto Viglizzo, Independent researcher, Santa Rosa, La Pampa, Argentina
Copyright © 2023 Baldassini, Baethgen, Camba Sans, Quincke, Pravia, Terra, Macedo, Piñeiro and Paruelo. This is an open-access article distributed under the terms of the Creative Commons Attribution License (CC BY). The use, distribution or reproduction in other forums is permitted, provided the original author(s) and the copyright owner(s) are credited and that the original publication in this journal is cited, in accordance with accepted academic practice. No use, distribution or reproduction is permitted which does not comply with these terms.
*Correspondence: Pablo Baldassini, cGJhbGRhc3NAYWdyby51YmEuYXI=