 Robert L. Myers
 Kelly R. Wilson
- Center for Regenerative Agriculture, University of Missouri, Columbia, MO, United States
The SARE/CTIC national farmer survey has assessed farmer experiences and perceptions about cover crops six times from early 2013 to early 2020. In most years, approximately 2,000 farmers responded to the survey questions, a majority of which were cover crop adopters, but a significant fraction (7% to 16%) were non-adopters: farmers not yet using cover crops. Survey reports previously focused on the experiences of cover crop adopters. In this paper, we synthesize responses of non-adopters to examine what factors influence or constrain adoption of cover crops. The non-adopters had similar farm sizes and land tenure situations compared to cover crop adopters, but were more likely to make use of conventional tillage and less likely to use continuous no-till compared to cover crop adopters. Non-adopters identified a number of concerns about cover crops, with the top concern being the time to plant and manage cover crops. Approximately 80% of non-adopters reported being open to considering cover crops. Factors cited to encourage non-adopters to adopt cover crops included incentive payments, tax breaks, crop insurance discounts, and soil carbon payments. Non-adopters wanted to gain a better understanding of how cover crops would benefit their particular farming operation and were interested to gain training through local cover crop workshops, local cover crop field demonstrations and one-on-one technical assistance. Non-adopters were particularly interested in how cover crops could boost soil organic matter and also wanted to know how cover crops could help with yields and reducing input costs.
1. Introduction
With heightened attention on climate change from both the public and private sectors, there is increased interest in understanding what strategies are effective to increase adoption levels of on-farm conservation practices. Conservation practices like cover crops are implemented by farmers to achieve a range of ecosystem services, helping to build soil health and mitigate the impacts of extreme weather events and shocks from climate change. There is a growing body of evidence of the on- and off-farm benefits of cover crops (Myers et al., 2019) and federal agencies, farm and conservation groups, in addition to major corporations are setting ambitious targets to increase adoption of cover crops on US farmland (Hamilton et al., 2017; Painter, 2020; Shroeder, 2021). However, adoption levels remain modest in many areas of the US and vary regionally (Wade et al., 2015; Hamilton et al., 2017).
There is a range of scholarship exploring what factors are associated with farmers’ adoption of conservation strategies such as cover crops. Reported barriers to cover crop adoption include perceived lack of appropriate equipment/technology to manage cover crops, lack of perceived benefits, and time and labor constraints (Dunn et al., 2016; Roesch-McNally et al., 2018; Ranjan et al., 2020; Thompson et al., 2021). Land tenure is often considered a key factor, with the assumption that farmers who rent land are less likely to adopt conservation practices than those who own the land they farm (Deaton et al., 2018). However, in their 2022 review of studies, Ranjan and colleagues find that quantitative studies on this topic are inconclusive and qualitative studies suggest a more complex picture (Ranjan et al., 2022). They find that renting land can be a barrier, but that other factors such as the stability of tenure, market dynamics, type of lease arrangements and timelines, producer relationships with landowners, and producer characteristics are also influential factors.
Besides land tenure, scholars report a complementary relationship between producers who use some type of conservation tillage and use of cover crops (Lee and McCann, 2019; Church et al., 2020; Thompson et al., 2021). In their review of conservation practices adoption studies, Propoky and colleagues find that factors most often positively associated with adoption are self-identifying as primarily motivated by land stewardship (or otherwise not primarily financially motivated), environmental attitudes, having a positive attitude toward the practice, having a propensity toward seeking and employing information, farming on vulnerable land, farm size, and higher levels of income and formal education (Prokopy et al., 2019). They also find that farmers who engage in marketing arrangement to maximize revenues or profits and those who expect that the practice will have a positive effect on yield are more likely to adopt conservation practices. Thomson and colleagues find a positive association with cover crop adoption and the perception/belief that cover crops reduce risk of nutrient loss to waterways (Thompson et al., 2021).
To better evaluate farmer experiences of cover crops and perceptions of farmers not yet using cover crops, a series of cover crop surveys were conducted by the Conservation Technology Information Center (CTIC) with financial support and input from the North Central Region Sustainable Agriculture Research and Education (SARE) program and the American Seed Trade Association (ASTA). Survey findings were reported each year through reports (CTIC and SARE, 2013, 2014, 2015, 2016, 2017, 2020). In this paper, we synthesize findings of these multi-year surveys to identify factors encouraging or constraining cover crop adoption.
2. Materials and methods
Surveys of farmers about cover crops were conducted in the U.S. in the winter or springs of the following years: 2013, 2014, 2015, 2016, 2017, and 2020. Since the surveys included questions about the previous crop year, the nomenclature for reporting on the surveys was reported as a two-year period, such as the 2019–2020 survey addressing crop results in 2019 but being done in the spring of 2020. With the exception of the first survey (2012–2013), all surveys were done through providing an online link to a Qualtrics or Survey Monkey survey through email distribution and farm media promotion. In most years, over 50,000 farmers were solicited for participation in the survey, with the largest number of farmers reached through distribution to farmer subscribers of Corn and Soybean Digest by Penton Media. Other sizable email lists of thousands of farmers and farm advisors were provided through CTIC and SARE. Press releases were used with the farm media to further promote the survey, and distribution also occurred through the regional cover crop councils and other groups. Farmers who had filled out the survey in previous years were emailed the survey link and are believed to have constituted a majority of the farmers responding to the survey in subsequent years. The first year of the survey was done by a mixture of email surveys to a smaller list of farmers and handing out printed copies of the survey at five regional and national cover crop and no-till conferences where there were sizable numbers of farmers using cover crops.
It is important to note that the survey respondents do not represent a random sampling of the farming population or the cover crop using farmer population. Respondents self-selected whether to fill out the survey, but it is believed based on the respondent demographics that an effective cross-sample of farmers, particularly cover crop adopters, was obtained. In the first year of the survey, respondents were mostly from the Midwest. In subsequent years, there were respondents from across the lower 48 U.S. states, but the greatest numbers were from the Corn Belt states, reflecting the areas where the greatest number of farmers with cover crops are at (both Midwest and mid-Atlantic parts of the Corn Belt).
Survey questions were developed each year by a committee representing CTIC, SARE, ASTA staff and other experts on cover crops and survey methods. Each survey year, the survey questions and flow were reviewed for clarity. To maintain consistency, no major changes were made to individual questions, but we made minor changes where there was confusion over a question. As knowledge about cover crops and adoption increased over the years, questions were added to reflect the changing landscape and some were removed if they no longer seemed relevant. In years two to six of the survey, questions followed a branching tree pattern, such that non-adopters of cover crops answered only questions pertaining to the non-adopters, cover crop adopters with corn would answer questions about corn but not cotton, etc. Anyone who was not a farmer was thanked for opening the survey but instructed not to continue with the survey.
The number of farmer survey respondents varied by year, with 759 respondents for the 2012–2013 survey, approximately 2,000 respondents for each of the next four surveys (conducted in 2014–2017), and then 1,172 respondents for the 2019–2020 survey.1 The smaller number that year was due to Penton Farm Media not participating in distribution of that survey due to discontinuation of the Corn and Soybean Digest publication. Not all farmers answered all questions, both based on the branching structure of the survey, and also their individual willingness to answer a particular question. Responses were generally not required to advance to the next question in the survey, but high percentages of survey respondents completed the questions relevant to their situation.
Questions specifically for non-adopters of cover crops dealt with the following topics: farm size, land tenure, tillage practices, concerns about cover crops, sources of information on cover crops, factors that might encourage adoption of cover crops, and other cover crop perceptions. Some questions were repeated for two or more years in the survey and others were only asked once.
Survey results were tabulated by CTIC staff and reports issued each year for a broad audience. Full survey reports are online at the SARE website at: https://www.sare.org/publications/cover-crops/national-cover-crop-surveys/.
3. Results
The percentage of survey respondents that were cover crop adopters vs. non-adopters varied each year, but generally about 7%–16% of the respondents were non-adopters (with a high of 272 non-adopters responding in 2014–2015). It is likely that the farmers not using cover crops who responded the survey were somewhat more interested in cover crops than the general farming population, but their responses still provide insights into factors keeping some farmers from adopting cover crops.
3.1. Farm size
In general, the distribution of farm sizes of farmers not using cover crops was very similar to farmers using cover crops and represented a reasonable cross section of crop farm sizes in the U.S. For example, in the 2019–2020 survey, of the farmers not using cover crops 13% farmed 2,000 or more acres, 16.9% farmed 1,000 to 1,999 acres, 20.8% farmed 500 to 999 acres, 14.3% farmed 180 to 499 acres, 6.5% farmed 50 to 179 acres, 10.4% farmed 10 to 49 acres, and 18.2% farmed 1 to 9 acres.
3.2. Land tenure
Land tenure was likewise fairly similar between cover crop adopters and non-adopters. Land tenure among non-adopters varied, but was relatively consistent in the 3 years it was surveyed (Figure 1). In the 2019–2020 survey, non-adopters of cover crops reported the following land tenure: 39% owned all the land they farmed, 10.4% owned 76–99, 7.8% owned 51–75, 7.8% owned 26–50, 19.5% owned 1–25, and 15.6% owned none of the land they farmed. In relation to land tenure, in 2019–2020, non-adopters were asked about the following statement “It does not make sense for me to plant cover crops on ground I rent: 21% agreed or strongly agreed, but 28% disagreed or strongly disagreed with that statement and 51% were neutral.

Figure 1. Land tenure of non-adopters in 2016, 2017, and 2020. According to the U.S. Census of Agriculture, approximately 34% of farms were rented or leased land in 2012 and approximately 32% were rented or leased land in 2017 in the U.S. (Vilsack and Clark, 2014; USDA, 2019).
3.3. Tillage
Tillage was a practice that differed between cover crop adopters and non-adopters, as shown in Figure 2. Cover crop adopters were more likely to make use of continuous no-till and non-adopters were more likely to be using conventional tillage.
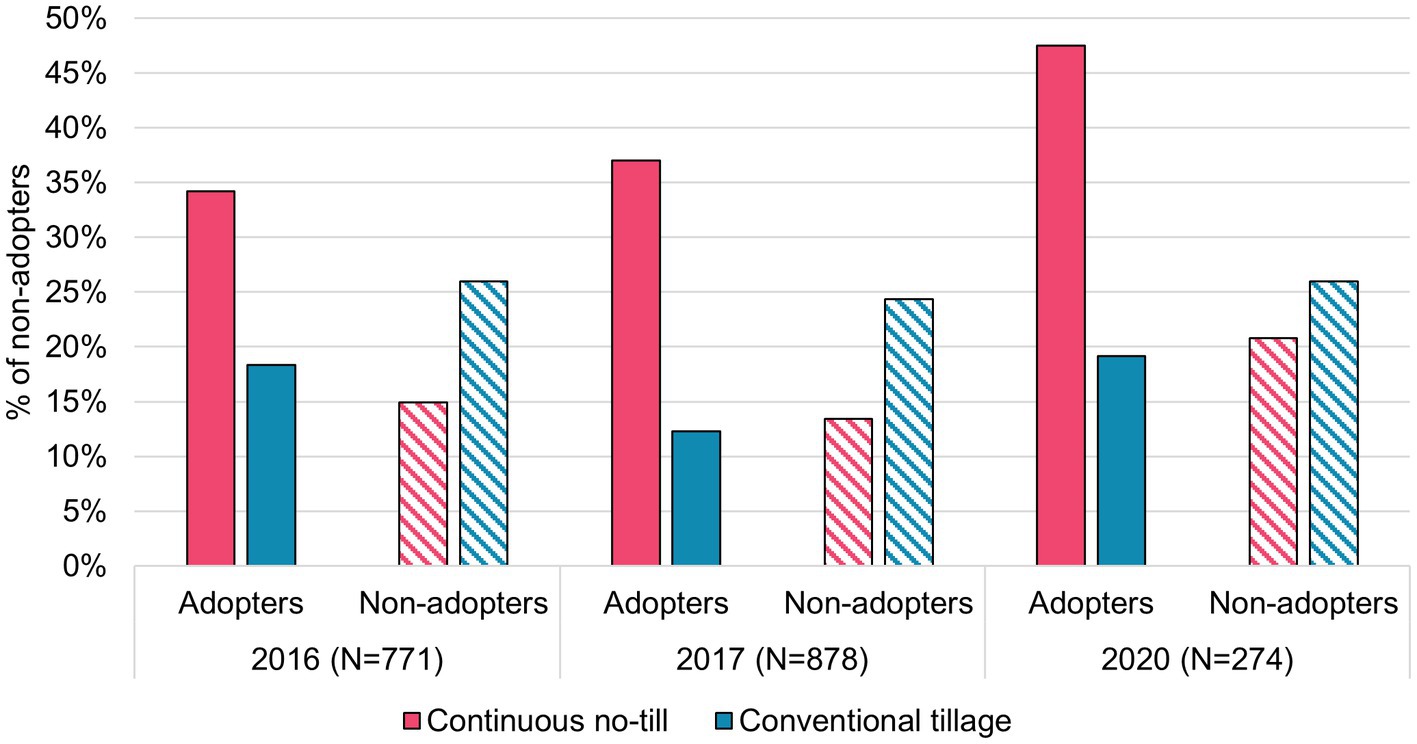
Figure 2. Tillage practices comparison between cover crop users and non-adopters in 2016, 2017, and 2020. According to the U.S. Census of Agriculture, 278,290 farms comprised cropland on which no-till practices were used compared to 405,692 farms that used intensive tillage in 2012. In 2017, 279,370 farms comprised cropland on which no-till practices were used compared to 264,893 farms that used intensive tillage.
3.4. Concerns about cover crops
One of the central questions about farmers not using cover crops is the concerns they have about cover crops, or what is holding them back from adoption (Figure 3). A question was asked about this topic in most of the surveys, and in every one, the top concern was the time and labor to plant and maintain the cover crop. In the 2019–2020 survey, 48% of the respondents listed that as their top concern. In most years, the second highest concern was usually related to cover crop economics, though the response choices varied some over the years on the economics question. Another common concern was using cover crops might increase production challenges and risks by adding weeds or making conditions harder to plant a cash crop in the spring. Farmers also felt unsure about their ability to effectively establish cover crops and to pick the right cover crop species.
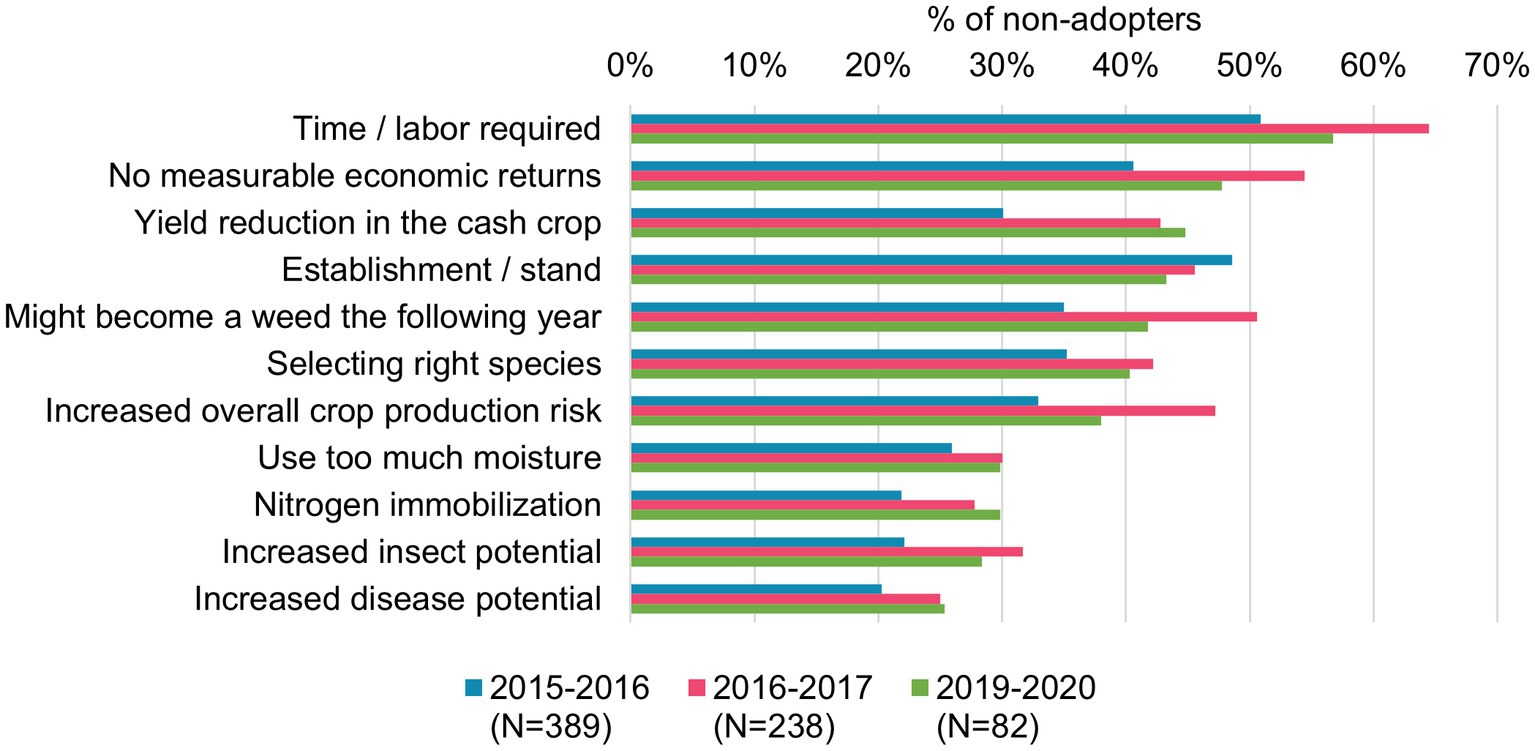
Figure 3. Non-adopters’ reported “major concerns” about using cover crops. N represents total non-adopters responding to this question each year.
While non-adopters reported a variety of concerns about cover crops, they also recognized potential benefits. In the 2014–2015 survey, non-adopters were asked what were the top three benefits they would look for from a cover crop. The top response was increased soil organic matter, named by 22%, followed by reduced soil erosion (18%), then a tie between increased yields in the following cover crops or reduced soil compaction, both at 11%. Smaller numbers were interested in cover crops for weed control (9%), nitrogen source (7%) and other factors.
3.5. Information sources
Participants were asked where they typically sought information about cover crops. Asked about information sources, in the 2019–2020 survey both cover crop adopters and non-adopters were asked to check all that applied from among 12 categories of information sources. The highest number checked was “my own experience or trial and error” followed in decreasing importance by “other farmers,” “ag media,” “extension,” “county natural resources conservation service,” “SARE,” “industry or retailer,” “county farm service agency,” and other options.
Related to information sources, non-adopters were asked about research priorities with cover crops in the 2014–2015 survey. The top response was “developing cover crops that fit my cash crop timing” followed closely by “developing cover crops that fit the climate in my area.” Farmers were somewhat less interested in research on cover crops with improved ability to scavenge nitrogen, enhance cash crop disease resistance, or cover crops that fit common soil types.
3.6. Role of agriculture retailers
Farmers were also asked about the role of agriculture retailers (companies selling seed, chemicals, and/or fertilizers) in the 2013–2014 survey. Generally, responses to the ag retailer question were very similar between cover crop adopters and non-adopters on how ag retailers could be helpful with cover crop seed sales, cover crop planting, termination, and other services. The biggest contrast was whether ag retailers should encourage cover crop adoption: about 34% of cover crop adopters thought that should be a significant role for ag retailers, while only 23% of the non-adopters felt that ag retailers should be encouraging cover crop adoption. Cover crop adopters also felt more strongly that ag retailers should help with nutrient management plans to account for cover crops, while non-adopters thought cover crop termination advice and services were most important.
3.7. Motivations to use cover crops
Non-adopters were asked what would be “most helpful” to motivate them to use cover crops (Figure 4). The question was asked as a five-point Likert scale from not helpful to very helpful. In 2019–2020, the strongest positive response was to “cost-share or incentives to offset the cost of planting cover crops” with 54% responding that it would be moderately or very helpful. The next most favorable response was to “tax credits for planting cover crops,” with 70% ranking this approach as either very helpful or moderately helpful and 19% rating it as not helpful or somewhat helpful. Another type of financial incentive, payments for storing carbon, were also of interest with 63% ranking this approach as very helpful or moderately helpful to encourage them to use cover crops. The other type of financial inducement offered as a response was “discounted crop insurance premiums,” with 61% saying it would be very helpful or moderately helpful to encourage adoption and 25% disagreeing.
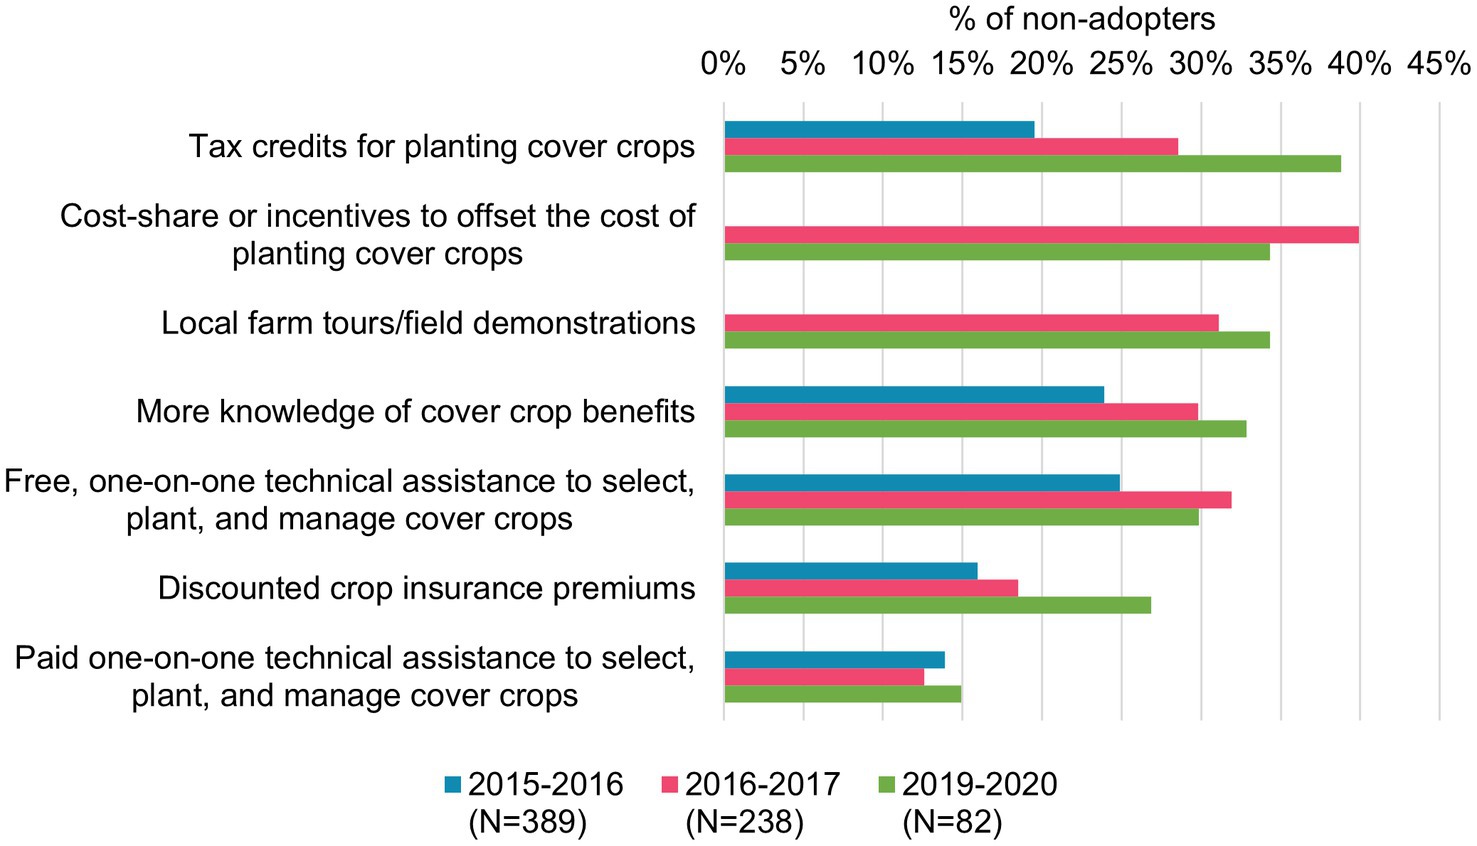
Figure 4. Non-adopters’ ratings of what would be “most helpful” to motivate them to use cover crops. Non-adopters were asked to rank approaches that would best motivate them to use cover crops using a 5-point Likert scale that included (1)“not helpful,” (2)“somewhat helpful,” (3)“neither helpful nor detrimental,” (4)“moderately helpful,” and (5)“very helpful.” For this chart, we combined responses of “moderately helpful” and “very helpful” for each year. N represents total non-adopters responding to this question each year.
Local demonstrations and advice were also viewed as beneficial to gaining encouragement to try cover crops; 65% said “that “local farm tours with cover crops so I can see how they work in my area” would be very helpful or moderately helpful and 60% ranking “one-on-one technical assistance to select, plant or manage, cover crops” as very helpful or moderately helpful.
Of least interest was having the ability to hire a local company or individual to do the cover crop seeding, with 34% interested in that option but 31% neutral and 35% not interested, despite concerns about the time it takes to plant and manage cover crops.
An earlier survey, in 2014–2015, found non-adopters responded that their willingness to use cover crops would be greatest if cover crops resulted in yield benefits for their primary cash crop. Tied for second were availability of cover crop incentive funds and availability of equipment for planting cover crops. They were least interested in having service providers or contractors to help plant cover crop seed, as was seen in 2019–2020.
3.8. Education opportunities
In 2013–2014, farmers were asked about the effectiveness of various educational opportunities (other years this question was not asked). Of the seven question response options given, non-adopters responded most favorably on two options, one being “local cover crop workshop where local experts and farmers who use cover crops present knowledge and share experiences” and the other being “trying things on my own and learning from successes and mistakes.” Both those responses were rated about 44% always effective and between 45% and 50% sometimes effective. Talking over the fence with a neighbor about his or her cover crops was viewed as much less effective.
3.9. Openness to using cover crops
In the two most recent surveys, non-adopters were asked if they had ever considered using cover crops on their farm. In 2016–2017, 82% said yes, in 2019–2020, 79% said yes. In 2016–2017, non-adopters were asked the degree to which they were interested in learning about how cover crops could benefit their farm: 38% strongly agreed, 36% agreed, 20% were neutral, and only 6% disagreed or strongly disagreed. As a follow-up question, they were asked: “If I better understood how cover crops would benefit my farm, I would be more likely to use them.” Sixty-nine percent agreed or strongly agreed with that statement, and only 7% disagreed or strongly disagreed. This was similar to a 2019–2020 finding, where 70% of non-adopters indicated they agreed or strongly agreed with the statement “I am interested in learning more about how cover crops can benefit my farm.”
In 2019–2020, non-adopters were also asked about their agreement on a series of other statements. In the strongest positive response, 75% of the non-adopters agreed or strongly agreed with the statement “If cover crops could help me reduce crop inputs (fertilizer, insecticide, herbicide, etc.) I would be more interested in using them on my farm.” Only 6% disagreed or strongly disagreed with that statement. Non-adopters had mixed opinions about the statement: “Concern about spread of herbicide-resistant weeds keeps me from using cover crops on my farm” with 32% agreeing or strongly agreeing, 40% neutral, and 28% disagreeing or strongly disagreeing with the statement.
4. Discussion
Synthesizing these SARE/CTIC multi-year farmer cover crop surveys offers important insight, particularly related to non-adopters perspectives. Perhaps most notable were the responses on land tenure, concerns about cover crops, and motivations for considering cover crops. While the non-adopters responding to the surveys were likely more interested in cover crops than non-adopter population as a whole, we found several common themes among our nonuser sample population.
Land tenure is frequently presented as a key factor impacting cover crop adoption. The assumption is that farmers are less likely to use these conservation practices on rented land, not knowing if they will retain access to any soil health benefits they might contribute to on a rented field. Along the same lines is the assumption that farmers who owned more of their land were more likely to use cover crops. However, these surveys showed there was little difference in land ownership percentage (or farm size) between cover crop adopters and non-adopters. When non-adopters were asked about their attitude on using cover crops for rented ground, as noted in results, only 21% agreed or strongly agreed that it “does not make sense for me to plant cover crops on ground I rent.” This result shows rental of land vs. ownership is likely not as big of a factor in cover crop use as some have assumed. As has been noted by other researchers, there is more complexity to the relationship between land tenure and adoption of conservation practices (Dunn et al., 2016; Deaton et al., 2018; Barnett et al., 2020; Ranjan et al., 2022). Considering that farmers increasingly rent ground for a prolonged period of time, the notion that they do not care about stewarding their land is misconceived. The USDA Economic Research Service reported that “70 % of acres rented from operator landlords have been rented to the same tenant for over 3 years and 28% for over 10 years. Non-operator landlords tend to have even lengthier relationships with their tenants; 84 percent of acres have been rented to the same tenant for over 3 years and 41% for over 10 years” (Bigelow et al., 2016, p. 25).
Rather than rental arrangements, the number one concern that non-adopters have about cover crops is the time it takes to seed cover crops in the fall and to manage them. This finding was consistent in each of the four survey years, and was also noted by Lee and McCann (2019) in their research. This concern is perhaps understandable, as the fall time period when most cover crops are planted is one of the busiest on grain farms, with harvest operations often going up to the date of first frost or beyond, and many farmers wanting to do fall tillage and/or fertilizer applications after grain harvest. What is less apparent is why so many of the same non-adopters are reluctant to consider hiring someone to seed their cover crops, with low levels of interest in contracted cover crop seeding in the two survey years that option was asked about. It may be that many farmers do not want to feel dependent on someone else to do planting for them. However, to get past the hurdle of having more non-adopters resistant to cover crops, it will likely be necessary for more of them to start taking advantage of external cover crop seeding services, whether from aerial applications, fertilizer dealers, neighboring farmers or others who can do cover crop seeding.
Non-adopters consistently reported that cost-share or incentive payments for cover crop seeding would be the top positive inducement to start using cover crops. This aligns with the yearly expansion that federal and state agencies have made to their cover crop incentive programs in addition to the consistent demand for these funds, which usually outstrips supply. Further government investment in cover crop incentives will likely continue to help expand acreage of cover crops, based on survey responses.
Other financial inducements were also of interest, including tax credits, crop insurance discounts, and soil carbon payments. Tax credits have been discussed but not implemented in any large-scale fashion in the U.S. A pilot program on tax credits in one or more U.S. regions help to further assess the potential to drive adoption. Such tax credits could be property tax credits, which may motivate both owner-operators as well as non-operator landowners. Another approach could target income tax, either specifically for farm operators or split between operators and nonoperating landowners.
Cover crop discounts on crop insurance premiums were first offered in the state of Iowa in 2017 at $5 per acre, and proved to be very popular, with demand for the program steadily growing (Iowa Department of Agriculture and Land Stewardship, 2021). Illinois is now also offering a similar crop insurance premium discount for planting cover crops. Nationally, USDA has provided a $5 per acre benefit to farmers using cover crops who have crop insurance, but this incentive payment is distributed after cover crop use rather than before, as is the case in Iowa and Illinois. While the $5 per acre payment is small compared to cover crop payments offered through the USDA Environmental Quality Incentive Program of $40–50 per acre or more, it is a substantial percent discount on a crop insurance premium that might be in the $15 per acre range.
Soil carbon payments are a more recent opportunity being offered to farmers, primarily through major food and agriculture companies (Wongpiyabovorn et al., 2021; Oldfield et al., 2022). In the 2019–2020 survey, cover crop non-adopters indicated strong interest in soil carbon payments. However, challenge has been the widely divergent approaches taken among companies, leading to confusion among farmers about the options (Wongpiyabovorn et al., 2022). Some companies have also continued to modify their soil carbon payment programs, adding to further confusion. Going forward, improving clarity about these soil carbon payment options will likely lead to more use of them as an inducement for cover cropping by current non-adopters.
Providing learning opportunities and farmer-to-farmer networking through field days and workshops continues to be an important approach for non-adopters, based on their desire to learn from other farmers. Other studies have documented the value of these approaches, including a study on conservation field days and demonstrations in Indiana (Singh et al., 2018).
5. Conclusion
This survey analysis underscores that there is not one single approach that will dramatically increase cover crop adoption among current non-adopters. Some will be motivated by expanded incentive payments while others who are averse to government programs may prefer private sector payments. Further education and outreach efforts on cover crops will be important to help non-adopters better understand how cover crops can benefit their own personal situation. Continued use of local field days and workshops and direct engagement with producers on specific ways cover crops can work for them will be needed in combination with financial incentives to greatly expand the amount of cover crop acreage in the U.S.
Data availability statement
The raw data supporting the conclusions of this article will be made available by the authors, without undue reservation.
Ethics statement
Ethical review and approval was not required for the study on human participants in accordance with the local legislation and institutional requirements. The patients/participants provided their written informed consent to participate in this study.
Author contributions
All authors listed have made a substantial, direct, and intellectual contribution to the work and approved it for publication.
Funding
Funding was provided for this work by the North Central Region Sustainable Agriculture Research and Education Program. Additional financial support for the survey came from the American Seed Trade Association.
Conflict of interest
The authors declare that the research was conducted in the absence of any commercial or financial relationships that could be construed as a potential conflict of interest.
Publisher’s note
All claims expressed in this article are solely those of the authors and do not necessarily represent those of their affiliated organizations, or those of the publisher, the editors and the reviewers. Any product that may be evaluated in this article, or claim that may be made by its manufacturer, is not guaranteed or endorsed by the publisher.
Footnotes
1. ^For reference, the 2017 U.S. Census of Agriculture comprised 2,042,220 farms and reported a response rate of 71.8% (USDA, 2019).
References
Barnett, M. J., Spangler, K., Petrzelka, P., and Filipiak, J. (2020). Power dynamics of the non-operating landowner-renter relationship and conservation decision-making in the midwestern United States. J. Rural. Stud. 78, 107–114. doi: 10.1016/j.jrurstud.2020.06.026
Bigelow, D., Borchers, A., and Hubbs, T. (2016). U.S. farmland ownership, tenure, and transfer p. 53. U.S. Department of Agriculture, Economic Research Service. Available at: https://www.ers.usda.gov/topics/farm-economy/land-use-land-value-tenure/farmland-ownership-and-tenure/
Church, S. P., Lu, J., Ranjan, P., Reimer, A. P., and Prokopy, L. S. (2020). The role of systems thinking in cover crop adoption: implications for conservation communication. Land Use Policy 94:104508. doi: 10.1016/j.landusepol.2020.104508
CTIC and SARE. (2013). 2012–2013 cover crop survey. Conservation technology information center (CTIC), Sustainable Agriculture Research & Education (SARE). Available at: https://www.ctic.org/data/Cover_Crops_Research_and_Demonstration_Cover_Crop_Survey#:~:text=2019%2D2020%20Cover%20Crop%20Survey&text=Among%20farmers%20who%20planted%20green,and%202.625%20in%20spring%20wheat
CTIC and SARE. (2014). 2013–2014 cover crop survey report. Conservation technology information center (CTIC), Sustainable Agriculture Research & Education (SARE). Available at: https://www.ctic.org/data/Cover_Crops_Research_and_Demonstration_Cover_Crop_Survey#:~:text=2019%2D2020%20Cover%20Crop%20Survey&text=Among%20farmers%20who%20planted%20green,and%202.625%20in%20spring%20wheat
CTIC and SARE. (2015). 2014–2015 cover crop survey report. Conservation technology information center (CTIC), Sustainable Agriculture Research & Education (SARE). Available at: https://www.ctic.org/data/Cover_Crops_Research_and_Demonstration_Cover_Crop_Survey#:~:text=2019%2D2020%20Cover%20Crop%20Survey&text=Among%20farmers%20who%20planted%20green,and%202.625%20in%20spring%20wheat
CTIC and SARE. (2016). 2015–2016 cover crop survey report. Conservation technology information center (CTIC), Sustainable Agriculture Research & Education (SARE). Available at: https://www.ctic.org/data/Cover_Crops_Research_and_Demonstration_Cover_Crop_Survey#:~:text=2019%2D2020%20Cover%20Crop%20Survey&text=Among%20farmers%20who%20planted%20green,and%202.625%20in%20spring%20wheat
CTIC and SARE. (2017). 2016–2017 cover crop survey report. Conservation technology information center (CTIC), Sustainable Agriculture Research & Education (SARE). Available at: https://www.ctic.org/data/Cover_Crops_Research_and_Demonstration_Cover_Crop_Survey#:~:text=2019%2D2020%20Cover%20Crop%20Survey&text=Among%20farmers%20who%20planted%20green,and%202.625%20in%20spring%20wheat
CTIC and SARE. (2020). 2019–2020 cover crop survey report. Conservation technology information center (CTIC), Sustainable Agriculture Research & Education (SARE). Available at: https://www.ctic.org/data/Cover_Crops_Research_and_Demonstration_Cover_Crop_Survey#:~:text=2019%2D2020%20Cover%20Crop%20Survey&text=Among%20farmers%20who%20planted%20green,and%202.625%20in%20spring%20wheat
Deaton, B. J., Lawley, C., and Nadella, K. (2018). Renters, landlords, and farmland stewardship. Agric. Econ. 49, 521–531.
Dunn, M., Ulrich-Schad, J. D., Prokopy, L. S., Myers, R. L., Watts, C. R., and Scanlon, K. (2016). Perceptions and use of cover crops among early adopters: Findings from a national survey. J. Soil Water Conserv. 71, 29–40.
Hamilton, A. V., Mortensen, D. A., and Allen, M. K. (2017). The state of the cover crop nation and how to set realistic future goals for the popular conservation practice. J. Soil Water Conserv. 72, 111A–115A. doi: 10.2489/jswc.72.5.111A
Iowa Department of Agriculture and Land Stewardship (2021). Iowa Department of Agriculture and Land Stewardship’s Cover Crop Insurance Discount Program Continues this Fall. Available at: https://iowaagriculture.gov/news/idals-offering-cover-crop-insurance-discount-fall-2021
Lee, S., and McCann, L. (2019). Adoption of cover crops by US soybean producers. J. Agric. Appl. Econ. 51, 527–544. doi: 10.1017/aae.2019.20
Myers, R. L., Weber, A., and Tellatin, S. (2019). Cover Crop Economics; Opportunities to Improve Your Bottom Line in Row Crops. University of Missouri and North Central SARE, Columbia, Missouri: Sustainable Agriculture Research & Education (SARE). Available at: https://www.sare.org/resources/cover-crop-economics/
Oldfield, E. E., Eagle, A. J., Rubin, R. L., Rudek, J., Sanderman, J., and Gordon, D. R. (2022). Crediting agricultural soil carbon sequestration. Science 375, 1222–1225. doi: 10.1126/science.abl7991
Painter, K. L. (2020). Cargill joins regenerative agriculture movement, sets goal for 10 million acres. StarTribune. Available at: https://www.startribune.com/cargill-joins-regenerative-agriculture-movement-sets-goal-for-10-million-acres/572432302/
Prokopy, L. S., Floress, K., Arbuckle, J. G., Church, S. P., Eanes, F. R., Gao, Y., et al. (2019). Adoption of agricultural conservation practices in the United States: evidence from 35 years of quantitative literature. J. Soil Water Conserv. 74, 520–534. doi: 10.2489/jswc.74.5.520
Ranjan, P., Arbuckle, J. G., Church, S. P., Eanes, F. R., Floress, K., Gao, Y., et al. (2022). Understanding the relationship between land tenure and conservation behavior: recommendations for social science research. Land Use Policy 120:106161. doi: 10.1016/j.landusepol.2022.106161
Ranjan, P., Church, S. P., Arbuckle, J. G., Gramig, B. M., Reeling, C. J., and Prokopy, L. S. (2020). Conversations with non-choir farmers: Implications for conservation adoption. Report for the Walton Family Foundation.
Roesch-McNally, G. E., Basche, A. D., Arbuckle, J. G., Tyndall, J. C., Miguez, F. E., Bowman, T., et al. (2018). The trouble with cover crops: farmers’ experiences with overcoming barriers to adoption. Renewable Agric Food Syst 33, 322–333. doi: 10.1017/S1742170517000096
Shroeder, E. (2021). General Mills advances regenerative ag practices. World-Grain.Com. Available at: https://www.world-grain.com/articles/15188-general-mills-advances-regenerative-ag-practices
Singh, A., MacGowan, B., O’Donnell, M., Overstreet, B., Ulrich-Schad, J., Dunn, M., et al. (2018). The influence of demonstration sites and field days on adoption of conservation practices. Journal of Soil and Water Conservation, 73, 276–283.
Thompson, N. M., Reeling, C. J., Fleckenstein, M. R., Prokopy, L. S., and Armstrong, S. D. (2021). Examining intensity of conservation practice adoption: evidence from cover crop use on US Midwest farms. Food Policy 101:102054. doi: 10.1016/j.foodpol.2021.102054
USDA (2019). 2017 census of agriculture United States summary and state data Volume 1, Part 51. Washington, DC: USDA, National Agricultural Statistics Service.
Vilsack, T., and Clark, C. (2014). 2012 census of agriculture. National Agricultural Statistics Service, US Department of Agriculture.
Wade, T., Claassen, R., and Wallander, S. (2015). Conservation-Practice Adoption Rates Vary Widely by Crop and Region. EIB-147. Washington, DC: U.S. Department of Agriculture, Economic Research Service.
Wongpiyabovorn, O., Plastina, A., and Crespi, J. M. (2022). Challenges to voluntary ag carbon markets. Appl. Econ. Perspect. Policy
Wongpiyabovorn, O., Plastina, A., and Lence, S. H. (2021). Futures Market for Ag Carbon Offsets under Mandatory and Voluntary Emission Targets. Ames, Iowa: Center for Agricultural and Rural Development (CARD) Publications at Iowa State University. Available at: https://ideas.repec.org/p/ias/cpaper/apr-fall-2021-4.html
Keywords: cover crops, soil health, farmer adoption, conservation, tillage
Citation: Myers RL and Wilson KR (2023) Farmer perspectives about cover crops by non-adopters. Front. Sustain. Food Syst. 7:1011201. doi: 10.3389/fsufs.2023.1011201
Edited by:
Jacob Jungers, University of Minnesota Twin Cities, United StatesReviewed by:
Resham Thapa, North Carolina State University, United StatesGabrielle Roesch-McNally, American Farmland Trust, United States
Copyright © 2023 Myers and Wilson. This is an open-access article distributed under the terms of the Creative Commons Attribution License (CC BY). The use, distribution or reproduction in other forums is permitted, provided the original author(s) and the copyright owner(s) are credited and that the original publication in this journal is cited, in accordance with accepted academic practice. No use, distribution or reproduction is permitted which does not comply with these terms.
*Correspondence: Robert L. Myers, bXllcnNyb2JAbWlzc291cmkuZWR1