
94% of researchers rate our articles as excellent or good
Learn more about the work of our research integrity team to safeguard the quality of each article we publish.
Find out more
ORIGINAL RESEARCH article
Front. Sustain. Food Syst., 13 October 2022
Sec. Climate-Smart Food Systems
Volume 6 - 2022 | https://doi.org/10.3389/fsufs.2022.994920
 Sharon Ravitz Wyngaard
 Meidad Kissinger*
Worldwide growing demand for food, alongside limited resources and accelerating environmental changes, suggests that future global food security may rely at least partially on unconventional land and production systems, such as built infrastructure located in desert areas. This paper analyses the environmental footprints (water, soil, carbon, material, solid waste, and ecological) of a tomato production system in passive greenhouses, a low-tech growing structure with no artificial heating or cooling. We collected data from 10 farms in the hyper-arid region of the Central Arava, Israel. Our analysis covers the four stages of production up to the overseas export destination and investigates the system's direct and indirect biophysical interactions. The average footprint of a ton of tomatoes is 1,040 kg/t (Material footprint), 94 m3/t (Water footprint), 72 m2/t (Land footprint), 952 kgCO2eq/t (Carbon footprint), 442 kg/t solid waste (SWF) and 243 gha/t (Ecological footprint). Our results indicate that the environmental hotspots can be attributed to universal factors–water production, fossil energy, fertilizers, structures, and road transport, alongside case-specific elements–soil, evaporation, location and the human-factor. Some differences were found when examining the full range of footprints within farms. No correlation was found between the farm's yields and materials inputs or carbon footprint, pointing to the human factor. We discuss the advantages and limitations of the local production system and proposed some improvement strategies.
Ongoing and expected increasing demand for food worldwide, alongside accelerating environmental changes and projected climate change processes, impact food security and system sustainability and pose major challenges to the agricultural system and human development (FAO, 2018). Some existing agricultural systems will need to adapt to new, often harsher and drier environmental conditions (IPCC, 2001; UNCCD, 2018).
The potential of arid agriculture has been recognized (Plaza-Bonilla et al., 2015; FAO, 2020), but it is challenging due to various biophysical constraints such as water scarcity, extreme temperatures, soil quality and transport distances (Ben-Gal et al., 2006; Plaza-Bonilla et al., 2015). To overcome some of those constraints, desert agriculture can be partially practiced in growing structures that improve yields and enable more efficient use of water and land (Deng et al., 2006; Boulard et al., 2011; Nicola et al., 2020). Yet, agriculture structures also have negative environmental impacts that need to be considered (e.g., Stanhill, 1980; Torrellas et al., 2012).
This paper focuses on Tomatoes (Solanum Lycopersicon), the second most important fruits worldwide (FAO, 2022). Globally, about 180 million tons of tomatoes are grown annually, an amount that has increased by 165% over the last two decades (FAOSTAT, 2022), and is expected to continue to rise in the coming years. Tomatoes are recognized as “functional foods”; they contain bioactive compounds that provide many health benefits beyond the normal nutritional value of food (e.g., Canene-Adams et al., 2005; Martí et al., 2018).
A significant body of environmental research has examined fresh and processed tomato-based products (Clune et al., 2017; Deepa et al., 2021). Some studies have taken a broad systematic approach using research methods, such as life cycle assessment (LCA) and the footprint family indicators (e.g., Page et al., 2012; Clavreul et al., 2017; Garofalo et al., 2017; Lam et al., 2018; Ronga et al., 2019; Canaj et al., 2020; Maaoui et al., 2020). However, meta-analyses of global studies on the environmental impacts of tomato production (Clune et al., 2017; Bjørn et al., 2020; Torres Pineda et al., 2021) showed that most studies, were conducted in Europe and the Americas. Only very few were conducted in the Middle East or Africa in passive greenhouses (henceforth: PGH), a typical growing structure in hot climates, and practically none in hyper arid areas.
The research presented in this paper embraces a “footprint family” framework to analyze tomato production in PGH in an extreme desert area. We analyzed the tomatoes' water, land, carbon, material, solid waste, and ecological footprints based on original data obtained from local farmers as mean to examine the system's direct and indirect environmental interactions.
The footprint family has been described as a set of indicators capable of monitoring human increasing pressure on the environment (Galli et al., 2012). It enables stakeholders to make environmentally friendly decisions (Aldaya and Hoekstra, 2010; Almeida et al., 2014; Onozaka et al., 2016), by identifying the environmental pressures and assessing the potential biophysical trade-offs in proposed policies or other actions (Giljum et al., 2011; Galli et al., 2012; Steen-Olsen et al., 2012). However, most empirical studies have not attempted to integrate more than a single indicator (Fang et al., 2014; Kissinger et al., 2019). Also, only some have quantified the footprint of individual life cycle stages along the commodity chain of a product (e.g., production, shipping).
The research presented in this paper is, to the best of our knowledge, the first comprehensive footprint analysis applied to tomato production in hyper-arid environments. It aims to provide an overall picture of the PGH tomatoes to examine the system's direct and indirect environmental interactions in the Central Arava region of Israel. In addition, it seeks to identify primary and secondary hotspots associated with the fruit production throughout its life cycle. A region-specific footprint analysis can reveal unique opportunities to improve sustainability in each region (Rotz et al., 2019).
This study estimates the environmental footprints of tomato production PGH at the Central Arava region, Israel. The analysis includes four stages along the products life cycle from “cradle to grave” (Figure 1): (a) the pre-cultivation stage: production of inputs, including structure, fertilizers, pesticides, plastic films, packaging materials, electricity for the production of water and diesel for transport to the cultivation area; (b) the agricultural cultivation stage: use of inputs during cultivation methods; application of fertilizers, use of diesel and electricity for irrigation system; (c) combined post-cultivation: sorting and packing of fruits and transportation to the market gate, considering electricity, diesel fuel, etc.; and (d) waste management: the amount and type of solid waste generated during tomato production and the GHG emissions (GHG) generated during its treatment. The study did not consider labor, and the production machinery and seedlings, (the latter contribute <4% to the environmental impact, as noted by Torres Pineda et al., 2021). The production of the water tank was not regarded due to lack of data, but the energy needed for its operation was included. The functional unit was 1 t−1 (ton) of packed marketable fruit at the EU (European Union) gate, a very common functional unit (e.g., Almeida et al., 2014; Bojacá et al., 2014; Dias et al., 2017; Maaoui et al., 2020; Deepa et al., 2021; Torres Pineda et al., 2021).
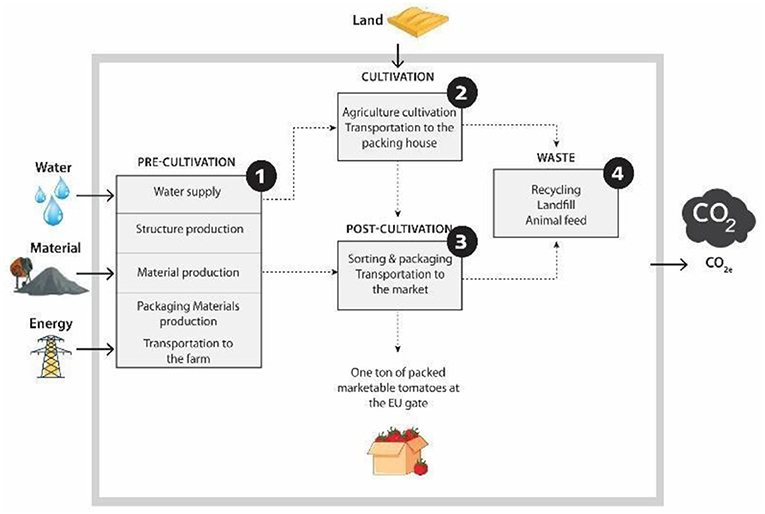
Figure 1. The research boundaries. System boundaries and the sub-systems included for assessment of the carbon, land, water, solid waste, and ecological footprints of a PGH tomatoes produced in the Central Arava, Israel, and exported to the EU market gate.
The research focused on a series of footprint indicators documenting and analyzing each along the studied commodity life cycle. The 'land footprint' (LF) measures the amount of area necessary to provide people with food, materials, energy, and infrastructure (MacDonald et al., 2015; Vanham et al., 2019). The term 'material footprint' (MF) represents the number of resources and flow of material inputs throughout the life cycle of a product, expressed in mass, kg material/t product (Lettenmeier et al., 2009). The 'water footprint' (WF) indicates the direct and indirect volume of water required to produce a commodity and can reveal hotspots related to its use (Hoekstra et al., 2011). As pointed out in a recent study (Fridman et al., 2021), approaches to calculating WF usually refers to rainfall (green water) and fresh irrigation water (blue water) and tend to ignore the other water sources. As in some rare previous studies in hyperarid climate (e.g., Al-Muaini et al., 2019), the negligible annual precipitation was found to be irrelevant for crop irrigation; therefore, the WF of a studied hyperarid system should focus on blue water (Chapagain and Hoekstra, 2004) and includes brackish water used for irrigation and desalinated water used in the packing houses (Fridman et al., 2021).
A “solid waste footprint” (SWF) identifies and quantifies the sources of waste throughout the product's life cycle until its final disposal (ecoinvent Center., 2019). This may include biodegradable (e.g., non-marketable fruits, plants) and non-degradable materials (e.g., plastics). The 'carbon footprint' (CF) measures the total equivalent emissions (kgCO2e) caused or accumulated indirectly and directly during the life cycle of the studied product (Wiedmann and Minx, 2008). Finally, the “ecological footprint” (EF) measures the ratio of resource use by human activities and the ecosystem's ability to renew them. It assesses (in gha) the space and water needed to generate the renewable resources a population consumes and to absorb the waste it generates (Wackernagel et al., 2005; Eurostat, 2018).
The original primary data was collected by a face-to-face survey from 10 family farms. The data collected represent about 43% of all tomato growing areas (29.2 ha) in the Hatzeva village (30°46′45.3“N,35°14′27.1”E) that year (Central Arava Regional Council, 2017). The selected footprint assessments were calculated based on various inputs (Supplementary Table A1) used during a growing season and yield, GHG, and solid waste outputs. Some of the key inputs and outputs are described here, along with the method used to evaluate their contributions to footprints (Appendices B–D in the Supplementary material presents fuller details of the data inventory and the calculations), and Supplementary Table D1 presents the main emission factor used.
The mass of fertilizers contributes to MF, and their transportation contributes to CF, estimated using the appropriate emission factors. The fertilizers' production and application emissions were considered in terms of active ingredients only of N, P (P2O5·0.44) and K (K2O·0.83). Empty fertilizer packages were included in the SWF calculation (see Supplementary Table A1).
Irrigation water consumption contributed to WF (total water consumption/t of fruit), to CF (the GHG emissions associated with electricity for water production), and to MF (the input for electricity). The Israeli National Water Company (Shemer, personal communication, November 23, 2020) provided updated information on electricity consumption for local brackish water production (from ancient groundwater basins): 0.6 kW/m3 (for irrigation) and 1.4 kW/m3 for desalinated water (used for sorting in the packing house). Emission factors were taken from Israel Energy Company (2021). Material use was estimated using data from the Israeli Ministry of Energy (Bedell and Glass, 2019) about the standard Israeli mix for electricity generation (natural gas: 64%, coal: 30%, renewables and other: 4.6%) assuming 0.25 kg/material is needed to generate 1 kW (Bedell and Glass, 2019). The Auxiliary equipment, an irrigation-water distribution including computer, fertigation-tank, pipes and valves, and its' electricity demand are included in the research boundaries. In Appendices C,D in Supplementary material some equations and methods of estimations are presented.
The transportation related materials inputs and related emissions included travel distant calculations, the amount of diesel used and related GHG emissions.
Calculated distance included travel distance between the suppliers location to the studied farms, and from the packing houses to the port of Ashdod (refrigerated and non-refrigerated tracks). Also, the distance between the farmer's and workers' homes and the PGH was regarded, usually done by vans and tractors. The amounts of diesel consumed for trucks were based on IEA (2017) information. Emissions from this stage were calculated separately for road transport (packaged fruit, including “round trip”) and sea transportation to the EU market. The sea distance was estimated based on information from Portworld (2016). The relevant emission factors were taken from DEFRA (2016).
Waste management activities were included in the CF and SWF assessments. The organic waste weight assessment was based on a local calculation by Heilig (2006), as described in Appendix C in the Supplementary material. Emissions were estimated using emission factors based on the waste management method: animal feed (for about a third of the biomass) and landfilling (in the absence of clear data on the waste management method). The non-organic waste is taken to designated sites and treated according to strict regulations. Therefore, it was assumed that plastics, wood, steel, etc., are recycled, and that hazardous waste undergoes approved thermal or other treatment. The relevant emission factors were either from the official national database or literature.
The study was conducted in the Central Arava region, the most remote area of the State of Israel, some 130 km from the nearest town, and traversed by a single road. The region has a hyperarid climate: average annual precipitation of 40 mm, high temperatures (from 5 to 42°C), high evaporation (> 300 mm/year), and high soil salinization (Kumar et al., 2018).
The following studied systems characteristics are based on the interviews conducted with the farmers participated in this research and stakeholders from the regional branch of the Ministry of agriculture and rural development.
The region's water supply is based on local brackish wells, and only a limited amount of water is available to each farm. Many farms use huge “water tanks” made of concrete and steel to allow irrigation regardless of occasional interruptions to the main system. A typical PGH is a five-arched steel-frame structure, about 5 m high, anchored in concrete and covered with transparent polycarbonate panels or polyethylene films and polyethylene pest nets (50 mesh). This costly structure protects the plants from pests and harsh weather conditions. It is based on natural ventilation, suitable for cool and sunny winters. The PGH is periodically covered with 30–40% shaded netting to protect the plants from the intense heat. A growing cycle is of about 270 days a year (Israel Ministry of Agriculture Rural Development, 2013).
After the compost is applied, the sandy soil is tilled with tractors, and solar disinfection is carried out by spreading transparent polyethylene sheets on the soil for about 4–5 weeks. In late August-September, tomato seedlings are delivered in polystyrene trays by medium-sized trucks from nurseries (about 200 km from the region). The average planting density is about 1.3 plants/ m2. Then drip irrigation 20–30 m3/(ha.day) begins, increasing to 40 m3/(ha.day) by harvest, with brackish water and a fertilizer mix adapted to soil types and specific soil tests. The plants are trellised up to 18 m while saving space. Minor pesticides are used thanks to systematic, integrated pest management, pest netting, trellises, and greenhouse ventilation, which prevent most hazards. The fruit is harvested in reusable plastic crates packed in disposable cardboard boxes at the sorting and packing facility. A ton of packed fruit is stacked on a wooden pallet, sealed with plastic accessories and transported by cold chain to the seaport of Ashdod and by sea to the European market. In the meantime, the biomass and other waste are taken to the designated place.
The footprint analyses of PGH tomato production systems are presented in three phases: (a) an overall summary of the average total environmental footprints, representing typical local production practices; (b) footprints analysis of each of the four production stages, hotspots in each stage are revealed, and the interactions between the stages are shown; and (c) the differences and similarities between the individual farms are presented to illustrate the trade-off and footprints nexus.
On average, 1 ha of PGH annually produces 146 tons of fruits, of which 141 tons are marketable fruits. On average, the footprints of a ton of marketable tomatoes are 1,040 kg/t (MF), 94 m3/t (WF) and 72 m2/t (LF), and 442 kg/t of solid waste (SWF). The inclusion of all system components throughout the life cycle of the PGH tomato, activities, materials and waste, as shown above, adds up directly and indirectly to CF of 952 kgCO2e/t of fruit and an EF of 243/t gha.
Figure 2 illustrates the share of the different life cycle stages: pre-cultivation, cultivation, processing, and waste management for each footprint indicator. The pre-cultivation stage plays the main role in MF (~976 kg/t) and the CF (~365 kgCO2eq/t). The other production stages contribute similarly to the CF throughout the life cycle of the tomato. The WF is almost entirely attributed to cultivation, as is the SWF.
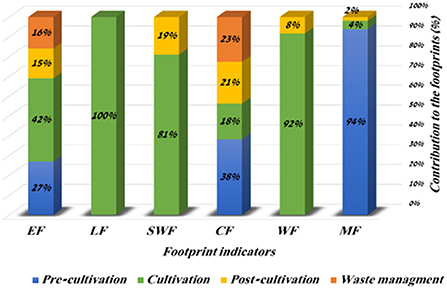
Figure 2. Production stages contribute to footprints. Relative contribution of the four production-stages included in the research to the six footprints indicators. The ratios are expressed in percentage out of the total value of each footprint.
Although located in the same region and use similar infrastructure, the 10 farms (Figure 3) use different amounts of inputs (land, water, materials) and generate a range of environmental footprints, (see Supplementary Table E1, for the full results). This can be explained by the human factor, i.e., farmers practices, materials, energy, and water direct and indirect use.
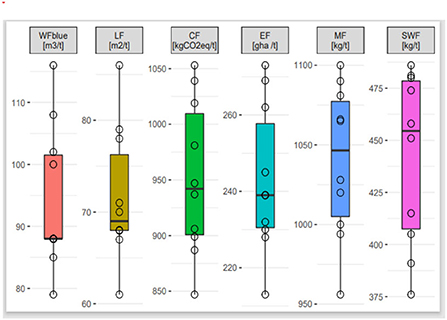
Figure 3. Range of footprints of the 10 tomatoes PGH farms. The full range of the farms' footprints values grouped by the footprints indicators. The colored boxes represent the 25th to 75th percentiles of the results, and the vertical lines denote the 95%. The horizontal lines mark the average value of the footprint, and the circles represent the different farms.
This study only considered the PGH area in the LF, so it is only articulated in the cultivation stage based on the farm's marketable yield. On average, one hectare of PGH yields 146 t of fruit, ranging from 130 to 170 t/ha of which 116–165 t are of marketable fruit. Alternatively, 1 t of marketable tomatoes has a LF of 60–86m2.
Producing a ton of PGH in the studied area requires a variety of material inputs, and it ranges from 956 to 1100 kg material/t fruit, a gap of about 25% between the minimum and maximum values of the farms. In the pre-cultivation phase (the main contributor to the MF), fuels for transportation (accounting for 54% of the material in this stage), has the largest MF share (Figure 4). Transportation of inputs requires most of the fuels (about 48%), 17% of fuels are required to transport fruits, a short distance with refrigerated trucks, and 29% of fuels are for the long sea route. Other materials used are industrial fertilizers and compost (about 160 kg/t), construction materials for the greenhouse structure (about 150 kg/t), coal and gas to generate electricity for water supply (about 65 kg/t), plastic products (about 35 kg/t) diesel for tractor work during cultivation (about 12 l/t), and more. The cultivation and post-cultivation stages have a low raw-material use since the input needed (structure, water, fertilizers, plastic nets etc') was produced in the former stage. The little raw material consumed in these stages (~21–43 kg/t) is mainly for power generation, irrigation system operation, sorting machines, and refrigerator storage.
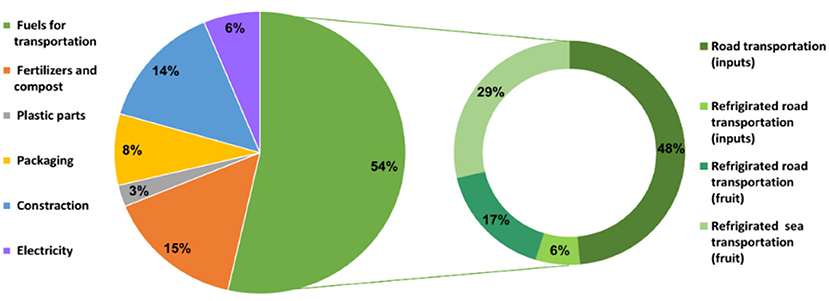
Figure 4. Distribution of major inputs during the life cycle of PGH tomatoes. (Left): Main components relative contributing to the average MF (per ton of greenhouse tomatoes), percentage out of total material inputs. The “electricity” factor refers to the amount of material needed to produce the electricity. (Right): Breakdown of fuel consumption into the main operations and the estimated percentage contribution of each operation to the total fuel inputs throughout the PGH tomatoes' life cycle.
Two types of blue water are needed for tomato cultivation in the region: brackish water from old groundwater basins, which is used for irrigation, and desalinated water, which is used in the packing houses. Both types involve high energy consumption, including pumping, cooling, filtration, and transport. The study revealed that the WF ranges between 79 and 116 m3/t, and almost all the water consumption is due to precise drip irrigation during the cultivation stage.
The production of PGH tomatoes produced various types of solid waste (Appendix C), including organic waste based on empty plants and other biomass, as well as unmarketable fruit (between 2 and 6%, average of 3%), most of them eliminated during the cultivation stage (about 76%), and then in the sorting process, being damaged, cracked or not meeting the market requirements aesthetically (in terms of color, shape and size). The organic waste, constitutes about 42% of the total SWF. Construction material waste (147 kg) contributes another 33% to the SWF, and the remainder comes mainly from plastic parts and packaging waste.
The CF is a result of various activities within the four production stages. Thus, the pre- cultivation stage is responsible for the largest share of CF (Figure 2). About 45% of GHG emissions (~423 kgCO2eq/t) are emitted in the production of inputs consumed in the cultivation stage. Figure 5 presents the main sources contributing to CF: fertilizer (production and application), structure (production and associated end-of-life emissions) and energy intake (about 42% of the total emissions); fuels and electricity. Most of the electricity (Figure 5) is related to water production and the irrigation system, and about 23% is for the operation of machinery, lighting and cold storage in the packing houses. The rest is needed for the water-tank operation, used by all farms in this sample except one. It seems that the use of water tanks increases electricity-related emissions by up to 23% (about 37 kg/t) in the various farms (Supplementary Figure E1).
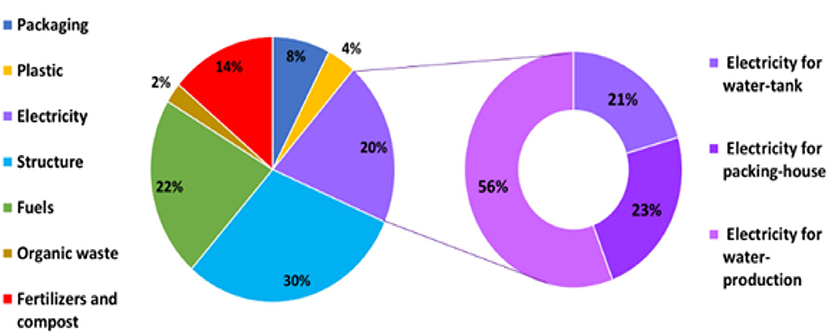
Figure 5. Contributing the main components to the carbon footprint. (Left): Main components relative contributing to the average CF (per ton of PGH tomatoes), percentage out of total contribution. (Right): Breakdown of the emissions from the electricity consumption into the estimated contribution of the main operations to the total kgCO2e-1 emissions from electricity use.
The ecological footprint integrates MF, LF and CF values into a single value. The average EF that we found is significantly larger than the LF; direct area needed to grow tomatoes, as it is based not only on the local area but also on the global area needed to absorb the carbon emissions from the tomato production process. While a significant share of the studied system EF is related to the cultivation stage (42%) the pre and post cultivation stages plus the related waste EF share is even larger (another 58%).
The global demand for tomatoes and their products is expected to rise in the coming years. While different environmental aspects of tomatoes have been studied, only very limited attention was given to tomatoes grown in desert areas. Given the need to supply the growing demand efficiently and more sustainably, exploring the desert potential and environmental implications alongside expected global environmental changes is crucial.
Our findings are consistent with previous studies in other parts of the world, emphasizing that the overall impact is dominated by structure, fuels, fertilizers and water supply (e.g., Page et al., 2011; Torrellas et al., 2012; Bojacá et al., 2014; Ntinas et al., 2017; Canaj et al., 2020). The environmental footprints of tomatoes in the studied region were within the values reported in the literature, despite the extreme conditions and relatively low yield.
The marketable yield we found was in the lower range of values reported in previous desert studies and growing-medias (e.g., Martínez-Blanco et al., 2011; Page et al., 2012; Torrellas et al., 2012; Almeida et al., 2014; Bojacá et al., 2014; Del Borghi et al., 2014; Clavreul et al., 2017; Dias et al., 2017; Ntinas et al., 2017; Canaj et al., 2020; Hu et al., 2021; Torres Pineda et al., 2021). With the rather low yields, the local tomatoes LF is in the upper range of results found in Northern Europe and the UK (Lagerberg-Fogelberg and Carlsson-Kanyama, 2006; Williams et al., 2006), but lower than Italian tomato (e.g., Del Borghi et al., 2014). As there is plenty of unused land in the hyper-arid zones, including the Central Arava, this may not be perceived as a major drawback (Medina et al., 2006). However, space is not unlimited, and the environmental impacts should be considered (Medina et al., 2006).
The relatively low yield observed in the study can be explained by the disadvantage of the extreme climatic conditions and the short harvesting season, which ends no later than April, when the heat accumulates in the PGHs damaging the fruit's quality. The low price of the inferior fruit does not justify the cost of irrigation, packaging, human labor, etc., especially because the tomatoes have already been harvested in the colder regions. As a result, the irrigation is turned off, and the plants are sheared. The leftover fruit on the plants was regarded in our study as organic waste.
The yield discrepancies might also be due to the system boundaries defined by other studies. For example, whereas the current analysis exclusively examined marketable yield (as did Martínez-Blanco et al., 2011; Ntinas et al., 2017; Ronga et al., 2019), other studies did not specify what was considered in their yield estimates. The definitions of the system boundaries affect more than just the yield values, so a direct comparison of the results with those of other studies is limited.
However, as the CF and the WF are among the most comprehensively studied impact categories (Clune et al., 2017; Deepa et al., 2021), these footprints can be selected for a more comprehensive comparison (Dias et al., 2017).
The CF of the local tomatoes found to be within the ranges established in prior research for various growth mediums and locations. The CF of tomatoes varies greatly, with open field tomatoes (as in Del Borghi et al., 2014; Clavreul et al., 2017) having a lower CF than PGH tomatoes (e.g., Bojacá et al., 2014; Torres Pineda et al., 2021) and heated greenhouses (e.g., Torrellas et al., 2012; Dias et al., 2017) have the highest value, up to 4–5 times higher than PGH (Boulard et al., 2011). The CF is primarily affected by emissions from the production and application of material inputs and irrigation water. The pesticides were found negligible (Boulard et al., 2011; Torrellas et al., 2012; Bjørn et al., 2020) and the amounts of packaging material in the current study were similar or lower than reported in the literature (e.g., Cellura et al., 2012).
The WF in the present study reflects a disadvantage of desert agriculture, as high temperatures, evaporation, and soil salinization require excessive irrigation. Nevertheless, the WFblue estimates for local tomato (85–116 m3/t−1) found to be within the wide-range greenhouse tomato's water intake found in previous studies (e.g., Chapagain and Orr, 2009; Almeida et al., 2014; Bojacá et al., 2014; Del Borghi et al., 2014; Garofalo et al., 2017; Hueso-Kortekaas et al., 2021). Using only drip irrigation (i.e., advanced technology), an optimal irrigation method in drylands (e.g., Chukalla et al., 2015; Hu et al., 2021), the local WF is not as high as it could be. Yet, there is room for improvement as some farmers in the study used lower amounts of water and achieved high yields. In fact, the high correlation between the WF and the LF suggests that high irrigation volume is connected with lower marketable yield (Supplementary Tables C1, F1).
The waste treatment stage accounts for about a quarter of tomatoes CF, and SWF comes mainly from the cultivation stage due to discarded structures (concrete and steel) and organic waste. The latter ranged from 20 to 60 kg/t of fruit, similar to the 22–50 kg/t of fruit reported by Cellura et al. (2012) and Garofalo et al. (2017), but higher than the 5% fruit loss found by Röös and Karlsson (2013). Small amount of organic waste was generated during the post-cultivation phase, which is consistent with other studies (e.g., Röös and Karlsson, 2013; Liu et al., 2019). Packaging materials and empty containers, bottles and other plastic items contributed to the volume of waste (SWF) but had little impact on the CF (e.g., Torrellas et al., 2012; Liu et al., 2019) due to rigorous waste management practices in the region. Yet, the SWF can be further reduced, for example, by minimizing food losses due to aesthetic parameters (e.g., Hueso-Kortekaas et al., 2021) and setting effective organic waste management methods.
The EF in this study was much higher than the LF, the actual direct local land use (in line with Niccolucci et al., 2008). Fruit production in the local system requires additional land globally, especially forest land, to absorb the carbon released during the tomato's life cycle. Previous research has shown that greenhouse tomatoes have a higher EF than open field cultivation, and heated structures increase EF by 24% (Stajnko et al., 2016). In addition, road transport of the fruit (1,400 km) exceeds the cultivation phase EF by 200% (Stajnko et al., 2016), findings that are consistent with this study, which identifies the negative environmental impacts of road transport that contribute to CF and EF local tomato, as was found for other fruit (e.g., Muñoz Torres et al., 2022).
Some footprints (CF, MF, and SWF) were found to have a much wider range of values than others. The sources of variability are influenced by distance, soil properties, and human factors, such as cultivation methods like irrigation, fertilization, pruning, and trellising (e.g., Evangelou et al., 2016; Lam et al., 2018). The system's CF can be reduced by advocating clean energy and solar energy in particular (e.g., Garofalo et al., 2017; Lares-Michel et al., 2018; Xie et al., 2018; Dos Santos, 2020; Hollingsworth et al., 2020; Winans et al., 2020) for the various operation. Under local conditions, this technology has even more advantages than in other areas. The dry, arid climate, characterized by strong sunlight all year round, is natural for photovoltaic systems. A well-known disadvantage of such a system is the space it takes up. Installing the system over existing structures avoids this negative effect (see: Weselek et al., 2019; Hollingsworth et al., 2020). While in cool climates, it is less desirable to place a PV system on top of the growing structure, as too much light is blocked (Hollingsworth et al., 2020), it has many benefits in warm areas. As such, the additional shade increases yield reduces evaporation and pest development and improves the PV system performance due to the cooling effect of the underlying plants (e.g., Ezzaeri et al., 2018; Weselek et al., 2019, 2021; Barron-Gafford et al., 2019). Furthermore, this clean energy can enable installing a cooling system in the greenhouse to increase yields and extend the growing season without significantly impacting the environment (Waller et al., 2021).
A major disadvantage of the hyper-arid food system, as reflected in CF and MF, is poor soil quality, which requires high rates of fertilizers. Nevertheless, no clear correlation was found between the amount of fertilizers used by the different studied farms to the yield (in line with Winans et al., 2020). Therefore, it seems possible to change the type of fertilizer and thus reduce its quantity and/or its negative environmental impact (Martínez-Blanco et al., 2011; Clavreul et al., 2017; Garofalo et al., 2017; Winans et al., 2020) without apparent damage to the yield. The same principle applies to other materials that can and should be cleaner and in smaller amounts. Especially since large quantities of (any) inputs result in a lot of solid waste for packaging and require many and frequent road transports to and from farms, which means higher fuel consumption (Figure 4) and GHG emissions (e.g., Hueso-Kortekaas et al., 2021). The latter highlights the need for alternative, “greener” modes of transport, like trains and clean energy vehicles (Hueso-Kortekaas et al., 2021) and ways to minimize unnecessary travel associated with agricultural activities in the remote marginal, desert, and non-desert regions. Maritime transport was found to contribute less to environmental impacts, and international shipping distance (i.e., food miles) does not necessarily mean a larger footprint, an idea that has been discussed before (e.g., Carlsson-Kanyama, 1998; Coley et al., 2011; Kissinger, 2012; Kissinger et al., 2019; Muñoz Torres et al., 2022).
Carlsson-Kanyama (1998) analyzed the environmental impact of importing tomatoes to Sweden and concluded that it is influenced by two factors: greenhouse heating (not used in the present study location) and the mode of transport. Considering this and the reasonable footprint values found in this study compared to other studies, importing and consuming Israeli tomatoes in other countries could have an environmental advantage over domestic tomatoes. Table 1 simulates the potential environmental impact of exporting Arava tomatoes to five overseas destinations compared to tomatoes grown in those countries.
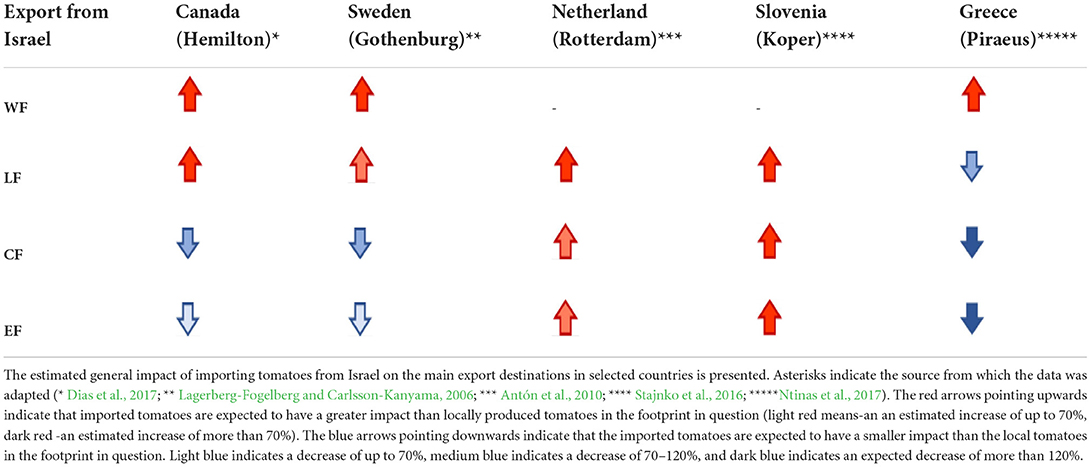
Table 1. Estimating the footprint of imported tomatoes compared to local production.
Production location does not ensure quality or safety of foods, nor that products have a low environmental impact or include social responsibility attributes (Muñoz Torres et al., 2022). Kissinger et al. (2019) assessed the level of environmental advantage of local goods over imported ones, from an “absolute advantage” (when the local product has a smaller footprint in all biophysical categories) to “no local advantage” - none of the local good's footprints' were smaller than that of the imported ones. Following this notion, the local tomatoes have only a partial advantage (Kissinger et al., 2019) compared to tomatoes imported from Israel, a much hotter overseas producing country, as the latter can significantly reduce CF followed by EF (in line with Carlsson-Kanyama, 1998). This is an advantage of arid agriculture.
In Central Europe, where temperatures are milder, the local tomatoes have an absolute advantage over the Israeli fruit, which appears to boost the CF and EF by at least 70%. The local tomatoes in Greece, for example, seem to have a single footprint indicator advantage (Kissinger et al., 2019) compared to the tomatoes from Israel. Here, importing tomatoes from locations with similar (or less sophisticated) technology and inputs but higher yields may reduce the LF, EF, and CF of tomatoes consumed. This is not the case for WF since the major drawback of hyper-arid environments is water shortage, which imposes a high-water demand. Exporting tomatoes to non-arid regions harms WF in all simulations. The idea of trade-off becomes evident at this stage. As a result, such imports can be advisable if policymakers wish to reduce CF and EF, but not if the aim is to reduce WF. However, assuming that an alternate, “greener” supply of water (e.g., treated wastewater, solar base, desalinated water) is available and that freshwater is not depleted, this option could be considered a sustainable alternative and advantage of the studied desert area food system. It is clear, that the policy-makers decision whether to import foods or to encourage local production should be based on varied sustainability considerations, and there is no clear recommendation (Muñoz Torres et al., 2022).
By examining a range of footprints, as suggested and illustrated here, it is possible to assess the source of different environmental impacts within the product life cycle and highlight the trade-off between footprints that sometimes occur at different production stages. The research identified several environmental hotspots, some universal (water, fossil energy, fertilizer, structure, road transport) and other case specific related to the physical/climatic conditions which dictate some practices, or result from farmers' decisions, experiences, and preferences.
Advancing some measures can reduce the studied systems environmental footprints. These include the use of organic fertilizers, alternative water sources, and structures made of biodegradable, recycled materials or with advanced specifications that extend their life. Under local climatic conditions, PV solar-based electricity systems can be an appropriate response to some of the major sources of environmental stress identified in this analysis. The unfavorable desert climate offers some advantages highlighted in this study, some in the form of avoided burden, such as the sparing of Rockwool beds and fossil energy-consuming artificial heating, and others due to responsible agri-environmental policies, such as integrated pest management, strict rules for the disposal of inorganic waste and the exclusive use of drip irrigation.
Finally, although desert food production has some substantial environmental footprints, this can be reduced. It can be achieved by addressing the above issues, by continuous research and policymakers, scientists and farmers working together. While further research is needed, the research presented here implies that desert agriculture can be more sustainable and support both the local community and global food security.
The original contributions presented in the study are included in the article/Supplementary material, further inquiries can be directed to the corresponding author.
SW and MK: conceptualization, methodology, investigation, writing—original draft, and writing—review and editing. MK: funding acquisition and supervision. All authors contributed to the article and approved the submitted version.
This work was supported by the Israeli Ministry of Agriculture and Rural Development, the Yad-Hanadiv Foundation, the BGU Kreitman School for Advanced Studies, and the Yair Guron Scholarship Fund.
The authors would like to thank the Israeli Ministry of Agriculture and Rural Development and the Yair Giron Scholarship Fund for supporting the research presented in this manuscript. We thank the farmers and other stakeholders that took part in the research and provided valuable data.
The authors declare that the research was conducted in the absence of any commercial or financial relationships that could be construed as a potential conflict of interest.
All claims expressed in this article are solely those of the authors and do not necessarily represent those of their affiliated organizations, or those of the publisher, the editors and the reviewers. Any product that may be evaluated in this article, or claim that may be made by its manufacturer, is not guaranteed or endorsed by the publisher.
The Supplementary Material for this article can be found online at: https://www.frontiersin.org/articles/10.3389/fsufs.2022.994920/full#supplementary-material
#, number; LCA, Life cycle assessment; CF, carbon footprint; LF, land footprint; EF, ecological footprint; m2, square meter; EU, European Union; m3, cubic meter; gha, global ha; m, meter; GHG, greenhouse gases; MF, Material footprint; Ha, hectare; PGH, passive greenhouse; CO2e, carbon dioxide equivalent; PV, photovoltaic; kg, kilogram; SWF, solid waste footprint; kWh, kilowatt per hour; t−1, ton; l, liter; WF, water footprint.
Aldaya, M. M., and Hoekstra, A. Y. (2010). The water needed for Italians to eat pasta and pizza. Agric. Syst. 103, 351–360. doi: 10.1016/j.agsy.2010.03.004
Almeida, J., Achten, W. M. J., Verbist, B., Heuts, R. F., Schrevens, E., and Muys, B. (2014). Carbon and water footprints and energy use of greenhouse tomato production in Northern Italy. J. Ind. Ecol. 18, 898–908. doi: 10.1111/jiec.12169
Al-Muaini, A., Sallam, O. M., Green, S., Kennedy, L., Kemp, P., and Clothier, B. (2019). The blue and grey water footprints of date production in the saline and hyper-arid deserts of United Arab Emirates. Irrig. Sci. 37, 657–667. doi: 10.1007/s00271-019-00642-6
Antón, A., Torrellas, M., Montero, J. I., Ruijs, M., Vermeulen, P., and Stanghellini, C. (2010). “Environmental impact assessment of Dutch tomato crop production in a Venlo glasshouse,” in XXVIII International Horticultural Congress on Science and Horticulture for People (IHC2010): International Symposium on 927 (Lisbon), 781–791.
Barron-Gafford, G. A., Pavao-Zuckerman, M. A., Minor, R. L., Sutter, L. F., Barnett-Moreno, I., Blackett, D. T., et al. (2019). Agrivoltaics provide mutual benefits across the food-energy-water nexus in drylands. Nat. Sustain. 2, 848–855. doi: 10.1038/s41893-019-0364-5
Bedell, D., and Glass, A. (2019). Israel Energy Sector 2019. Available online at: https://www.gov.il/BlobFolder/reports/energy_sector_2019/he/energy_sector_review_2019.pdf (accessed September 15, 2022).
Ben-Gal, A., Tal, A., and Tel-Zur, N. (2006). The sustainability of arid agriculture: trends and challenges. Ann. Arid Zone 45, 227. Available online at: https://citeseerx.ist.psu.edu/viewdoc/download?doi=10.1.1.505.8475&rep=rep1&type=pdf
Bjørn, A., Sim, S., Boulay, A.-M., King, H., Clavreul, J., Lam, W. Y., et al. (2020). A planetary boundary-based method for freshwater use in life cycle assessment: development and application to a tomato production case study. Ecol. Indic. 715, 136813. doi: 10.1016/j.ecolind.2019.105865
Bojacá, C. R., Wyckhuys, K. A. G., and Schrevens, E. (2014). Life cycle assessment of Colombian greenhouse tomato production based on farmer-level survey data. J. Clean. Prod. 69, 26–33. doi: 10.1016/j.jclepro.2014.01.078
Boulard, T., Raeppel, C., Brun, R., Lecompte, F., Hayer, F., Carmassi, G., et al. (2011). Environmental impact of greenhouse tomato production in France. Agron. Sustain. Dev. 31, 757–777. doi: 10.1007/s13593-011-0031-3
Canaj, K., Mehmeti, A., Cantore, V., and Todorović, M. (2020). LCA of tomato greenhouse production using spatially differentiated life cycle impact assessment indicators: an albanian case study. Environ. Sci. Pollut. Res. 27, 6960–6970. doi: 10.1007/s11356-019-07191-7
Canene-Adams, K., Campbell, J. K., Zaripheh, S., Jeffery, E. H., and Erdman, J. W Jr. (2005). The tomato as a functional food. J. Nutr. 135, 1226–1230. doi: 10.1093/jn/135.5.1226
Carlsson-Kanyama, A. (1998). Food consumption patterns and their influence on climate change: greenhouse gas emissions in the life-cycle of tomatoes and carrots consumed in sweden. Ambio 27, 528–534.
Cellura, M., Longo, S., and Mistretta, M. (2012). Life cycle assessment (LCA) of protected crops: an Italian case study. J. Clean. Prod. 28, 56–62. doi: 10.1016/j.jclepro.2011.10.021
Central Arava Regional Council (2017). The Agriculture Commity. Annual Crops Report (2016-2017). (In Hebrew). Available online at: https://www.arava.co.il/14806/ (accessed April 2, 2022).
Chapagain, A. K., and Hoekstra, A. Y. (2004). Water footprints of nations, volume 1: main report. Value of water research series no. 16. Paris: (Delft: UNESCO-IHP).
Chapagain, A. K., and Orr, S. (2009). An improved water footprint methodology linking global consumption to local water resources: a case of Spanish tomatoes. J. Environ. Manage. 90, 1219–1228. doi: 10.1016/j.jenvman.2008.06.006
Chukalla, A. D., Krol, M. S., and Hoekstra, A. Y. (2015). Green and blue water footprint reduction in irrigated agriculture: effect of irrigation techniques, irrigation strategies and mulching. Hydrol. Earth Syst. Sci. 19, 4877–4891. doi: 10.5194/hess-19-4877-2015
Clavreul, J., Butnar, I., Rubio, V., and King, H. (2017). Intra-and inter-year variability of agricultural carbon footprints–a case study on field-grown tomatoes. J. Clean. Prod. 158, 156–164. doi: 10.1016/j.jclepro.2017.05.004
Clune, S., Crossin, E., and Verghese, K. (2017). Systematic review of greenhouse gas emissions for different fresh food categories. J. Clean. Prod. 140, 766–783. doi: 10.1016/j.jclepro.2016.04.082
Coley, D., Howard, M., and Winter, M. (2011). Food miles: time for a re-think? Br. Food J. 113, 919–934. doi: 10.1108/00070701111148432
Deepa, R., Anandhi, A., and Alhashim, R. (2021). Volumetric and impact-oriented water footprint of agricultural crops: a review. Ecol. Indic. 130, 108093. doi: 10.1016/j.ecolind.2021.108093
DEFRA (2016). UK Government GHG Conversion Factors for Company Reporting. Available online at: https://www.gov.uk/government/collections/government-conversion-factors-for-company-reporting (accessed November 13, 2016).
Del Borghi, A., Gallo, M., Strazza, C., and Del Borghi, M. (2014). An evaluation of environmental sustainability in the food industry through life cycle assessment: the tomato products supply chain case study. J. Clean. Prod. 78, 121–130. doi: 10.1016/j.jclepro.2014.04.083
Deng, X.-P., Shan, L., Zhang, H., and Turner, N. C. (2006). Improving agricultural water use efficiency in arid and semi-arid areas of China. Agric. Water Manag. 80, 23–40. doi: 10.1016/j.agwat.2005.07.021
Dias, G. M., Ayer, N. W., Khosla, S., Van Acker, R., Young, S. B., Whitney, S., et al. (2017). Life cycle perspectives on the sustainability of Ontario greenhouse tomato production: Benchmarking and improvement opportunities. J. Clean. Prod. 140, 831–839. doi: 10.1016/j.jclepro.2016.06.039
Dos Santos, C. N. L. (2020). Agrivoltaic System: A Possible Synergy Between Agriculture and Solar Energy Dissertation). Available online at: http://urn.kb.se/resolve?urn=urn:nbn:se:kth:diva-272965 (accessed September 15, 2022).
ecoinvent Center. (2019). Environmental Footprint Initiative. Available online at: https://www.ecoinvent.org/about/projects/environmental-footprint-project/environmental-footprint-data.html (accessed December 21, 2019).
Eurostat (2018). Economy-Wide Material Flow Accounts Handbook. Available online at: https://ec.europa.eu/eurostat/web/products-manuals-and-guidelines/-/ks-gq-18-006 (acessed September 15, 2022).
Evangelou, E., Tsadilas, C., Tserlikakis, N., Tsitouras, A., and Kyritsis, A. (2016). Water footprint of industrial tomato cultivations in the pinios river basin: soil properties interactions. Water 8, 1–13. doi: 10.3390/w8110515
Ezzaeri, K., Fatnassi, H., Bouharroud, R., Gourdo, L., Bazgaou, A., Wifaya, A., et al. (2018). The effect of photovoltaic panels on the microclimate and on the tomato production under photovoltaic canarian greenhouses. Solar Energy 173, 1126–1134. doi: 10.1016/j.solener.2018.08.043
Fang, K., Heijungs, R., and de Snoo, G. R. (2014). Theoretical exploration for the combination of the ecological, energy, carbon, and water footprints: overview of a footprint family. Ecol. Indic. 36, 508–518. doi: 10.1016/j.ecolind.2013.08.017
FAO (2018). The Future of Food and Agriculture – Alternative Pathways To 2050. Rome, 224. Available online at: https://www.fao.org/3/CA1553EN/ca1553en.pdf
FAO (2020). Transforming Food and Agriculture to Achieve The Sdgs: 20 Interconnected Actions to Guide Decision-Makers. Available online at: http://www.fao.org/3/I9900EN/i9900en.pdf (accessed February 2, 2022).
FAO (2022). Land and Water. Tomato. Available online at: https://www.fao.org/land-water/databases-and-software/crop-information/tomato/en/ (accessed February 24, 2022).
FAOSTAT (2022). Crops Production Quantity. Available online at: http://www.fao.org/faostat/en/#data/QC (accessed February 2, 2022).
Fridman, D., Biran, N., and Kissinger, M. (2021). Beyond blue: an extended framework of blue water footprint accounting. Sci. Total Environ. 777, 146010. doi: 10.1016/j.scitotenv.2021.146010
Galli, A., Wiedmann, T., Ercin, E., Knoblauch, D., Ewing, B., and Giljum, S. (2012). Integrating ecological, carbon and water footprint into a “footprint family” of indicators: definition and role in tracking human pressure on the planet. Ecol. Indic. 16, 100–112. doi: 10.1016/j.ecolind.2011.06.017
Garofalo, P., D'Andrea, L., Tomaiuolo, M., Venezia, A., and Castrignanò, A. (2017). Environmental sustainability of agri-food supply chains in Italy: The case of the whole-peeled tomato production under life cycle assessment methodology. J. Food Eng. 200, 1–12. doi: 10.1016/j.jfoodeng.2016.12.007
Giljum, S., Burger, E., Hinterberger, F., Lutter, S., and Bruckner, M. (2011). A comprehensive set of resource use indicators from the micro to the macro level. Resour. Conserv. Recycl. 55, 300–308. doi: 10.1016/j.resconrec.2010.09.009
Heilig, A. (2006). Agricultural Waste Management in the Arava. (In Hebrew). The Central Arava Regional Council.
Hoekstra, A. Y., Chapagain, A., Martinez-Aldaya, M., and Mekonnen, M. (2011). The Water Footprint Assessment Manual; Setting the Global Standard. Earthscan. Available online at: https://digitalcommons.unl.edu/cgi/viewcontent.cgi?article=1069&context=wffdocs (accessed September 15, 2022).
Hollingsworth, J. A., Ravishankar, E., O'Connor, B., Johnson, J. X., and DeCarolis, J. F. (2020). Environmental and economic impacts of solar-powered integrated greenhouses. J. Ind. Ecol. 24, 234–247. doi: 10.1111/jiec.12934
Hu, J., Gettel, G., Fan, Z., Lv, H., Zhao, Y., Yu, Y., et al. (2021). Drip fertigation promotes water and nitrogen use efficiency and yield stability through improved root growth for tomatoes in plastic greenhouse production. Agric. Ecosyst. Environ. 313, 107379. doi: 10.1016/j.agee.2021.107379
Hueso-Kortekaas, K., Romero, J. C., and González-Felipe, R. (2021). Energy-environmental impact assessment of greenhouse grown tomato: a case study in Almeria (Spain). World 2, 425–441. doi: 10.3390/world2030027
IEA (2017). The Future of Trucks Implications for Energy and The Environment. Executive Summary. Available online at: https://euagenda.eu/upload/publications/untitled-93874-ea.pdf (accessed May 8, 2018).
IPCC (2001). Summary for Policymakers. PPCC WG1 Third Assessment Report. Available online at: http://www.ipcc.ch (accesses June 21, 2020).
Israel Energy Company (2021). Carbon Footprint Calculator. Available online at: https://www.iec.co.il/environment/pages/pollcalculator.aspx (accessed July 5, 2021).
Israel Ministry of Agriculture Rural Development (2013). Policy, Instructions and Criterias for Agricultural Structures. (In Hebrew). Available online at: https://www.moag.gov.il/yhidotmisrad/reshut_technun/technun_kafri/publication/2013/Documents/agricultural_structures.pdf (accessed April 2, 2022).
Kissinger, M. (2012). International trade-related food miles – the case of Canada. Food Policy 37, 171–178. doi: 10.1016/j.foodpol.2012.01.002
Kissinger, M., Sussmann, C., Dorward, C., and Mullinix, K. (2019). Local or global: a biophysical analysis of a regional food system. Renew. Agric. Food Syst. 34, 523–533. doi: 10.1017/S1742170518000078
Kumar, A., Elad, Y., Tsechansky, L., Abrol, V., Lew, B., Offenbach, R., et al. (2018). Biochar potential in intensive cultivation of Capsicum annuum L. (sweet pepper): crop yield and plant protection. J. Sci. Food Agric. 98, 495–503. doi: 10.1002/jsfa.8486
Lagerberg-Fogelberg, C., and Carlsson-Kanyama, A. (2006). “Environmental assessment of foods–an LCA inspired approach,” in Environmental Information in the Food Supply System. Report: FOI, eds C. Fuentes and A. Carlsson-Kanyama (FOI - Swedish Defence Research Agency), 55–84.
Lam, W. Y., van Zelm, R., Ben-L3pez, A., Kulak, M., Sim, S., King, J. M. H., et al. (2018). Variability of greenhouse gas footprints of field tomatoes grown for processing: interyear and intercountry assessment. Environ. Sci. Technol. 52, 135–144. doi: 10.1021/acs.est.7b04361
Lares-Michel, M., Housni, F. E., Cervantes, V. G. A., Nava, R. M. M., Del Toro, H. B., Cañedo, C. L., et al. (2018). The relationship between consumption, socioeconomic level and reasons of tomato intake in Mexico. Agric. Sci. 9, 777–791. doi: 10.4236/as.2018.97055
Lettenmeier, M., Rohn, H., Liedtke, C., Schmidt-Bleek, F., Bienge, K., Urbaneja, D. M., et al. (2009). Resource Productivity in 7 Steps: How to Develop Eco-innovative Products and Services and Improve Their Material Footprint (Vol. 41). Wuppertal Spezial. Available online at: https://www.econstor.eu/bitstream/10419/59292/1/716261502.pdf (accessed December 21, 2019).
Liu, G., Xue, L., Cao, Z., Prass, N., Gollnow, S., Davis, J., et al. (2019). Integration of LCC and LCA Results to Higher System Levels : The German Meat and EU Tomato Cases. Wageningen.
Maaoui, M., Boukchina, R., and Hajjaji, N. (2020). Environmental life cycle assessment of Mediterranean tomato: case study of a Tunisian soilless geothermal multi-tunnel greenhouse. Environ. Dev. Sustain. 23, 1242–1263. doi: 10.1007/s10668-020-00618-z
MacDonald, G. K., Brauman, K. A., Sun, S., Carlson, K. M., Cassidy, E. S., Gerber, J. S., et al. (2015). Rethinking agricultural trade relationships in an era of globalization. Bioscience 65, 275–289. doi: 10.1093/biosci/biu225
Martí, R., Leiva-Brondo, M., Lahoz, I., Campillo, C., Cebolla-Cornejo, J., and Roselló, S. (2018). Polyphenol and l-ascorbic acid content in tomato as influenced by high lycopene genotypes and organic farming at different environments. Food Chem. 239, 148–156. doi: 10.1016/j.foodchem.2017.06.102
Martínez-Blanco, J., Muñoz, P., Antón, A., and Rieradevall, J. (2011). Assessment of tomato Mediterranean production in open-field and standard multi-tunnel greenhouse, with compost or mineral fertilizers, from an agricultural and environmental standpoint. J. Clean. Prod. 19, 985–997. doi: 10.1016/j.jclepro.2010.11.018
Medina, A., Cooman, A., Parrado, C. A., and Schrevens, E. (2006). Evaluation of energy use and some environmental impacts for greenhouse tomato production in the high altitude tropics. Acta Hortic. 718, 415–421. doi: 10.17660/ActaHortic.2006.718.48
Muñoz Torres, M. J., Fernández-Izquierdo, M. Á., Ferrero-Ferrero, I., Escrig-Olmedo, E., and Rivera-Lirio, J. M. (2022). Transitioning the agri-food system. Does closeness mean sustainability? how production and shipping strategies impact socially and environmentally. Comparing Spain, South Africa and U.S. citrus fruit productions. Agroecol. Sustain. Food Syst. 46, 540–577. doi: 10.1080/21683565.2022.2039835
Niccolucci, V., Galli, A., Kitzes, J., Pulselli, R. M., Borsa, S., and Marchettini, N. (2008). Ecological footprint analysis applied to the production of two Italian wines. Agric. Ecosyst. Environ. 128, 162–166. doi: 10.1016/j.agee.2008.05.015
Nicola, S., Pignata, G., Ferrante, A., Bulgari, R., Cocetta, G., and Ertani, A. (2020). Water use efficiency in greenhouse systems and its application in horticulture. AgroLife Sci. J. 9, 248–262.
Ntinas, G. K., Neumair, M., Tsadilas, C. D., and Meyer, J. (2017). Carbon footprint and cumulative energy demand of greenhouse and open-field tomato cultivation systems under Southern and Central European climatic conditions. J. Clean. Prod. 142, 3617–3626. doi: 10.1016/j.jclepro.2016.10.106
Onozaka, Y., Hu, W., and Thilmany, D. D. (2016). Can eco-labels reduce carbon emissions? Market-wide analysis of carbon labeling and locally grown fresh apples. Renew. Agric. Food Syst. 31, 122–138. doi: 10.1017/S174217051500006X
Page, G., Ridoutt, B., and Bellotti, B. (2011). Fresh tomato production for the Sydney market: an evaluation of options to reduce freshwater scarcity from agricultural water use. Agric. Water Manag. 100, 18–24. doi: 10.1016/j.agwat.2011.08.017
Page, G., Ridoutt, B., and Bellotti, B. (2012). Carbon and water footprint trade-offs in fresh tomato production. J. Clean. Prod. 32, 219–226. doi: 10.1016/j.jclepro.2012.03.036
Plaza-Bonilla, D., Arrúe, J. L., Cantero-Martínez, C., Fanlo, R., Iglesias, A., and Álvaro-Fuentes, J. (2015). Carbon management in dryland agricultural systems. A review. Agron. Sustain. Dev. 35, 1319–1334.? doi: 10.1007/s13593-015-0326-x
Portworld (2016). Distance Calculation. Available online at: www.portworld.com/mapQ
Ronga, D., Gallingani, T., Zaccardelli, M., Perrone, D., Francia, E., Milc, J., et al. (2019). Carbon footprint and energetic analysis of tomato production in the organic vs the conventional cropping systems in Southern Italy. J. Clean. Prod. 220, 836–845. doi: 10.1016/j.jclepro.2019.02.111
Röös, E., and Karlsson, H. (2013). Effect of eating seasonal on the carbon footprint of Swedish vegetable consumption. J. Clean. Prod. 59, 63–72. doi: 10.1016/j.jclepro.2013.06.035
Rotz, C. A., Asem-Hiablie, S., Place, S., and Thoma, G. (2019). Environmental footprints of beef cattle production in the United States. Agric. Syst. 169, 1–13. doi: 10.1016/j.agsy.2018.11.005
Stajnko, D., Narodoslawsky, M., and Lakota, M. (2016). Ecological footprints and CO2 emissions of tomato production in Slovenia. Pol. J. Environ. Stud. 25, 1233–1243. doi: 10.15244/pjoes/61757
Stanhill, G. (1980). The energy cost of protected cropping: a comparison of six systems of tomato production. J. Agric. Eng. Res. 25, 145–154. doi: 10.1016/0021-8634(80)90055-4
Steen-Olsen, K., Weinzettel, J., Cranston, G., Ercin, A. E., and Hertwich, E. G. (2012). Carbon, land, and water footprint accounts for the European Union: consumption, production, and displacements through international trade. Environ. Sci. Technol. 46, 10883–10891. doi: 10.1021/es301949t
Torrellas, M., Antón, A., Ruijs, M., García Victoria, N., Stanghellini, C., and Montero, J. I. (2012). Environmental and economic assessment of protected crops in four European scenarios. J. Clean. Prod. 28, 45–55. doi: 10.1016/j.jclepro.2011.11.012
Torres Pineda, I., Lee, Y. D., Kim, Y. S., Lee, S. M., and Park, K. S. (2021). Review of inventory data in life cycle assessment applied in production of fresh tomato in greenhouse. J. Clean. Prod. 282, 124395. doi: 10.1016/j.jclepro.2020.124395
UNCCD (2018). Sustainable Land Management (SLM). Available online at: http://knowledge.unccd.int/topics/sustainable-land-management-slm (accessed June 21, 2020).
Vanham, D., Leip, A., Galli, A., Kastner, T., Bruckner, M., Uwizeye, A., et al. (2019). Environmental footprint family to address local to planetary sustainability and deliver on the SDGs. Sci. Total Environ. 693, 133642. doi: 10.1016/j.scitotenv.2019.133642
Wackernagel, M., Monfreda, C., Moran, D., Wermer, P., Goldfinger, S., Deumling, D., et al. (2005). National footprint and biocapacity accounts 2005: the underlying calculation method. Land Use Policy. 21, 231–246 . Available online at: https://elearning.humnet.unipi.it/pluginfile.php/101792/mod_resource/content/0/Footprint%20Method%202005.pdf (accessed September 2, 2022).
Waller, R., Kacira, M., Magadley, E., Teitel, M., and Yehia, I. (2021). Semi-transparent organic photovoltaics applied as greenhouse shade for spring and summer tomato production in arid climate. Agronomy 11, 1152. doi: 10.3390/agronomy11061152
Weselek, A., Bauerle, A., Hartung, J., Zikeli, S., Lewandowski, I., and Högy, P. (2021). Agrivoltaic system impacts on microclimate and yield of different crops within an organic crop rotation in a temperate climate [Article]. Agron. Sustain. Dev. 41. doi: 10.1007/s13593-021-00714-y
Weselek, A., Ehmann, A., Zikeli, S., Lewandowski, I., Schindele, S., and Högy, P. (2019). Agrophotovoltaic systems: applications, challenges, and opportunities. A review. Agron. Sustain. Dev. 39, 1–20. doi: 10.1007/s13593-019-0581-3
Wiedmann, T., and Minx, J. (2008). “A definition of carbon footprint,” in Ecological Economics Research Trends Vol. 1 (NY, USA: Nova Science Publishers Hauppauge). Available online at: https://citeseerx.ist.psu.edu/viewdoc/download?doi=10.1.1.467.6821&rep=rep1&type=pdf (accessed September 1, 2022).
Williams, A., Audsley, E., and Sandars, D. (2006). Determining the Environmental Burdens and Resource Use in the Production of Agricultural and Horticultural Commodities: Defra Project Report IS0205. Bedford: Cranfield University and Defra. Available online at: http://www.defra.gov.uk (accessed September 15, 2022).
Winans, K., Brodt, S., and Kendall, A. (2020). Life cycle assessment of California processing tomato: an evaluation of the effects of evolving practices and technologies over a 10-year (2005–2015) timeframe. Int. J. LCA. 25, 538–547. doi: 10.1007/s11367-019-01688-6
Keywords: desert food system, environmental footprint family, tomatoes, life cycle assessment, passive greenhouse
Citation: Wyngaard SR and Kissinger M (2022) Tomatoes from the desert: Environmental footprints and sustainability potential in a changing world. Front. Sustain. Food Syst. 6:994920. doi: 10.3389/fsufs.2022.994920
Received: 15 July 2022; Accepted: 30 August 2022;
Published: 13 October 2022.
Edited by:
Claudia Marques-dos-Santos Cordovil, University of Lisbon, PortugalReviewed by:
João Serra, Instituto Superior de Agronomia, PortugalCopyright © 2022 Wyngaard and Kissinger. This is an open-access article distributed under the terms of the Creative Commons Attribution License (CC BY). The use, distribution or reproduction in other forums is permitted, provided the original author(s) and the copyright owner(s) are credited and that the original publication in this journal is cited, in accordance with accepted academic practice. No use, distribution or reproduction is permitted which does not comply with these terms.
*Correspondence: Meidad Kissinger, bWVpZGFka0BiZ3UuYWMuaWw=
Disclaimer: All claims expressed in this article are solely those of the authors and do not necessarily represent those of their affiliated organizations, or those of the publisher, the editors and the reviewers. Any product that may be evaluated in this article or claim that may be made by its manufacturer is not guaranteed or endorsed by the publisher.
Research integrity at Frontiers
Learn more about the work of our research integrity team to safeguard the quality of each article we publish.