 Wasiu Awoyale
 Hakeem Oyedele
 Michael Adesokan
 Emmanuel O. Alamu
 Busie Maziya-Dixon1*
95% of researchers rate our articles as excellent or good
Learn more about the work of our research integrity team to safeguard the quality of each article we publish.
Find out more
ORIGINAL RESEARCH article
Front. Sustain. Food Syst. , 23 August 2022
Sec. Sustainable Food Processing
Volume 6 - 2022 | https://doi.org/10.3389/fsufs.2022.984687
The use of the biophysical and textural attributes of gari/eba to determine the possible substitution of an adopted cassava variety (TMBE419) with the improved genotypes from the breeding program was evaluated in this study. Standard methods were used for the characterization of the biophysical and textural attributes of the gari/eba from different cassava roots. It was observed that the mean of the biophysical attributes of the gari is swelling power (SWP) 12.46%, dispersibility 59.70%, water absorption capacity (WAC) 474.60%, peak 355.82 RVU, breakdown 111.02 RVU, and final 423.07 RVU viscosities, peak time 4.91 min, pasting temperature 80.14°C, moisture content 3.92%, ash content 0.98%, starch content 71.98%, amylose content 31.47% and cyanogenic potential (CNP) content 0.47 mg HCN/kg. There were significant differences (p < 0.05) in all the biophysical attributes of the gari samples. The instrumental texture attribute of the eba is hardness 40.46 N/m2, mouldability 0.93, and stretchability 1.04. The sensory texture attributes depict that all the eba was moderately soft, sticky, and mouldable. Significant differences (p < 0.05) exist in the instrumental and sensory texture attributes of the eba samples. The PCA shows that gari made from TMS14F1285P0006 and TMS13F1053P0010 genotypes may have similar behavior in terms of dispersibility, SWP, and peak and breakdown viscosities to that of the TMBE419 variety. Also, the stickiness of the eba prepared from the TMS14F1285P0006 and TMS13F1053P0010 genotypes may be the same as that of the TMBE419 variety. Therefore, TMS14F1285P0006 and TMS13F1053P0010 genotypes may be good replacements for producing gari/eba in place of the TMBE419 variety.
Varietal differences have played vital roles in the production of diverse food products such as gari and have meaningfully impacted the quality characteristics of the product. Hence, income, food security, culinary, and agronomic needs are not the only factors considered for the selection of cassava varieties by the producers, but also the preservation of their cultural uniqueness while adopting both the improved genotypes introduced by breeders and the high-yielding landraces suitable for different value-added products (Awoyale et al., 2022). The information on the aptness of cassava varieties for vastly required products like gari will contribute to providing solutions on how to balance the needs of farmers with those of the end-users in terms of their chosen qualities in the breeding programs (Abass et al., 2022). This was corroborated by Thiele et al. (2021) and Abass et al. (2022). These researchers confirmed that inadequate precedence given to consumer-preferred traits by breeding programs backs the partial uptake of improved genotypes and their low varietal turnover for gari production.
Gari is a roasted, fermented cassava grit, consumed raw, soaked in cold water, or reconstituted in hot water into eba, and common in the diets of millions of people in developing countries (Abass et al., 2022). Awoyale et al. (2020) reported that varieties and the interactions between varieties and locations had a significant effect on the biophysical attributes (except pasting temperature and ash content) of the gari. Abass et al. (2022) on their part added that high product yield, high starch content, high solubility index, high peak viscosity and low setback viscosity are likely biophysical attributes that could be used as criteria for predicting gari quality and variety adoption by cassava processors. Textural attribute, which is the sensory and functional manifestation of the rheological and biophysical attributes of foods has also been considered a very important quality index for eba (Awoyale et al., 2021a). Awoyale et al. (2021a) stated that a significant and negative correlation exists between the mouldability of the eba and the sugar and amylose contents of gari. The stretchability of the eba had a significant negative correlation with the bulk density and a significant positive correlation with the setback viscosity of the gari. A significant and negative correlation exists between the stickiness of the eba and the amylose contents of the gari.
Of all the adopted cassava varieties, TME 419 otherwise known as TMBE419 used in this study has been widely adopted to produce gari due to its high product yield and good biophysical attributes among others (Udensi et al., 2011; Teeken et al., 2018; Abass et al., 2022). Therefore, the use of the biophysical and textural attributes of gari/eba to determine the possible substitution of an adopted cassava variety (TMBE419) with the improved genotypes from the breeding program was evaluated.
Twenty-nine (29) improved cassava varieties with one control (TMBE419 variety) (Table 1) were harvested from the Ikenne demonstration farm of the International Institute of Tropical Agriculture (IITA), Ogun State, Nigeria. Approximately 20 kg of the varieties were used for gari production. The TMBE419 variety also known as TME419 or Idileruwa was used as a control variety because it has been established to be very good and well adapted for gari production by researchers (Agele et al., 2018; Oyeyinka et al., 2020; Dimkpa and Theophilus, 2021; Abass et al., 2022).
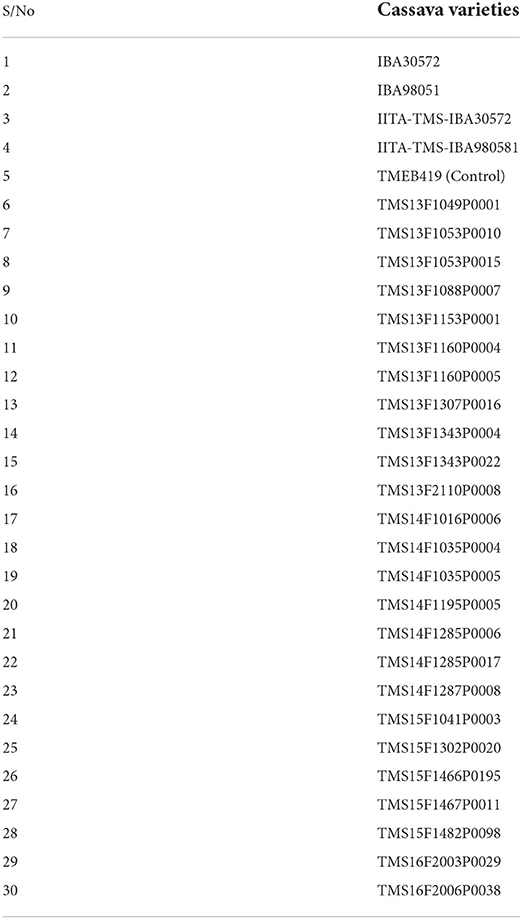
Table 1. Improved cassava genotypes and the control variety used to produce gari/eba.
The traditional spontaneously fermented method was used to produce the gari, where the peeled, washed, and grated mash was fermented for about four (4) days before bagging, dewatering, granulating, and sieving, roasting, cooling, and packaging (Awoyale et al., 2020).
The standard methods described by Ashraf et al. (2012) were used for the determination of bulk density. About 10 g of the gari sample was weighed into a 50 ml measuring cylinder. The measuring cylinder containing the sample was lightly tapped 10 times on the laboratory workbench to achieve a constant height. The result was expressed as g/ml, which is the bulk density.
A 2.5% aqueous dispersion of gari was put in centrifuge tubes, covered to prevent spilling, and subjected to heat in a shaker water bath (Precision Scientific, Model 25: Chicago, USA) at 85°C for 30 min (Afoakwa et al., 2012). The centrifuge tubes were then cooled to ambient temperature and centrifugated at 3,000 x g for 15 min, using the Thelco GLC- 1, 60647 centrifuges (Chicago, USA). The precipitate separated from the supernatant was weighed, after which the supernatant was evapourated in a hot air oven (Memmert GmbH+Co.KG: D-91126, Germany) at 105°C, and the residue was weighed. Equations (1) and (2) were used for the calculation of the swelling power (SWP) and solubility index respectively.
The gari water absorption capacity (WAC) was determined by weighing 1 g into a clean pre-weighed dried centrifuge tube and mixed adequately with distilled water (10 ml) by vortexing, after which the suspension was allowed to stand for 30 min and centrifuged (Thelco GLC- 1, 60647: Chicago, USA) at 3,500 rpm for 30 min. The supernatant was decanted after centrifugation, with the tube and the sediment weighed. The weight of water (g) retained in the sample was then reported as WAC (Oyeyinka et al., 2013).
The gari dispersibility was determined by weighing 10 g of the sample into a 100 ml measuring cylinder, after which distilled water was added up to the 50 ml mark of the measuring cylinder. The gari and distilled water mixture were stirred vigorously using a spatula and allowed to settle for 3 h. The volume of settled particles in the measuring cylinder was recorded, and the dispersibility was calculated using Equation (3).
The gari pasting properties were determined using the method reported by Falade and Olugbuyi (2010). About 3.5 g of the sample was mixed with 25 ml of distilled water in a canister. The mixture was thoroughly stirred, and the canister was fitted into the Rapid Visco Analyser (Model RVA 4500, Perten Instrument, and Australia) equipped with a 1,000 cmg sensitivity cartridge. The slurry was heated inside the Rapid Visco Analyzer (RVA) from 50 to 95°C at a rate of 1.5°C/min as recommended, held at this temperature for 15 min, and cooled to 50°C. The pasting properties (peak viscosity, trough, breakdown, final viscosity setback, peak time, and pasting temperature) of the samples were displayed on the computer screen connected to the Thermocline for Windows Software of the RVA.
The gari sample (3 g) was weighed into a pre-weighed dried moisture can. The can containing the sample was placed in a well-ventilated oven (Memmert GmbH+co.Kg, Oven model D-91126 Schwabach FRG, Germany) operated at 105 ± 2 °C for 16 h. The loss in weight was recorded and the moisture content (MC) was calculated using Equation (4) (AOAC, 2000).
The ash content of the sample (3 g) was determined by burning off moisture and all the organic constituents at 600°C for 6 h in a muffle furnace (Ney VulvanTM furnace model 3-1750, USA) (AOAC, 2000). Then the weight of the residue after incineration and cooling was recorded, and the ash content was calculated using Equation (5).
The sample (0.02 g) was weighed into a centrifuge tube with the addition of 1 ml ethanol, 2 ml distilled water, and 10 ml hot ethanol. The mixture of the sample, distilled water, and ethanol was vortexed and centrifuged (Thelco GLC- 1, 60647: Chicago, USA) at 2,000 rpm for 10 min. The supernatant was then decanted and used for the sugar content determination, and the starch content was estimated by hydrolyzing the sediment with perchloric acid. The color of the solution was developed using phenol and sulfuric acid reagents, while the standard glucose curve was used to estimate sugar. The absorbance of the developed color was read at 490 nm using a spectrophotometer (Genesys 10S UV-VIS, China) (Onitilo et al., 2007). The sugar and starch contents were calculated using Equations (6) and (7) respectively.
A = Sample absorbance.
I = Sample intercept.
D.F = Sample dilution factor, which depends on the aliquot
taken for analysis.
V = Volume.
B = Standard curve slope.
W = Sample weight.
The milled gari sample (30 g) was properly homogenized with 250 ml of 0.1 M orthophosphoric acid and centrifuged (Thelco GLC- 1, 60647: Chicago, USA). The supernatant was taken as the extract after which 0.1 ml of linamarase enzyme was added to 0.6 ml of the extract. About 3.4 ml of the acetate buffer (pH 4.5) solution was added, stirred to mix and 0.2 ml of 0.5% chloramines-T and 0.6 ml of color reagent were added and allowed to stand for 15 min. for color development. The absorbance value was read at 605 nm using a spectrophotometer (Genesys 10S UV-VIS, China) against a blank. The blank contains all reagents but with the replacement of KCN with 0.1 ml phosphate buffer (Essers et al., 1993).
A standard curve and its slope (b) were obtained from the data generated from the standard solution by plotting absorbance values (Y-axis) against standard concentrations (X-axis). The unknown mean absorbance (A) and the weight of the sample (w) were used to calculate the residual cyanide, using Equation (8).
The eba was prepared from the gari samples produced from the 30 cassava varieties using the method described by Awoyale et al. (2022). This was done by continuously stirring the gari (100 g) and adding to boiled water (195 ml) to form a smooth dough. Fifteen (15) trained panelists from the staff and graduate students of the International Institute of Tropical Agriculture (IITA), Ibadan, who consumes eba regularly were used for the sensory texture profile analysis, after their verbal agreement. The attributes evaluated in the eba are mouldability, stretchability, stickiness, and hardness. The tenets of the Helsinki declaration of 1964 and approved by the International Institute of Tropical Agriculture review committee on ethics were followed in the sensory texture profiling.
A 50 kg load cell texture analyzer (TA-XTPlus-Stable Microsystems) was used for the instrumental texture profile analysis of the eba. The texture attributes obtained from the analyzer are hardness, adhesiveness, cohesiveness, stretchability, and gumminess of the eba. The eba samples were kept inside a cooler to maintain the temperature (28–30 °C) during the evaluation.
The XLSTAT (Trial Version 2021) software was used for the principal component analysis (PCA), while the Statistical Package for Social Sciences (SPSS version 21) software was used for the separation of means of the data generated.
The functional properties of gari are known to affect the behavior during preparation for consumption (Awoyale et al., 2015). The average value of the functional properties of gari produced from the cassava varieties is swelling power (SWP) 12.46%, solubility index (SI) 7.14%, dispersibility 59.70%, bulk density (BD) 75%, and water absorption capacity (WAC) 474.60% (Table 2). There were significant differences (p < 0.05) in all the functional properties of the gari samples.
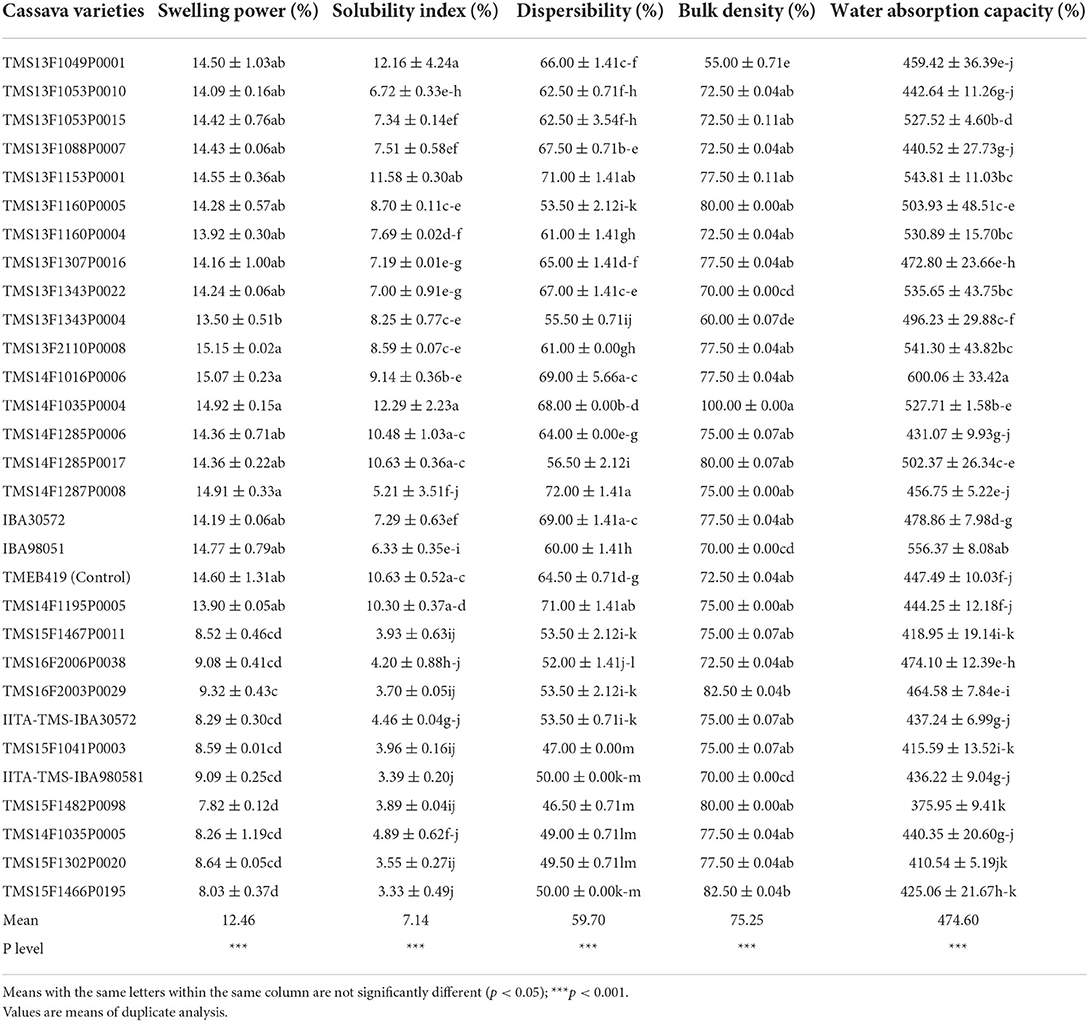
Table 2. Functional properties of gari produced from the cassava genotypes and the control variety.
The degree of the interaction within the amorphous and crystalline domains between starch chains is influenced by the SWP and SI. Also, a good quality gari has been reported to swell to three times its original volume (Awoyale et al., 2020). The gari SWP ranged from 7.82–15.16%, with the TMS13F2110P0008 gari having the highest and TMS15F1482P0098 gari the least (p < 0.05). The SWP of the gari samples concurs with the results reported for gari of different varieties (Awoyale et al., 2020), but is higher compared to the values (3.13–5.30%) of gari samples produced from dried cassava chips (Udoro et al., 2014). This may be attributed to the treatment of chips during drying which may have resulted in the general weakening of the starch structure thus, lowering the swelling capabilities (Udoro et al., 2014). The SI of the gari was significantly lower in the TMS15F1466P0195 genotype (3.33%) and higher in that of the TMS14F1035P0004 genotype (12.29%) (p < 0.05). Thus, gari from the TMS15F1466P0195 genotype may consist of associated starch granules with a bulky and highly attached micellar structure because of its low SI (Awoyale et al., 2022). The result of the SI of gari from different varieties falls within the range of values of this study (Awoyale et al., 2020). Conversely, the SI of the gari samples (0.11–0.54%) reported by Udoro et al. (2014) was below the range of values in this study. The variation in the SI may be due to the cassava varieties and processing methods.
Higher dispersibility favors proper reconstitution of gari in hot water in the preparation of eba (Awoyale et al., 2022). The gari sample's dispersibility ranged between 46.50 and 72.00%, with the lowest value recorded in the TMS15F1482P0098 genotype and the highest in the TMS14F1287P0008 genotype, which was significantly different (p < 0.05). Thus, the TMS14F1287P0008 gari may be reconstituted in hot water, and without lumps, in the preparation of eba because of its high dispersibility. But it is imperative to add that the way the gari is added to the hot water during the preparation of eba might influence the formation of lumps (Awoyale et al., 2020). Similar values (20.25–75.25%) were reported for the dispersibility of gari from different varieties (Awoyale et al., 2020).
Product with lower BD may occupy less space in a container, thus, the reduction in the packaging and transportation costs (Ikujenlola, 2014). Meaning that the TMS14F1035P0004 gari may occupy more space in a container because of its high BD (100%), while that of the TMS13F1049P0001 genotype may occupy less space due to its low BD (55%) (p < 0.05). The BD of gari reported for different cassava varieties (40–70%) by Awoyale et al. (2020) agrees with that of this study. The range of BD of gari samples (54–61%) produced in Lagos State falls within the values reported in this study (Sanni et al., 2008).
The gari produced from the TMS14F1016P0006 genotype (600.06%) might grip more water when prepared to eba because of its high WAC compared with that of the TMS15F1482P0098 genotype with lower values (375.95%) (p < 0.05) (Table 2). The range of values (413–541%) of the WAC for gari produced from different cassava varieties falls within that of the present study (Awoyale et al., 2020). Conversely, the values of the WAC reported in this study for the gari samples were higher than the 105% reported for gari by Owuamanam et al. (2010). The WAC of the gari samples (220–459%) stated by Udoro et al. (2014) partly agrees with that of this study. However, the variations in the WAC of all the samples may be attributed to the age and type of cassava variety, harvesting period, the time and temperature of roasting and the particle size of the gari (Owuamanam et al., 2010; Abass et al., 2012).
The PCA was applied to study the relationship between the functional properties of gari and different cassava genotypes to evaluate the possibilities of using them to produce gari instead of the TMBE419. The PCA biplot, as shown in Figure 1, allowed us to separate the cassava genotypes based on the functional properties of the gari samples. The result depicts a data variance of about 80.77%, with the PC1 and PC2 contributing 60.46 and 20.30% respectively. The PC1 was positively correlated with the SWP (r = 0.93), SI (r = 0.87), dispersibility (r = 0.89), and the WAC (r = 0.74) of the gari samples, while the PC2 had a positive correlation with the BD (r = 0.99) of the gari samples (Supplementary Table 1). The TMS14F1035P0004, IBA30572, TMS14F1285P0017, TMS13F1160P0005, TMS13F2110P0008, TMS14F1016P0006, TMS13F1153P0001, and TMS13F1307P0016 genotypes were in the same quadrant with the SI and the WAC of the gari samples. Similarly, TMS13F1053P0015, TMS13F1053P0010, TMS13F1343P0022, IBA98051, TMS14F1285P0006, TMS14F1287P0008, TMS14F1195P0005, TMS13F1343P0004, TMS13F1160P0004, TMS13F1088P0007, and TMS13F1049P0001 genotypes and the TMEB419 variety were in the same quadrant with dispersibility and the SWP of the gari samples. Also, TMS16F2003P0029, TMS15F1482P0098, TMS15F1466P0195, TMS14F1035P0004, and TMS15F1302P0020 genotypes were in the same quadrant with the BD of the gari samples (Figure 1). Using TMEB419 as the control variety, gari of similar dispersibility and SWP may be produced from TMS13F1053P0015, TMS13F1053P0010, TMS13F1343P0022, IBA98051, TMS14F1285P0006, TMS14F1287P0008, TMS14F1195P0005, TMS13F1343P0004, TMS13F1160P0004, TMS13F1088P0007, and TMS13F1049P0001 genotypes since they belong to the same quadrants with these attributes.

Figure 1. The principal component analysis biplot of the functional properties of gari samples.
Adebowale et al. (2008) reported that the pasting properties are important to predict the behavior of gari during and after cooking to eba. The mean of the pasting properties of the gari samples is peak viscosity 355.82 RVU, trough viscosity 244.81 RVU, breakdown viscosity 111.02 RVU, final viscosity 423.07 RVU, setback viscosity 178.26 RVU, peak time 4.91 min, and pasting temperature 80.14 °C (Table 3). Significant differences exist (p < 0.05) in the pasting properties of the gari samples.
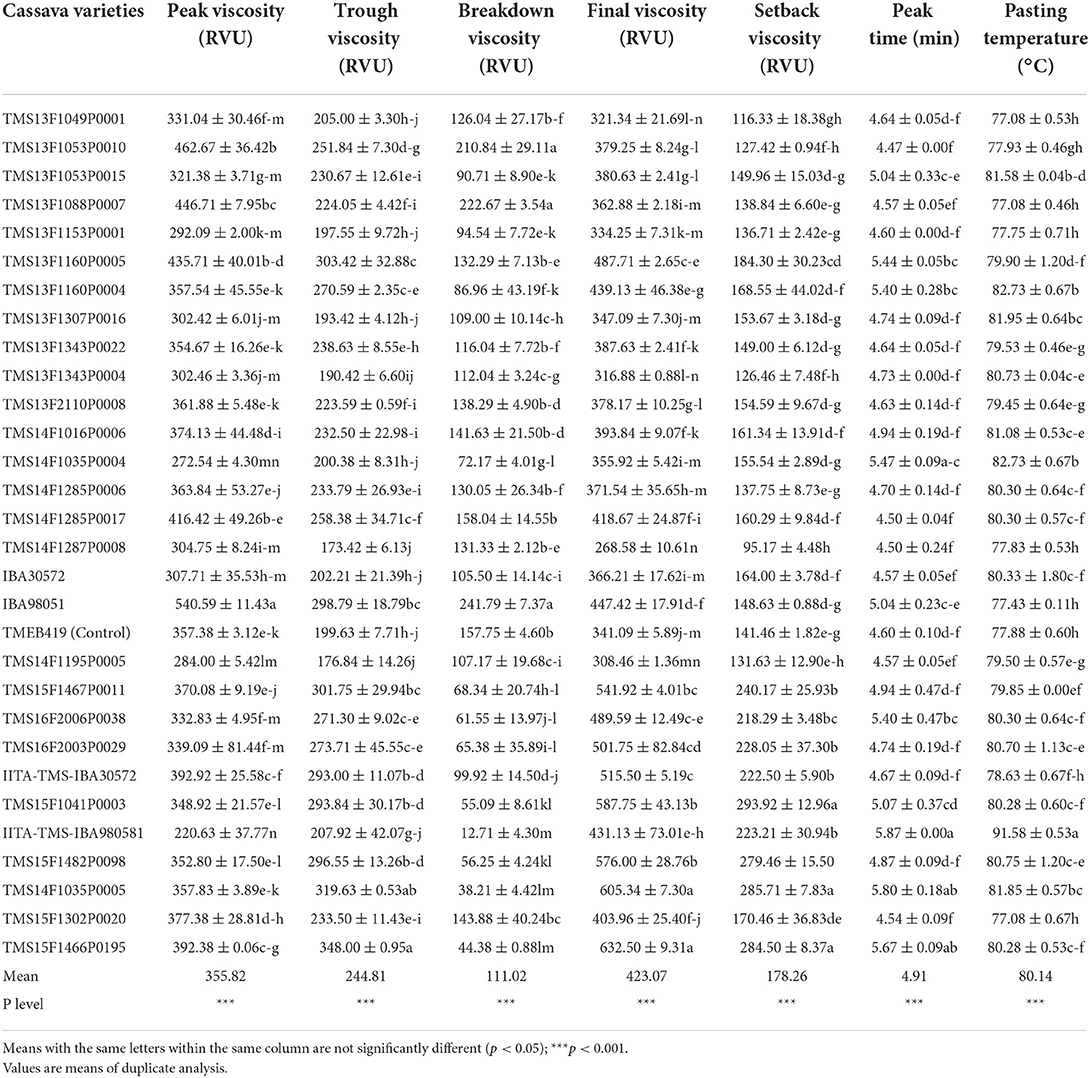
Table 3. Pasting properties of gari produced from the cassava genotypes and the control variety.
The peak viscosity is the viscosity that backs the good texture of eba. Hence, the higher the peak viscosity, the firmer the texture of the eba (Ikegwu et al., 2009). This means that consumers who prefer the firm-textured eba may reconstitute the gari produced from the IBA98051 genotype (540.59 RVU) in boiled water because of its high peak viscosity. Also, those that prefer the soft textured eba may reconstitute gari from the IITA-TMS-IBA980581 genotype (220.63 RVU) in boiled water due to its low peak viscosity. Although, of importance is the fact that the texture of the eba may depend on the quantity of water used during reconstitution and the temperature and time spent for gelatinization (Newport Scientific, 1998). The peak viscosity of the gari produced using different periods of fermentation (283.92 RVU−366.92 RVU) falls within the range of values of the peak viscosity of the gari in this study (Awoyale et al., 2021a). The peak viscosity of the gari samples in this study was higher compared to some of the results (133. 50–324.25 RVU) reported by Olanrewaju and Idowu (2017) for gari samples. The variations in the peak viscosity of the gari samples may be attributed to varying degrees of garification (Olanrewaju and Idowu, 2017).
The ability of starch granules to remain undisrupted when the gari is subjected to a period of constant high temperature and mechanical shear stress is known as trough viscosity (Olatunde et al., 2017). The trough viscosity of the gari was lower in the TMS14F1287P0008 genotype (173.42 RVU) and higher in that of the TMS15F1466P0195 genotype (348.00 RVU). This depicts that eba produced from TMS15F1466P0195 gari may not withstand mechanical shear stress, and the starch granules may be disrupted because of their high trough viscosity, while that of the TMS14F1287P0008 gari may withstand mechanical shear stress (Olatunde et al., 2017). The range of values of the trough viscosity of the gari in this study agrees with the range of values (177.59 RVU−215.92 RVU) reported by Awoyale et al. (2021a) for the trough viscosity of gari from different periods of fermentation. The values reported for some of the trough viscosity of the gari produced from different particle sizes (70.92–239.17RVU) were lower compared to that of this study (Nwancho et al., 2014). The difference in the trough viscosity may be attributed to the varietal effect and the processing method used in the preparation of the gari samples.
The higher the breakdown viscosity, the lower the ability of the gari to withstand heating and shear stress during its reconstitution to eba (Adebowale et al., 2008; Awoyale et al., 2020). The breakdown viscosity of the gari ranged between 12.71 RVU and 241.79 RVU, with the IBA98051 genotype having the highest value and the IITA-TMS-IBA980581 genotype the lowest. This means that eba with undisrupted starch granule may also be produced from the IITA-TMS-IBA980581 gari due to its low breakdown viscosity compared to that of the IBA98051 variety with high breakdown viscosity. The value for the breakdown viscosity of gari from different periods of fermentation (97.38 RVU−151.00 RVU) falls within the range of values of the breakdown viscosity of this study (Awoyale et al., 2021a). Also, the breakdown viscosity of the gari samples (30.92–162.08 RVU) reported by Nwancho et al. (2014) was within the range of values of this study.
The final viscosity indicates the ability of the starchy material to form a gel after cooking (Sanni et al., 2006). Thus, the higher the final viscosity of the gari, the faster the gelatinization process when reconstituted in hot water to eba. Gari produced from the TMS14F1287P0008 genotype (268.58 RVU) had the lowest final viscosity and the TMS15F1466P0195 genotype the highest (632.50 RVU). Therefore, gari from the TMS15F1466P0195 genotype may gelatinize faster when reconstituted in boiled water to eba because of its high final viscosity, while that of the TMS14F1287P0008 genotype may gelatinize gently due to its low final viscosity (Sanni et al., 2006). The final viscosity values of gari produced from different periods of fermentation (322.25–337.55 RVU) (Awoyale et al., 2021a), and the gari produced from different cassava varieties (338.46–507.38 RVU) (Awoyale et al., 2020) was within the range of values compared to that of this study. On the contrary, the final viscosity (244.25 RVU) of gari samples reported by Oluwamukomi and Jolayemi (2012) was lower than that of the present study. The variation in the final viscosity of the gari may be due to differences in cassava varieties and processing methods.
When the setback viscosity during the cooling of the paste is low, it indicates greater resistance to syneresis/weeping of the starchy food (Awoyale et al., 2020). This infers that eba prepared from TMS14F1287P0008 gari (95.17 RVU) may not weep easily because of its low setback viscosity compared to that prepared from TMS15F1041P0003 gari (293.92 RVU), which may weep easily due to its high setback viscosity. Awoyale et al. (2021a) reported a setback viscosity of between 108.59 RVU and 148.46 RVU for gari produced from different periods of fermentation. These values fall within the range of values for the setback viscosity of the gari in this study.
The gari produced from the TMS13F1053P0010 genotype (4.47 min) had the lowest peak time and that of the IITA-TMS-IBA980581 genotype (5.87 min) had the highest peak time. The gari produced from the IITA-TMS-IBA980581 genotype (91.58°C) had the highest pasting temperature, and that of the TMS15F1302P0020 genotype (77.08 °C) had the lowest (Table 3). This implies that all the gari samples may be reconstituted in hot water to eba in less than 6 min and below the boiling point of water, thus reducing energy cost (Adebowale et al., 2008). The peak time and the pasting temperature of the gari samples agree with the observation of Awoyale et al. (2020) for gari produced from different cassava varieties. In addition, some of the pasting temperatures of the gari samples reported in this study were below the range of values (88.75 −94.50 °C) stated for gari samples by Olanrewaju (2016).
The PCA biplot shown in Figure 2, allowed us to distinguish the gari produced from different cassava genotypes based on the pasting properties. The result showed a data variance of about 86.90%, with PC1 contributing 53.97% and PC2 32.94%. The PC1 was positively correlated with the trough (r = 0.74), final (r = 0.90), and setback (r = 0.93) viscosities, and the peak time (r = 0.81) and the pasting temperature (r = 0.56) of the gari samples, and negatively correlated with the breakdown viscosity (r = −0.76) of the gari samples. The PC2 on the other hand had a positive correlation with the peak (r = 0.95) and the trough (r = 0.66) viscosities of the gari samples, and a negative correlation with the pasting temperature (r = −0.65) of the gari samples (Supplementary Table 2). The TMS13F1160P0005, TMS16F2006P0038, TMS15F1467P0011, TMS15F1466P0195, TMS15F1482P0098, IITA-TMS-IBA30572, TMS15F1041P0003, TMS16F2003P0029, and TMS14F1035P0004 genotypes were in the same quadrant with the trough, final and setback viscosities of the gari samples. Similarly, TMS13F1160P0004, TMS14F1035P0004, and IITA-TMS-IBA980581 genotypes were in the same quadrant with the peak time and pasting temperature of the gari samples. Also, the peak and breakdown viscosities of the gari samples were within the same quadrant with TMS13F1053P0010, IBA98051, TMS14F1016P0006, TMS14F1285P0017, TMS13F1088P0007, TMS14F1285P0006, TMS15F1302P0020, TMS13F2110P0008, and TMS13F1343P0022 genotypes and the TMEB419 variety (Figure 2). Therefore, gari produced from TMS13F1053P0010, IBA98051, TMS14F1016P0006, TMS14F1285P0017, TMS13F1088P0007, TMS14F1285P0006, TMS15F1302P0020, TMS13F2110P0008, and TMS13F1343P0022 genotypes may be like that of the TMEB419 variety in terms of the peak and breakdown viscosities.
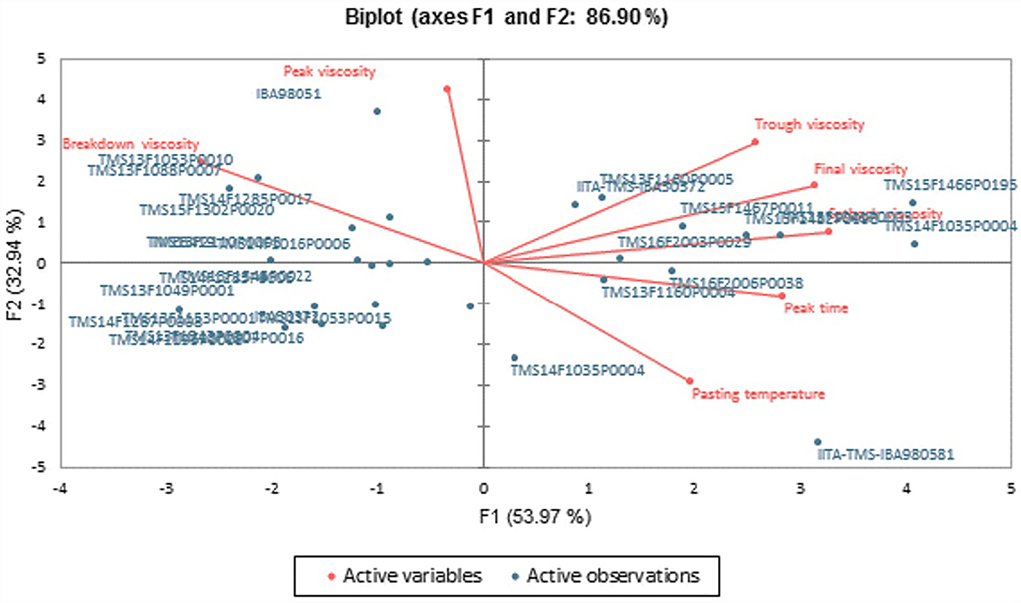
Figure 2. The principal component analysis biplot of the pasting properties of gari samples.
Table 4 shows the chemical composition of gari produced from different cassava varieties. The mean of the chemical composition of the gari are moisture content 3.92%, ash content 0.98%, sugar content 2.57%, starch content 71.98%, amylose content 31.47% and CNP 0.47 mg HCN/kg. There were significant differences in all the chemical compositions of the gari samples (Table 4).
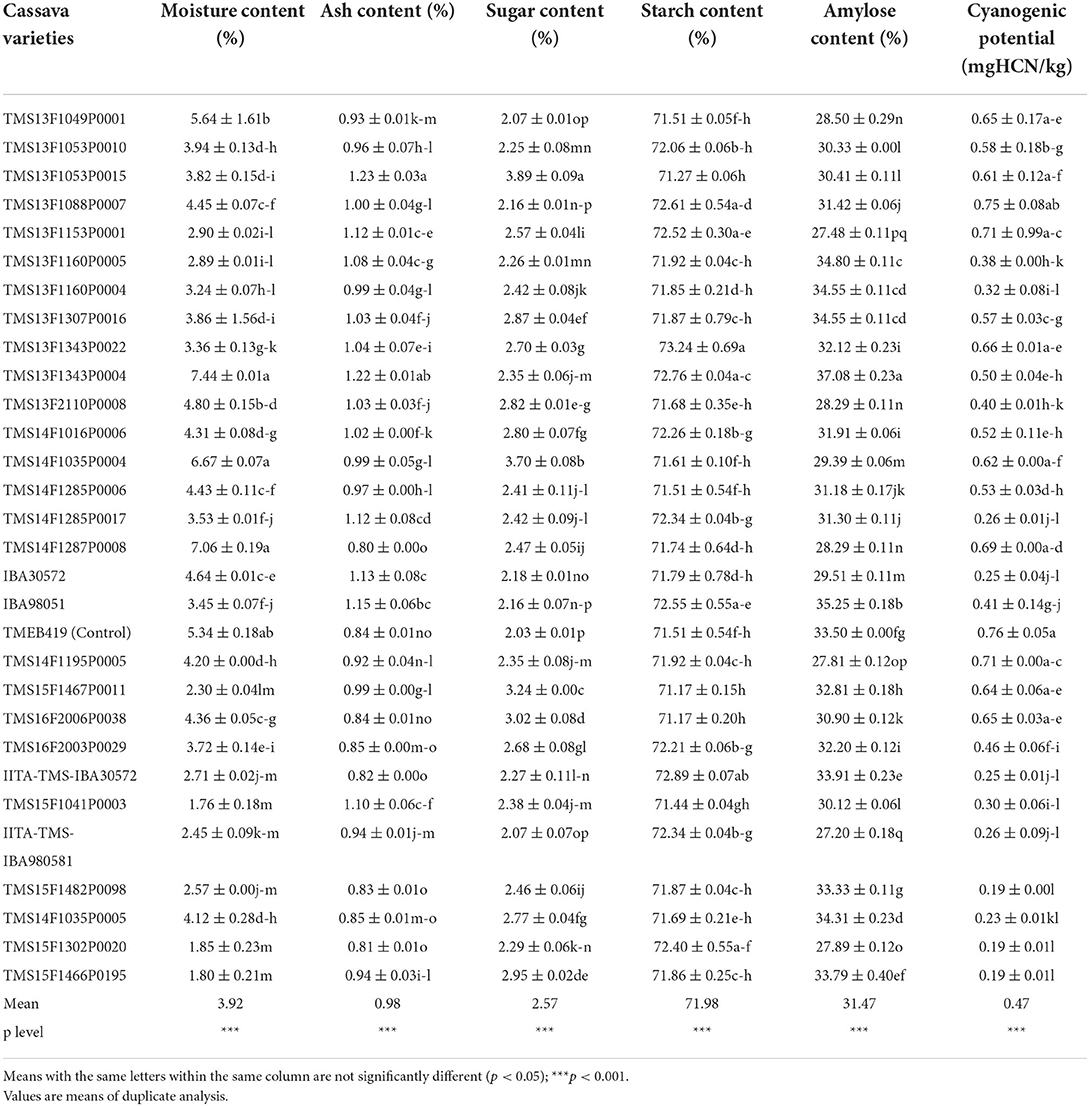
Table 4. The chemical composition of gari produced from the cassava genotypes and the control variety.
The moisture content of the gari samples ranged from 1.76% in TMS15F1041P0003 genotype to 7.44% in TMS13F1343P0004 genotype. The lower the original moisture content of a product to be stored, the better the storage stability (Sanni et al., 2006). Also, the (Codex Alimentarius Commission, 1985) stated that the stipulated moisture content of gari should be 10%. This implied that the moisture content of all the gari samples falls below the stipulated standard and may stay for a long time if properly packaged and stored during marketing to avoid moisture absorption. The moisture content of gari samples from Lagos and Environs reported by Sanni et al. (2008) (9.73–14.87%) and gari from different cassava varieties (except for that of TMS98/0505 variety) by Awoyale et al. (2020) (7.32–15.59%), was higher compared to that of this study. The variations in the moisture content may be due to the method cassava varieties and processing methods.
Ash content reflects the mineral status of food, although contamination during processing could indicate a high concentration (Baah et al., 2009). The ash content was higher in TMS13F1053P0015 gari (1.23%) and lower in that of TMS14F1287P0008 genotype (0.80%). The ash content of the gari samples was within the range of values (0.25–3.61%) reported for the ash content of gari from different cassava varieties (Awoyale et al., 2020), but lower compared to the ash content of gari produced using different periods of fermentation (1.61–1.68%) (Awoyale et al., 2021b). There ash content of the gari samples falls below the Codex Alimentarius Commission standard of 1.50%. However, the ash content of the gari samples collected from different locations in Lagos and Environs (1.00–1.67%) was partly higher than the ash content of the gari samples in this study (Sanni et al., 2008).
The starch content is one of the important quality indices that control the texture of eba (Oyeyinka et al., 2020). The starch content of the gari was lower in the TMS15F1467P0011 genotype (71.17%) and higher in that of the TMS13F1343P0022 genotype (73.24%). It is possible that the eba prepared from the TMS13F1343P0022 gari may be firmer in texture because of its high starch content, while that of the TMS15F1467P0011 gari may be soft-textured due to its low starch content (Oyeyinka et al., 2020). However, the starch content of the present study was lower compared to the starch content of gari (82.62–92.00%) produced from different cassava varieties (Awoyale et al., 2020), and the gari produced using different periods of fermentation (78.39–86.64%) (Awoyale et al., 2021b), but was higher compared to the starch content of gari samples (59.92–61.63%) from different locations reported by Abass et al. (2018). The hydrolysis of the starch into sugar during gari production (fermentation) may be higher in the TMS13F1053P0015 genotype (3.89%) and lower in the TMEB419 variety (2.03%) (Akingbala et al., 2005). The range of values for the sugar content of gari (2.78–4.29%) from different cassava varieties reported by Awoyale et al. (2020) accommodates the values reported in this study. Conversely, the sugar content of gari produced using different periods of fermentation (3.22–3.47%) was higher compared to that of this study (Awoyale et al., 2021b).
The higher the amylose content of the gari, the higher the rate of retrogradation of the eba. Hence, the amylose content of the gari determines the stability of the eba (Awoyale et al., 2021b). The amylose content of the gari ranged from 27.20–37.08%, with the TMS13F1343P0004 genotype having the highest and the IITA-TMS-IBA980581 genotype the least. The eba prepared from the TMS13F1343P0004 gari may retrograde faster because of its high amylose content compared to that of the IITA-TMS-IBA980581 gari, which may retrograde slowly due to its low amylose content. The amylose content of the gari from different periods of fermentation (29.88–30.32%) (Awoyale et al., 2021b) falls within the range of values of the amylose content of the gari in this study.
If cassava roots are not adequately processed before consumption, the cyanogenic potential (CNP) may be a limiting factor for humans due to its toxicity (Awoyale et al., 2020). Consequently, the Codex Alimentarius Commission (1985) set a stipulated standard of 10 mg HCN/kg for cassava products. The gari produced from TMS15F1482P0098, TMS15F1466P0195, and TMS15F1302P0020 genotypes (0.19 mg HCN/kg) have the lowest CNP content and that of TMEB419 variety (0.76 mg HCN/kg) had the highest (Table 4). This implied that all the gari samples may be safe for human consumption because the level of the CNP falls below the Codex stipulated standard of 10 mg HCN/kg. The CNP content of the gari produced from different periods of fermentation (1.63–4.84 mg HCN/kg) was higher compared to that of this study (Awoyale et al., 2021b). The CNP content of the gari samples reported by Sanni et al. (2008) (1.80–49.60 mg HCN/kg) and Olanrewaju (2016) (14.08–23.43 mg/kg HCN) was higher compared to that of this study. The differences in the CNP of the gari samples may be attributed to differences in the cassava varieties, length of fermentation, and roasting duration.
Figure 3 shows the PCA biplot, which allowed us to distinguish the gari produced from different cassava varieties based on the chemical composition. The result showed a data variance of about 50.05%, with the PC1 contributing 29.20% and PC2 20.85%. The PC1 was positively correlated with the moisture (r = 0.65) and the CNP (r = 0.77) contents of the gari, and negatively correlated with the starch content (r = −0.57) of the gari. The PC2 had a positive correlation with the ash content (r = 0.66) of the gari (Supplementary Table 3). The TMS13F1307P0016, TMS14F1016P0006, TMS13F1088P0007, TMS13F1153P0001, and TMS13F1053P0015 genotypes and TMEB419 variety were in the same quadrant with the ash, moisture and the CNP contents of the gari. Similarly, TMS14F1035P0004, TMS13F1053P0010, TMS15F1467P0011, TMS13F1049P0001, TMS14F1285P0006, TMS16F2006P0038, TMS14F1195P0005, TMS14F1287P0008, and TMS13F2110P0008 genotypes were in the same quadrant with the sugar content of the gari. Also, the starch and amylose contents of the gari were within the same quadrant with TMS13F1343P0004, IBA98051, TMS13F1343P0022, TMS14F1285P0017, TMS13F1160P0005, IBA30572, and TMS13F1160P0004 genotypes (Figure 3). Consequently, gari produced from TMS13F1307P0016, TMS14F1016P0006, TMS13F1088P0007, TMS13F1153P0001, and TMS13F1053P0015 genotypes may be comparable to that of the TMEB419 in terms of the ash, moisture and the CNP contents.
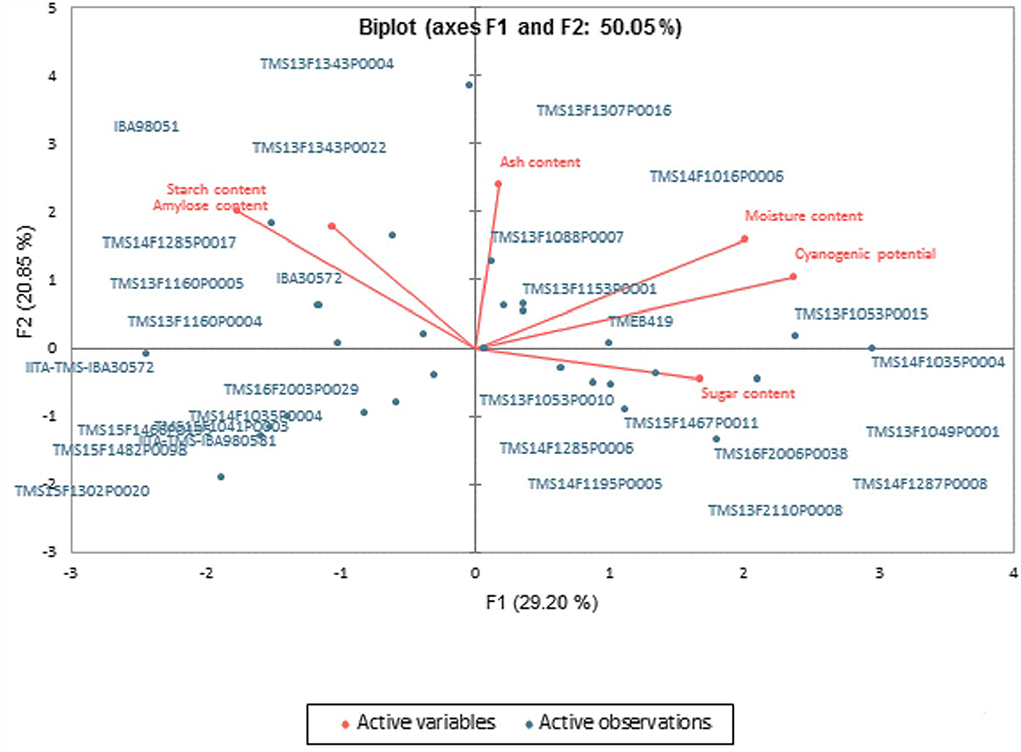
Figure 3. The principal component analysis biplot of the chemical composition of gari samples.
The instrumental texture attributes of eba from different cassava genotypes are shown in Table 5. The hardness mean is 32.89 N/m2, adhesiveness −89.27 N/m2, mouldability 0.94, stretchability 1.03, and gumminess 30.74 N/m2. All the instrumental texture attributes of the eba samples were significantly different (Table 5).
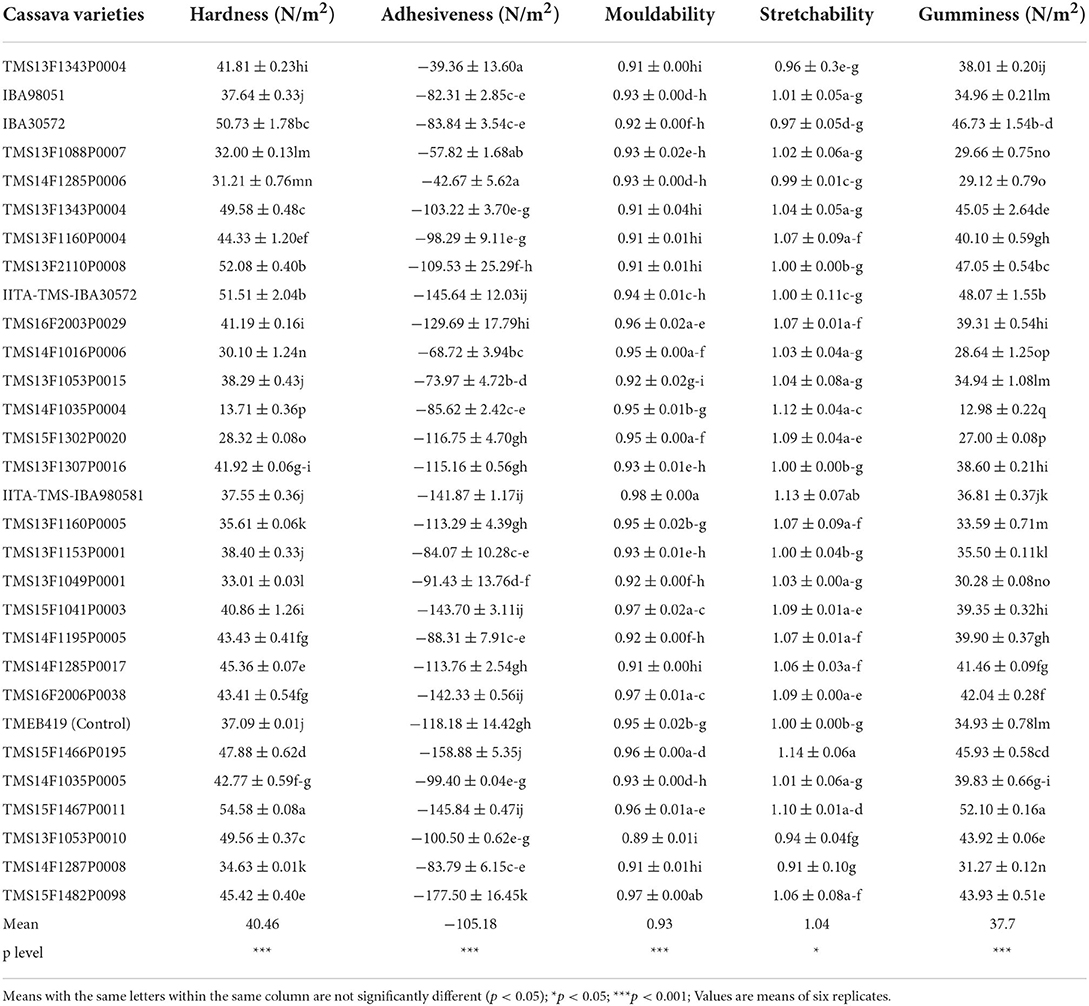
Table 5. Instrumental texture attributes of eba produced from the cassava genotypes and the control variety.
Awoyale et al. (2022) reported hardness as an indicator of the most direct response to taste, which has a direct relationship with chewiness, gumminess, and cohesiveness in the texture profile analysis. The hardness of the eba was higher in TMS15F1467P0011 gari (54.58 N/m2) and lower in that of TMS14F1035P0004 gari (13.71 N/m2). This means that consumers that prefer the firm-textured eba can consume the eba prepared from the TMS15F1467P0011 gari, while those that prefer the soft-textured eba can consume the eba prepared from the TMS14F1035P0004 gari. However, the range of values of the hardness of the eba prepared from backslopped fermented gari from different cassava varieties (21.03–30.22 N/m2) was within the range reported in this study (Awoyale et al., 2022).
The degree to which the eba sticks to the hand, mouth surface, or teeth is known as adhesiveness (Awoyale et al., 2022). The adhesiveness of the eba ranged from −177.50 N/m2 to −39.36 N/m2, with TMS13F1343P0004 gari having the highest and TMS15F1482P0098 gari the lowest. This implies that the eba prepared from the TMS13F1343P0004 gari may be more adhesive compared to that prepared from the TMS15F1482P0098 gari. The high adhesiveness of the eba from the TMS13F1343P0004 gari may be attributed to the low water absorption capacity and solubility index of the gari (Awoyale et al., 2022). Awoyale et al. (2022) also reported the range of values of −71.20 to −42.44 N/m2 for eba prepared from backslopped fermented gari, which was within the range of values for the adhesiveness of eba in the present study.
Usually, the eba is squeezed manually, during which the mechanical and geometrical characteristics are assessed, molded into balls with the hand, dipped into the soup, and then swallowed. Hence, mouldability is how well the product withstands a second deformation relative to its resistance under the first deformation (Awoyale et al., 2022). The eba from TMS13F1053P0010 gari (0.89) had the lowest mouldability, and the IITA-TMS-IBA980581 gari (0.98) was the highest. A similar range of values (0.84–0.98) was reported for the mouldability of eba prepared from backslopped fermented gari (Awoyale et al., 2022).
For consumers that chew eba before swallowing, the stretchability is the degree to which the eba returns to its original shape after compression between the teeth (Awoyale et al., 2022). The stretchability was higher in the eba prepared from the TMS15F1466P0195 gari (1.14) and lower in the eba prepared from TMS14F1287P0008 gari (0.91). The high stretchability of the eba from the TMS15F1466P0195 gari may be due to the high peak and breakdown viscosities of the gari (Awoyale et al., 2022). However, the values of the stretchability of the eba prepared from backslopped fermented gari (0.88–1.06) fall within the values of the stretchability of the eba in this study (Awoyale et al., 2022).
Gumminess is also defined as the energy required to disintegrate a semi-solid food until it can be swallowed (Awoyale et al., 2022). The gumminess of the eba ranged from 12.98–52.10 N/m2. Eba prepared from TMS14F1035P0004 gari had the lowest gumminess and the eba from TMS15F1467P0011 gari had the highest gumminess (Table 5). The gumminess of the eba prepared from the backslopped fermented gari (20.54–27.10 N/m2) falls within the values of the gumminess of the eba in this study (Awoyale et al., 2022).
For the instrumental texture attributes of the eba, a total of about 89.51% variation was observed, with PC1 contributing 47.78% and PC2 41.73% (Figure 4). The PC1 had a negative correlation with the hardness (r = −0.72) and the gumminess (r = −0.79), and a positive correlation with the adhesiveness (r = 0.89) of the eba. The PC2 had a positive correlation with the mouldability (r = 0.78) and the stretchability (r = 0.76), but a negative correlation with the hardness (r = −0.69) and gumminess (r = −0.60) of the eba (Supplementary Table 4). The IBA98051, TMS14F1035P0004, TMS14F1287P0008, TMS13F1053P0015, TMS13F1343P0004, TMS13F1053P0010, and TMS13F1153P0001 genotypes were in the same quadrant with the adhesiveness of the eba. Likewise, TMS15F1467P0011, TMS14F1195P0005, TMS13F1307P0016, TMS13F1160P0004, TMS13F1343P0004, TMS13F2110P0008, IITA-TMS-IBA30572, IBA30572, and TMS14F1285P0017 genotypes were within the same quadrant with the gumminess and hardness of the eba. Also, the stretchability and mouldability of the eba were in the same quadrant with TMS15F1482P0098, IITA-TMS-IBA980581, TMS16F2003P0029, TMS15F1041P0003, TMS15F1466P0195, and TMS16F2006P0038 genotypes (Figure 4). This means that all the genotypes that belong to the same quadrant may behave similarly based on the attributes.
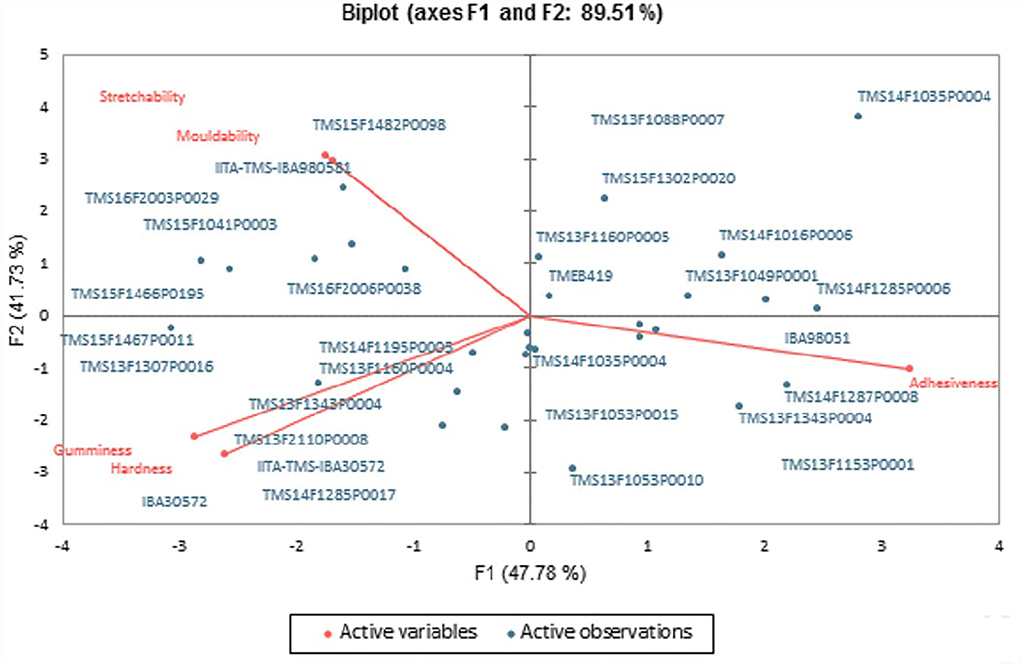
Figure 4. The principal component analysis biplot of the instrumental texture attributes of eba from different gari samples.
The mean of the sensory texture attributes depicts that the eba was slightly stretchable, moderately soft, sticky, and mouldable, and were significantly different in all the eba samples (p < 0.05) (Table 6). A similar observation was reported by Awoyale et al. (2022) on the sensory texture attributes of eba from backslopped fermented gari. Although, the cohesiveness, mouldability, stretchability, and softness of eba are essential and desired at various levels depending on the region, culture, and personal preferences (Ndjouenkeu et al., 2021).
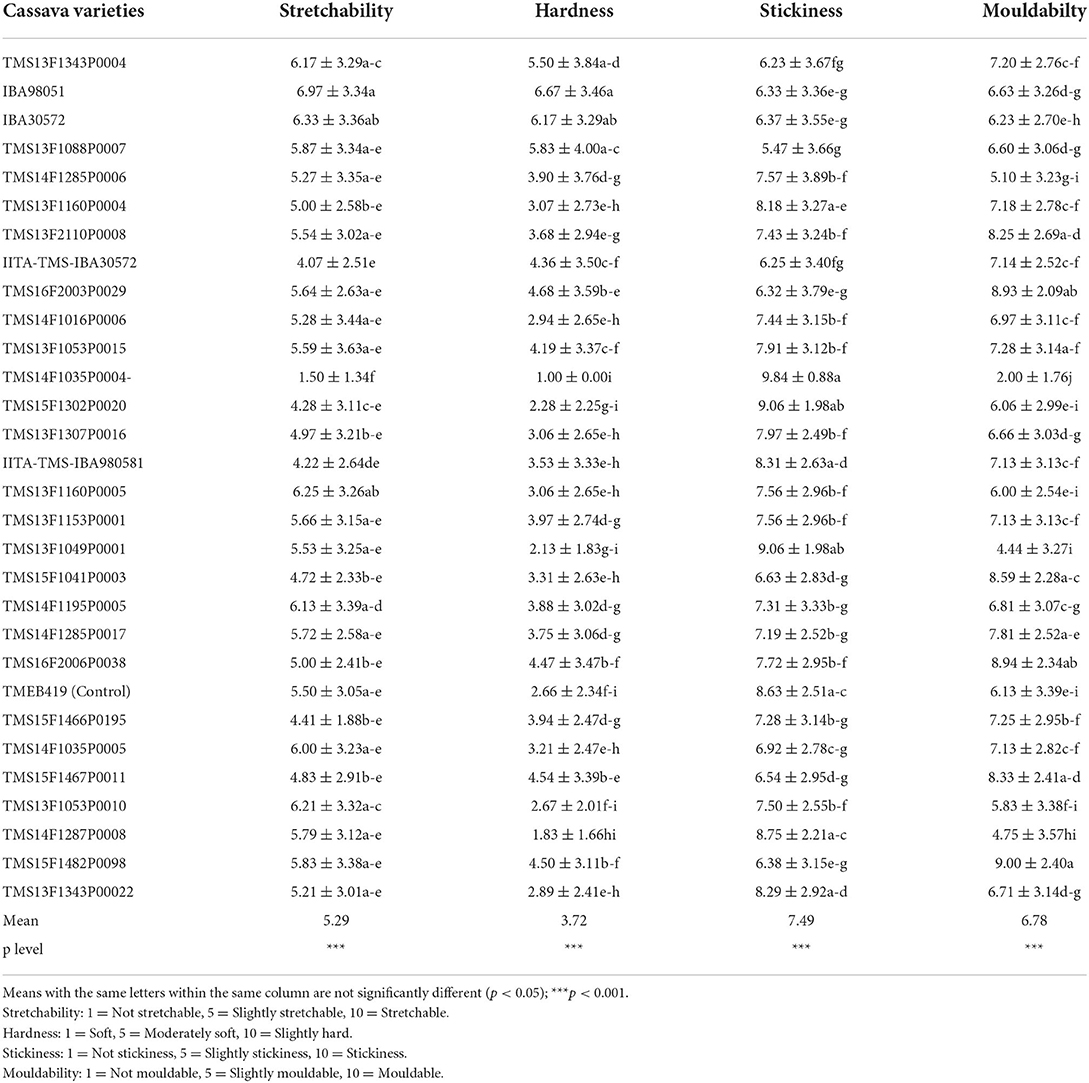
Table 6. Sensory texture attributes of eba produced from the cassava genotypes and the control variety.
The eba produced from TMS14F1035P0004 gari was not stretchable compared to the eba prepared from IBA98051 gari, which was stretchable. This means that the eba prepared from IBA98051 gari may be preferred in some regions or cultures, due to its stretchability (Ndjouenkeu et al., 2021). The eba prepared from TMS14F1035P0004 gari was soft, but that of the IBA98051 gari was slightly hard. The slightly hard nature of the eba from the IBA98051 gari may be attributed to its low amylose content. This is because Awoyale et al. (2022) reported a negative and significant correlation between the hardness of eba and the amylose content of the gari. The stickiness of the eba prepared from TMS13F1088P0007 gari was moderate, while that of the TMS14F1035P0004 gari was stickier. Since most consumers prefer the less sticky eba, the eba from the TMS13F1088P0007 gari may be more acceptable compared to that of the TMS14F1035P0004 gari, because of its moderate stickiness (Ndjouenkeu et al., 2021). Also, the stickiness of the TMS14F1035P0004 eba may be due to the high amylose content. This is because a positive and significant correlation was reported to exist between the stickiness of the eba and the amylose content of the gari (Awoyale et al., 2022). The eba prepared from TMS14F1035P0004 gari was not mouldable compared to the TMS15F1482P0098 eba, which was mouldable (Table 6). The low amylose content of the TMS15F1482P0098 gari may be responsible for the mouldability of the eba (Awoyale et al., 2022).
The PCA biplot allowed us to distinguish the eba produced from the cassava varieties based on the sensory texture attributes (Figure 5). The result of the sensory texture attributes of the eba showed a data variance of about 84.27%, with the PC1 contributing 67.60% and PC2 16.67%. The PC1 was negatively correlated with the stretchability (r = −0.70), hardness (r = −0.90) and mouldability (r = −0.75) of the eba and positively correlated with the stickiness (r = 0.92). The PC2 had a positive correlation with the stretchability (r = 0.66) of the eba (Supplementary Table 5). Based on the sensory texture attributes of the eba, TMS13F1049P0001, TMS14F1285P0006, TMS13F1160P0005, TMS13F1343P00022, TMS14F1287P0008, and TMS13F1053P0010 genotypes and TMEB419 variety were in the same quadrant with the stickiness of the eba. Similarly, the mouldability of the eba was in the same quadrant with the TMS13F2110P0008, TMS15F1467P0011, TMS15F1482P0098, TMS16F2006P0038, TMS15F1041P0003, TMS16F2003P0029, TMS14F1285P0017, and IITA-TMS-IBA30572 genotypes (Figure 5). Also, TMS14F1035P0004, TMS13F1343P0004, IBA98051, TMS14F1195P0005, TMS13F1153P0001, IBA30572, TMS13F1088P0007, and TMS13F1053P0015 genotypes were within the same quadrant with the stretchability and hardness of the eba (Figure 5). Therefore, the eba prepared from the TMS13F1049P0001, TMS14F1285P0006, TMS13F1160P0005, TMS13F1343P00022, TMS14F1287P0008, and TMS13F1053P0010 gari may be like that of the TMBE419 variety based on the stickiness (Figure 5).
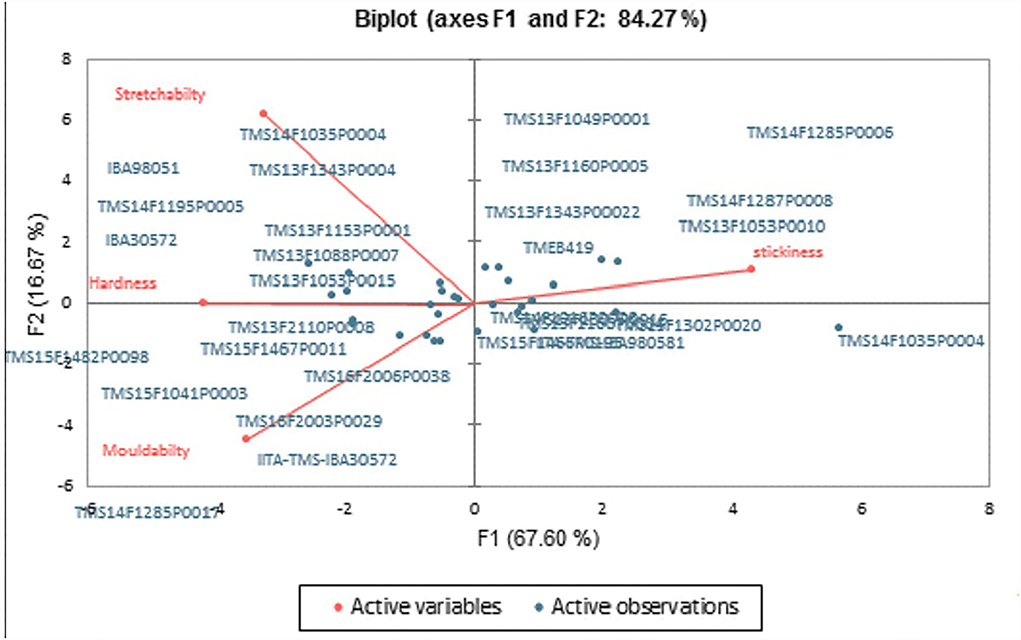
Figure 5. The principal component analysis biplot of the sensory texture attributes of eba from different gari samples.
From the principal component analysis, gari made from TMS14F1285P0006 and TMS13F1053P0010 genotypes may have similar dispersibility, swelling power, and peak and breakdown viscosities as the TMBE419 variety. The stickiness of the eba prepared from these genotypes may also be like that of the TMBE419 variety. Therefore, TMS14F1285P0006 and TMS13F1053P0010 genotypes may be a suitable substitute for producing gari instead of the TMBE419 variety.
The original contributions presented in the study are included in the article/Supplementary material, further inquiries can be directed to the corresponding author/s.
The studies involving human participants were reviewed and approved by Ethical Committee of the International Institute of Tropical Agriculture, PMB 5320 Oyo Road, Ibadan, Oyo State, Nigeria. Written informed consent for participation was not required for this study in accordance with the national legislation and the institutional requirements.
WA, HO, and BM-D: conceptualization, methodology, formal analysis, investigation, visualization, writing—original draft, and writing-review and editing. BM-D, EA, and MA: supervision, project administration, and writing—review and editing. All authors contributed to the article and approved the submitted version.
The Next Generation (NEXTGEN) Cassava Project, with funding from the Bill & Melinda Gates Foundation and the Department for International Development of the United Kingdom, supported this study.
We acknowledged the CGIAR Research Program's support of Roots, Tubers, and Bananas (RTB), the staff of the Food and Nutrition Sciences Laboratory, and the Cassava Breeding Units especially Dr. Ismail Rabbi, of IITA, Ibadan, Nigeria.
The authors declare that the research was conducted in the absence of any commercial or financial relationships that could be construed as a potential conflict of interest.
All claims expressed in this article are solely those of the authors and do not necessarily represent those of their affiliated organizations, or those of the publisher, the editors and the reviewers. Any product that may be evaluated in this article, or claim that may be made by its manufacturer, is not guaranteed or endorsed by the publisher.
The Supplementary Material for this article can be found online at: https://www.frontiersin.org/articles/10.3389/fsufs.2022.984687/full#supplementary-material
Abass, A. B., Awoyale, W., and Alamu, E. O. (2018). Assessment of the chemical and trace metal composition of dried cassava products from Nigeria. Quality Assur. Safety Crops Foods. 11, 1–10. doi: 10.3920/QAS2018.1273
Abass, A. B., Awoyale, W., Ogundapo, A., Oluwasoga, O., Nwaoliwe, G., Oyelekan, J., et al. (2022). Adoption of improved cassava varieties by processors is linked to processing characteristics and products biophysical attributes. J. Food Process. Preserv. 46, e16350. doi: 10.1111/jfpp.16350
Abass, A. B., Dziedzoave, N. T., Alenkhe, B. E., and James, B. D. (2012). “Quality management manual for the production of gari,” in International Institute of Tropical Agriculture. p. 50. Available online at: https://cgspace.cgiar.org/handle/10568/82527 (accessed April 5, 2022).
Adebowale, A. A., Sanni, L. O., and Onitilo, M. O. (2008). Chemical composition and pasting properties of tapioca grits from different cassava varieties and roasting methods. Africa J. Food Sci. 2, 077–082. Available online at: http://www.academicjournals.org/ajfs
Afoakwa, E. O., Budu, A., Asiedu, S., Chiwona-Karltun, C., and Nyirenda, D. B. (2012). Viscoelastic properties and physicofunctional characterization of six high yielding cassava mosaic disease-resistant cassava (Manihot Esculenta Crantz) Genotypes. J. Nutr. Food Sci. 2, 129. doi: 10.4172/2155-9600.1000129
Agele, S., Aiyelari, O., Olayemi, L., and Ogundipe, J. (2018). Tuber yield, chemical and nutritional properties, and end-user traits among cassava (Manihot esculenta cranz) varieties. Int. J. Hortic. 8, 69–82. doi: 10.5376/ijh.2018.08.0007
Akingbala, J. O., Oyewole, O. B., Uzo-Peters, P. I., Karim, R. O., and Bacuss-Taylor, G. S. H. (2005). Evaluating stored cassava quality in gari production. J. Food, Agric. Environ. 3, 75–80.
AOAC (2000). Association of Official Analytical Chemists. Official Methods of Analysis of the Association of Official Analytical Chemists. 17th edn. Washington, D.C. USA: Association of Official Analytical Chemists.
Ashraf, S., Anjum, F. M., Nadeem, M., and Riaz, A. (2012). Functional and technological aspects of resistant starch. Pakistan J. Food Sci. 22, 90–95.
Awoyale, W., Asiedu, R., Kawalawu, W. K. C., Abass, A., Maziya-Dixon, B., Kromah, A., et al. (2020). Assessment of the suitability of different cassava varieties for gari and fufu flour production in Liberia. Asian Food Sci. J. 14, 36–52. doi: 10.9734/afsj/2020/v14i230128
Awoyale, W., Oyedele, H., Adenitan, A. A., Adesokan, M., Alamu, E. O., and Maziya-Dixon, B. (2022). Relationship between quality attributes of backslopped fermented gari and the sensory and instrumental texture profile of the cooked dough (eba). J. Food Process. Preserv. 46, e16115. doi: 10.1111/jfpp.16115
Awoyale, W., Oyedele, H., Adenitan, A. A., Alamu, E. O., and Maziya-Dixon, B. (2021a). Comparing the functional and pasting properties of gari and the sensory attributes of the eba produced using backslopped and spontaneous fermentation methods. Cogent Food Agric. 7, 1883827. doi: 10.1080/23311932.2021.1883827
Awoyale, W., Oyedele, H., Adenitan, A. A., Alamu, E. O., and Maziya-Dixon, B. (2021b). Comparing backslopped and spontaneous fermentation based on the chemical composition and sensory properties of gari. J. Culinary Sci. Technol. 1–17. doi: 10.1080/15428052.2021.1955792
Awoyale, W., Sanni, L. O., Shittu, T. A., and Adegunwa, M. O. (2015). Effect of varieties on the functional and pasting properties of biofortified cassava root starches. J. Food Measur. Characteriz. 9, 225–232. doi: 10.1007/s11694-015-9227-6
Baah, F. D., Maziya-Dixon, B., Asiedu, R., Oduro, I., and Ellis, W. O. (2009). The nutritional and biochemical composition of D. alata (Dioscorea spp.) tubers. J. Food, Agric. Environ. 7, 373378.
Codex Alimentarius Commission (1985). Joint FAO/WHO Food Standard Programme. Codex standard for Miscellaneous Products (1st ed.). (supplement 1 to Codex Alimentarius, volume xii).
Dimkpa, S. O. N., and Theophilus, A. J. (2021). Varietal evaluation of the chemical composition, field performance, and yield of some improved cassava (Manihot esculenta crantz) varieties in Rivers State, Nigeria. Global J. Agric. Res. 9, 27–37.
Essers, A. J. A., Bosveld, M., Van der Grift, R. M., and Voragen, A. G. J. (1993). Studies on the quantification of specific cyanogens in cassava products and the introduction of a new chromogen. J. Sci. Food Agric. 63, 287–296. doi: 10.1002/jsfa.2740630305
Falade, K. O., and Olugbuyi, A. O. (2010). Effects of maturity and drying method on the physicochemical and reconstitution properties of plantain flour. Int. J. Food Sci. Technol. 45, 170–178. doi: 10.1111/j.1365-2621.2009.02118.x
Ikegwu, O. J., Nwobasi, V. N., Odoli, M. O., and Oledinma, N. U. (2009). Evaluation of the pasting and some functional properties of starch isolated from some improved cassava varieties in Nigeria. Africa J. Biotechnol. 8, 2310–2315. doi: 10.5897/AJB09.161
Ikujenlola, A. V. (2014). Chemical and functional properties of complementary food from malted and unmalted acha (Digitaria exilis), soybean (Glycine max), and defatted sesame seeds (Sesamum indicum.). Afr. J. Food Sci. 8, 361–367. doi: 10.5897/AJFS2014.1173
Ndjouenkeu, R., Kegah, F. N., Teeken, B., Okoye, B., Madu, T., Olaosebikan, O. D., et al. (2021). From cassava to gari: Mapping quality characteristics and end-user preferences of food products in Cameroon and Nigeria. Int. J. Food Sci. Technol. 56, 1223–1238. doi: 10.1111/ijfs.14790
Newport Scientific (1998). Applications Manual for the Rapid Viscotm Analyzer Using Thermocline for Windows. Warriewood, NSW: Newport ScientificPty Ltd., 26.
Nwancho, S., Ekwu, F., Mgbebu, P., Njoku, C., and Okoro, C. (2014). Effect of particle size on the functional, pasting, and textural properties of gari produced from fresh cassava roots and dry chips. Int. J. Eng. Sci. 3, 50–55. Available online at: www.theijes.com
Olanrewaju, A. S. (2016). Effect of Garification(roasting) duration on the quality characteristics of Cassava Gari. Ann. Food Sci. Technol. 17, 358–366. Available online at: www.afst.valahia.ro
Olanrewaju, A. S., and Idowu, O. E. (2017). Quality assessment of cassava gari produced in some selected local governments of Ekiti State, Nigeria. Am. J. Food Sci. Nutr. 4, 36–41. Available online at: http://www.aascit.org/journal/ajfsn
Olatunde, G. O., Arogundade, L. K., Oluwaponmile, I., and Orija, O. I. (2017). Chemical, functional, and pasting properties of banana and plantain starches modified by pre-gelatinization, oxidation, and acetylation. Cogent Food Agric. 3, 1. doi: 10.1080/23311932.2017.1283079
Oluwamukomi, M. O., and Jolayemi, O. S. (2012). Physicothermal and pasting properties of soy-melon-enriched “gari” semolina from cassava. Agric. Eng. Int. 14, 105–116. Available online at: http://www.cigrjournal.org
Onitilo, M. O., Sanni, L. O., Daniel, I., Maziya-Dixon, B., and Dixon, A. (2007). Physicochemical and functional properties of native starches from cassava varieties in Southwest Nigeria. J. Food, Agric. Environ. 5, 108–114. Available online at: https://hdl.handle.net/10568/92196
Owuamanam, C. I., Iwouno, J. O., Ihediohanma, N. C., and Barber, L. I. (2010). Cyanide reduction, functional and sensory quality of gari as affected by ph, temperature and fermentation time. Pakistan J. Nutr. 9, 980–986. doi: 10.3923/pjn.2010.980.986
Oyeyinka, S., Oyeyinka, A., Karim, O., Kayode, R., Balogun, M., et al. (2013). Quality attributes of weevils (Callosobruchus maculatus) infested cowpea (Vigna unguiculata) products. Nigeria J. Agric. Food Environ. 9, 16–22.
Oyeyinka, S. A., Adesoye, A. A., Oladipo, J. O., Akintayo, O. A., Adediran, O. J., Badmos, A. A., et al. (2020). Physical, chemical, and sensory properties of flakes (gari) prepared from refrigerated cassava roots. Agrosearch 20, 118–132. doi: 10.4314/agrosh.v20i1.11S
Sanni, L. O., Adebowale, A. A., Awoyale, W., and Fetuga, G. O. (2008). Quality of gari (roasted cassava mash) in Lagos State, Nigeria. Nigerian Food J. 26, 125–134. doi: 10.4314/nifoj.v26i2.47446
Sanni, L. O., Adebowale, A. A., Filani, T. A., Oyewole, O. B., and Westby, A. (2006). Quality of flash and rotary dried fufu flour. J. Food, Agric. Environ. 4, 74–78. doi: 10.1234/4.2006.920
Teeken, B., Olaosebikan, O., Haleegoah, J., Oladejo, E., Madu, T., Bello, A., et al. (2018). Cassava trait preferences of men and women farmers in Nigeria: Implications for breeding. Econ. Botany, 72, 263–277. doi: 10.1007/s12231-018-9421-7
Thiele, G., Dufour, D., Vernier, P., Mwanga, R. O. M., Parker, M. L., Schulte Geldermann, E., et al. (2021). A review of varietal change in roots, tubers and bananas: Consumer preferences and other drivers of adoption and implications for breeding. Int. J. Food Sci. Technol. 56, 1076–1092. doi: 10.1111/ijfs.14684
Udensi, U. E., Tarawali, G., Ebere, U. F., Asumugha, G., Ezedinma, C., Okoye, B. C., et al. (2011). Adoption of selected improved cassava varieties among smallholder farmers in South-Eastern Nigeria. J. Food, Agric. Environ. 9, 329–335. Available online at: www.world-food.net
Keywords: improved cassava genotype, gari/eba, quality attributes, varietal substitution, adopted cassava variety
Citation: Awoyale W, Oyedele H, Adesokan M, Alamu EO and Maziya-Dixon B (2022) Can improved cassava genotypes from the breeding program substitute the adopted variety for gari production? Biophysical and textural attributes approach. Front. Sustain. Food Syst. 6:984687. doi: 10.3389/fsufs.2022.984687
Received: 02 July 2022; Accepted: 01 August 2022;
Published: 23 August 2022.
Edited by:
Samuel Ayofemi Olalekan Adeyeye, Hindustan University, IndiaReviewed by:
Sunil C. K., Indian Institute of Food Processing Technology, IndiaCopyright © 2022 Awoyale, Oyedele, Adesokan, Alamu and Maziya-Dixon. This is an open-access article distributed under the terms of the Creative Commons Attribution License (CC BY). The use, distribution or reproduction in other forums is permitted, provided the original author(s) and the copyright owner(s) are credited and that the original publication in this journal is cited, in accordance with accepted academic practice. No use, distribution or reproduction is permitted which does not comply with these terms.
*Correspondence: Busie Maziya-Dixon, Yi5tYXppeWEtZGl4b25AY2dpYXIub3Jn
Disclaimer: All claims expressed in this article are solely those of the authors and do not necessarily represent those of their affiliated organizations, or those of the publisher, the editors and the reviewers. Any product that may be evaluated in this article or claim that may be made by its manufacturer is not guaranteed or endorsed by the publisher.
Research integrity at Frontiers
Learn more about the work of our research integrity team to safeguard the quality of each article we publish.