 Tshidi Mokgadi Nkgudi
 Matome Moshobane Simeon Maake
 Mosima Rachel Masekoameng
- Department of Agriculture and Animal Health, University of South Africa, Johannesburg, South Africa
The South African government initiated the Ilima-Letsema programme to promote sustainable agricultural activities and improve the livelihoods of households in farming communities. The purpose of the paper is to evaluate the Ilima-Letsema programme's contribution to job creation and poverty alleviation in the Midvaal Local Municipality of Gauteng Province, South Africa. The quantitative research approach and survey design were used to conduct the study. Data were collected from 196 beneficiaries of the programme through face-to-face interviews using structured questionnaires. Primary data were analyzed using descriptive statistics, T-test, Multiple Linear Regression (MLR), Correlation, Cochran's Q and McNemar tests. The results indicated that the Ilima-Letsema programme significantly increased farmers' income and created jobs. Net farm income was positively and significantly influenced by education level, farmland size and jobs created. Net farm income was a significant predictor of jobs created in the post-support era, whereas education level and farmland size had negative impact. In addition, the programme significantly uplifted the elite beneficiaries from the upper-bound poverty line (UPBL); however, it did not uplift poor farmers from the food poverty line (FPL) and lower bound poverty line (LBPL). Education, farmland size and income had a positive and significant correlation (p < 0.05) with the programme's ability to uplift the beneficiaries from FPL, UBPL and UPBL amounts. It is recommended that Ilima-Letsema's rollout and budget should be expanded to enable more farmers to generate income and create employment opportunities for unskilled laborers in the agricultural sector. Again, the criteria for the programme should be changed in favor of less educated and resource-poor smallholder farmers, and producers with low net income.
Introduction
About 736 million people live in extreme poverty globally, especially in rural areas where the majority depend on agriculture to sustain their livelihoods [(Food Agricultural Organisation (FAO), 2019)]. Thus, poverty remains a global challenge for many poor households. In Africa, 368 million people were living below the poverty line in 2008 compared to 204 million in 1991 (Anyanwu, 2013). This is an indication that poverty is present in one of the poorest continents in the world because the number of people living below the international poverty line has increased significantly over nearly three decades. In South Africa, about a quarter of the population (6.8 million people) live below the food poverty line [(Statistics South Africa (Stats SA), 2019)]. Moreover, South Africa experiences both chronic poverty and chronic food insecurity at the household level (Alemu, 2015; Ngema et al., 2018). Poverty prevails amongst black Africans and colored people in South Africa [(Statistics South Africa, 2019)]. It is not surprising that poverty is dominant in these racial groups because apartheid policies in South Africa were skewed toward the development of white people even though black Africans are the majority in the country. As a result, South Africa has the highest rate of income inequality and absolute poverty compared to other middle-income countries [(Altman et al., 2009; Statistics South Africa (Stats SA), 2018)]. In response to the prevalent inequality, South Africa's government, through its National Development Plan (NDP), aims to eliminate poverty by 2030 (Masilela, 2013). However, income inequality and absolute poverty levels are still high despite the government's efforts (Meiring et al., 2018). Progress has been made to address extreme poverty using various tax systems such as social grants (child support, foster child, old age, disability and war veteran grants) food parcel relief scheme and vouchers for social relief of distress [(Statistics South Africa (Stats SA), 2015a)]. However, income disparity, poverty and poor quality of life prevail because people have no adequate access to services critical to escaping poverty [(Statistics South Africa (Stats SA), 2015b)]. To eradicate poverty, households should be food secure; however, most South African households are food insecure, yet nationally the country is regarded as food secure (De Cock et al., 2013).
Since 1994, there has been progress in reducing poverty but there was a reverse in that trajectory between 2011 and 2015, which nearly threatened all the gains made since 1994. This slid at least three million more South Africans into poverty, which resulted in an increase in poverty from 36 to 40% (World Bank Group, 2018). According to World Bank Group (2018), the number of South Africans living below Food Poverty Line (FPL) amount decreased from 28% in 2006 to 25% in 2015. The conforming decrease was from 51 to 40 percent at LBPL, while it declined from 66.6 to 55.5% at the UBPL. In absolute terms, around 2.3 million South Africans escaped poverty at the LBPL and 1.2 million at the UBPL; however, around 343,000 more South Africans were poor based on the FPL in 2015 than in 2006 (World Bank Group, 2018). According to Masuku et al. (2017), South Africa is “food-secure” at a national level because it is capable of producing adequate calories to feed its 53 million inhabitants. Masuku et al. (2017) contends that, although the country is food secure at national level, a huge percentage of the households were food insecure. Even though, the country has made positive development since 1994, quarter of the population suffers from hunger regularly; in addition, more than half of the population live in hazardous conditions that expose them to hunger (Oxfam, 2014). The South African government has initiated various farmer support programmes to improve the livelihoods of farming communities where poverty and food insecurity are prevalent. Some of the farmer support programmes initiated by the national and provincial departments of agriculture are the Land Care Programme, Comprehensive Agricultural Support Programme (CASP), Micro Agricultural Financial Institutions of South Africa (MAFISA), Ilima-Letsema programme, Recapitalization and Development Programme (RADP), Fetsa Tlala Integrated Food Production Initiative and Siyasondla Homestead Food Gardens. The purpose of these farmer support programmes is to improve food production and create employment opportunities. By creating employment opportunities, people will earn an income and escape from the poverty trap. According to Xaba and Dlamini (2015), the introduction of agricultural support programmes has played a notable role in poverty alleviation, food production, creation of employment and economic development. Moreover, farmer support programmes have improved crop yields and food security and enabled farming communities to generate income to sustain their livelihoods (Tshuma, 2013). The establishment of these programmes shows that the South African government intends to reduce poverty amongst poor farmers and agricultural households (Cousins et al., 2018).
As one of the farmer support programmes in South Africa, Ilima-Letsema was initiated in 2008 to boost household food production, predominantly targeting subsistence and smallholder farmers, although commercial farmers were also included [(Department Performance Monitoring and Evaluation (DPME), 2013)]. A subsistence farmer is a producer who uses all of the crops or livestock produced to sustain their livelihoods and that of their families, leaving a slight portion (< 50%) of their produce, if any excess, for sale or trade [(Kostov and Lingard, 2004; Food Agricultural Organisation (FAO), 2012)]. The definition of smallholder farmers differs from countries and ecological region. The South African Department of Agriculture, Forestry and Fisheries (DAFF) refers to smallholder farmers as small-scale, resource poor and peasant farmers (Department Agriculture, Forestry and Fisheries (DAFF), 2012). Smallholders are resource poor producers who manages agricultural land less than one to ten hectares (< 1–10 ha) to cultivate one or two cash crops using family labor and consuming part of their produce with their families [(Department Agriculture, Forestry and Fisheries (DAFF), 2012; Food Agricultural Organisation (FAO), 2012)]. These two farmers differ in a sense that subsistence farmer produces solely for household consumption and sell if there is surplus, whereas small-scale farmers produces for the household and market. In supporting the aforementioned group of farmers, Greenberg et al. (2018) reported that the primary aim of Ilima-Letsema programme is to address the triple challenges of poverty, unemployment and inequality, through increased food production for vulnerable households with an emphasis on women and youth as well as smallholder farmers. On average, the Ilima-Letsema programme supports ~70,927 farmers per year in the country with production inputs such as fertilizers, seeds, seedlings, breeding animals and poultry, animal feed and medication, machinery and equipment, and irrigation infrastructure [(Department Agriculture, Forestry and Fisheries (DAFF), 2017)]. However, about 3,080 benefitted from the programme in Midvaal local municipality between 2008 and 2017. More than R3 billion had been spent on the Ilima-Letsema programme since its inception more than a decade ago [(Department Agriculture, Forestry and Fisheries (DAFF), 2017; Greenberg et al., 2018)]. However, there is limited information documented about the socio-economic impact of the programme, especially from poverty alleviation and employment creation perspectives. The same sentiments can be shared about other farmers' support programmes that have been initiated in the Republic of South Africa (RSA) since the dawn of democracy in 1994. For example, studies that have evaluated farmers' support programmes such as CASP, RADP, MAFISA and homestead food garden programme focused on the impact of the programmes on agricultural production [(Ledwaba, 2013; Sikwela and Mushunje, 2013; Department of Performance Monitoring and Evaluation (DPME), 2015; Phatudi-Mphahlele, 2016; Ngcobo, 2018); (Rakoena et al., 2022)]; income [(Ledwaba, 2013; Sikwela and Mushunje, 2013; Department of Performance Monitoring and Evaluation (DPME), 2015; Phatudi-Mphahlele, 2016)]; food security (Tlalang, 2016); market access, livelihoods and farmer development [(Department of Performance Monitoring and Evaluation (DPME), 2015)]. In addition, Oladele and Ward (2017) measured the impact of MAFISA on human, financial, physical, social and natural capital. Ntlou (2016) deliberated on the impact of RADP on economic sustainability. As a result, the study's objective was to explore how the Ilima-Letsema programme has contributed to job creation, improved net income, and uplifted beneficiaries from the poverty trap. Moreover, the factors influencing the programme's contribution to poverty alleviation, net farm income and jobs created were determined. The theoretical framework that guided the study is presented in Figure 1.
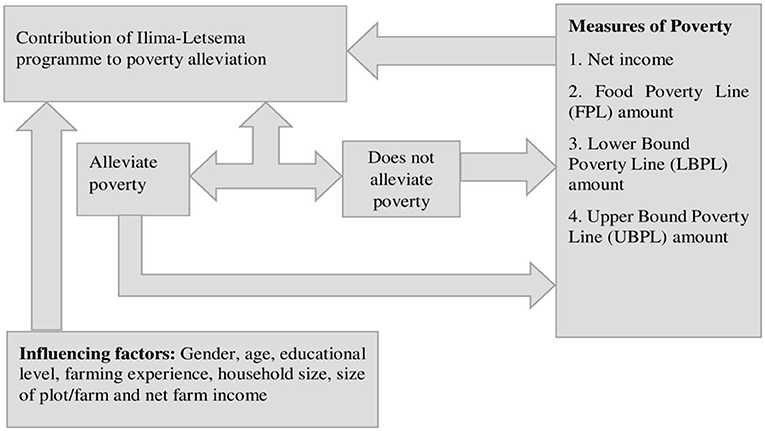
Figure 1. Theoretical framework of the study.
Research methodology
The study was conducted in the Midvaal Local Municipality in the Sedibeng District Municipality, Gauteng Province, South Africa. The Midvaal Local Municipality covers an approximate area of 1,722 km2 (Integrated Development Plan (IDP), 2018) and is one of three local municipalities in the Sedibeng District; the other two local municipalities are Emfuleni and Lesedi. It is in the southern part of Gauteng Province and borders Mpumalanga Province to the east and the Free State Province to the south. In 2011, the municipality had a total population of 95,300, comprising Black and White South Africans. The municipality has 14 wards and about 29,852 households [(Statistics South Africa (Stats SA), 2011)]. The Midvaal Local Municipality's spatial arrangement is mainly rural, with farming constituting ~50% of the total area of jurisdiction and contributing about 1.5% toward the Gross Value Added (GVA) in the municipality (Integrated Development Plan (IDP), 2018). Agriculture is the main employer of unskilled and semi-skilled laborers and ensures that local communities within the municipality are food secure (Integrated Development Plan (IDP), 2018).
The study was conducted using a quantitative research approach and descriptive design in the form of a survey. The population of analysis were the beneficiaries of the Ilima-Letsema programme in Midvaal since 2008. A list of 3,080 active and non-active community members who benefitted from the Ilima-Letsema programme in Midvaal since its inception in 2008 was acquired from GDARD. The type of support received by the participants from the Ilima-Letsema programme included production inputs (animal feed and medication, fertilizers, herbicides, pesticides), livestock, water pumps, irrigation systems and equipment (implements and garden tools). Large proportion of the farmers received seeds (81.1%), fertilizers (68.9%) and garden tools (56.6%). About 38.8% received animal feeds through the programme while more than one-thirds were supported with other production inputs such as animal medication (14.3%), herbicides (10.7%) and pesticides (10.7%). From the respondents who received livestock, 9.2% was broilers, followed by pigs and layers with 5.6 and 3.1%, respectively. Lastly, < 10% of the farmers were provided with irrigation equipment (6.1%), water pump (2.0%) and implements (1.0%). Yamane's formula was used to determine the adequate sample size (Yamane, 1967). The formula is as follows:
Where;
n = required sample size;
N = total population;
e = margin of error (0.05);
According to the formula's calculations, the ideal sample size for this study was 354. However, only 196 (n = 196) farmers were interviewed during the survey because others were unwilling to participate in the study. Therefore, the response rate for the survey was 55.4% and 6.4% of the total population. The sample size of 195 was accepted because research has shown that it is common to obtain response rate below 100% in survey research (Cook et al., 2000; Dommeyer et al., 2004). Nulty (2008) reported an average response rate of 56% from a review of several studies that conducted survey research. Again, Edwards (2005) reported that most research integrity committees maintains that potential research participants reserve total rights of withdrawal at any time without giving reason(s) for their decision. In the current study, all the participants completed and signed a consent form before they were interviewed during data collection. The purpose was to familiarize the participants with the study aim and objectives, and inform them about their rights to participate and withdraw their participation in the study at any stage without giving a reason. Data was collected through face-to-face interviews using a structured survey questionnaire. Statistical Package for the Social Sciences (SPSS) version 27 was employed to analyse data. The analysis included descriptive statistics such as the mean, frequencies, percentage, standard deviation and standard error of the mean. Furthermore, in determining the Ilima-Letsema programme's impact on job creation and net farm income, data were analyzed using a t-test. T-tests compare the values of a specific continuous variable for two groups or two occasions (Hole, 2009; Maggio and Sawilowsky, 2013). Thus, the number of jobs the respondents created at their farmland size before and after receiving support from the Ilima-Letsema programme was compared. The same comparison was applied to net farm income before and after receiving support from the programme. In addition, Multiple Linear Regression (MLR) model was performed to ascertain factors influencing annual net farm income and jobs created by the respondents after receiving support from Ilima-Letsema programme. In model 1, annual net farm income was used as a dependant variable. The model specification for Multiple Linear Regression used is as follows:
Where:
Y = Annual net farm income (in ZAR),
α = Constant (intercept),
β = Coefficient if the independent variable increase by one unit,
X1 = Gender (1 = Female, 2 = Male),
X2 = Age (1 = 18–30 years; 2 = 31–40 years; 3 = 41–50; 4 = 51–60; 5 = above 60 years),
X3 = Education level (1 = Never been to school; 2 = No formal education; 3 = Primary; 4 = Secondary; 5 = Adult Basic Education and Training; 6 = College; 7 = University),
X4 = Farming experience (in years),
X5 = Household size (in numbers),
X6 = Farmland size (in hectares),
X7 = Jobs created after receiving support (in numbers),
μ = the random error term,
In model 2, the number of jobs created by the respondents after receiving support from the programme was a dependant variable (Y). The first six independent variables (X1 to X6) were the same as in model 1. Net farm income was added as the seventh independent variables (X7) in the model. Furthermore, the Ilima-Letsema programme's contribution to poverty alleviation was determined using the national poverty lines for South Africa, namely the food poverty line (FPL), the lower-bound poverty line (LBPL) and the upper-bound poverty line (UBPL) between 2006 and 2018. The food poverty line amount implied that individuals could afford the minimum daily energy intake required, whereas the LBPL amount includes FPL plus other household's non-food items with a total expenditure of the food poverty line [(Statistics South Africa (Stats SA), 2019)]. Furthermore, UBPL include FPL plus the average amount derived from the household's average income with food expenditure that is the same as the food poverty line. The following formula was used:
The poverty line amount per person for all three measures was compared to the amount for South Africa in the year in which the respondents received support, against 2018, the year when the data were collected for the current study. The amount for the poverty line was measured in South African Rands (ZAR). The poverty line amounts between 2006 and 2018 for FPL ranged from R219 (32.30 US$) to R547 (41.29 US$), LBPL was R370 (54.56 US$) to R785 (59.26 US$), and UBPL ranged from R575 (84.81 US$) to R1183 (89.30 US$) (see Table 1).
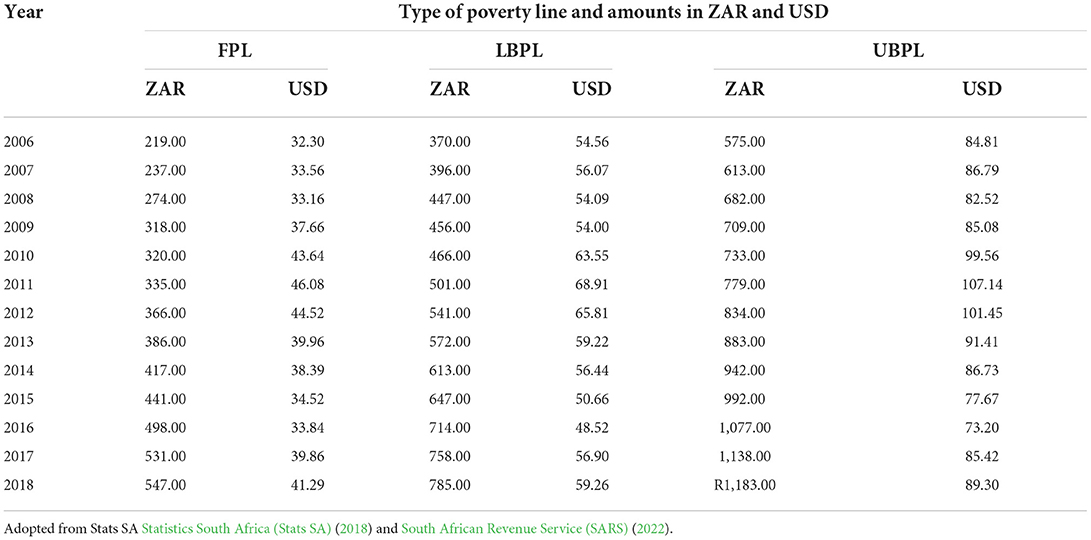
Table 1. The national poverty lines for South Africa from 2006 to 2018.
The respondents were categorized according to the poverty line amount. “Yes” responses implied that the programme uplifted them, and “No” responses were given by those whose amount was below FPL, LBPL and UBPL. These responses were categorized as 0 = No and 1 = Yes. Farmers' income was compared with the amount for each Poverty line. For example, if farmer's income was above a specific poverty line amount, the respondent was categorized as Yes (1); if not, it was No (0). Therefore, poverty line amounts for the year in which the farmer benefitted from the programme and after were used as pre- and post-support, respectively. Post-test was 2018 when primary data was collected. The purpose of categorizing into zero and one was to prepare it for further analysis using a non-parametric test. In comparing pre- and post-support data, the McNemar Chi-square test was utilized to compare pre- and post-support poverty status of the respondents. As explained previously, the type of data was nominal. McNemar test statistics can compare nominal data for pre- and post-test (Dayton, 2017). According to Sheskin (2011), each pair of groups in the McNemar Test is computed as follows:
Where:
n1= number of subjects where group “a” response = 0 and group “b” response = 1,
n2= number of subjects where group “a” response = 1 and group “b” response = 2,
For large samples,
n ≥ 4 and nk ≥ 24, where n is the number of subjects for which the responses are not all 0s and 1s. In large samples, M test statistic is asymptotically distributed as chi-square with one degree of freedom. Individual test's p-value with protected overall alpha, α, is computed as follows:
Where is the value of the (1−αadj) quantile of the chi-square distribution with one degree of freedom.
In addition, Cochran's Q test was performed to compare the impact of the Ilima-Letsema programme between FPL, LBPL and UBPL. According to Sheskin (2011), Cochran's Q test statistic for a binary response, Yi, j, in k matched groups from N subject, is computed as follows:
Where,
Because the sample size was large, Q test statistics were distributed as chi-square with k−1 degrees of freedom. As a result, subjects without the same response in all categories contribute to the overall Q statistic (refer to the McNemar equation below because the principles are the same). The p-value for the test was computed as follows:
Where is the value of the (1−α) quantile of the chi-square distribution with k−1 degree of freedom.
Lastly, the Kendall correlation was used to measure the association between poverty lines (FPL, UBPL and UPBL) and the socio-demographic characteristics of the respondents. Kendall's tau correlation was chosen because it can perform correlation for data containing ordinal-continuous and ordinal-ordinal variables (Khamis, 2008).
Results
Socio-demographic characteristics of the participants
The socio-demographic characteristics of the participants in the study were measured in terms of age, gender, farm, education level, net income, farming experience, the main source of income and household size. The results of the socio-demographics of the participants are presented in Table 2. The results in Table 2 show that most farmers who received support from the Ilima-Letsema programme were men farming on smallholder farms (mean = 4.42 ha). The group consisted of both large- and small-scale farmers of which the majority were crop farmers. However, 7.7% were no longer engaged in farming after receiving support. In terms of age, about 60.7% were ≥50 years, of which, more than three quarters were above 60 years of age. This clearly showed that there was less youth participation in agriculture because fewer than 20% were youths (18–40 years). The respondents were well experienced in agriculture because they have been farming for about 10 years, on average. Nonetheless, there were more- and less-experienced farmers in the study area. Moreover, about four-fifths of the respondents acquired formal basic education such as primary, secondary, Adult Basic Education and Training (ABET), college and university education. This implied that most of the sampled farmers in Midvaal could read and write because they had basic education. The study area was dominated by farmers who relied on farming as their main source of income. Thus, most beneficiaries depended on farming to sustain their livelihoods. On average, the respondents' annual net farming income for the year 2017 was R47,513.59 (3,566.85 US$). The results implied that some respondents made a fortune from farming, while others did not earn any income at all. This was attributed to the fact that the respondents were farming for different reasons, including home consumption only, or home consumption and sales. The household size of the respondents was not big even though there was a small segment of families with nine members or so.
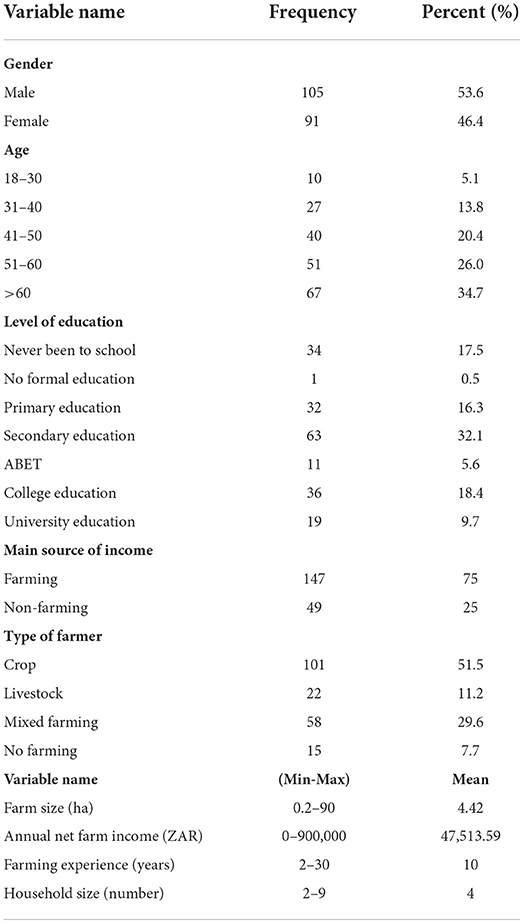
Table 2. Socio-demographic characteristics of the participants (n = 196).
Contribution of the programme to income and job creation
Net farm income and influencing factors
The study's findings showed that the average annual net income of the respondents was R24,238.27 (3,798.74 US$) before receiving support from the programme; this increased to R47,513.59 (5,749.47 US$) after receiving support, as shown in Table 3. The change was statistically significant at 1% significance level (p = 0.000), illustrating that the Ilima-Letsema programme significantly increased beneficiary farms' net income.
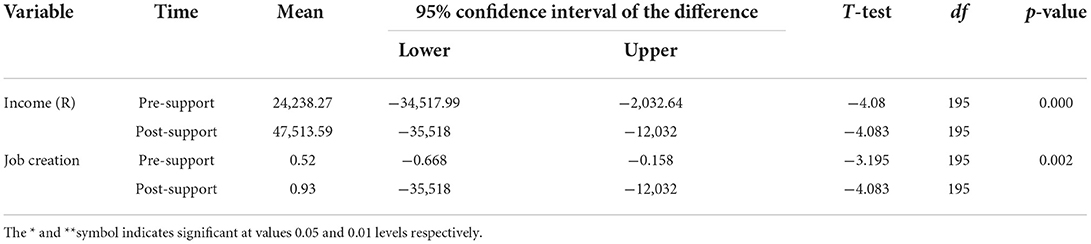
Table 3. T-test results of respondents' net farming income and number of people employed pre- and post-support (n = 196).
Multiple linear regression (MLR) was performed to determine factors influencing net farm income of the respondents after they received support from Ilima-Letsema programme. The results of model fit summary showed a strong relationship between the set of independent variables and dependant variable (R = 0.942). Again, R2 = 0.889 was obtained; thus, 88.9% of the variation in annual net farm income (dependant variable) was accounted for by independent variables. The value of adjusted R2 was 0.878. The results of ANOVA were as follows: F(7, 70) = 79.993, p < 0.001. Since the p-value is statistically significant, the findings implies that the regression model employed is a good fit of the data and it can predicts the dependent variable significantly. A positive auto-correlation was detected in the sample because the value of Durbin-Watson (DW) statistic obtained was 1.905. In addition, Variance Inflation Factors (VIF) ranged between 1.063 and 1.475. It implies that there was moderate multi-collinearity between the independent variables.
The results of the multiple linear regression analysis of the factors influencing annual net farm income of the respondents are presented in Table 4. The results shows that only four variables (education level, farmland size, and jobs created after receiving support) had positive and significant correlation with annual net farm income at 1% significance level (p < 0.01). The results of education level (β = 0.192; p < 0.001) means that, a unit increase in farmer's education level led to 0.192 unit increase in farmers' annual net farm income, with all things being equal. Therefore, highly educated farmers earned more income annually from their farming activities. This could be because educated farmers are more informed about new innovations that improve agricultural productivity, and ultimately increases income. Again, educated farmers may find it easy to access lucrative markets that offer better prices for their produce. Regarding farmland size (β = 0.184; p < 0.001), the findings implies that, a unit increase in farmland size increased farmers' annual net farm income by 0.184 units, when all things are held constant. Thus, large-scale farmers made more profit from their agricultural activities compared to small-scale farmers. This may be because producers farming on large scale achieved more outputs due to high scale of operation, and ultimately make more profit. Lastly, the results of jobs created after receiving support (β = 0.798; p < 0.001). With all things being equal, it means that a unit increase in farmer's annual net farm income lead to 0.795 unit increase in the number of jobs created in the post-support era. The aforementioned phenomenon was applicable when all factors were held constant. The reason could be that farmers who had more laborers achieved more agricultural outputs; thus, they earned more income by selling more produce.
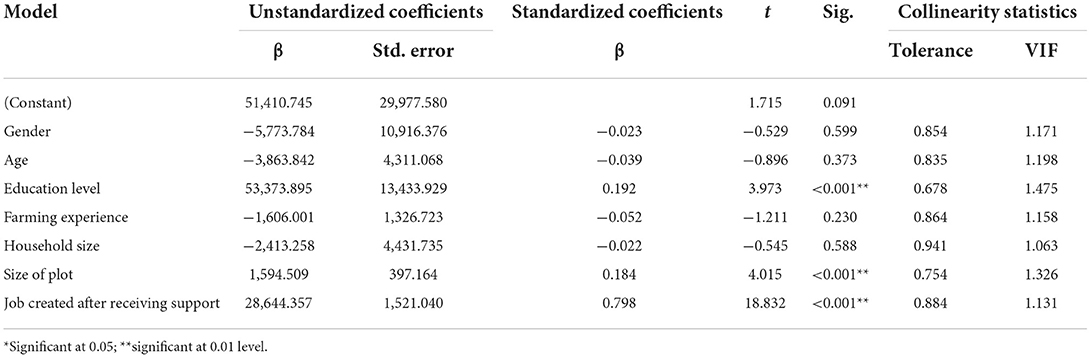
Table 4. Multiple linear regression results of the factors influencing annul net farm income in the post-support (n = 196).
Job creation and influencing factors
Table 3 depicts that before receiving support from the programme, the average number of people employed by the respondents was 0.52. This number increased to 0.93 after they received support from the programme. This increase was statistically significant (p = 0.002) at the 1% confidence interval, illustrating that the Ilima-Letsema programme significantly contributed to job creation in the study area. As a result, a multiple linear regression (MLR) was performed to ascertain factors influencing job created by the respondents. The results of the model-fit summary achieved R-value of 0.924; therefore, there was a positive relationship between the group of independent variables and dependant variable fitted in the model. Again, the value co-efficient of determination of R2 = 0.854 was obtained. It implies that 85.4% of the variation in the dependent variable (number of jobs created) was accounted for by the independent variable. The value of adjusted R2 obtained was 0.840; therefore, it was close to R2 value. ANOVA results are as follows: F(7, 70) = 58.602, p < 0.001. Since p-value from the ANOVA results was statistically significant, the regression model was a good fit for the data. The independent variable fitted in the regression model predicted the dependent variable significantly. Moreover, there was a negative autocorrelation detected in the sample because the value of the results of Durbin-Watson statistic was 2.221. The results of the correlation between independent variable (collinearity) obtained Variance Inflation Factors (VIF) values between 1.060 and 1.650; thus, there was moderate multi-collinearity between the variables.
The results of the Multiple Linear Regression analysis of the factors influencing job created by the respondents after receiving support are presented in Table 5. The results in Table 5 indicate that there were three significant predictors (education level, farmland size and net farm income after receiving support) of the jobs created by the respondents after receiving support from Ilima-Letsema programme. However, only one variable (net farm income after receiving support) was a positive and significant predictor. The other two variables (education level and farmland size) had negative and significant correlation with jobs created by the respondents after receiving support; thus, they were negative predictors. The statistical outputs of annual net farm income after receiving support (β = 1.047; p < 0.001) implies that, a unit increase in net farm income will results in 1.047 unit increase in jobs created, when all factors are held constant. The reason could be that farmers who made more profit from their agricultural activities could afford to hire additional people on their farms. The results of education (β = −0.152; p < 0.012) implies that a unit increase in education level resulted in 0.152 unit decrease in jobs created after receiving support, with all things being equal. Therefore, farmer's education level did not guarantee that they will create more jobs after receiving support from the programme. This could be because educated farmers are capable of determining the viability of creating employment opportunities; thus, they will create less jobs if it is not viable to do so. Again, a unit increase in farmland size resulted in 0.178 decrease in jobs created by the respondents after receiving support (β = −0.178; p < 0.002), with all factors held constant. It implies that, large-scale farmers created less employment opportunities after receiving support from Ilima-Letsema programme. The reason could be that large-scale farmers adopted innovations that requires less labor.
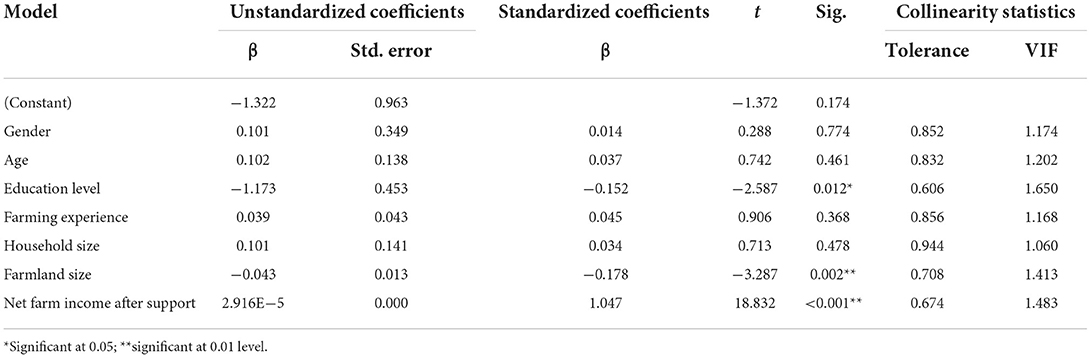
Table 5. Multiple linear regression results of the factors influencing job creation in the post-support (n = 196).
Ilima-Letsema's contribution to poverty alleviation
The Ilima-Letsema programme's contribution to poverty alleviation was analyzed using the Wilcoxon signed-rank test, by looking at the poverty lines before and after receiving support from the Ilima-Letsema programme. The types of poverty measured in the study were FPL, LBPL and UBPL. The monthly amount per person for FPL, LBPL and UBPL were R547 (41.29 US$), R785 (59.26 US$) and R1,183 (89.30 US$), respectively during data collection in 2018 (refer to Table 1 for more information). The results of the poverty status of the respondents before and after receiving support from the Ilima-Letsema programme are presented in Figure 2. The results in Figure 2 show that 34.2% of the respondents were living above the FPL amount before receiving support from the Ilima-Letsema programme; however, this number increased to 35.7% after receiving support. The mean score increased from 0.34 to 0.36 before and after receiving support, respectively. Thus, it also supports the change in the proportions. Prior to receiving support from the programme, 27% of the respondents were living above the LBPL amount, which increased to 30.6% after receiving support. This increase altered the mean score from 0.27 to 0.31 before and after receiving support, respectively. Moreover, about one-fifth (19.9%) of the respondents were living above the UBPL before receiving support, this increased to about a quarter (25.5%) after receiving support, as shown in Figure 2. This improvement resulted in an increase in the mean score from 0.20 to 0.26.
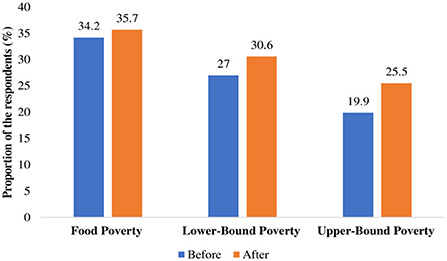
Figure 2. Poverty status of the respondents before and after receiving support from the Ilima-Letsema programme (n = 196).
The results of McNemar's test reported a non-significant (p = 0.710) chi-square value of 0.138 for FPL and significant value for UBPL (X2=3.704; p = 0.054). Therefore, the Ilima-Letsema programme significantly uplifted the beneficiaries from UBPL. However, the impact of the programme was insignificant on FPL (p = 0.710) and LBPL (p = 0.230). The results of post-support indicated that the programme uplifted 35.7, 30.6, and 25.5% of the respondents from FPL, LBPL and UPBL, respectively. As a result, further statistical analysis was performed using Cochran's Q test to compare the impact of the Ilima-Letsema programme between FPL, LBPL and UBPL. A significant (p = 0.000) test statistics value for Cochran's Q (30.000) was achieved with a degree of freedom (df) of two (2). The results of pairwise comparisons for FPL, LBPL and UBPL are presented in Table 6. The results in Table 6 indicate a statistically significant difference between the contributions of the Ilima-Letsema programme to FPL-LBPL, FPL-UBPL and LBPL-UBPL at 1% significance level. The results implied that the Ilima-Letsema programme significantly uplifted (t = −2.739; p = 0.006) most (35.7%) beneficiaries from FPL than LBPL (30.6%). Moreover, the impact of the programme was significantly higher (t = −5.477; p = 0.000) on FPL (35.7%) than UBPL (30.6%). Again, the Ilima-Letsema programme significantly (t = −2.739; p = 0.006) uplifted most farmers trapped in LBPL (30.6%) compared to UBPL (25.5%). Therefore, the Ilima-Letsema programme significantly uplifted most farmers from FPL than LBPL and UPBL. Moreover, the programme enabled most beneficiaries to afford basic food compared to other necessities such as electricity, water, education, clothing and others. The reason is that the amount for UPL was R547 (41.29 US$) in 2018 compared to the amount of R785 (59.26 US$) and R1,183 (89.30 US$) for LBPL and UBPL, respectively during the same period.
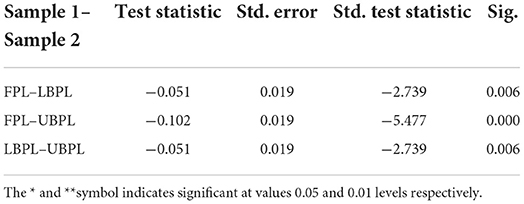
Table 6. Pairwise comparisons of the impact of the Ilima-Letsema programme on FPL, LBPL and UBPL (n = 196).
Determinants of Ilima-Letsema's contribution to poverty alleviation
The results of Kendall's tau_b correlation presented in Table 7 indicate that all three types of poverty lines (FPL, LBPL and UBPL) measured in the study were positively correlated with gender, age, education level, farming experience, farmland size and the net farm income. However, only three variables (education level, farmland size and net farm income) were statistically significant at 1% significance level. The results of education level implied that highly educated beneficiaries of the programme earned more farm income that enabled them to be above the FPL, LBPL and UBPL amounts of R547 (41.29 US$), R785 (59.26 US$) and R1,183 (89.30 US$), respectively. The reason could be that literate farmers were well-informed about the types of support that could improve the agricultural productivity of their farms. Again, highly educated farmers (28.1%) may have found it easy to make an application for the Ilima-Letsema support programme. It could also be that more educated farmers may have adopted high valued and more profitable agricultural enterprises as compared to less educated ones. The beneficiaries who occupied bigger farms and made more profit from farming after receiving support from the programme had incomes above the FPL, LBPL and UBPL amounts. This may be because the large scale of operation enabled farmers to generate more profit and ultimately achieve income above all types of poverty lines measured in the study.
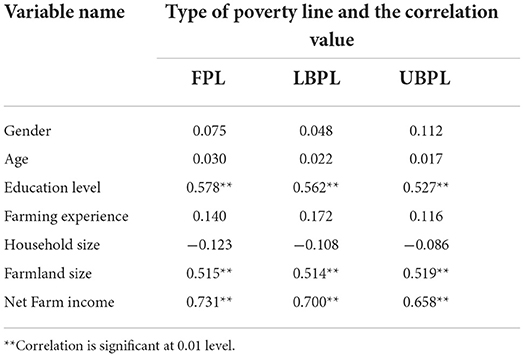
Table 7. Correlation results of the determinants of FPL, LBPL and UBPL (n = 196).
Discussions
Contribution of the programme to net farm income and job creation
The study discovered that the Ilima-Letsema programme significantly contributed to the annual net farm income and job creation. In support, Oladele and Ward (2017) found that in the North-West Province of South Africa, the income of smallholder farmers who received support from the government through Micro-Agricultural Financial Institutions of South Africa (MAFISA) increased significantly post-support. Again, in Gauteng Province of South Africa, the net farm income of the beneficiaries of the Comprehensive Agricultural Support Programme (CASP) was significantly higher than non-supported projects (Phatudi-Mphahlele, 2016). Similar findings were discovered in Nigeria (Nwachukwu and Ezeh, 2007); Zambia (Funsani et al., 2016) whereby a farmer's income increased significantly because of support programmes. The findings imply that agricultural support programmes that provide production inputs, livestock, water pumps, irrigation systems and equipment have the potential to increase net farm income. Therefore, the Ilima-Letsema programme improved the livelihoods of the beneficiaries because it increased their net farm income significantly. On the contrary, Kan et al. (2018) found that support programmes had an insignificant impact on the farmer's income. The type of support provided to the farmers could influence the variation; hence, there is a degree of polarization about the impact of the support programme on net farm income. The findings indicated that education level, farmland size, and jobs created after receiving support were positive and significant predictors of annual net farm income. In support, Bizimana et al. (2004), Mabe et al. (2010), and Onuk et al. (2017) found that education positively and significantly influences farmer's net income; thus highly literate farmers made more profit from their agricultural activities. In contrast, Kanyua et al. (2015), found that the relationship between net farm income and education was positive and insignificant. The results of plot or farm size were in agreement with Bizimana et al. (2004), Emerole et al. (2006), Ibekwe et al. (2010), and Onuk et al. (2017) who reported a positive and significant correlation between net income and farmland size. An increase in farmer's scale of operation enabled them to earn more income from farming activities. Thus, the support programme did not significantly reduce income variation between small- and large-scale farmers. However, farmers who created more employment opportunities in the post-support era made significant profit from their agricultural operations. Similarly, Barbieri and Mshenga (2008) reported a positive and significant influence of the number of employees on farm income. Employing more laborers at the farm is more likely to increase agricultural production, and ultimately improve farm income or profit.
Regarding employment creation, similar findings were made by Phatudi-Mphahlele (2016) who reported that CASP supported projects created a significant number of employment opportunities compared to non-supported projects. One of the objectives of the Ilima-Letsema programme is to create one million jobs according to the National Development Plan (NDP) 2030 vision and put one million hectares of unutilised land under production. It shows the achievements of Ilima-Letsema regarding the creation of employment opportunities associated with the objectives of the programme. Therefore, the government should continue to support emerging and smallholder farmers to enable them to create employment opportunities. Again, increasing the number of beneficiaries for the Ilima-Letsema programme and improving the type of support provided, has the potential to create employment opportunities for unskilled labor in the agricultural sector. There were positive (net farm income after receiving support) and negative (education level and farmland size) factors that significantly influenced the number of employment opportunities created by the respondents after receiving support from Ilima-Letsema programme. Regarding net farm income, it is logical because farmers making more profit can afford to pay salaries for more labor required for agricultural activities. However, the findings were not similar to Gideon and Georgina (2015) who discovered that net income has a negative and significant influence on employment creation. Also in contrast, scale of operation was a positive and significant predictor of job creation (Yazdanfar and Salman, 2012; Gideon and Georgina, 2015); whereas in the current study, farm size had a negative effect on job creation. Therefore, there is no guarantee that farmers operating on large-scale can create more employment opportunities. The negative and significant influence of education on job creation in the agricultural sector is similar to the findings by other scholars (Tarekegn et al., 2022). It shows that attainment of higher educational qualifications is not an assurance of employment creation amongst agricultural entrepreneurs.
Ilima-Letsema's contribution to poverty alleviation
The study revealed that the Ilima-Letsema programme significantly uplifted farmers from the UBPL amount of R1,183 (89.30 US$). However, the impact was insignificant on the FPL and LBPL amounts of R547 (41.21 US$) and R785 (59.26 US$), respectively. The findings implied that the number of respondents who earned income above UBPL increased significantly whereas the ones for FPL and LBPL did not increase significantly post-support. UBPL include an amount of R785 (59.26 US$) required to purchase essential food and non-food items plus R398 (56.07 US$) for non-food items that are not important. It implied that the proportions of farmers who could afford to purchase essential foodstuff with the minimum daily energy, essential non-food items and non-essential non-food items increased in the post-support era. However, the number of farmers who could only afford to purchase essential foodstuff and non-food items did not increase significantly during the same period. Therefore, the livelihoods of farmers who were better off before receiving support from Ilima-Letsema programme continued to improve significantly; while resource-poor farmers were still trapped in poverty despite the support provided by the programme. The findings by Funsani et al. (2016) were similar because farmer support programmes in Zambia did not uplift the beneficiaries from the poverty line. Thus, poverty prevailed amongst the beneficiaries of government support programmes. The factors that positively and significantly influenced the contribution of the programme to FPL, LBPL and UBPL were education level, annual net farm income and farmland size. It is not surprising because large-scale and educated farmers are more likely to earn more income that will uplift them from poverty. The findings by Anyanwu (2005) and Botha (2010) are similar because a lower education (literacy) level was associated with a high prevalence of poverty; thus, highly educated individuals were less prone to experience poverty. The reason could be that the education level is a significant predictor of net farm income (Ibekwe et al., 2010; Mabe et al., 2010; Onuk et al., 2017). Thus, educated farmers are more likely to earn more income from farming, and ultimately be uplifted from the poverty (depravation) trap. In the current context, highly educated farmers who received support from the Ilima-Letsema programme generated sufficient net farm income that uplifted them above food poverty, lower bound poverty and upper bound poverty status. The findings echoed with Makhalima (2020) who discovered that households with higher net income were less likely to have income above the FPL, LBPL and UBPL amounts. Logically, farmers who earned more income in the post-support were uplifted from poverty because money is the significant predictor of the poverty level. Moreover, the current study used poverty line amounts to define poverty. Thus, farmers who made more profit from farming could afford to purchase foodstuff with the minimum daily energy and important non-food items required to improve their food poverty status (PFS), lower bound poverty status (LBFS) and upper bound poverty status (UBPS). The results of the positive and significant association that exist between farm size and poverty line amount (FPL, LBPL and UBPL) concur with other scholars. According to Adetayo (2014), large-scale farmers significantly experienced less poverty in comparison to small-scale farmers; thus, poverty was less prevalent when farmers occupied bigger land for agricultural production purposes. The postulation is that large-scale farmers could achieve higher agricultural outputs and earn more income that will uplift them from the poverty trap. Thus, increasing the size of farmland could be used as a mechanism to reduce the prevalence of poverty amongst the beneficiaries of farmer support programmes.
Conclusion and recommendations
The objectives of the study were to determine the contribution of Ilima-Letsema programme to job creation, net income, poverty alleviation and their determinants (influencing factors). Through face-to-face interviews conducted using structured questionnaire, primary data was collected from the beneficiaries of Ilima-Letsema programme and analyzed using various statistical analysis methods (inferential and descriptive). The statistical outputs from T-test showed that the Ilima-Letsema programme contributed positively and significantly to farmers' annual net farm income and job creation. The respondents who were highly educated, farming on large-scale and created more jobs after receiving support from Ilima-Letsema programme made significant profit (net income) from their agricultural activities during the post-support era. Again, farmers with high net farm income created significant number of employment opportunities (jobs) after receiving support from the programme. However, highly educated farmers and those occupying bigger farmland created less jobs in the post-support era. It is recommended that Ilima-Letsema's rollout and budget should be expanded to enable more farmers to generate income and create employment opportunities for unskilled laborers in the agricultural sector. Furthermore, small-scale farmers should be encouraged to increase their scale of operation to increase their chances of making more profit from their agricultural activities. On the other hand, it was found that the Ilima-Letsema programme did not alleviate or uplift beneficiaries from the trap of LBPL and FPL because most beneficiaries of the programme could not afford essential foodstuffs and non-food items before and after the support. Therefore, the programme did not reduce poverty prevalence amongst resource-poor farmers in the study area, even though the livelihoods of the beneficiaries who earned income above the UBPL amount improved significantly after receiving support from the programme. This is an indication that the programme's beneficiaries who could afford essential foodstuff and non-food items; and non-essential non-foodstuff continued to do so after receiving support from Ilima-Letsema. It can be concluded that the programme improved the livelihoods of elite farmers; thus, increasing inequality amongst the farmers. Lastly, education level, farmland size and net farm income were positively and significantly correlated with the programme's ability to uplift the beneficiaries from FPL, LBPL and UPBL. As part of the strategy to revamp Ilima-Letsema programme and enable it to reduce poverty amongst the beneficiaries, it is recommended that the access criteria for the programme should be changed in favor of less educated and smallholder farmers, and producers with low net income. Therefore, the policy targets should increase the proportions of smallholder farmers, less educated and resource-poor farmers who benefit from the programme annually.
Data availability statement
The original contributions presented in the study are included in the article/Supplementary material, further inquiries can be directed to the corresponding author.
Ethics statement
The researchers applied for permission to conduct the study from GDARD and it was granted. Furthermore, the study received ethical clearance from the College of Agriculture and Environmental Sciences (CAES) Ethics Review Committee at the University of South Africa (Unisa). The research ethics clearance number allocated to the study by CAES Ethics Review Committee is 2017/CAES/150. Data collection commenced after the researchers acquired ethical clearance from both organizations. The patients/participants provided their written informed consent to participate in this study.
Author contributions
Conceptualisation and formal analysis: TN and MMaa. Methodology, software, writing - review and editing, and co-supervised the research: MMaa. Validation: TN, MMaa, and MMas. Investigation, writing—original draft preparation, visualization, project administration, data curation, led the research, and authored the manuscript: TN. Resources: TN and MMas. Supervision, funding acquisition, and supervised the research: MMas. Co-authored the article: MMas and MMaa. All authors contributed to the article and approved the submitted version.
Funding
This work was supported by Women in Research Programme of the University of South Africa (UNISA).
Conflict of interest
The authors declare that the research was conducted in the absence of any commercial or financial relationships that could be construed as a potential conflict of interest.
Publisher's note
All claims expressed in this article are solely those of the authors and do not necessarily represent those of their affiliated organizations, or those of the publisher, the editors and the reviewers. Any product that may be evaluated in this article, or claim that may be made by its manufacturer, is not guaranteed or endorsed by the publisher.
Supplementary material
The Supplementary Material for this article can be found online at: https://www.frontiersin.org/articles/10.3389/fsufs.2022.975127/full#supplementary-material
References
Adetayo, A. O. (2014). Analysis of farm households poverty status in Ogun states, Nigeria. Asian Econ. Financ. Rev. 4, 325–340. Available online at: https://archive.aessweb.com/index.php/5002/article/view/1161 (accessed June 01, 2022).
Alemu, Z. G. (2015). Developing a Food (in) Security Map for South Africa. Working Paper Series No. 220. Tunisia: African Development Bank, 1–25.
Altman, M., Hart, T., and Jacobs, P. (2009). Household food security status in South Africa. Agrekon 48, 345–365. doi: 10.1080/03031853.2009.9523831
Anyanwu, J. C. (2005). Rural poverty in Nigeria: profile, determinants and exit paths. Afr. Dev. Rev. 17, 435–460. doi: 10.1111/j.1017-6772.2006.00123.x
Anyanwu, J. C. (2013). Determining the Correlates of Poverty for Inclusive Growth in Africa. Working Paper Series. Tunisia: African Development Bank, p. 1–30.
Barbieri, C., and Mshenga, P. M. (2008). The role of the firm and owner characteristics on the performance of agritourism farms. Sociol. Rural 48, 166–183. doi: 10.1111/j.1467-9523.2008.00450.x
Bizimana, C., Nieuwoudt, W. L., and Ferrer, S. R. (2004). Farm size, land fragmentation and economic efficiency in southern Rwanda. Agrekon 43, 244–262. doi: 10.1080/03031853.2004.9523648
Botha, F. (2010). The impact of educational attainment on household poverty in South Africa. Acta Acad. 42, 122–147.
Cook, C., Heath, F., and Thompson, R. L. (2000). A meta-analysis of response rates in web-or internet-based surveys. Educ. Psychol. Meas. 60, 821–836. doi: 10.1177/00131640021970934
Cousins, B., Genis, A., and Clarke, J. (2018). The Potential of Agriculture and Land Reform to Generate Jobs. Policy brief 51, October 2018. Cape Town: Institute for Poverty, Land and Agrarian Studies, University of the Western Cape, South Africa. Available online at: https://media.africaportal.org/documents/Policy_Brief_51_Ben_Cousins_Amelia_Genis_and_Jeanette_Clarke.pdf (accessed February 01, 2019).
Dayton, C. M. (2017). A reinterpretation and extension of McNemar's test. J. Mod. Appl. Stat. Methods. 16, 20–33. doi: 10.22237/jmasm/1493596860
De Cock, N., D'Haese, M., Vink, N., van Rooyen, C., Staelens, L., Schönfeldt, H., and D'Haese, L. (2013). Food security in rural areas of Limpopo province, South Africa. J. Food Secur. 5, 269–282. doi: 10.1007/s12571-013-0247-y
Department Agriculture Forestry Fisheries (DAFF). (2012). A Framework for the Development of Smallholder Farmers Through Cooperative Development. Available online at: https://www.nda.agric.za/doaDev/sideMenu/cooperativeandenterprisedevelopment/docs/FRAMEWORK-%20OF%20SMALL%20FARMERS%20(2).pdf (accessed August 08, 2022).
Department Agriculture Forestry Fisheries (DAFF). (2017). CASP and Ilima-Letsema Presentation to Select Committee on Appropriations 17 October 2017. Available online at: http://pmg-assets.s3-website-eu-west-1.amazonaws.com/171017daff.pdf (accessed September 20, 2018).
Department of Performance Monitoring and Evaluation (DPME) (2015). Policy Summary, Executive Summary and Outline: Impact Evaluation of the Comprehensive Agricultural Support Programme From Its Inception in 2004 to February 2013. Pretoria, South Africa: DPME.
Department Performance Monitoring Evaluation (DPME) (2013). National Evaluation Plan 2014/15 to 2016/17, 4 December 2013. Available online at: http://www.dpme.gov.za/keyfocusareas/evaluationsSite/Evaluations/NEP%202014-15%20Web.pdf (accessed October 10, 2016).
Dommeyer, C. J., Baum, P., Hanna, R. W., and Chapman, K. S. (2004). Gathering faculty teaching evaluations by in-class and online surveys: their effects on response rates and evaluations. Assess. Eval. High. Educ., 29, 611–623. doi: 10.1080/02602930410001689171
Edwards, S. J. L. (2005). Research participation and the right to withdraw. Bioethics. 19, 112–130. doi: 10.1111/j.1467-8519.2005.00429.x
Emerole, C. O., Nwosu, A. C., Onyenweaku, C. E., and Ukoha, O. O. (2006). Employment types, work experiences and determinants of small holder farm household income in Ikwuano, Abia State, Nigeria. Niger. Agric. J. 37, 24–34. doi: 10.4314/naj.v37i1.3225
Food Agricultural Organisation (FAO) (2012). Smallholders and Family Farmers. Available online at: https://www.fao.org/fileadmin/templates/nr/sustainability_pathways/docs/Factsheet _SMALLHOLDERS.pdf (accessed August 08, 2022).
Food Agricultural Organisation (FAO) (2019). FAO Framework on Rural Extreme Poverty: Towards Reaching Target 1.1 of the Sustainable Development Goals. Rome: Food Agricultural Organisation of the United Nations,1–60.
Funsani, W., Rickaille, M., Zhu, J., Tian, X., Chibomba, V., Avea, A. D., and Balezentis, T. (2016). Farmer input support programme and household income: lessons from Zambia's southern province. Transform. Bus. Econ. 15, 396–412.
Gideon, E., and Georgina, E. (2015). Analysis of employment creation and income generation potentials of small and medium scale enterprise in Abia State, Nigeria. Singapore J. Bus. Econ. Manag. Stud. 3, 9–17. doi: 10.12816/0010937
Greenberg, S., Swanepoel, S., and Lewis, L. (2018). Input Supply in South Africa's Smallholder Farmer Support Programmes: A Tale of Neo-apartheid Plans, Dodgy Dealings and Corporate Capture. Johannesburg, South Africa: African Centre for Biodiversity, 1–55.
Hole, G. (2009). Research Skills: Using SPSS to Perform t-tests. Available online at: http://www.math-stat.net/t-tests%20in%20SPSS.pdf (accessed December 13, 2018).
Ibekwe, U. C., Eze, C. C., Onyemauwa, C. S., Henri-Ukoha, A., Korie, O. C., and Nwaiwu, I. U. (2010). Determinants of farm and off-farm income among farm households In South East Nigeria. Academ. Arena. 2, 58–61. doi: 10.7537/marsaaj021010.08
Integrated Development Plan (IDP) (2018). Midvaal IDP 2018/19 Review. Final Report. Available online at: http://www.midvaal.gov.za/images/Annual%20Reports/Final%20IDP%2020182019%20approved%20by%20council%20on%20the%2031%20May%202018.pdf (accessed December 01, 2018).
Kan, A., Kan, M., Dogan, H. G., Tosun, F., Ucum, I., and Solmaz, C. (2018). Evaluation of young farmers project support program in terms of agri-entrepreneurship in Turkey. Pak. J. Agric. Sci. 55, 1021–1031. doi: 10.21162/PAKJAS/18.7321
Kanyua, M. J., Waluse, G. K. I. S.K., and Wairimu, W. R. (2015). Factors influencing profitability of diversified cash crop farming among smallholder tea farmers in Gatanga District, Kenya. J. Econ. Sustain. Dev. 6, 87–95.
Khamis, H. (2008). Measures of association: how to choose?. J. Diagn. Med. Sonogr. 24, 155–162. doi: 10.1177/8756479308317006
Kostov, P., and Lingard, J. (2004). Subsistence agriculture in transition economies: its role and determinants. J. Agric. Econ. 55, 565–579. doi: 10.1111/j.1477-9552.2004.tb00115.x
Ledwaba, M. S. (2013). Evaluation of the revitalization of smallholder irrigation schemes: A case study of Krokodilheuwel Irrigation Project in Sekhukhune District, Limpopo Province (Masters mini-dissertation). University of Limpopo, Polokwane, South Africa.
Mabe, L. K., Antwi, M. A., and Oladele, O. I. (2010). Factors influencing farm income in livestock producing communities of North-West Province, South Africa. Livest. Res. Rural. Dev. 22, 142.
Maggio, S., and Sawilowsky, S. (2013). A new maximum test via the dependent Samples t-Test and the Wilcoxon Signed-Ranks Test. J. Appl. Math. 5, 110–114. doi: 10.4236/am.2014.51013
Makhalima, J. L. (2020). An analysis of the determinants of child poverty in South Africa. Int. J. Finance Econ. 12, 406–421. doi: 10.34109/ijefs.202012210406
Masilela, T. (2013). A review of the National Development Plan: Introducing politics and the state in South Africa, in State of the Nation: South Africa: 2012–2013, eds U. Pillay, G. Hagg, and F. Nyamnjoh (Cape Town, South Africa: HSRC Press), 35–50.
Masuku, M., Selepe, M., and Ngcobo, N. (2017). Status of household food security in rural areas at uThungulu District, Kwa-Zulu Natal, South Africa. J. Hosp. Tour and Leis. 6, 1–11. Available online at: http://www.ajhtl.com/uploads/7/1/6/3/7163688/article_38_vol_6__2_2017.pdf (accessed December 27, 2018).
Meiring, T., Kannemeyer, C., and Potgieter, E. (2018). The Gap Between Rich and Poor: South African Society's Biggest Divide Depends on Where You Think You Fit In. Working paper No. 220, Southern Africa Labour and Development Research Unit (University of Cape Town: Cape Town, South Africa), 1–31.
Ngcobo, N. N. (2018). Implementation Evaluation of the Smallholder Farmer Support Programme and Its Likelihood of Increasing Farm Productivity: A Case of “Abalimi Phambili Project”, Jozini, KwaZulu-Natal. MPhil dissertation, University of Cape Town, South Africa.
Ngema, Z. N., Sibanda, M., and Musemwa, L. (2018). Household food security status and its determinants in Maphumulo Local Municipality, South Africa. Sustainability. 10, 1–23. doi: 10.3390/su10093307
Ntlou, T. (2016). Potential for Economic Sustainability of Land Reform Projects Benefiting From the Recapitalisation and Development Programme in South Africa. MInst Agrar dissertation, University of Pretoria, South Africa.
Nulty, D. D. (2008). The adequacy of response rates to online and paper surveys: what can be done? Assess. Eval. High. Educ. 33, 301–314. doi: 10.1080/02602930701293231
Nwachukwu, I. N., and Ezeh, C. I. (2007). Impact of selected rural development programmes on poverty alleviation in Ikwuano LGA, Abia State, Nigeria. African J. Food. Agric. Nutr. Dev. 7, 2245. doi: 10.18697/ajfand.16.2245
Oladele, I. O., and Ward, L. (2017). Effect of micro-agricultural financial institutions of South Africa financial services on livelihood capital of beneficiaries in North West Province South Africa. J. Agric. Food Secur. 6, 2553. doi: 10.1186/s40066-017-0122-8
Onuk, E. G., Umar, H. S., and Girei, A. A. (2017). Influence of socio-economic characteristics on net farm income of broiler production in the southern agricultural zone of Nasarawa State, Nigeria. J. Agric. Crop Res. 5,42–48.
Oxfam. (2014). Hidden Hunger in South Africa: The Faces of Hunger and Malnutrition in a Food-Secure Nation. Available online at: https://www.oxfam.org/en/research/hidden-hunger-south-africa (accessed October 07, 2016).
Phatudi-Mphahlele, M. (2016). Analysis of Socio-economic Impact of Comprehensive Agricultural Support Programme on Agrarian Reform Farmers of Sedibeng District Municipality in Gauteng Province, South Africa. MSc dissertation, University of South Africa, South Africa.
Rakoena, V. M, Maake, M. M. S., and Antwi, M. A. (2022). The impact of the RADP on agricultural productivity in SA. J Agribus. Rural Dev. 2, 169–176. doi: 10.17306/J.JARD.2022.01556
Sheskin, D. J. (2011). Handbook of Parametric and Nonparametric Statistical Procedures: Fifth Edition. Boca Raton: Chapman and Hall.
Sikwela, M. M., and Mushunje, A. (2013). The impact of farmer support programmes on household income and sustainability in smallholder production: a case study of the Eastern Cape and KwaZulu Natal farmers, South Africa. Afr. J. Agric. Res. 8, 2502–2511.
South African Revenue Service (SARS). (2022). Average Exchange Rates. Available online at: https://www.sars.gov.za/legal-counsel/legal-counsel-publications/average-exchange-rates/ (accessed August 7, 2022).
Statistics South Africa (2019). Towards Measuring Food Security in South Africa: An Examination of Hunger and Good Inadequacy. Available online at: www.statssa.gov.za (accessed April 26, 2020).
Statistics South Africa (Stats SA) (2011). General Household Survey 2011. Available online at: http://www.statssa.gov.za/publications/P0318/P03182011.pdf (accessed on July 22, 2015).
Statistics South Africa (Stats SA) (2015a). General Household Survey 2015. Available online at: http://www.statssa.gov.za/publications/P0318/P03182015.pdf (accessed September 07, 2015).
Statistics South Africa (Stats SA) (2015b). Millennium Development Goals. Country report 2015 of South Africa. Available online at: http://www.statssa.gov.za/MDG/MDG_Country_Report_Final_Feb2016.pdf (accessed October 10, 2018).
Statistics South Africa (Stats SA) (2018). National Poverty Lines. Available online at: http://www.statssa.gov.za/publications/P03101/P031012018.pdf (accessed September 02, 2018).
Statistics South Africa (Stats SA) (2019). National Poverty Lines 2019. Statistical Release P0310.1. Available online at: http://www.statssa.gov.za/publications/P03101/P031012019.pdf (accessed April 20, 2020).
Tarekegn, K., Kamaylo, K., Galtsa, D., and Oyka, E. (2022). Youth participation in agricultural enterprises as rural job creation work and its determinants in Southern Ethiopia. Adv. Agric. 2022, 5760331. doi: 10.1155/2022/5760331
Tlalang, B. E. (2016). The Impact of Homestead Food Garden Programme on Food Security in Gauteng Province of South Africa. MSc dissertation, University of the Free State, South Africa.
Tshuma, M. (2013). An Investigation of Skills, Knowledge and Farmer Support Programmes of Land Reform Beneficiaries: A Case Study of Forest Hill Farmers in Kenton-On-Sea in the Ndlambe Local Municipality. PhD thesis, University of Fort Hare, South Africa.
World Bank Group (2018). Overcoming Poverty and Inequality in South Africa: An Assessment of Drivers, Constraints and Opportunities. World Bank, Washington, DC. Available online at: https://openknowledge.worldbank.org/bitstream/handle/10986/29614/124521-REV-OUO-South-Africa-Poverty-and-Inequality-Assessment-Report-2018-FINAL-WEB.pdf?sequence=1andisAllowed=y (accessed January 12, 2019).
Xaba, T., and Dlamini, C.S. (2015). The comprehensive agricultural support programme training and capacity building: An impact analysis on income levels of emerging farmers in Limpopo Province, South Africa. Am. J. Econ. Financ. Manag. 1, 153–163.
Keywords: farmer support, income, employment, poverty alleviation, Gauteng, South Africa
Citation: Nkgudi TM, Maake MMS and Masekoameng MR (2022) The Ilima-Letsema programme's contribution to poverty alleviation in Gauteng Province, South Africa. Front. Sustain. Food Syst. 6:975127. doi: 10.3389/fsufs.2022.975127
Received: 21 June 2022; Accepted: 29 August 2022;
Published: 14 October 2022.
Edited by:
Li Xu, University of Saskatchewan, CanadaReviewed by:
Lelethu Mdoda, University of KwaZulu-Natal, South AfricaViswanathan Pozhamkandath Karthiayani, Amrita Vishwa Vidyapeetham, India
Keshav Lall Maharjan, Hiroshima University, Japan
Copyright © 2022 Nkgudi, Maake and Masekoameng. This is an open-access article distributed under the terms of the Creative Commons Attribution License (CC BY). The use, distribution or reproduction in other forums is permitted, provided the original author(s) and the copyright owner(s) are credited and that the original publication in this journal is cited, in accordance with accepted academic practice. No use, distribution or reproduction is permitted which does not comply with these terms.
*Correspondence: Tshidi Mokgadi Nkgudi, bmtndWRpdEB5YWhvby5jb20=
†ORCID: Tshidi Mokgadi Nkgudi orcid.org/0000-0002-5819-3883
Matome Moshobane Simeon Maake orcid.org/0000-0001-5007-2588
Mosima Rachel Masekoameng orcid.org/0000-0002-4308-3497