
95% of researchers rate our articles as excellent or good
Learn more about the work of our research integrity team to safeguard the quality of each article we publish.
Find out more
ORIGINAL RESEARCH article
Front. Sustain. Food Syst. , 02 August 2022
Sec. Crop Biology and Sustainability
Volume 6 - 2022 | https://doi.org/10.3389/fsufs.2022.937200
This article is part of the Research Topic Novel Approaches on Conservation and Utilization of Plant Genetic Resources: Ensuring Food Availability and Diversity for Generations to Come View all 6 articles
 Martha C. Willcox1,2*
 Juan A. Burgueño1*
 Daniel Jeffers1,3
 Enrique Rodriguez-Chanona1
 Armando Guadarrama-Espinoza1,4
 Zakaria Kehel1,5Daniel Chepetla1Rosemary Shrestha1
 Kelly Swarts6,7Edward S. Buckler6,8
 Sarah Hearne1
 Charles Chen1,9*
The tar spot complex (TSC) is a devastating disease of maize (Zea mays L.), occurring in 17 countries throughout Central, South, and North America and the Caribbean, and can cause grain yield losses of up to 80%. As yield losses from the disease continue to intensify in Central America, Phyllachora maydis, one of the causal pathogens of TSC, was first detected in the United States in 2015, and in 2020 in Ontario, Canada. Both the distribution and yield losses due to TSC are increasing, and there is a critical need to identify the genetic resources for TSC resistance. The Seeds of Discovery Initiative at CIMMYT has sought to combine next-generation sequencing technologies and phenotypic characterization to identify valuable alleles held in the CIMMYT Germplasm Bank for use in germplasm improvement programs. Individual landrace accessions of the “Breeders' Core Collection” were crossed to CIMMYT hybrids to form 918 unique accessions topcrosses (F1 families) which were evaluated during 2011 and 2012 for TSC disease reaction. A total of 16 associated SNP variants were identified for TSC foliar leaf damage resistance and increased grain yield. These variants were confirmed by evaluating the TSC reaction of previously untested selections of the larger F1 testcross population (4,471 accessions) based on the presence of identified favorable SNPs. We demonstrated the usefulness of mining for donor alleles in Germplasm Bank accessions for newly emerging diseases using genomic variation in landraces.
Monoculture in modern agriculture, as well as the adoption of elite varieties, has resulted in a loss of genetic diversity, diminishing specific genetic resistance sources accumulated from hundreds of years of cultivation of landraces in disease-prone regions (Dawson et al., 2015). Methodologies to identify an expanded portfolio of genetic resources with known resistances will be essential in rapid responses to emerging infectious agricultural diseases exacerbated by climate uncertainty. To this end, various international conferences have begun addressing the topic of genetic erosion and promoting allele mining from exotic germplasm for climate resilience. The Seeds of Discovery Initiative at CIMMYT, as an example, has sought to combine the use of next-generation genotyping technologies and phenotypic characterization to identify valuable alleles held in the CIMMYT Germplasm Bank.
Identifying important traits in materials stored in Germplasm Banks and the belief that valuable material exists within these collections motivated this study. Using a genome-wide association panel, referred to as F1 Association Mapping (FOAM) by Romero Navarro et al., 2017, we present an allele-mining approach for TSC resistance from a diverse set of landrace accessions. Such diverse germplasm poses logistical challenges, and the methods described in this article demonstrate a novel approach to identifying resistance alleles in very low frequencies.
According to Müller and Samuels (1984), tar spot complex (TSC) symptoms are due to initial Phyllachora maydis infection, followed by M. maydis and Coniothyrium phyllachorae. TSC development is favored by cool climate conditions with temperatures of 17–22 °C and relative humidity > 75%, with > 7 h of leaf wetness at night (Hock et al., 1995). Initial infection by P. maydis leads to the “tar spot” lesion, where subsequent infections by M. maydis and C. phyllachorae lead to the formation of a necrotic lesion known as the “fisheye” symptom, extending out from the initial tar spot lesion with the necrosis associated with the presence of M. maydis. Under conditions favorable to the pathogens, the necrotic areas can coalesce leading to complete necrosis of leaves during the reproductive stages of plant development, reducing the photosynthetic area and thereby lowering the grain yield through inadequate grain fill, and ear rot symptoms (Müller and Samuels, 1984). TSC can be controlled through the use of fungicides (Bajet et al., 1994; Pereyda–Hernández et al., 2009); however, for small farmers, the additional cost of chemical control is prohibitive in regions where the economic returns are low and access to inputs is challenging. Developing genetic resistance is thus the most desirable, cost-effective, and environmentally friendly measure for controlling these pathogens.
The presence of the single pathogen P. maydis, known as tar spot, was first described in 1904 in Mexico (Maublanc, 1904), followed by reports in other countries throughout the region (Abbot, 1931; Bell and Alandia, 1957; Schieber, 1968; Castaño, 1969; Liu, 1973), but significant yield losses were not noted until the 1970s, when a second fungus, Monographella maydis E. Müller, was found associated with P. maydis in necrotic areas on infected leaves, and the name Tar Spot Complex (TSC) was designated for this more virulent disease complex (Müller and Samuels, 1984). Significant yield loss up to 30% has been documented in Mexico, with disease being detected from the highlands of Central Mexico to the winter plantings in the coastal lowlands (Hock, 1989). ProMED and deGuate.com reported 80% yield losses in Guatemala caused by TSC in 2007 in seed production fields of a susceptible hybrid (Monterroso-Salvatierra, 2014), the same year TSC was first described in Honduras. In 2011, the Ministry of Agriculture and Livestock of Honduras called for urgent cooperation to confront the spread of TSC because the disease decimated white maize and was affecting the fields of 30% of the nation's small farmers (source:http://latinamericacurrentevents.com/honduras-tar-spot-maize-spread/3255/). In April 2013, TSC was first reported in the Zapotitan area of El Salvador (source: La Prensa Grafica: http://www.laprensagrafica.com/mancha-de-asfalto–enfermedad-del-maiz). A newly emerging infectious disease impacting international agriculture had arrived.
As the importance of TSC of maize continued to intensify in Mexico and Central America, in September 2015, P. maydis was detected in the important corn-producing states of Indiana and Illinois (Ruhl et al., 2016). P. maydis was also confirmed in maize fields in South Florida in June of 2016 (Hansen et al., 2016). As of 2021, P. maydis was already established in the midwestern corn belt (Rocco da Silva et al., 2021) and found to overwinter in the Midwest (Kleczewski et al., 2019) where reduced tillage practices are conducive for providing primary inoculum in the plant debris for subsequent proximal plantings (Kleczewski and Bowman, 2020). US yield loss estimates for 2018 due to tar spot are 4.6 million metric tons (Mueller et al., 2019). A modeling based on climate similarity with known tar spot disease locations predicts that a large area of the North American maize-production area is conducive for tar spot development which has the potential for much larger yield losses as tar spot gets established (Mottaleb et al., 2019). M. maydis and C. phyllachorea, which in association with P. maydis, lead to significant economic damage in Latin America, but have not been detected in temperate North America so far (McCoy et al., 2019).
Host resistance has been found in temperate exotic germplasm developed by the US Genetic Enhancement of Maize (GEM) program (Lipps et al., 2022), while in tropical areas of Latin America, good sources of resistance have been identified (Ceballos and Deutsch, 1992; Mahuku et al., 2016; Cao et al., 2017) and utilized in commercial germplasm (Mahuku et al., 2013). Resistance has been found to the primary pathogen, P. maydis, with less leaf area colonized and less subsequent leaf area with potential leaf firing. A single dominant gene was found to be responsible for conferring resistance (Ceballos and Deutsch, 1992). In later studies using both genome-wide association panels and linkage panels, a major QTL on chromosome 8, qRtsc8-1, in bin 8.03 was identified (Mahuku et al., 2016) and minor QTLs were detected on chromosomes 1, 2, 3, 6, 7, and 10 (Mahuku et al., 2016; Cao et al., 2017). Transferring resistance conferred by qRtsc8-1 to susceptible tropical and temperate hybrids would be the first step for a disease control, while adding additional minor alleles for resistance could add increased stability. A broader evaluation of tropical maize genetic resources from CIMMYT's Germplasm Bank would be valuable to identify new unique alleles for resistance not detected in other studies.
The CIMMYT Maize Germplasm Bank's “Breeders' Core Collection” consists of 4,471 landrace accessions from Highland, Subtropical, and Tropical regions from 35 countries in the Americas. The accessions in this collection were selected based on the acceptable agronomic performance in CIMMYT Germplasm Bank trials within racial groups and balanced as a proportional percentage of accessions within each racial group (Taba, 2005). The Seeds of Discovery Initiative used this Core Collection to form accession-topcross families for GWAS in an approach-termed F-one association mapping or FOAM (Romero Navarro et al., 2017); and a subset of 912 accession topcrosses were evaluated in field trials for reaction to TSC. The majority of the TSC GWAS panel originated from collections in Mexico (272 accessions, 32.3%) and Brazil (164 accessions, 19.5%), with 57 accessions from Venezuela (6.8%) and 54 from Guatemala (6.4%). The composition of TSC landrace panel is shown in Figure 1.
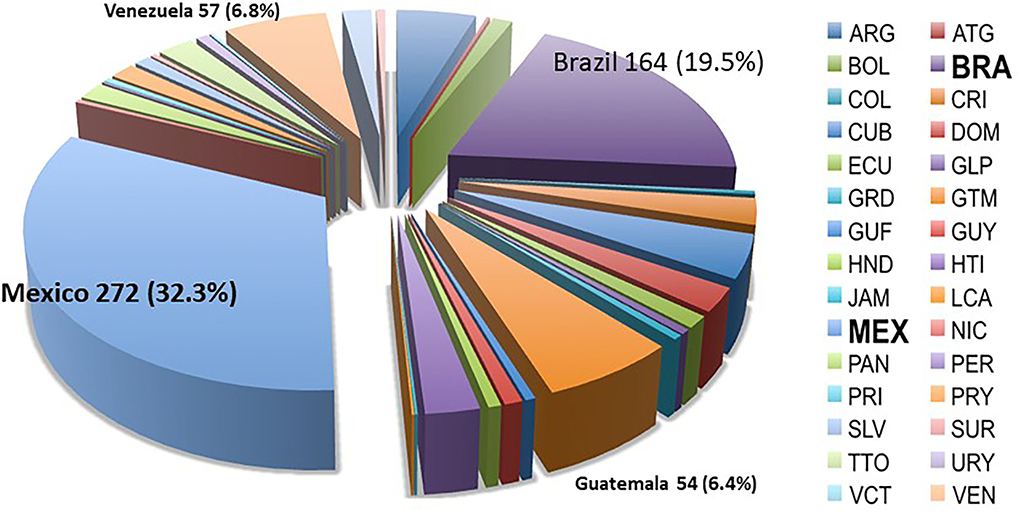
Figure 1. Accessions in the TSC GWAS (genome-wide association study) panel by country of origin. The panel consists of maize landrace accessions collected from 30 different countries with the majority coming from Mexico (32.3%) and Brazil (19.5%).
The genotypic values for the TSC landrace panel were derived from a single plant of each landrace accession of the core collection. The same single plant sampled for DNA extraction was used as the male parent to produce topcross seed using a CIMMYT single cross hybrid as the female parent. The accession topcrosses produced in this manner were evaluated in multiple field trials to produce phenotypic values (foliar rating for disease data). Genotyping was conducted using two genome complexity reduction methods—GBS, genotyping by sequencing (Elshire et al., 2011); the original, un-imputed SNP data (Hearne et al., 2014a) and DArTseqTM (Cruz et al., 2013).
The TSC panel was evaluated in Guadalupe Victoria, Chiapas, in 2011 and 2012 (GPS 16° 26′48.35″ N, 93° 7′30.75″ W; 793 m above sea level). Guadalupe Victoria is characterized as a humid tropical climate and is within the area most affected by the TSC epidemic. The 2011 experiment had a total of 600 experimental plots with 535 accession topcrosses and 65 check plots (10.8%). In the 2012 trial, a total of 810 plots with 688 unique accession topcrosses and 90 checks plots (11%) were planted. In 2012, four accessions were also evaluated per se; these were the accessions with the best performance as topcrosses in 2011 (lowest TSC foliar rating and highest yield). The four accessions per se were replicated 4 times and the corresponding topcrosses of these 4 accessions were also replicated 5 times within the otherwise un-replicated trial.
Considering both experiments, 918 unique accession topcrosses were evaluated in total; among those, 305 accession topcrosses were evaluated in both years. Within the 2011 trial, 512 accessions used in the accession topcrosses were of tropical origin, whereas 23 were subtropical; in 2012, 681 of the accessions were tropical and 7 were of subtropical origin. Within the 305 repeated accession topcrosses, 298 were tropical and 7 were subtropical. The TSC landrace GWAS panel used the following hybrids as female parents to produce the accession topcrosses: CML269/CML264, CML495/CML494, CML373/CML311, and CML451/CML486. The details of the CIMMYT gene bank accession ID of male parents and hybrids used as female parent in topcross, geo-adaptation origin, and year of trials can be found in Supplementary Table 1S.
The experiments were un-replicated designs with repeated checks in a semi-randomized arrangement. First, check plots were allocated systematically in the field, including the same number of check plots in every row and range. After allocating the checks, test crosses and per se accessions were randomized in the free plots. Two commercial hybrids (spatial checks) that are widely adapted within tropical and subtropical environments of Mexico were used to adjust for spatial variation in both 2011 and 2012. We used two check plots in every row and 2 to 4 check plots per column (range). The two check plots within a row had both spatial checks, while in the columns, spatial checks were allocated alternatively per column. In 2012, two additional checks with differing responses to TSC were included in the trial, both are adapted to the TSC endemic region, but one is considered more resistant and the other more susceptible among commercial hybrids. We used 5 check plots per row and 2 check plots per range in 2012. Considering the two rows and five columns, we had a rectangle of 2 by 5 in which we allocated the four checks as an incomplete extended Latin Square design. With this process, we reached a balance in the allocation of checks to rows and ranges. Some minor changes to the original designs were made in order to fit the total number of plots with the number of accession topcrosses and checks plots, such as including checks to fill the last range or substituting accessions with low number of seeds. These changes did not change the experimental design.
Planting dates for the 2011 and 2012 trials were 14 June 2011 for the first year's experiment and the second on 8 June 2012. Guadalupe Victoria, Chiapas, is in the epicenter of the region being most affected by the TSC. Both trials were machine planted in plots that were 2-m long with 1-m alleys between plots and 80 cm between rows. Twenty seeds were sown per 2 m and then thinned to approximately 12 plants per plot. The amount of fertilizer applied at planting was 41-N, 46-P, 60-K per hectare, with an additional 138 units of nitrogen applied as urea on 20 July 2011 (the first trial) and 15 July 2012 (the second trial). Herbicide and insecticides were applied at planting and during the growth cycle in accordance with standard agronomic practices for hybrid production in the region.
The foliar rating for each entry's reaction to TSC was recorded after the symptoms of the disease began to develop-the point at which lesions began to coalesce on lower leaves. The first rating was taken on 23 September 2011 using a standard CIMMYT foliar rating scale of 1 to 5, where 1 indicates immunity and 5 is a dead plant, on a plot basis. The second rating was done 2 weeks after the first rating, using the same foliar rating scale of 1 to 5, also on a plot basis.
In 2012, the first rating was done on 19 August 2012 and the second rating on 4 September 2012. In the 2012 trial, individual plants were rated in 6 central plants in each row to provide a more continuous value for foliar rating as well as a quantification of variance within each entry. The rating scale used in 2012 was based on that of Ceballos and Deutsch (1992), which is a 0–5 scale with 0 being immune and 5 being a dead plant. The Ceballos Deutsch scale differentiates the amount of TSC damage on leaves below the ear and above the ear, making it a more useful scale for the diversity of height and ear positions in this population. Both the broader scale and the use of an average of six plants per row aimed to accentuate the quantitative differences between entries. The same CIMMYT foliar rating of 1–5 scale on a whole plot basis was also done for the second rating (4 September 2012).
Agronomic data were taken during the course of both trials. These data were plant number (number of plants after thinning), male and female flowering dates (number of days from planting to 50% flowering), stalk and root lodging (number of plants affected per row), and plant and ear height (in centimeters from the base of the plant). Mature ears were harvested by hand after the physiologic maturity. The data were taken as to number of ears harvested, number of diseased ears, weight of harvested ears, weight of shelled grain, weight of cob, and percentage grain moisture. From these data, other data are derived: Anthesis-silking interval (difference in days between male flowering and female flowering), proportion of plants lodged (number of plants lodged/total number of plants per plot), shelling percentage (percentage of shelled grain per weight of harvested ears), and grain weight per hectare adjusted for 12.5% moisture (Table 1).
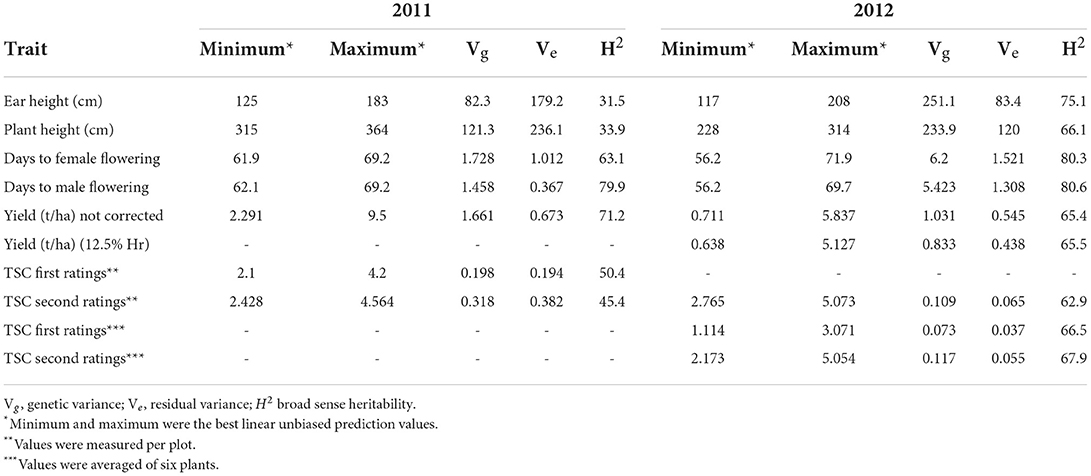
Table 1. Summary of the phenotypic data and heritability of TSC (tar spot complex) landrace accession panel.
The raw genome-wide single nucleotide polymorphism (SNP) profile for the TSC landrace panel was generated using the genotyping-by-sequencing (GBS) technology (Elshire et al., 2011). The raw SNP profile for the panel was called and imputed with a global collection of maize germplasms using the Beagle v4 algorithm (Browning and Browning, 2013) (see comparison in Swarts et al., 2014); the total number of SNPs in this global release, namely, GBSv.27, is 954,179. Due to the sample size difference between trials in 2011 and 2012, total numbers of SNPs included for the genome-wide association (GWAS) analysis varied in experiments (Beagle 4 imputed GBSv2.7 see: Hearne et al., 2014b).
In addition, due to the diverse genetics of maize landraces, we estimated the relatedness among accessions of the TSC GWAS panel using the filtered, non-B73 referenced, SNP set from DArTseqTM. The SNP filtering was based on SNP minor allele frequency (MAF > 0.25) and missing data ratio (<20%). The remaining missing values of DArT SNPs were imputed and replaced with the mean of the locus. Finally, a genomic similarity matrix standardized with allele frequency as VanRaden (2007) was estimated; this genomic similarity matrix was used to correct for relationship between accessions when fitting the GWAS mixed model (as the K matrix).
All genotypic information used in this study can be accessed via the CIMMYT Research Data and Software Repository Network (https://data.cimmyt.org/) and the CIMMYT Maize Germinate 3 Database (https://germinate.cimmyt.org/maize/).
Phenotypic data were analyzed with a linear mixed model in order to obtain the best linear unbiased predictors (BLUPs) for each of the single plants per accession genotyped. The model for the trial response was a complete nested model with a dummy “check” effect as the highest level of nesting factor.
To control soil/environment heterogeneity, we included row and column effects as random effects. A spatial adjustment was done by modeling the residual error term with an autoregressive order one model, in both directions row and column. The model was
where Ymn is the response variable in the plot located in the row m and the column n, μ is the overall mean, Ti is i-th dummy check effect, with i=1 (checks) to 2 (testcrosses) (in 2012, there was another level for accessions per se), P(T) ij is the j-th hybrid effect nested in the i-th check effect (fixed), A(PT) ijk is the k-th testcross effect (fixed) nested in the j-th hybrid effect (random), nested in the i-th check effect, Rm is the m-th row effect (random), Cn is the n-th column effect (random), and εmn is the experimental error in the m-th row and the n-th column. We assume that the vector of errors ε is multivariate normally distributed with mean at zero and matrix of variance covariance Σ = σ(ARr⊗ARC). R and C follow a normal distribution with mean at zero and variance and , respectively.
Broad sense heritability was estimated by dividing the accession variance by the sum of the residual variance and the accession variance. All analyses were done in ASReml (Gilmour et al., 2009). The phenotypic data analysis used a linear-mixed model to calculate variance components for genotype and residual together with the heritability; other calculated components are the tester and the spatial parameters. All phenotypic information used in this study can be accessed via the CIMMYT Maize Germinate 3 Database (https://germinate.cimmyt.org/maize/).
We examined the genetic structure using a Bayesian population assignment method of the clustering software STRUCTURE (Pritchard et al., 2000). The Bayesian method considers data and parameters as random variables having specific distributions, called a-priori distribution. The Markov Chain Monte Carlo (MCMC) simulation was used to infer these parameters and to estimate the posterior probability that the data fit the hypothesis of K populations. In this study, we tested the values of K ranging from 2 to 8 with 3 independent runs per test, using both no admixture and admixture models with correlated allele frequencies, a 100,000 iteration burn-in followed by 106 additional iterations, from which every 100th observation was recorded.
To associate TSC disease symptoms with genome-wide SNP polymorphism, we used linear-mixed models to account for relatedness among samples and to control for population stratification and other confounding factors (Yu et al., 2006; Kang et al., 2010).
We conducted genome-wide association using an exact model, GEMMA (Genome-wide Efficient Mix-Model Association), to reduce a systematic underestimation of marker effect (Zhou and Stephens, 2012). As other mixed models, GEMMA also includes a relatedness matrix, as well as fixed covariates, to further account for additional population genetic structure. Significance in association was accessed based on the Benjamini-Hochberg false discovery rate at 5% (Benjamini and Hochberg, 1995).
The global build GBSv2.7 for maize was generated by a global collection of 42,000 maize accessions (Hearne et al., 2014a). After filtering for SNPs that have <50% of missing data, 537,082 polymorphic SNP loci for 2011's TSC panel and 540,952 SNP loci for the 2012 panel were retained for association analyses. Genotypic values of these SNP profiles were extracted from the GBSv2.7 Beagle 4 imputed dataset (Hearne et al., 2014b). Since there is the possibility that resistant alleles in landraces might be in low frequency, all SNPs were used for model fitting regardless its allele frequency. In addition, we replaced the remaining missing data (<0.03%) after the Beagle 4 imputation with the mean of the locus due to the requirement of GEMMA algorithm for a full SNP matrix without missing genotypic values.
Based on the significant associations from the 2012 data, a trial was constructed to confirm the identified associations in the summer season of 2014. We selected within the larger GWAS panel of the Breeders Core Collection for genotypes that had not been phenotyped for TSC reaction with the five most highly significant SNP variants associated with decreased TSC second foliar ratings. The genotypic data from the single plant used as the male parent of the topcrosses were used to identify the accessions with any of the 5 putative favorable alleles and their corresponding accession topcross were evaluated in the confirmation trial. There were no individuals within the larger GWAS panel that contained more than one of the five positive SNP variants, so all of the regions were tested individually, except for one accession already identified in the 2012 accession-topcross trial. The accession topcrosses corresponding to the selection described above made up the confirmation trial. In addition, a null set of negative controls was selected within the larger GWAS panel of accession topcrosses, which had none of the five SNP variants that were associated with reduced TSC foliar leaf damage scores. The selection of this null set for this confirmation trial involved the following sequence of steps. Step 1: the group of accessions identified within the TSC panel as having lower tar spot foliar damage scores and the presence of the favorable alleles identified through this association mapping study were designated as Group 1. Step 2: Accessions within the full GWAS panel, which did not have the putative favorable alleles were placed into a second group (Group 2). Step 3: Using genetic distances, those accessions in Group 2 that were genetically closest to the accessions of Group 1 were selected and became Group 3. Step 4: Accessions in Group 3 with phenotypes closest to the phenotypes in Group 1 were selected based on Euclidian distance of characteristics considering days to flowering and plant and ear heights (Group 4). Step 5: the accession topcrosses made from the accessions identified as Group 4 became the null set for the confirmation trial. The GBS genetic profile was most similar to the most resistant families without having any of the 5 identified positive SNP variants; within this group there was a further selection for those materials with similar flowering time, plant height, and ear height, in order to test materials that were the most similar both genotypically and phenotypically to the most resistant accessions but not containing the 5 most significant positive allelic variants. Table 2 displays the allelic states of the accession-topcross families evaluated in this confirmation trial. These materials were hand planted in the same field site in Guadalupe Victoria, Chiapas, as the previously described trials on 17 June 2014 in a Randomized Complete Block design with 2 replications. The plots were 2-m long with 20-cm spacing and thinned to 11 plants per plot. Fertilization and management were in accordance with the standard hybrid management for this tropical region. Foliar leaf ratings were taken using the same 0–5 rating scale previously described for the 2012 trial using individual plant ratings of the 6 central plants. The first foliar rating was taken on 18 September and the second on 29 September 2014. The agronomic data was recorded for male and female flowering time, plant and ear height, number of leaves, and stalk and root lodging and the yield data were taken at harvest with number of plants harvested. The data were analyzed using a linear mixed model for a complete block design, including the effect of block and the random effect of accessions top crosses. Tar Spot Foliar Ratings data taken on 6 individual plants per plot included in the model a sampling error to measure the variability between plants. This variability can be related with the segregation of the accession topcrosses. Contrast comparisons were performed for Tar Spot Foliar Ratings for each putative favorable allele to compare the score of the group with the favorable allele against the group without the favorable allele. The same contrast comparisons were carried out for grain yield adjusted to 12.5% humidity. BLUPs were obtained for each of the accession topcrosses and plotted against the state of the five highly significant regions, as to whether the putative favorable allele was present or absent. Standard deviations were calculated for Tar Spot Foliar Ratings for each putative favorable allele.
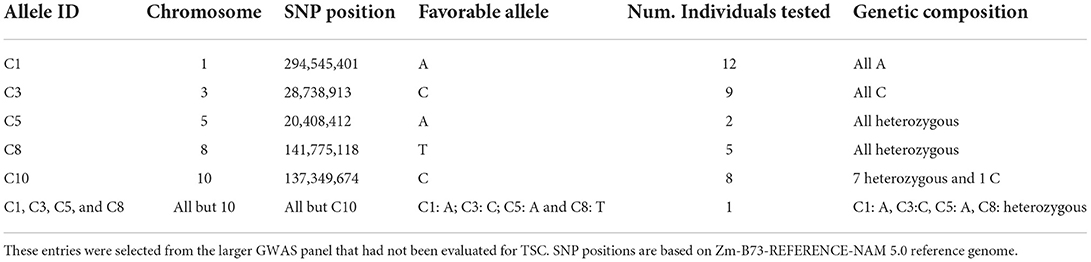
Table 2. Allelic composition of 2014 confirmation trial at five highly significant SNP locations identified in 2012 trial.
The ranges and variation of the phenotypic evaluations for TSC foliar disease ratings of the 918 F1 families (accession topcrosses) evaluated in 2011 and 2012 trials under natural infection in Chiapas and the associated agronomic traits are listed in Table 1. The complete results of the mixed model analysis is shown in Supplementary Table 3S. Due to the use of an un-replicated experimental design with repeated checks, only the broad-sense heritability was estimated (denoted as H2 in Table 1). In general, the heritability estimates in the 2012 trial were higher than 2011; the most heritable trait across the panels was days to male flowering (H2=79.9% in 2011 and 80.6% in 2012 across trials 58.6%).
For each trial, two foliar leaf disease ratings were taken approximately 2 weeks apart. The first, at the initiation of coalescence of necrotic lesions, generally identifies the most susceptible materials, and the same ratings 2 weeks later differentiate materials where the disease has been limited in progression. Different foliar disease rating methods were used: in 2011, TSC foliar disease rating was done with the 1-5 scale visual estimation of the average damage of the plot (1= no damage and 5= dead plants), whereas a 0-5 scale was used on an individual plant basis for 2012 (0 = 0–2% necrotic lesions; 5 = 80% or greater necrotic lesions) and an average of 6 central plants were taken to represent the disease ratings for each plot of accession topcrosses. The visual estimation of foliar disease of the plot as a whole has been used in line and hybrid breeding where the materials are homozygous; however, the F1 families (accession topcrosses) were segregated for all traits due to the heterozygosity of the landraces involved. Therefore, the rating of 6 plants on an individual basis and taking a mean was implemented to achieve a more precise estimation of the family mean. The same 1–5 scale rating used in the 2011 trial was also taken in the second rating of the 2012 trial, allowing a direct comparison of disease pressure between years. As shown in Table 1, the TSC disease development was about 10% higher in 2012; greater disease pressure was also reflected in the lower grain yield of 2012. TSC foliar disease ratings using the average of 6 central plants with a slightly expanded scale (0–5) resulted in a broader range of foliar scores in the same year; similar estimates of heritability, 67.9 vs. 62.9%, were found using the two scales, but the genetic variance of the accession topcrosses was 7% greater and the residual variance was 15% lower using the 0–5 scale with the mean of 6 individual plant ratings, indicating an overall increase in efficiency over a plot rating (1–5 scale). We performed a GWAS association for all TSC 5 foliar ratings from 2011 and 2012 but focused on the phenotypes which were the average of six individual plants using the Ceballos and Deutsch (1992) 0–5 rating scale employed in two ratings in 2012.
Figure 2 shows the inverse relationship between increasing foliar leaf damage scores (more TSC) and decreasing yield. H2 in the 2012 data underlying Figure 2 were 65.5% for yield and 67.9% for second TSC foliar rating using the Ceballos and Deutsch scale, averaging 6 individual plant scores per plot. Most of the accession topcrosses (shown as black dots) had foliar lesion scores between 4 and 5, indicating extensive leaf necrosis, with correspondingly low yields due to lack of photosynthetic area to fill grain (Figure 2). However, there is variation for both the foliar disease rating and the yield within the accession topcrosses as demonstrated by a small number of accession topcrosses with low foliar leaf damage and high yield; in particular, two accession-topcross families (CML269/CML264//Oaxa280 and CML495/CML494//Guat153) had foliar leaf damage score below 3 on the 0-5 leaf damage scale and yields above 1,000 g per 2-m plot. Comercial hybrid checks, of tropical and subtropical adaptacion, used as spatial checks are shown as blue dots in Figure 2, their relative susceptibility indicates high TSC disease pressure in this trial and the resistance level of comercial hybrids at the time. The best 4 accession topcrosses from the 2011 trials (highest yielding and least foliar leaf dammage) were also included in 2012. The two best performing accession topcrosses from the 2011 trial were CML269/CML264//Oaxa280 and CML495/CML494//Guat153, which were also the best performers in 2012.
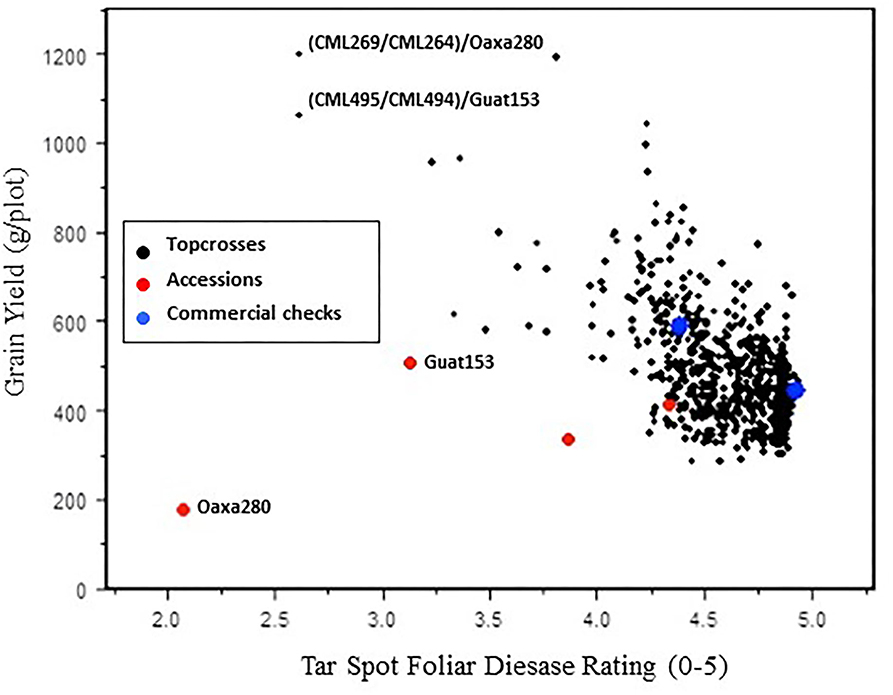
Figure 2. Relationship between the TSC (tar spot complex) foliar disease rating and the grain yield for accession topcrosses, accessions per se, and commercial checks evaluated in 2012. TSC ratings were plotted using second foliar ratings (Ceballos and Deutsch, 1992 scale 0–5) as an average of 6 plant scores per entry. Grain yield is adjusted to 12.5% humidity.
The Maize Germplasm Bank accessions from which the male parent of these best 2011 accession topcross were sampled were also included in the 2012 trial as per se entries (bulk landrace seed from CIMMYT Maize Germplasm Bank) to examine whether the resistance found in the single plant used as the male parent was representative of the resistance found in the accession. The TSC foliar disease score of the accessions per se, shown as red dots in Figure 2, had similar foliar disease resistance for TSC to their related topcrosses, indicating that the resistance is dominant; however, the yield levels of the accessions per se were much lower than the related topcrosses. The yields of Oaxa 280 and Guat 153 per se were 15 and 48% of their topcross yield, probably due to the late flowering for acessions per se (9.2 and 7.6 days later to female flowering for Oaxa 280 and Guat 153 than mean days to male flowering of the accession topcrosses), which would artificially depress the yield levels of the accessions per se because of insufficient pollen for grain fill. The commercial checks, shown as blue dots in Figure 2, clustered in the susceptible range of 4 and 5 for TSC foliar disease rating, indicating the limited range of genetic resistance in maize hybrids comercially available at the time the study was conducted.
The correlation analysis of the traits within year and between years showed a similar pattern: grain yield negatively correlated with TSC foliar disease rating and positively correlated with ear and plant height (0.82 and 0.83 for 2011 and 2012, respectively) (Table 3). The second TSC foliar rating, taken 2 weeks after the initial rating, had a greater negative correlation with yield (−0.40 and −0.58 for 2011 and 2012, respectively) than the first TSC foliar rating, taken at the initiation of the spread of lesions on lower leaves (−0.36 for 2011) using CIMMYT's standard visual averaging on 1–5 scale. Using the average of six individual plant scores on a 0–5 scale also demonstrated a greater negative correlation with yield in the second foliar rating (−0.61 in 2012) than the first TSC foliar rating (−0.46 in 2012). Between years, all traits showed a consistent, positive correlation with themselves. Flowering time was negatively correlated with TSC foliar disease rating (−0.07 and −0.07 female and male flower for 2011 with TSC ma2 2011; −0.05 and −0.07 female and male flowering with TSCts2 for 2012), indicating later flowering plants were slightly more resistant to TSC. Taken as a whole, these data indicate correlations between later flowering, taller plants and higher ear placement with lower foliar TSC ratings (−0.05 flowering, −0.23 plant height, −0.18 ear height with TSC ts2 second foliar rating using average of 6 individual plants on a 0–5 scale in 2012).
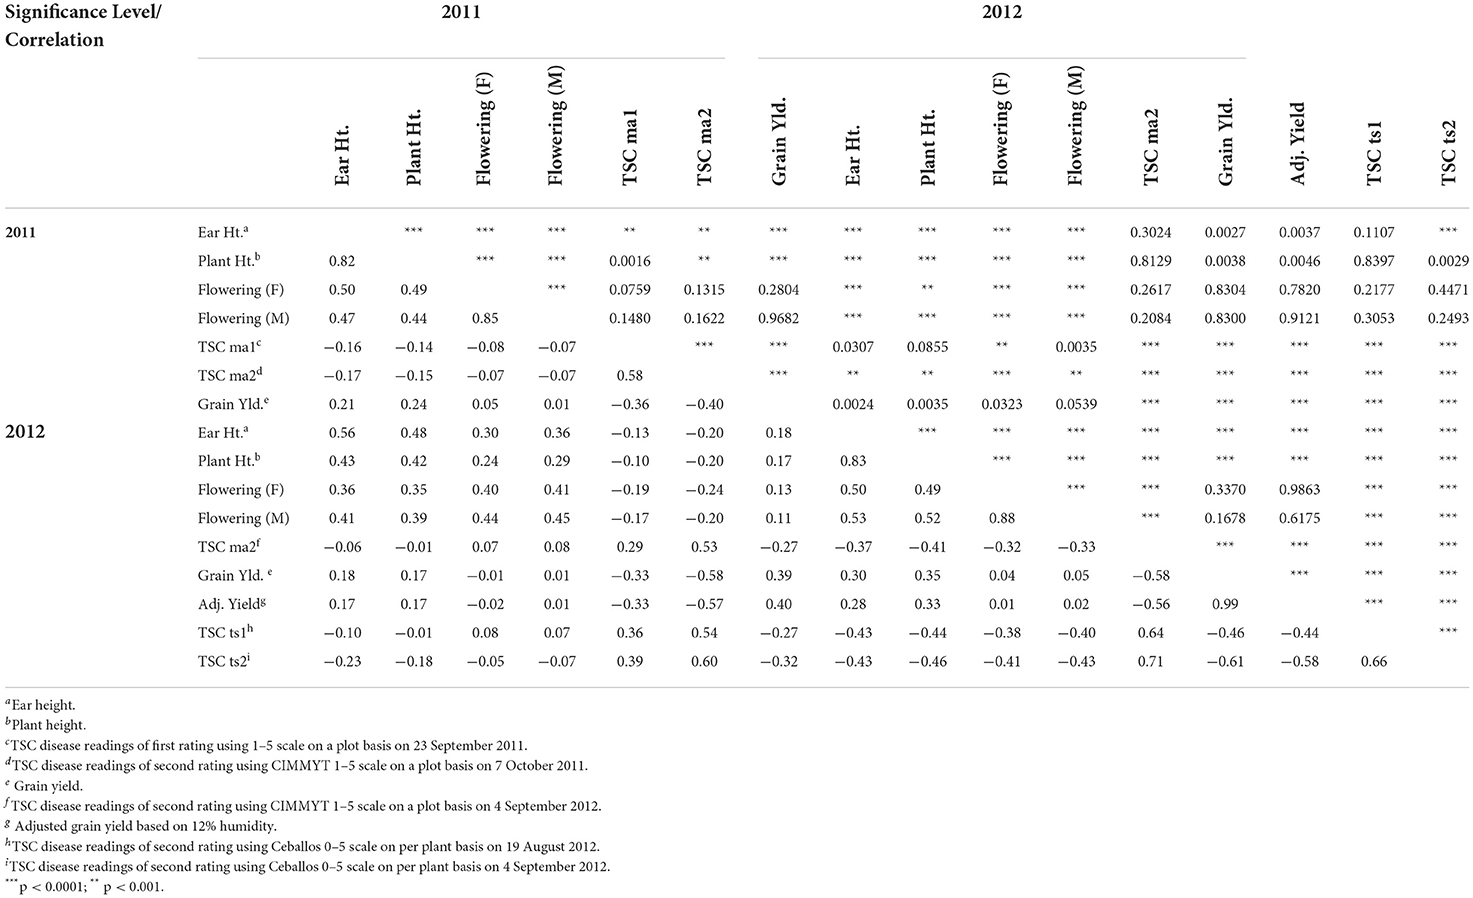
Table 3. Pearson correlation coefficients and the level of significance of TSC (tar spot complex)-related traits.
Since plant height, ear height, and days to flowering are traits that are characteristic of differences among maize landraces (Sanchez et al., 2000), and these are also characteristics that could affect TSC-disease reaction of the plant, means for the second TSC foliar ratings were determined by race using the primary racial designation of CIMMYT Germplasm Bank for each accession used as the male parent in the accession topcrosses. In Figure 3, the means and ranges of TSC ratings of the primary racial designation of the accessions evaluated in this trial are demonstrated by a colored ball and a vertical bar, respectively, and only the maize races which had 4 or more accessions represented in our 2011 and 2012 trials were displayed. A green ball at the mean point indicates a race native to Mexico, while red indicates a race from another country. The few races of maize showing significantly lower mean TSC foliar rating are Conico (3.60), Tehua (3.63), and Oloton (4.27); these races also had the greatest range of TSC foliar ratings. Conversely, the races with the narrowest range of TSC foliar ratings such as Guaribero (min 4.62, max 4.91) and Rio Grande Dentado (min 4.54, max 4.85) were among the highest mean TSC ratings, indicating their susceptibility.
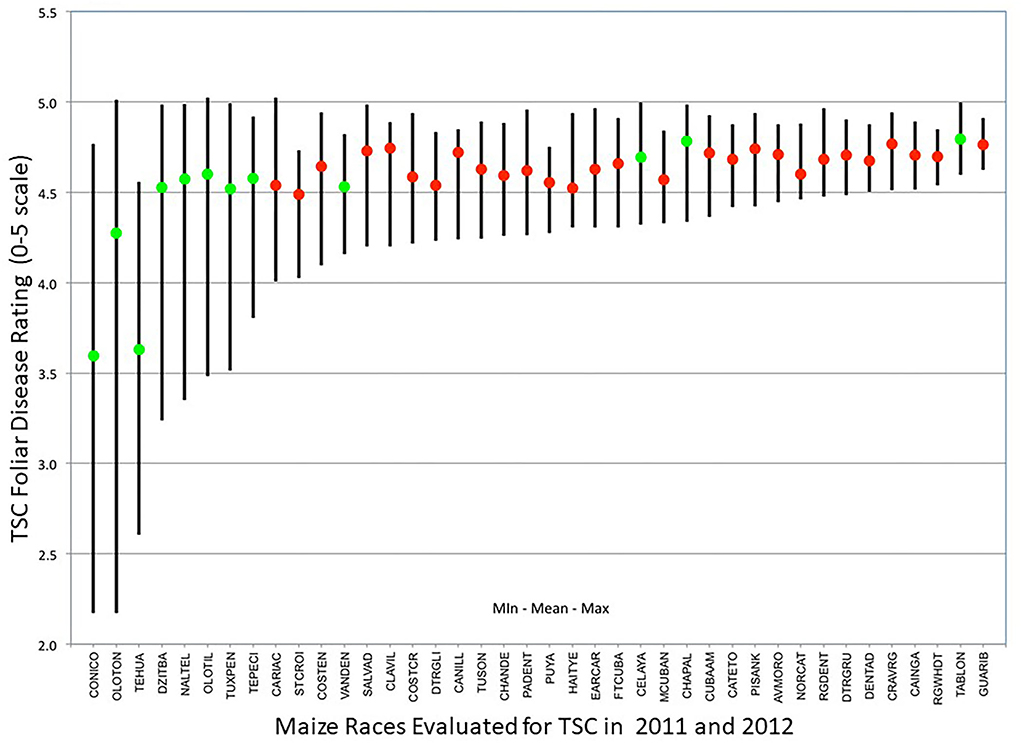
Figure 3. Differences within maize races (Maize Germplasm Bank designation of accessions) in response to TSC (tar spot complex) shown as means (dots) and ranges (line length) of foliar disease ratings for races where 4 or more accessions topcrosses were evaluated in 2011 and 2012. Native Mexican races are designated by green dots and races from outside Mexico with red dots. Oloton and Tehua (green dots) are accessions collected from regions where TSC has been prevalent and show selectable variation.
The most resistant accessions in these trials originate from areas where TSC has been present for as long as the disease has been recorded. Conico is a race with wide distribution throughout higher elevations of Mexico, while Oloton and Tehua are races with a limited distribution (CONABIO, 2020), mainly found in higher elevations of Chiapas, Oaxaca, and Guatemala, regions affected by TSC over a long enough period that there are indigenous names for the disease. These two races evolved in areas with some of the highest seasonal rainfall in Mexico (Ruiz-Corral et al., 2008), and therefore high relative humidity and extended leaf wetness periods to support the infection and disease development. In our trials, Oloton and Tehua showed a significantly lower mean for TSC rating and displayed a broader range for TSC response. The observed differences in range of disease reaction in affected areas are likely due to survival of a subset of plants that produced ears in years when TSC pressure was severe, and seeds of which were planted out the following year which may not have had disease pressure. This intermittent selection would maintain such a broad range of disease reactions. The races with the lowest range of TSC reaction originated from areas distant from TSC pressure, indicating their uniform susceptibility to TSC; these are mostly from South America, the Caribbean, or are Mexican races such as Tabloncillo and Chapalote from the northern parts of Mexico, where the climate is dry, making it not conducive for TSC.
After filtering the raw, unimputed GBS SNP to have <5% missing data, 7,601 SNPs were used for the PCA and structure analysis. Bayesian Information Criterion (BIC), a model selection criterion, identified four, possibly five genetic clusters as the best model fit for the number of the principal components (Supplementary Figure S1) (Peiffer et al., 2014). The first principal component separated Brazilian accessions from the rest of the TSC panel [Figure 4A generated using R-ArcGIS (R Core Development Team, 2015)], and with four principal components, Figure 4B demonstrates that, first, lowland vs. highland accessions can be separated by a major principal component; second, Caribbean accessions are genetically distinguishable from Mexican accessions; and third, northern South American maize could be a genetic mixture of lowland Mexican and Caribbean maize. These findings support that the spread of Mesoamerican lowland landraces was through Central America to South America (yellow dots of Figure 4B) (Vigouroux et al., 2008). Finally, accessions from Brazil and the Caribbean are in different clusters from the rest of Latin America, and the few red dots in southern Brazil and Paraguay might be the Cuban germplasm brought in by agricultural extension programs prior to World War II (Vigouroux et al., 2008).
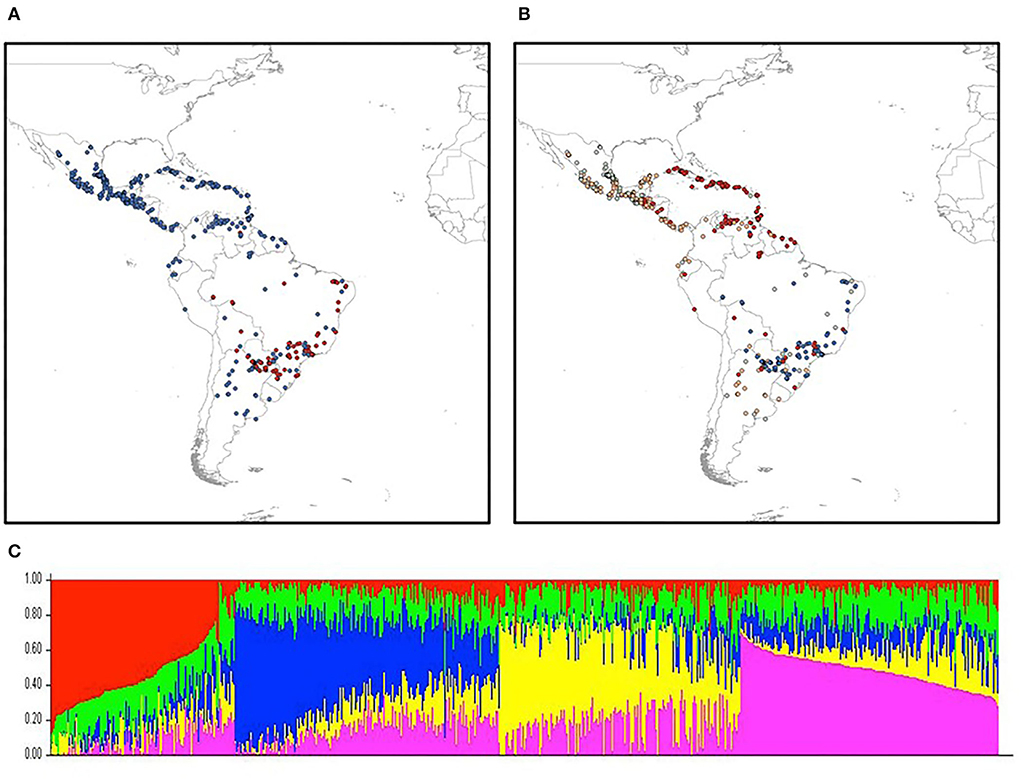
Figure 4. Spatial principal component and STRUCTURE analyses of maize landrace accessions of TSC GWAS panel. (A) Distinct genetic composition of Brazilian accessions (red dots) in TSC panel by the first principal component (PC). (B) Genetic clustering of lowland, highland Mexican, and Caribbean accessions by four PCs. (C) Distinct genetic structure between highland (red), lowland (blue), mid-attitude (yellow) Mexican accessions, and Caribbean ones (pink) of TSC GWAS panel.
Using the STRUCTURE analysis, 4 sub-groups were revealed based on within-group allele frequencies (Figure 4C), with potentially the 5th genomic sub-group distributed evenly across (the green component in Figure 4C). To control population stratification in the genome wide association (GWAS) analysis, the loadings of the first 5 PCs were included as the fixed variables in linear mixed models (see model comparison in Supplementary Figure 1S).
To gain genome-wide knowledge of TSC resistance, we performed mixed-linear model genome-wide association using the data from the 2012 Chiapas field evaluation, where the phenotypic information foliar TSC ratings taken 2 weeks apart were taken by averaging the individual ratings of 6 central plants using the Ceballos and Deutsch (1992) scale. The TSC field evaluations used in GWAS were the first foliar rating in August (TSCts1 in 2012), second rating in September (TSCts 2 in 2012), and the adjusted grain weight (GW) in 2012. Days to 50% male and female flowering were also recorded for each plot. All mixed models were tested with inclusion of male and female flowering times as covariates.
Using a false discovery rate (FDR) <5%, only one SNP was found significantly associated with the first TSC foliar rating phenotype (TSCts 1 in 2012) on chromosome 9. After converting the B73 RefGen_v3 to the Zm-B73-REFERENCE-NAM-5.0 position, this associated variant is located in a putative protein coding gene GRMZM2G103247. Nine landrace accessions in our 2012 panel were found carrying this T/G SNP variant (MAF= 1.1%) associated with TSC resistance (lower TSC foliar ratings).
With the same FDR threshold, in total, 41 associations were identified using TSCts 2, the second foliar rating with the inclusion of 5 PCs and female flowering time as covariates (Supplementary Table 2S); the largest effect of TSCts 2 resistance of these associations was found with the S3_28617473 SNP variant, contributing to ~25% of leaf area saved (Figure 5). We also examined the CIMMYT's CML panel of 538 maize elites using the same GBSv2.7 SNPs (Wu et al., 2016) and found this large effect C/G substitution on chromosome 3 was not seen in the CIMMYT's CML panel (Table 4). Associations with larger effect tend to have MAF lower than 2%, with the exception of association variant S8_138133667 on chromosome 8 (MAF = 4.7%, Supplementary Table 2S).
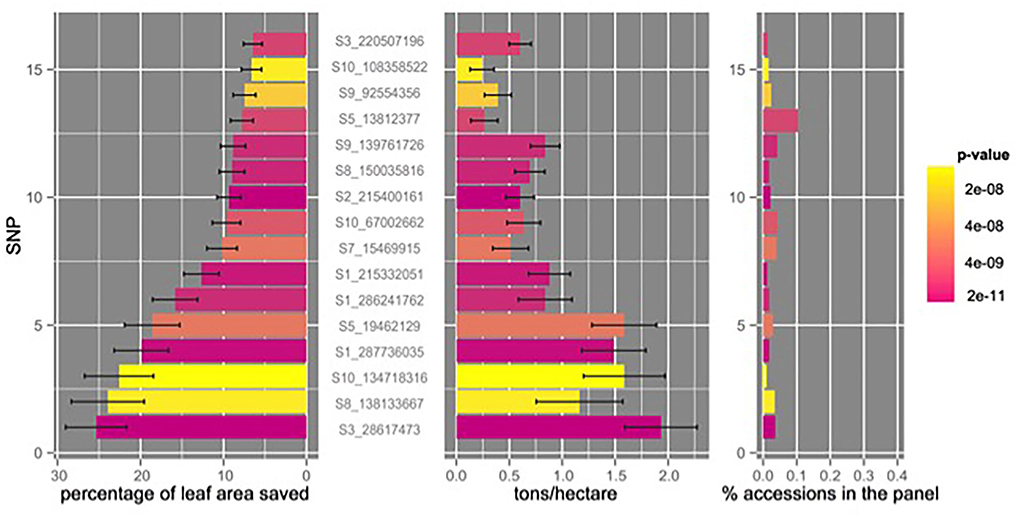
Figure 5. Allele frequencies, association significance, allelic effect sizes for resistance, and adjusted grain yield for TSC (tar spot complex resistant SNP variants (mean ± std err). TSC resistance was translated into percentage of leaf area saved; the grain yield was shown in tons/hectare.
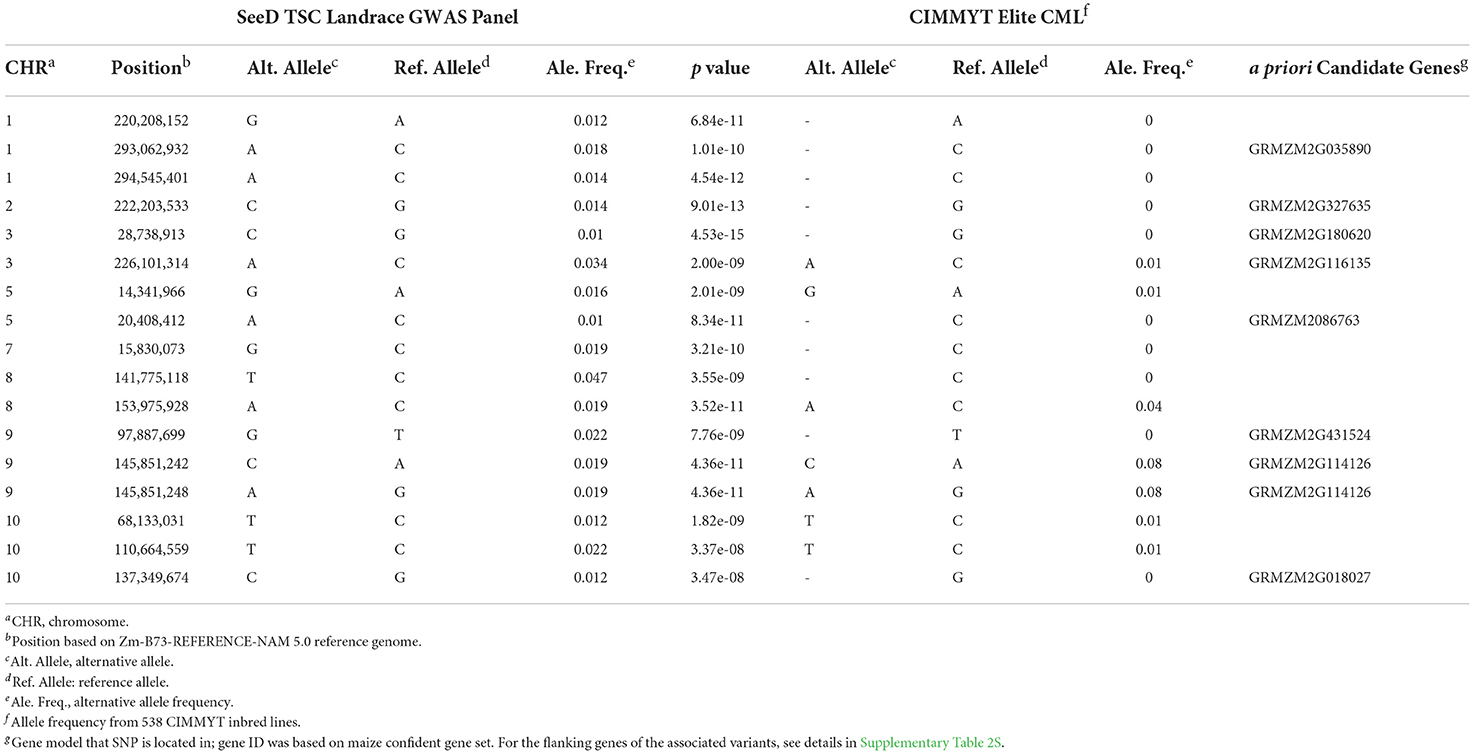
Table 4. Genome position, allele frequency, and the a priori candidate genes for GWAS SNP variants responsible for both TSC and grain yield in landraces.
Of these 41 associated variants, 15 are located within 13 maize genes (Zm-B73-REFERENCE-NAM 5). For example, the A/C transition of SNP S3_19462129 and C/G transition of SNP on chromosome 10 are located within maize genes GRMZM2G116135 of chromosome 5 (Table 4; Supplementary Table 2S) and GRMZM2G018027 of chromosome 10 (Supplementary Table 2S), respectively. The GRMZM2G116135 of chromosome 3 is an ortholog of Arabidopsis gene AT3G16780, a plant ribosomal protein RPL19 that is considered to play a role in pathogen responses (Ascencio-Ibáñez et al., 2008; Nagaraj et al., 2016). The GRMZM2G018027 gene on chromosome 10 is homologous to Arabidopsis OXS3 (Horn et al., 2014), which is a chromatin-associated factor and also involves in stress tolerance (Blanvillain et al., 2009).
When considering the maize genes that locate within close proximity to the significantly associated SNP variants, several genetic responses to pathogens were uncovered. For example, ~8,000 base pairs downstream to the associated variant S1_215332051 on chromosome 1 found the Zm00001eb041860 gene, a homolog to Arabidopsis gene AT5G1600 that encodes MYB transcription factor (Supplementary Table 2S). Additionally, maize gene Zm00001eb260980 located on chromosome 6 about 2,000 base pairs downstream to the associated variant S6_5163406 is a BIR1 gene homolog, which is related to the regulation of plant innate immunity in Arabidopsis (Liu et al., 2016; Ma et al., 2017).
We also conducted an association mapping using grain weight corrected to 12.5% moisture as the yield component for the TSC panel. Seventeen SNP variants responsible for both grain weight and TSCts 2 were identified (FDR <0.05; Table 4), confirming the correlated impact of TSC to grain yield (Figure 5). For example, SNP variant S3_28617473 located in maize gene GRMZM2G180620 on chromosome 3 contributes almost 2 tons/hectare increased grain yield also showed the largest effect on TSC resistance (Figure 5). Maize gene GRMZM2G180620 is annotated with stress response (GO:0006950) and response to a molecule of fungal origin (GO:0002238); it has four different splice variants and SNP S3_28617473 is found in the protein-coding region of three of them. The top five associations of TSC showed significant effect on both the yield and the lower second TSC foliar ratings, which were further validated with our confirmation trial in 2014.
Although all significant association variants have low MAF, the identification of these rare variants responsible for disease resistance and increased yield suggests the usefulness of the genomic diversity in landraces and the potential for mining beneficial alleles that are unseen in elite varieties. Table 4 summarizes the association results of these pleiotropic variants and the comparison of allele frequency with 538 CIMMYT's CMLs (Wu et al., 2016).
Using the above findings, an experiment was designed to confirm the effect of the SNP variants associated with lowered TSC foliar ratings. Accession topcrosses, not previously screened for TSC, having any of the identified alleles were included in this trial, along with accessions that had similar phenotypic characteristics but did not have the putative alleles. In Figure 6, the second TSC foliar disease ratings were plotted together with grain yield for each putative allele tested in the confirmation experiment conducted in 2014. Means and SDs were calculated based on the state of the five highly significant regions, as to whether the putative favorable allele was present or absent, as indicated in Table 4. The negative check (null set) consisted of accession topcrosses where the accessions did not have the favorable SNP at any of the 5 positions but had similar genomic profile to the accessions identified as resistant. The means of the TSC foliar ratings are represented as blue dots for each of the 5 putative favorable SNP alleles, with the SDs represented as a line of the same color. The mean grain yields for the same entries with the 5 putative favorable SNP alleles are represented as red balls with their SDs shown as red lines. The final column of the figure shows the TSC foliar leaf damage rating and adjusted yield of the only entry (Oaxa 280) with multiple favorable alleles (4 of 5 identified, missing data for SNP variant on chromosome 10). The other accession which had very low foliar damage scores Guat 153 could not be determined due to missing data at all loci. There were no other accessions found with more than one favorable allele present in the entire GWAS population. The accession Oaxa 280 is listed in the CIMMYT Germplasm Bank as Primary Race Conico and Secondary Race Oloton. Guat 153 is listed in the CIMMYT Germplasm Bank as Primary Race Tehua, with no secondary race.
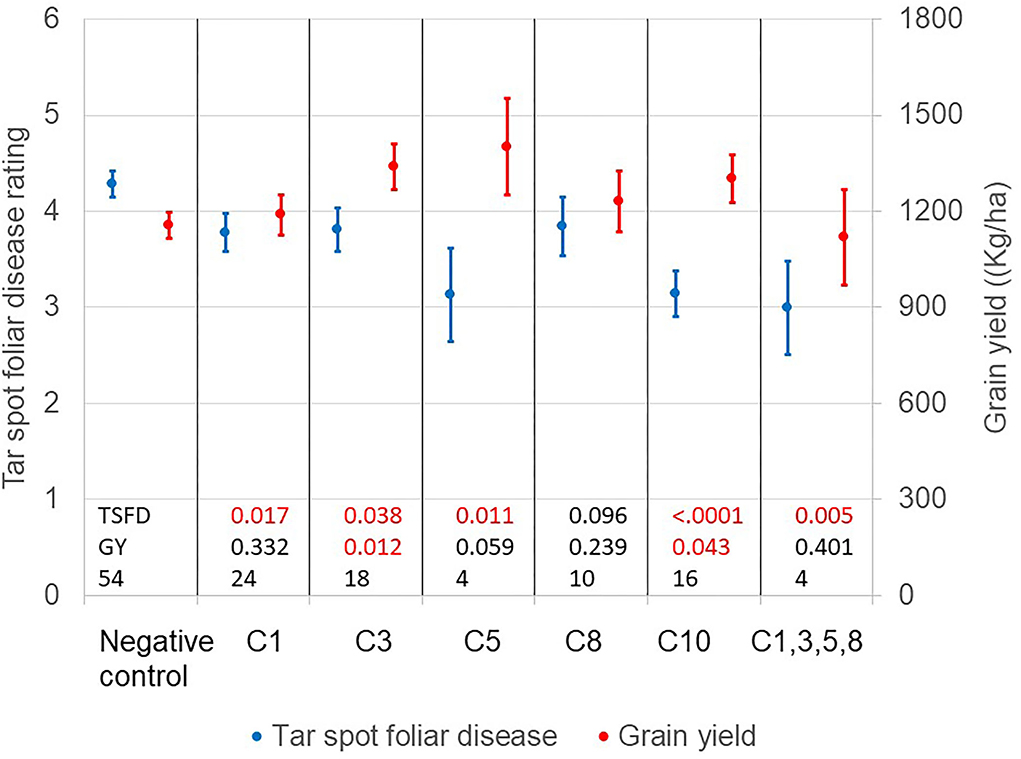
Figure 6. Confirmation Trial 2014. Second foliar leaf damage ratings and yield from previously unevaluated accession-topcross entries selected for state (+/-) of favorable alleles at five highly significant SNP regions identified in 2012 trials. Negative check without any favorable alleles; C1 = favorable allele identified on chromosome 1 (S1_287736035); C3 = favorable allele identified on chromosome 3 (S3_ 2861473); C5 = favorable allele identified on chromosome 5 (S5_19462129); C8 = favorable allele identified on chromosome 8 (S8 _138133667); C10 = favorable allele identified on chromosome 10 (S10_134718316); C1,3,5,8 = single accession topcross with multiple identified favorable alleles (c10 missing data). Mixed model results for the analysis of TSFD and GY. Adjusted means (dots) and standard errors (vertical lines) are represented in the figure. P-values compare the adjusted means for each set of TC against the set of negative controls. Values lower than 0.05 are highlighted in red.
Genome-wide association has been proven successful in identifying common variants associated with human disease (Pritchard, 2002). There is, however, a growing body of evidence supporting the role of rare variants in complex trait associations (Asimit and Zeggini, 2010). For example, the allele frequencies for the variants identified as protective for type I diabetes range from 0.46 to 1.1% (Nejentsev et al., 2009). In the Dallas Heart Study, the SNP variants associated with the level of low-density lipoprotein cholesterol (LDL-C) were present at extremely low allele frequencies (0.03–0.6%), and most of these associated variants were specific to the population/racial background (Cohen et al., 2006).
Similar to our TSC study in the Seeds of Discovery Initiative, the advantage of genetic analyses using large admixed panels is demonstrated, especially when a collection of phenotypes is considered. Such focus, aided by the availability of common SNP profiles across different population ancestries, facilitates the use of shared parameter controls in large studies of multiple traits. Also, the collection of common samples on a suite of traits of interest to the community enables meta-analyses, encouraging discovery of latent meaning from cumulative knowledge (Evangelou and Ioannidis, 2013; Pharoah et al., 2013). The trade-offs accompanied with diverse GWAS panels include the complexity in population genetics properties that complicates rare allele identification and confounds genetic analyses, thereby negatively impacts the portability of tag-SNPs (Rosenberg et al., 2010). The uncertainty in distinguishing rare variants from missing data could be concerning, especially when determining the SNP genotypes from a great deal of sequence diversity (Asimit and Zeggini, 2010). Various imputation algorithms are available for addressing this issue in SNP calling (Li et al., 2009; Marchini and Howie, 2010), in which most algorithms depend on shared LD patterns and accurate haplotype generations that can confidently capture genotypic information of genomic segments in both GWAS population and in reference. As a result, interpreting missing data can be challenging. In Seeds of Discovery, the strength of Beagle 4 in extracting haplotypes from heterogeneous data for imputation provides reasonable accuracy for our GWAS analysis (Swarts et al., 2014), as demonstrated by Romero Navarro et al. (2017). Although the extensive amount of structural variation in maize genome still imposes concerns on missing data interpretation, such imputation challenge should be explicitly examined when multiple reference genomes are available.
Apart from the rareness in SNPs, concerns on low portability of tag-SNP in diverse populations might also impede the use of heterogeneous GWAS panels (Rosenberg et al., 2010). The cautions are not only in statistics but also biological validations for such SNP variants must be considered. Examining haplotypes from a highly diverse West Africa population, Helgason et al. (2007) identified variants in a transcription factor 7-like 2 gene that are associated with type 2 diabetes. The same variants were then replicated and refined in an Icelandic population, suggesting that reproducible, rare variants, identified from high levels of haplotype diversity, could be powerful tools for fine mapping causal variants (Teo et al., 2010). Many of these roadblocks for using diverse materials will eventually be removed when new sequencing technologies make it feasible to conduct GWAS by using enriched sub-genome libraries (Rabbani et al., 2013; for example of identification of rare SNPs susceptible to cardiovascular diseases, see Norton et al., 2011). As a result, allele mining with diverse GWAS panels could be the gateway to identifying beneficial alleles that might have been lost due to the bottleneck effect in the process of modern breeding. The use of field validation, as demonstrated in this research, might likely be a desirable route for confirming genomics findings to the field. When consistent, reproducible genomic variations can be realized, and efforts in re-discovering useful diversity from exotic germplasm and wild relatives could very likely be expanded to meet agricultural demand (McCouch et al., 2013).
Plant-pathogen interaction is complex in nature (see review in Jones and Dangl, 2006). Studies on the genetics underlying disease resistance have suggested a spectrum of different genetic models, ranging from single genes with large effects (Hao et al., 2011; Liu et al., 2014), polygenic additive model (Poland et al., 2011; Olukolu et al., 2014), to a genetic architecture that highlights the interplay of many minor loci and copy number variation (Cook et al., 2012; Jamann et al., 2014). To genetically dissect the TSC resistance to the obligate pathogen, P. maydis, a single QTL model with strong dominance, was proposed from phenotypic segregation tests of eight parental lines (Ceballos and Deutsch, 1992). Using a mapping population derived from CIMMYT inbred lines (CMLs), a single QTL with large effect for TSC resistance was reported by Mahuku et al. (2016). This major QTL was also identified in CIMMYT's Drought Tolerant Maize for Africa panel (DTMA) (Cao et al., 2017). Using a panel of broader diversity, our study described a greater number of SNP variants associated with lower TSC foliar damage ratings. Although it is a relatively simpler genetic architecture in comparison with other diseases caused by necrotrophic fungal pathogens (Poland et al., 2011), the benefit of mining Germplasm Banks is demonstrated.
Tar spot complex (TSC) has been reported in many Latin American regions, where its occurrence is common in moderately cool, humid, tropical, and subtropical mountainous areas, that is, in climates where northern corn leaf blight (NLB) develops readily (Ceballos and Deutsch, 1992). Given that TSC pressure has not been consistent in all sites, hypotheses proposed by the “arms-race” metaphor and balancing selection on the same site for different traits (variable selection in heterogeneous temporal disease pressure from NLB and TSC) predict the maintenance of polymorphism in the populations that have had disease pressure. Our findings, where the polymorphism of TSC resistance phenotypes can only be seen in the germplasm collected from the regions with frequent TSC occurrence, support this scenario. Landraces in southern Mexico and Guatemala where TSC occurs regularly have provided a long-term breeding experiment that helps to maintain TSC resistance in low frequency by the coevolution of host-pathogen relationship.
This panel of 912 landrace accessions characterized for TSC reaction is notable for its diversity. It is a subset of a larger panel of landrace accessions (4,471 accessions) from the CIMMYT Maize Germplasm Bank described in Romero Navarro et al. (2017). The adaptation of GWAS to landraces had to take into account the diversity between landraces and within landraces in phenotyping and genotyping methods. In spite of the differences in working with maize landrace populations, we were able to identify and confirm the putative SNP variants associated with TSC resistance. GBS technology had the limitation of two alleles segregating per loci, but maize landraces have an average of 20.9 alleles segregating per loci (Vega-Alvarez et al., 2017). In order to work within the GBS system, a single plant represented each landrace accession population. This selection of a single plant gives a snapshot of diversity within these Germplasm Bank collections. Phenotyping of the same single plant was facilitated by using it as the male parent in the formation of an accession topcross, which produced enough seed for multi-location testing, and also decreased lodging, and sensitivity to plant spacing and fertility levels, often seen in landraces, thereby reducing the experimental error in the evaluation of large numbers of diverse materials. The experimental design and analysis then eliminated the effect of the hybrid and provided BLUPs of the single-plant phenotype using a non-replicated design with checks for spatial corrections. A single plant of a landrace accession is heterozygous at the majority of loci. Therefore, each accession topcross exhibited segregation within the entry (plant row); because of this segregation, we scored foliar leaf damage ratings as individual plants within a row and averaged those scores to arrive at a more accurate evaluation within entry. We used the 0–5 TSC foliar leaf damage scale defined by Ceballos and Deutsch (1992), which better accommodated the diversity in plant heights, ear heights, and number of leaves per plant by defining each rating score based on the amount of damage below the ear and above the ear since the total leaf area and leaf area above and below the ear varied within this panel due to diversity in morphology of the landraces. Most foliar leaf damage scoring methods are based on the percentage of leaf damage but assume little variation in the total leaf area and in relative placement of the ear on the plant. Phenotypic correlations of less leaf damage with taller and later maturity plants lead us to examine the passport information from the CIMMYT Germplasm Bank as to the classification of landraces the accessions in the panel had been identified as belonging to. We found that the accessions that were phenotypically most resistant to TSC foliar damage were classified as Mexican landraces which originate from areas where tar spot (P. maydis) has been endemic at low levels since it was first recognized and perhaps before since there are terms in indigenous languages for this disease. This long-term selection over time in an environment conducive to the development of at least one component of the TSC has selected for a higher frequency of resistant alleles within these populations than is found elsewhere in Mexico. It is not surprising that many of the alleles we found associated with resistance to foliar disease development do not appear in modern hybrids (Cao et al., 2017). Intensifying agriculture by growing two crops a year with irrigation during the dry season has been speculated by Guatemalan researchers to have increased inoculum in areas where the disease had not previously caused damage, particularly as those dry season planting were susceptible hybrids (Monterroso-Salvatierra, 2014). The intensification of agriculture along with less predictable weather patterns necessitates further study of TSC in host plant resistance, pathogen population dynamics and interactions, and crop management practices.
From the perspective of utilization of genetic diversity in plant breeding, the results of this study are hopeful. The field evaluation of the topcross from a single plant of an accession identified sources of resistance. This resistance not only held up for the foliar trait but was also demonstrated as higher yield in the topcross of the accession likely due to greater photosynthetic levels when leaf area is not lost due to TSC leaf necrosis. The most resistant material in the field was also identified as the only accession with 4 out of 5 of the favorable alleles. The association of favorable alleles held up even when the resistant accession (Oaxa 280) was removed from the analysis (data not shown). The field phenotyping and the genotyping confirmed the resistance of this accession. There are several examples of use of these maize accessions identified at CIMMYT for TSC resistance in maize germplasm projects. We crossed the accession Oaxa 280 with farmer-held varieties in several villages in higher elevations of Oaxaca to increase the resistance to TSC in those regions as part of a participatory breeding project. We first evaluated the accession in those villages for adaptation and level of resistance to TSC compared to the local landrace and asked farmer's opinions. The accession Oaxa 280 was originally collected in the Mexican state of Oaxaca and farmers were much more interested in crossing their local landraces with another landrace that came from within their own state than in using a source of host plant genetic resistance from another region. In two villages, farmers expressed that there was improvement of TSC resistance from crosses and backcrosses with Oaxa 280 to their local landrace. In a separate effort, the TSC-resistant CML 576, an elite inbred from the CIMMYT Maize Program, was crossed and backcrossed to the resistant accession Guat 153 from Guatemala to evaluate whether there was complementarity of resistance between the two donors and the research is ongoing.
Tar spot complex (TSC), together with many other newly emerging diseases such as Cassava Mosaic Virus (Thresh and Otim-Nape, 1994) and Ug 99 (Singh et al., 2011), is like Ebola, a disease known to have previously existed, laying in low frequency, and causing little global awareness until epidemics occur (World Health Organization, 2014). Emerging plant infectious diseases could develop into unexpected, devastating epidemics, causing serious impacts including famine-related death, especially for poorer regions of the world (Vurro et al., 2010). While the spreads of TSC reported between 1970 and 2015 were in tropical and sub-tropical regions, the recent reports of tar spot in the US and Canada show how rapidly an introduced pathogen can become a major disease problem (Ruhl et al., 2016; Rocco da Silva et al., 2021), with tar spot firmly in the North American temperate corn belt and causing significant yield losses. Our results in TSC support the approach taken by CIMMYT's Seeds of Discovery Initiative as efficient for accessing beneficial genotypes/alleles from the variation preserved in Germplasm Banks. Although it is indeed like searching for a needle in a haystack, a systematic effort as such to unlock and make available useful variation in landraces would be of great benefit in the search for a solution to the challenges of rapid population growth and food security. The challenge is to move unique alleles of resistance found in open pollinated varieties conserved in CIMMYT's Germplasm Bank into an elite tropical and temperate commercial hybrid, and local landraces without severely impacting agronomic performance.
The datasets presented in this study can be found in online repositories. The names of the repository/repositories and accession number(s) can be found in the article/Supplementary material.
MW and EB designed and conceived the study. MW, ER-C, AG-E, DC, and RS conducted the field assessment and collected the phenotypic information. DJ advised on foliar damage scoring methods. SH and EB coordinated genotyping effort for the Seeds of Discovery Initiative at CIMMYT. KS performed imputation. MW, JB, CC, and ZK analyzed the results. MW, CC, JB, and DJ wrote the manuscript. All authors contributed to the article and approved the submitted version.
This work was implemented by CIMMYT as part of the Seeds of Discovery (SeeD) Initiative in collaboration with Cornell University, made possible by the generous support of Sustainable Modernization of Traditional Agriculture (MasAgro) Project funded by the Ministry of Agriculture, and Rural Development (SADER) of the Government of Mexico. Any opinions, findings, conclusion, or recommendations expressed in this publication are those of the author(s) and do not necessarily reflect the view of SADER. Analysis and interpretation were supported by the CGIAR research program on MAIZE for MW, JB, and DJ. The National Science Foundation and USDA-ARS supported the work of KS and ESB (DBI-0922493, NSF IOS-1238014). CC is supported by the Oklahoma Agriculture Experimental Station and National Science Foundation (NSF MRI-1626157). This work was completed in part by the Extreme Science and Engineering Discovery Environment (XSEDE), which is supported by National Science Foundation grant number ACI-1548562. Specifically, it used the Bridges system, which is supported by NSF award number ACI-1445606, at the Pittsburgh Supercomputing Center (PSC) under the resource allocation MCB-180177 (CC).
The authors wish to offer their thanks to Corteva Agrosciences for the use of land and agronomic management of fields in Chiapas, which was essential to the success of this work. We are also indebted to the CIMMYT Maize Germplasm Bank for access to accessions of the Breeder's Core Collection, and to Dr. Felix San Vicente and staff of the CIMMYT Global Maize Program for forming the team involved in the production of the accession topcrosses. Dr. George Mahuku is acknowledged for conducting one-leaf damage rating in 2011. Also, we wish to thank Dr. James B. Holland for commenting on an early version of this manuscript and Dr. Xuecai Zhang for help in comparing the accessions with GBS data of CIMMYT.
Author AG-E is currently employed by Corteva Agriscience. AG-E worked for CIMMYT during the course of this investigation and did not begin working for Corteva until several years after he left CIMMYT.
The remaining authors declare that the research was conducted in the absence of any commercial or financial relationships that could be construed as a potential conflict of interest.
All claims expressed in this article are solely those of the authors and do not necessarily represent those of their affiliated organizations, or those of the publisher, the editors and the reviewers. Any product that may be evaluated in this article, or claim that may be made by its manufacturer, is not guaranteed or endorsed by the publisher.
The Supplementary Material for this article can be found online at: https://www.frontiersin.org/articles/10.3389/fsufs.2022.937200/full#supplementary-material
Ascencio-Ibáñez, J. T., Sozzani, R., Lee, T. J., Chu, T. M., Wolfinger, R. D., Cella, R., et al. (2008). Global analysis of Arabidopsis gene expression uncovers a complex array of changes impacting pathogen response and cell cycle during geminivirus infection. Plant Physiol. 148, 436–454. doi: 10.1104/pp.108.121038
Asimit, J., and Zeggini, E. (2010). Rare variant association analysis methods for complex traits. Annu. Rev. Genet. 44, 293–308, doi: 10.1146/annurev-genet-102209-163421
Bajet, B. N., Renfro, B. L., and Valdéz, C. J. (1994). Control of tar spot of maize and its effect on yield. J. Pest Manag. 40, 121–125. doi: 10.1080/09670879409371868
Bell, F. H., and Alandia, B. S. (1957). Diseases of temperate climate crops in Bolivia. Plant Dis. Rep. 41, 646–649.
Benjamini, Y., and Hochberg, Y. (1995). Controlling the false discovery rate: a practical and powerful approach to multiple testing. J. R. Stat. Soc. Series B. Stat. Methodol. 57, 289–300. doi: 10.1111/j.2517-6161.1995.tb02031.x
Blanvillain, R., Kim, J. H., Wu, S., Lima, A., and Ow, D. W. (2009). OXIDATIVE STRESS 3 is a chromatin-associated factor involved in tolerance to heavy metals and oxidative stress. Plant J. 57(4), 654–665. doi: 10.1111/j.1365-313X.2008.03717.x
Browning, B.L., and Browning, S.R. (2013). Improving the accuracy and efficiency of identity-by-descent detection in population data. Genetics. 194, 459–471. doi: 10.1534/genetics.113.150029
Cao, S., Loladze, A., Yuan, Y., Wu, Y., Zhang, A., Chen, J., et al. (2017). Genome-wide analysis of tar spot complex resistance in maize using genotyping-by-sequencing SNPs and wholegenome prediction. Plant Genome. 10, 1–14. doi: 10.3835/plantgenome2016.10.0099
Ceballos, H., and Deutsch, J. A. (1992). Inheritance of resistance to tar spot complex in maize. Phytopathology. 82, 505–512. doi: 10.1094/Phyto-82-505
Cohen, J. C., Pertsemlidis, A., Fahmi, S., Esmail, S., Vega, G. L., Grundy, S. M., et al. (2006). Multiple rare variants in NPC1L1 associated with reduced sterol absorption and plasma low-density lipoprotein levels. Proc. Natl. Acad. Sci. U.S.A. 103, 1810–1815. doi: 10.1073/pnas.0508483103
CONABIO (2020). Razas de maíz de México. Comisión Nacional para el Conocimiento y Uso de la Biodiversidad, Cd. de México. México.Contenido: Cecilio Mota Cruz, Rosa María González Amaro, Caroline Burgeff, Cuauhtémoc Enríquez García, Oswaldo Oliveros Galindo y Francisca Acevedo Gasman / Colaboradores externos: José de Jesús Sánchez González (CUCBA, UdG), Juan Manuel Hernández Casillas (CIRCE, INIFAP), Rafael Ortega Paczka (UACh), Hugo Perales Rivera (ECOSUR). Available online at: https://www.biodiversidad.gob.mx/diversidad/alimentos/maices/razas-de-maiz%25. (accessed March 17, 2022).
Cook, D. E., Lee, T. G., Guo, X., Melito, S., Wang, K., Bayless, A. M., et al. (2012). Copy number variation of multiple genes at Rhg1 mediates nematode resistance in soybean. Science. 338, 1206–1209. doi: 10.1126/science.1228746
Cruz, V. M. V., Kilian, A., and Dierig, D. A. (2013). Development of DArT marker platforms and genetic diversity assessment of the US collection of the new oilseed crop lesquerella and related species. PloS ONE. 8, e64062. doi: 10.1371/journal.pone.0064062
Dawson, I. K., Russell, J., Powell, W., Steffenson, B., Thomas, W. T. B., and Waugh, R. (2015). Barley: a translational model for adaptation to climate change. New Phytologist. 206, 913–931. doi: 10.1111/nph.13266
Elshire, R. J., Glaubitz, J. C., Sun, Q., Poland, J. A., Kawamoto, K., Buckler, E. S., et al. (2011). A robust, simple genotyping-by-sequencing (GBS) approach for high diversity species. PLoS ONE. 6, e19379. doi: 10.1371/journal.pone.0019379
Evangelou, E., and Ioannidis, J. P. A. (2013). Meta-analysis methods for genome-wide association studies and beyond. Nat. Rev. Genet. 14, 379–389. doi: 10.1038/nrg3472
Gilmour, A. R., Gogel, B. J., Cullis, B. R., and Thompson, R. (2009). ASReml User Guide Release 3.0 VSN International Ltd, Hemel Hempstead, HP1 1ES, UK. Available online at: www.vsni.co.uk/
Hansen, J., Davison, D., Jones, D., and Sun, X. (2016). Pest Alert: Pyllachora maydis, Corn Tar Spot. Florida Department of Agriculture and Consumer Services.
Hao, Y., Chen, Z., Wang, Y., Bland, D., Buck, J., Brown-Guedira, G., et al. (2011). Characterization of a major QTL for adult plant resistance to stripe rust in US soft red winter wheat. Theor. Appl. Genet. 123, 1401–1411. doi: 10.1007/s00122-011-1675-8
Hearne, S., Chen, C., Buckler, E., Mitchell, S., Romero, A., Swarts, K., et al (2014a). Unimputed GbS derived SNPs for maize landrace accessions represented in the SeeD-maize GWAS panel. International Maize and Wheat Improvement Center V2. Available online at: http://hdl.handle.net/11529/10035
Hearne, S., Chen, C., Buckler, E., Mitchell, S., Romero, A., Swarts, K., et al (2014b). Imputed GbS derived SNPs for maize landrace accessions represented in the SeeD-maize GWAS panel: Imputation using Beagle v.4. International Maize and Wheat Improvement Center V2. Available online at: http://hdl.handle.net/11529/10035
Helgason, A., Pálsson, S., Thorleifsson, G., Grant, S. F., Emilsson, V., Gunnarsdottir, S., et al. (2007). Refining the impact of TCF7L2 gene variants on type 2 diabetes and adaptive evolution. Nat. Genet. 39, 218–225. doi: 10.1038/ng1960
Hock, J. (1989). Äetiologische und epidemiologische Untersuchungen zum Teerfleckenkomplex an Zea mays iin Méxiko (Ph.D. thesis) Justus-Liebig Universität, Giessen, Germany.
Hock, J., Kranz, J., and Renfro, B. L. (1995). Studies on the epidemiology of the tar spot disease complex of maize in Mexico. Plant Pathology. 44, 490–502. doi: 10.1111/j.1365-3059.1995.tb01671.x
Horn, F., Habekuß, A., and Stich, B. (2014). Genes involved in barley yellow dwarf virus resistance of maize. TAG. Theoretical and applied genetics. Theoretische und angewandte Genetik. 127, 2575–2584. doi: 10.1007/s00122-014-2400-1
Jamann, T. M., Poland, J. A., Kolkman, J. M., Smith, L. G., and Nelson, R. J. (2014). Unraveling genomic complexity at a quantitative disease resistance locus in maize. Genetics. 198, 333–344. doi: 10.1534/genetics.114.167486
Jones, J. D. G., and Dangl, J. L. (2006). The plant immune system. Nature. 444, 323–329. doi: 10.1038/nature05286
Kang, H. M., Sul, J. H., Service, S. K., Zaitlen, N. A., Kong, S., Freimer, N. B., et al. (2010). Variance component model to account for sample structure in genome-wide association studies. Nat Genet. 42, 348–354. doi: 10.1038/ng.548
Kleczewski, N. M., and Bowman, N. D. (2020). An observation of corn tar spot dispersal from agricultural fields to an isolated urban plot. Plant Health Prog. 22, 69–71. doi: 10.1094/PHP-10-20-0082-BR
Kleczewski, N. M., Donnelly, J., and Higgins, R. (2019). Phyllachora maydis, causal agent of tar spot on corn, can overwinter in northern Illinois. Plant Health Prog. 20, 178. doi: 10.1094/PHP-04-19-0030-BR
Li, Y., Willer, C., Sanna, S., and Abecasis, G. (2009). Genotype Imputation. Annu. Rev. Genomics Hum. Genet. 10, 387–406. doi: 10.1146/annurev.genom.9.081307.164242
Lipps, S., Smith, D., Telenko, D., Paul, P., Kleczewski, N., and Jamann, T. (2022). Identification of resistance for Phyllachora maydis of maize in exotic-derived germplasm. Crop Sci. 62, 859–866. doi: 10.1002/csc2.20709
Liu, L. J. (1973). Incidence of tar spot disease of corn in Puerto Rico. J. Agric. Univ. P. R. 57, 211–216. doi: 10.46429/jaupr.v57i3.10745
Liu, W. Y., Kang, J. H., Jeong, H. S., Choi, H. J., Yang, H. B., Kim, K. T., et al. (2014). Combined use of bulked segregant analysis and microarrays reveals SNP markers pinpointing a major QTL for resistance to Phytophthora capsici in pepper. TAG. 127, 2503–2513. doi: 10.1007/s00122-014-2394-8
Liu, Y., Huang, X., Li, M., He, P., and Zhang, Y. (2016). Loss-of-function of Arabidopsis receptor-like kinase BIR1 activates cell death and defense responses mediated by BAK1 and SOBIR1. New Phytol. 212, 637–645. doi: 10.1111/nph.14072
Ma, C., Liu, Y., Bai, B., Han, Z., Tang, J., Zhang, H., et al. (2017). Structural basis for BIR1-mediated negative regulation of plant immunity. Cell research. 27, 1521–1524. doi: 10.1038/cr.2017.123
Mahuku, G., Chen, J., Shrestha, R., Narro, L. A., Guerrero, K. V. O., Arcos, A. L., et al. (2016). Combined linkage and association mapping identifies a major QTL (qRtsc8-1), conferring tar spot complex resistance in maize. TAG. 129, 1217–1229. doi: 10.1007/s00122-016-2698-y
Mahuku, G., Shrestha, R., and San Vicente, F. (2013). Tar spot complex of maize: facts and actions. Available online at: www.researchgate.net/publication/266732736_Tar_Spot_Complex_of_Maize_Facts_and_Actions. (accessed March 28, 2022).
Marchini, J., and Howie, B. (2010). Genotype imputation for genome-wide association studies. Nat. Rev. Genet. 11, 499–511. doi: 10.1038/nrg2796
Maublanc, A. (1904). Espèces nouvelles de champignons inférieurs. Bulletin de la Société Mycologique de France. 20, 70–74.
McCouch, S., Baute, G. J., Bradeen, J., Bramel, P., Bretting, P. K., Buckler, E., et al. (2013). Agriculture: Feeding the future. Nature. 499, 23–24. doi: 10.1038/499023a
McCoy, A. G., Roth, M. G., Shay, R., Noel, Z. A., Jayawardana, M. A., Longley, R. W., et al. (2019). Identification of fungal communities within the tar spot complex of corn in Michigan via next-generation sequencing. Phytobiomes J. 3, 235–243. doi: 10.1094/PBIOMES-03-19-0017-R
Monterroso-Salvatierra, D. (2014). Manejo integrado de la mancha de asfalto del maíz: Manual para la capacitación de capacitadores. 24 (Facultad de Agronomía de la Universidad de San Carlos de Guatemala (FAUSAC) y Consultoría Técnica Internacional S.A. (COTINSA), Guatemala, Guatemala).
Mottaleb, K. A., Loladze, A., Sonder, K., Kruseman, G., and San Vicente, F. (2019). Threats of tar spot complex disease of maize in the United States of America and its global consequences. Mitig. Adapt. Strateg. Glob. Chang. 24, 281–300. doi: 10.1007/s11027-018-9812-1
Mueller, D., Wise, K., and Sisson, A. (2019). Corn disease management: Corn disease loss estimates from the United States and Ontario, Canada−2018. Crop Protect. Netw. doi: 10.31274/cpn-20200519-0
Müller, E., and Samuels, G. J. (1984). Monographella maydis sp. nov. and its connection to the tar-spot disease of Zea mays. Nova Hedwigia. 40, 113–120.
Nagaraj, S., Senthil-Kumar, M., Ramu, V. S., Wang, K., and Mysore, K. S. (2016). Plant ribosomal proteins, RPL12 and RPL19, play a role in nonhost disease resistance against bacterial pathogens. Front. Plant Sci. 6, 1192. doi: 10.3389/fpls.2015.01192
Nejentsev, S., Walker, N., Riches, D., Egholm, M., and Todd, J. A. (2009). Rare variants of IFIH1, a gene implicated in antiviral responses, protect against type 1 diabetes. Science. 324, 387–389. doi: 10.1126/science.1167728
Norton, N., Li, D., Rieder, M. J., Siegfried, J. D., Rampersaud, E., Züchner, S., et al. (2011). Genome-wide studies of copy number variation and exome sequencing identify rare variants in BAG3 as a cause of dilated cardiomyopathy. Am. J. Hum. Genet. 88, 273–282. doi: 10.1016/j.ajhg.2011.01.016
Olukolu, B. A., Wang, G-F., Vontimitta, V., Venkata, B. P., Marla, S., Ji, J., et al. (2014). A genome-wide association study of the maize hypersensitive defense response identifies genes that cluster in related pathways. PLoS Genet. 10:e1004562. doi: 10.1371/journal.pgen.1004562
Peiffer, J. A., Romay, M. C., Gore, M. A., Flint-Garcia, S. A., Zhang, Z., Millard, M. J., et al. (2014). The genetic architecture of maize height. Genetics. 196, 1337–1356. doi: 10.1534/genetics.113.159152
Pereyda–Hernández, J., Hernández-Morales, J., Sandoval-Islas, I. S., Aranda-Ocampo, S., De León-Garcia de Alba, C., and Gomez-Montiel, N. (2009). Etiology and management of tar spot (Phyllachora maydis Maubl.) of maize in Guerrero State, México. Agrociencia. 43, 511–519. Available online at: https://agrociencia-colpos.mx/index.php/agrociencia/article/view/736/736
Pharoah, P. D., Tsai, Y. Y., Ramus, S. J., Phelan, C. M., Goode, E. L., Lawrenson, K., et al. (2013). GWAS meta-analysis and replication identifies three new susceptibility loci for ovarian cancer. Nat. Genet. 45, 362–370e3702. doi: 10.1038/ng.2564
Poland, J. A., Bradbury, P. J., Buckler, E. S., and Nelson, R. J. (2011). Genome-wide nested association mapping of quantitative resistance to northern leaf blight in maize. Proc. Natl. Acad. Sci. 108, 6893–6898, doi: 10.1073/pnas.1010894108
Pritchard, J. K. (2002). The allelic architecture of human disease genes: common disease-common variant.. or not? Hum. Mol. Genet. 11, 2417–2423, doi: 10.1093/hmg/11.20.2417
Pritchard, J. K., Stephens, M., and Donnelly, P. (2000). Inference of population structure using multilocus genotype data. Genetics. 155, 945–959. doi: 10.1093/genetics/155.2.945
R Core Development Team (2015). R: a language and environment for statistical computing. Vienna, Austria: R Foundation for Statistical Computing.
Rabbani, B., Tekin, M., and Mahdieh, N. (2013). The promise of whole-exome sequencing in medical genetics. J. Hum. Genet. 59, 5–15. doi: 10.1038/jhg.2013.114
Rocco da Silva, C., Check, J., MacCready, J. S., Alakonya, A. E., Beiriger, R. L., Bissonnette, K. M., et al. (2021). Recovery plan for tar spot of corn, caused by Phyllachora maydis. Plant Health Prog. 22, 596–616. doi: 10.1094/PHP-04-21-0074-RP
Romero Navarro, J. A., Willcox, M., Burgueño, J., Romay, C., Swarts, K., Trachsel, S., et al. (2017). A study of allelic diversity underlying flowering-time adaptation in maize landraces. Nat. Genet. 49, 476–480. doi: 10.1038/ng.3784
Rosenberg, N. A., Huang, L., Jewett, E. M., Szpiech, Z. A., Jankovic, I., and Boehnke, M. (2010). Genome-wide association studies in diverse populations. Nat. Rev. Genet. 11, 356–366. doi: 10.1038/nrg2760
Ruhl, G., Romberg, M. K., Bissonnette, S., Plewa, D., Creswell, T., and Wise, K. A. (2016). First report of tar spot on corn caused by Phyllachora maydis in the United States. Plant Dis. 100, 1496. doi: 10.1094/PDIS-12-15-1506-PDN
Ruiz-Corral, J. A., Durán-Puga, N., Sánchez-González, J. J., Ron-Parra, J., González-Eguiarte, D. R, Holland, J. B., et al (2008). Climatic adaptation and ecological descriptors of 42 mexican maize races. Crop Sci. 48, 1503–1512. doi: 10.2135/cropsci2007.09.0518
Sanchez, G. J. J., Goodman, M. M., and Stuber, C. W. (2000). Isozymatic and morphological diversity in the races of maize of mexico. Econ. Bot. 54, 43–59. doi: 10.1007/BF02866599
Schieber, E. (1968). Preliminary studies on Phyllachora maydis affecting corn in Central America (abstract). Phytopathology. 58, 554.
Singh, R. P., Hodson, D. P., Huerta-Espino, J., Jin, Y., Bhavani, S., Njau, P., et al. (2011). The emergence of Ug99 races of the stem rust fungus is a threat to world wheat production. Annu. Rev. Phytopathol. 49, 465–481. doi: 10.1146/annurev-phyto-072910-095423
Swarts, K., Li, H., Navarro, J. A. R., An, D., Romay, M. C., Hearne, S., et al. (2014). Novel methods to optimize genotypic imputation for low-coverage, next-generation sequence data in crop plants. Plant Genome. 7, 1–12. doi: 10.3835/plantgenome2014.05.0023
Taba, S. (2005). Latin American maize germplasm conservation: regeneration, in situ conservation, core subsets and prebreeding. Proceeding of CIMMYT workshop April 7-10, 2003, Mexico, D.F. CIMMYT.
Teo, Y.-Y., Small, K. S., and Kwiatkowski, D. P. (2010). Methodological challenges of genome-wide association analysis in Africa. Nat. Rev. Genet. 11, 149–160, doi: 10.1038/nrg2731
Thresh, J. M., and Otim-Nape, G. W. (1994). “Strategies for controlling African cassava mosaic geminivirus,” in Advances in Disease Vector Research (New York, NY: Springer), 215–236.
VanRaden, P. M. (2007). Efficient estimation of breeding values from dense genomic data. J. Dairy. Sci. 91, 4414–23. doi: 10.3168/jds.2007-0980
Vega-Alvarez, I., Santacruz-Varela, A., Rocandio-Rodríguez, M., Córdova-Téllez, L., López-Sánchez, H., Muñoz-Orozco, A., et al. (2017). Genetic diversity and structure of native maize races from Northwestern Mexico. Pesqui. Agropecu. Bras. 52, 1023–1032. doi: 10.1590/s0100-204x2017001100008
Vigouroux, Y., Glaubitz, J. C., Matsuoka, Y., Goodman, M. M., Sánchez-Gonzalez, J. J., and Doebley, J. (2008). Population structure and genetic diversity of New World maize races assessed by DNA microsatellites. Am. J. Bot. 95, 1240–1253, doi: 10.3732/ajb.0800097
Vurro, M., Bonciani, B., and Vannacci, G. (2010). Emerging infectious diseases of crop plants in developing countries: impact on agriculture and socio-economic consequences. Food Secur. 2, 113–132. doi: 10.1007/s12571-010-0062-7
World Health Organization (2014). Ebola response roadmap (No. WHO/EVD/Roadmap/14.1). World Health Organization.
Wu, Y., San Vicente, F., Huang, K., Dhliwayo, T., Costich, D. E., Semagn, K., et al. (2016). Molecular characterization of CIMMYT maize inbred lines with genotyping-by-sequencing SNPs. TAG. Theoretical and applied genetics. Theoretische und angewandte Genetik. 129, 753–765. doi: 10.1007/s00122-016-2664-8
Yu, J., Pressoir, G., Briggs, W. H., Bi, I. V., Yamasaki, M., Doebley, J. F., et al. (2006). A unified mixed-model method for association mapping that accounts for multiple levels of relatedness. Nat. Genet. 38, 203–208. doi: 10.1038/ng1702
Keywords: maize landraces, maize genetic resources, allelic diversity, rare alleles, phenotypic characterization, foliar diseases of tropical maize, Phyllachora maydis, climate change
Citation: Willcox MC, Burgueño JA, Jeffers D, Rodriguez-Chanona E, Guadarrama-Espinoza A, Kehel Z, Chepetla D, Shrestha R, Swarts K, Buckler ES, Hearne S and Chen C (2022) Mining alleles for tar spot complex resistance from CIMMYT's maize Germplasm Bank. Front. Sustain. Food Syst. 6:937200. doi: 10.3389/fsufs.2022.937200
Received: 05 May 2022; Accepted: 28 June 2022;
Published: 02 August 2022.
Edited by:
Stefania Masci, University of Tuscia, ItalyReviewed by:
Jyoti Kumari, National Bureau of Plant Genetic Resources (ICAR), IndiaCopyright © 2022 Willcox, Burgueño, Jeffers, Rodriguez-Chanona, Guadarrama-Espinoza, Kehel, Chepetla, Shrestha, Swarts, Buckler, Hearne and Chen. This is an open-access article distributed under the terms of the Creative Commons Attribution License (CC BY). The use, distribution or reproduction in other forums is permitted, provided the original author(s) and the copyright owner(s) are credited and that the original publication in this journal is cited, in accordance with accepted academic practice. No use, distribution or reproduction is permitted which does not comply with these terms.
*Correspondence: Martha C. Willcox, bWN3aWxsY294QHdpc2MuZWR1; Charles Chen, Y2hhcmxlcy5jaGVuQG9rc3RhdGUuZWR1; Juan A. Burgueño, ai5idXJndWVub0BjZ2lhci5vcmc=
Disclaimer: All claims expressed in this article are solely those of the authors and do not necessarily represent those of their affiliated organizations, or those of the publisher, the editors and the reviewers. Any product that may be evaluated in this article or claim that may be made by its manufacturer is not guaranteed or endorsed by the publisher.
Research integrity at Frontiers
Learn more about the work of our research integrity team to safeguard the quality of each article we publish.