 Miguel García-Parra1
 María Paula Polo-Muñoz2
 Jhon Edinson Nieto Calvache2
 Lina Marcela Agudelo-Laverde3*
 Diego Fernando Roa-Acosta2
- 1Departamento de Ciencias Agrarias y del Ambiente, Universidad Francisco de Paula Santander, Ocaña, Colombia
- 2Departamento de Ingeniería Agroindustrial, Universidad del Cauca, Popayán, Colombia
- 3Programa de Ingeniería de Alimentos, Facultad de Ciencias Agroindustriales, Universidad del Quindío, Armenia, Colombia
Background: Inclusion of quinoa in the diet of consumers has generated a challenge for quinoa producers and food processors, which involves the study of new cultivars and the functional properties of their flours.
Methods: Six quinoa cultivars (Titicaca, Blanca real, Soracá, Pasankalla, Puno and Nariño) were analyzed for their proximate composition using the methodologies proposed by the Association of Official Analytical Collaboration, AOAC. A rheological analysis was carried out with flours from each cultivar. A sequential test including a flow test, a pasting test and another flow test was programmed to evaluate the flow behavior before and after a heating process. In addition, the structural properties of the cultivar flours were evaluated by Fourier Transform Infrared spectroscopy (FTIR).
Results: It was found that the Pasankalla, Titicaca and Soracá cultivars had a higher (p < 0.05) protein content, while the Puno, Pansakalla and Blanca real cultivars stood out for their higher (p < 0.05) lipid content. On the other hand, it was found that before heating, all quinoa flour dispersions had a dilatant flow (n > 1), but after heating, all of them showed a decrease of index values, where the flours of the Titicaca and Pasankalla cultivars were more affected with a tendency toward a Newtonian flow (n ≈ 1). The pasting test showed that the viscosity varied according to the cultivar tested. It is noteworthy that both Titicaca and Soracá presented a high peak viscosity (0.16 ± 0.01 and 0.13 ± 0.02 Pa·s respectively) and different setback values on cooling (0.100 ± 0.028 and 0.01 ± 0.01 Pa·s respectively). Spectroscopic analysis showed a direct relationship between the intensity of the peaks and the nutritional content of the flours. In addition, secondary protein structures such as β-sheet, β-Turn, α-Helix and Random Coil were identified after deconvolution of the spectra. The differences in the protein structures of each cultivar could allow their identification by this methodology.
Conclusion: It can be concluded that quinoa flours from the six cultivars could be used for the formulation of different food products, such as beverages, baked goods, snacks, pasta and others, acting as nutritional improvers and modifiers of rheological, textural and functional properties.
Introduction
The growth of the world population, the rise of interest in products of vegetable origin, with biological, nutritional or technological functionality, and the increasing search for gluten-free products, have led both individuals and industries to search for new food sources that meet these requirements. Among the different foods that have been investigated, quinoa appears as an opportunity with high potential to supply the different needs of the population and the processed food industries (Sohaimy et al., 2018; Alrosan et al., 2022). Quinoa is an Andean grain, highly appreciated in the world for its protein content, fatty acids, vitamins, minerals, dietary fibers and especially for its good balance of essential amino acids (Pellegrini et al., 2018; Pereira et al., 2019). It has been proven that quinoa cultivation can be adapted to different agronomic and climatic conditions, allowing its production in the high altitudes of the Andes in countries such as Bolivia, Peru, Ecuador, Colombia, Argentina and Chile (Jaikishun et al., 2019). The quinoa grain has shown great potential to supply food in a sustainable way in the world, due to its ability to adapt to different soil and climate conditions, where other crops are unable to adapt. This makes quinoa an excellent productive and food alternative in the face of the adverse effects of climate change. In this respect, together with amaranth, they have been named as grains of great interest in the 21st century (Ruiz et al., 2015).
Taking into account the benefits of the crop and its nutritional content, many countries have sought to develop varieties, sharing and exchanging germplasm with other countries through crop experimentation, which seeks to improve the expansion of quinoa production. Currently, there is a continuous momentum in this crop that reaches more than 95 countries, including Tibet, Morocco, France, India, China, United Kingdom, Sweden, Denmark, Netherlands and Italy (Bhargava et al., 2006; Pulvento et al., 2012; Bazile et al., 2016).
The study of rheological properties such as flow and pasting of quinoa flours can be of great interest in the food industry, because of their correlation with the textural properties (Wu et al., 2014) of food products or because of the effect they can have on the rheological properties of the food to which they are added. On the other hand, no rheological or physicochemical studies of the quinoa cultivars Titicaca, Blanca real, Soracá, Pasankalla, Puno and Nariño have been reported, therefore the objective of this work was to analyze the chemical composition, structural properties and rheological behavior of quinoa flours of different cultivars.
Materials and methods
Materials
Grains grown under greenhouse conditions in the municipality of Ventaquemada Colombia, at Victoria Granja Agroecológica® with coordinates 5°22′47″ N and 73°30′10″ W, at an altitude of 2,722 masl, were used. During the trial, the average temperature was 15.2°C, relative humidity of 79.1% and an average daily illumination of 624 μmol.m−2·s−1 under greenhouse conditions. The cultivars used were Titicaca, Blanca real, Soracá, Pasankalla, Puno and Nariño. In general, all the cultivars used in this work could be considered as white grains with the exception of Pasankalla which is characterized by a dark brown color. Planting was carried out in 3.0 x 2.0 m plots to achieve a planting density of 200,000 plants per hectare. A random sample of 30 kg of quinoa of each cultivar was collected for analysis.
Flour production
Flour production was carried out in an analytical knife mill, IKA A11 basic, Brazil. The flours were then sieved through an A.S.T.M.E.11 sieve to obtain flours with particle size between 180 and 125 μm. The flours were packaged and stored under vacuum until characterization.
Quantification of protein, lipids and carbohydrates
For proximal analysis, the methodologies proposed by AOAC (2000) were used. For protein analysis, method 984.13 was employed, with a conversion factor of 6.25. The ether extract was obtained by method 991.36. The percentage of total carbohydrates (CHO) was obtained by difference (%CHO=100-%protein-%lipids-%water-%ash). The analyses were performed at least in duplicate.
Rheological characterization
For the rheological analysis, aqueous dispersions of each flour were prepared at a concentration of 12 g·100 mL−1. A sequential test involving a flow test, a pasting test and another flow test was programmed to evaluate the flow behavior before and after the heating process (Polo María et al., 2021; Ortiz Gómez et al., 2022). An AR 1,500 rheometer, TA Instruments, New Castel, USA, equipped with a pasting cell for starch analysis (SPC) were used. All rheological analyses were performed at least in triplicate.
Flow tests
The flow test was performed at a constant temperature of 30°C and at a shear rate in the range of 0.01 and 200 s−1. The experimental data were fitted to the power law equation (Ostwald model).
Where τ represents the shear stress, k the consistency index, the shear rate, and n is the flow index. A Newtonian flow type was determined for values of n=1, pseudoplastic for n<1 and dilatant for n>1 (Nieto-Calvache et al., 2020; Ortiz Gómez et al., 2022).
Pasting assay
For the pasting test a temperature gradient was programmed, starting at 30°C for 40 s, then the samples were heated at a rate of 10°C·min−1 up to 90°C. Then, this temperature was maintained for 4 min, and after this time the sample was cooled at 10°C·min−1 to 30°C. Finally, it was kept at this temperature for 2 min. Viscosity values [Pa·s] were recorded: Peak viscosity (maximum viscosity achieved during the heating cycle), Trough viscosity (the trough at the minimum hot paste viscosity), Final viscosity (the viscosity at the end of test after cooling to 30 °C and holding at this temperature), Breakdown viscosity (the decrease in viscosity during the first holding period, calculated as the peak viscosity minus the viscosity at the starting cooling period), and Setback viscosity (the increase in viscosity during cooling, calculated as the difference between the final viscosity and the viscosity at the starting cooling period) (Polo María et al., 2021; Correia Bento et al., 2022).
Attenuated total reflectance-fourier transform-infrared spectroscopy
A spectrometer model IRAFFINITY-1S (Shimadzu, Inc., Shelton CT, Japan) equipped with a MIRacle 10 (Shimadzu, Inc., Shelton CT, Japan) attenuated total reflectance (ATR) accessory with a single reflection diamond crystal at an angle of incidence of 45° was used for the analysis. The average of 45 scans with a resolution of 4 cm−1 at 25 °C was taken for the measurements. Happ-Genzel apodization was used, with a magnitude phase correction. A flat tip was used and a background spectrum (air) was recorded prior to each measurement. Spectra were acquired between 500 and 4,000 cm−1. Spectral analysis was performed using OriginPro version 2016. The baselines of the spectra were corrected and normalized between 0 and 1. In addition, a peak deconvolution process was performed in the region from 1,600 to 1,710 cm−1 in order to determine the secondary structures β-sheet, β-turns α-helix, Random Coil and their changes in each cultivar (Roa Acosta et al., 2020). The tests were performed in triplicate.
Statistical analysis
For the statistical analysis of chemical composition, rheological analysis and FTIR spectra, a one-way or two-way ANOVA, with Tukey's post-hoc test was performed to compare the results of the determinations. Assumptions of normality and homogeneity were evaluated using Shapiro-Wilk and Bartlett's tests. All statistical analyses were performed with GraphPad Prism version 7 software (San Diego, CA). In addition, correlations were established between the quantitative variables using the Sperman correlation and were plotted using the corrplot library. A hierarchical clustering analysis was performed by Euclidean distance with the gplots and RColorBrewer libraries and principal components analysis (PCA) with Factoextra library. The PCA was performed to establish differences between the cultivars analyzed in terms of their structural and rheological properties. Multivariate analysis was performed using R statistical software, version 3.6.1.
Results and discussion
Quantification of protein, lipids and carbohydrates
In Figure 1, protein analysis showed that the Pasankalla, Titicaca and Soracá cultivars had the highest protein content (14.3 ± 0.2, 14.8 ± 0.1 and 14.3 ± 0.1 g/100 respectively), while the Puno and Nariño cultivars had the lowest (11.5 ± 0.2 and 11.6 ± 0.2/100g respectively). On the other hand, the carbohydrate content was higher in the Puno, Nariño and Blanca real (61.0 ± 0.4, 61 ± 2 and 59.3 ± 0.5/100g respectively) cultivars, while Titicaca (49.5 ± 0.8/100g) was the lowest. Lipid content was higher in Puno, Pansakalla and Blanca real (7.1 ± 0.2, 6.8 ± 0.3 and 6.8 ± 0.3/100g respectively) cultivars and lower in Titicaca and Soracá (5.8 ± 0.4 and 6.2 ± 0.2/100 g respectively). The values obtained for protein, lipids and carbohydrates are in the order of those reported by Nowak et al. (2016), who in a review study found values reported in the literature between 9.1 and 15.7 g·100g−1 for protein, between 4.0 and 7.6 g·100g−1 for lipids and between 48.5 and 69.8 g·100g−1 for carbohydrates. This preliminary analysis is of great interest for the industry or consumers, taking into account that at present, the topic of vegetable protein, lipids and carbohydrates such as starch, mainly, have been the focus of research in the food industries oriented toward the supply of products with nutritional or technological benefits. One of the most common technological and nutritional applications is the concentration or isolation of the protein. In this regard, previous work carried out with quinoa of the Blanca de Jericho variety (Roa-Acosta et al., 2020) allowed obtaining a hyper protein flour by abrasive milling, reaching protein values between 15.62 ± 0.23 and 34.85 ± 0.17 g·100g−1. Therefore, this work allows the identification of the cultivars with the greatest potential for the production of these flours using this same technology. Likewise, in the case of lipids, quinoa oil has been valued by the industry as a high quality oil, due to its content and composition of fatty acids and the presence of antioxidants such as tocopherols that provide oxidative stability (Mufari et al., 2020). In this sense, the Puno, Pansakalla and Blanca real cultivars have the greatest potential for these applications. On the other hand, quinoa starch has also been studied, for its versatility in food and non-food applications (Wang et al., 2015) such as in the production of biofilms, the microencapsulation of food ingredients (oils), or as a stabilizer of pickering emulsions (Li and Zhu, 2018).
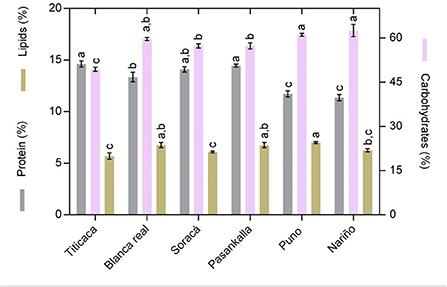
Figure 1. Protein, lipid and carbohydrate content. The average with different letters shows significant difference (p < 0.05).
Rheological properties
Flow properties
The results of the flow analysis (Figure 2) are shown at two points in the process, before heating and after heating (pasting test). The flow analysis before heating showed that all the flour dispersions analyzed had a flow index (n > 1), which indicates that their flow behavior corresponds to dilatant, meaning that viscosity tends to increase with shear rate. In food starch-water suspensions, the dilatant or shear thickening behavior has been related to the initial stiffness of starch granules to resist shearing, and to a high solids concentration resulting in particle crowding (Christianson and Bagley, 1984). In addition, when comparing the values of the consistency index (k), among the dispersions that had statistically equal n values (p < 0.05), it was observed that there were no significant differences (p < 0.05).
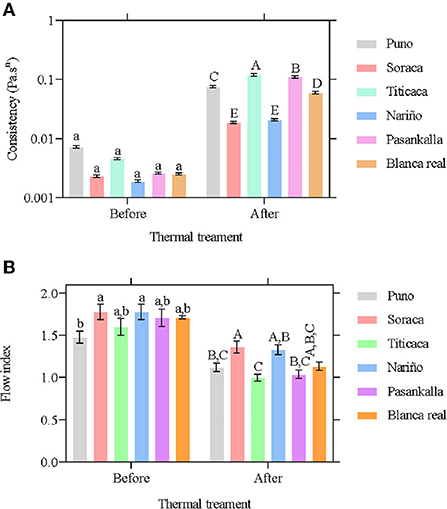
Figure 2. Flow analysis before and after heating [Flow (A) and consistency (B) indexes]. The average and standard deviation are shown. Lower case letters indicate statistical differences between cultivars and upper letters represent significant differences for thermal treatment.
On the other hand, after heating, the flow response of the dispersions was again analyzed. It was observed that n, decreased significantly for all flours, preserving in most of them a dilatant flow behavior (n > 1). For the cultivars Titicaca and Pasankalla, the values of n were reduced to values of 1.00 ± 0.004 and 1.04 ± 0.05 respectively, tending toward a Newtonian type behavior. The Newtonian type flow indicates that viscosity is independent of shear rate, so that these flours could be suitable for the formulation of certain types of products such as beverages where the nutritional content is to be improved without affecting their viscosity during shearing. On the other hand, regarding k, it was observed that after heating, between the cultivars Soracá and Nariño there were no significant differences (p < 0.05), while between the cultivars Puno, Titicaca, Pasankalla and Blanca real, the highest value of k (p < 0.05) was presented by the cultivars Titicaca and Pasankalla. The higher values of k could be associated with the higher protein content (Bozdogan et al., 2019) of these cultivars, as reported in Figure 1. The consistency index is a parameter that allows to infer about the viscous behavior of the dispersions in relation to the shear rate and its rheological behavior in the transformation processes.
Pasting properties
Table 1, summarizes the values found during the pasting analysis. Peak viscosity (PV) values were between 0.065 and 0.16 Pa·s. Moreover, the PV was higher (p < 0.05) in the Titicaca Soracá and Pasankalla cultivars. The values found were in the order of those reported by (Tiga et al., 2021), who found values of 0.186 Pa·s in quinoa flour containing 14% protein and 7% lipids. The viscosity peak occurs at a point of equilibrium between maximum swelling and starch leaching. This process is influenced by the presence of other molecules, such as lipids (Raphaelides and Georgiadis, 2006). In this respect, the flours of the Puno and Titicaca cultivars had the highest and lowest (p < 0.05) lipid content, respectively, compared to the other cultivars (Figure 1). In turn, the dispersions of these cultivars were the ones with the lowest and highest (p < 0.05) respectively VP values, which is in agreement with what was previously established.
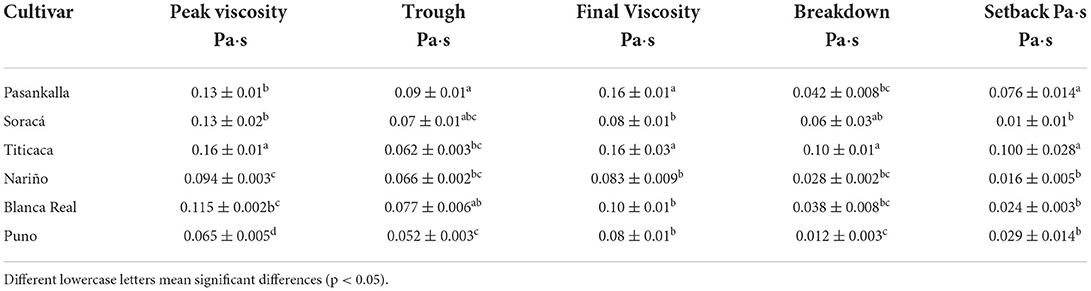
Table 1. Pasting properties of quinoa dispersions.
Trough viscosity values for the flour dispersions were between 0.052 and 0.09 Pa·s. Trough viscosity is the minimum viscosity reached after reaching the VP. The trough viscosity was found to be higher and lower (p < 0.05) respectively in the Pasankalla and Puno cultivars. The values found were in the order of those reported by Tiga et al. (2021), who reported values of 0.1851 Pa·s for quinoa flour. Moreover, the values were below those reported by (Wu et al., 2017), for quinoa starch dispersions (1.644 and 3.612 Pa·s). The final viscosity values were between 0.08 and 0.16 Pa·s. The final viscosity of the Pasankalla and Titicaca cultivars was approximately twice that of the other cultivars. The final viscosity achieved denotes the ability of the molecules to form a viscous paste after cooling. As the temperature decreases, the starch molecules associate to form a gel network, which increases the final viscosity (Fitzgerald et al., 2003). The final viscosity value allows determining possible applications of the flours, determining the functionality when added to products that are subjected to thermal treatments such as cooking, pasteurization, extrusion, baking, etc.
Breakdown values obtained ranged from 0.012 to 0.1 Pa·s, while Setback values ranged from 0.016 to 0.076 Pa·s. Breakdown viscosity was higher in the Titicaca cultivar and lower in Puno. Where, the breakdown viscosity is the difference between the maximum and minimum viscosity, and the Setback viscosity is the difference between the final viscosity and the Trough viscosity. The results observed in Table 1 showed a tendency of a high viscosity profile in the Pasankalla and Titicaca cultivars with a greater (p < 0.05) tendency to retrograde (Setback higher) than the other cultivars analyzed.
The analysis of pasting properties is of importance in the food industry as it has a close relationship with other properties such as the texture of cooked products. For example, low viscosity peaks and a positive setback have been associated with a harder texture, while high PV values, low breakdown and setback values have been associated with a sticky texture in cooked rice (Limpisut and Jindal, 2002). Likewise, studies on cooked quinoa samples reported negative correlations between texture parameters (hardness, cohesiveness, gumminess and chewiness) and setback or breakdown (Wu et al., 2014). Moreover, Wu et al. (2017) reported Breakdown values in different analyses performed on starch of quinoa varieties between 0.144 and 1.428 Pa·s and for Setback between 0.636 and 1.68 Pa·s, which are above those reported in this work. The differences found are due to the fact that quinoa flour contains other molecules such as lipids and proteins and fiber that influence the viscosity values. On the other hand, differences in protein structures help explain the differences in rheological properties studied (Table 1), but would also have an effect on functional properties mainly in their ability to form gels, foams or emulsions (Sánchez-Mendoza et al., 2017).
Functional group analysis through FTIR
During the analysis of the FTIR spectra, it was possible to observe signals typical of flour components such as amylopectin and amylose, which are related to the crystalline and amorphous states. In addition, the process of deconvolution of the spectrum or of a specific region made it possible to obtain specific information on the structural organization of the flours analyzed. Figure 3A shows the spectra obtained from the FTIR study of the flours of the Puno and Soracá cultivars in the regions analyzed. Figures 3B,C presents the spectra after deconvolution of the peaks in the region of the secondary structures of the proteins. It was observed that for starch content (amylose and amylopectin), between the bands of 800 and 1,200 cm−1, and for protein content, in the range of 1,600 and 1,710 cm−1, the spectra presented similar patterns, with some differences attributed to the composition of each cultivar. The spectroscopic analysis of the 6 cultivars on the peaks of interest is summarized in Figure 4.
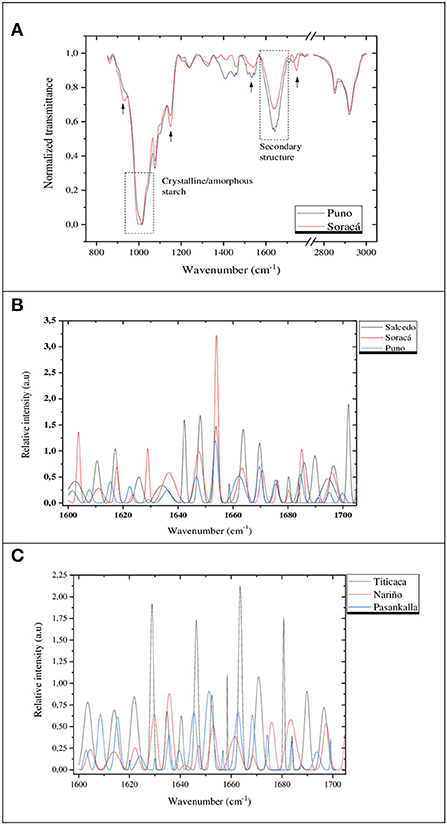
Figure 3. Examples of FTIR spectra obtained in the 800 and 3,000 cm−1 region (A) and of the deconvolution in the protein region at 1,600 and 1,710 cm−1 (B,C).
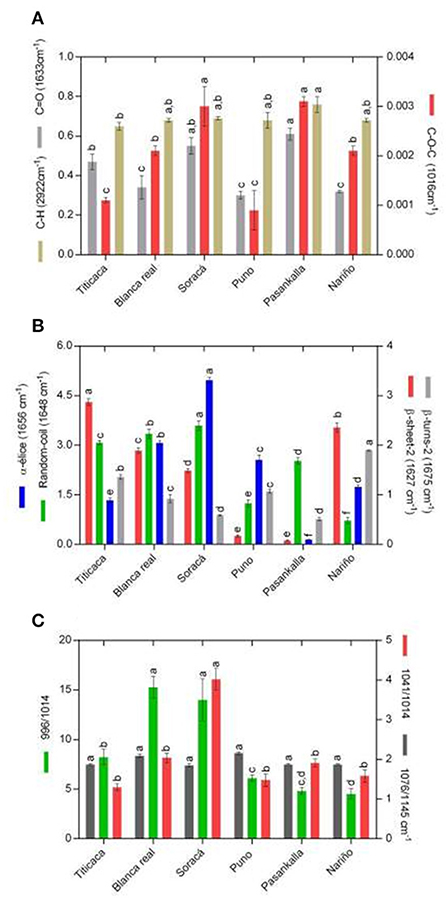
Figure 4. Summary of FTIR results of the analysis of quinoa cultivars. The average with different letters shows significant difference (p < 0.05). In (A), the results are reported with respect to the normalized intensity, while in (B,C), the results are presented with respect to the area under the curve of the peaks of interest.
Figure 4 shows the results of the infrared spectroscopy analysis of the flours of the different quinoa cultivars. Figure 4A shows the results in terms of intensity of the bands of the peaks of the regions 2,922, 1,633 and 1,016 cm−1, corresponding to the C-H, C=O, C-O-C bonds, respectively, for the quinoa cultivars analyzed. The analysis of these specific bands have been used for their association with lipid (Rodrigues et al., 2019), protein (Barth, 2007) and carbohydrate (Mukrimin et al., 2019) contents, respectively. In this regard, it can be said that with respect to the 2,922 cm−1 band, a proportional relationship was found with the results obtained in the proximal analysis (Figure 1), since the Puno, Pasankalla and Blanca real cultivars were those with the highest intensity of the peaks in this band. Likewise, in the case of proteins, it was found that the Pasankalla, Soraca and Titicaca cultivars were those with the highest peak intensity in the 1,633 cm−1 band, which is also in agreement with what was observed in Figure 1. Finally, as for the 1,016 cm−1 band, the intensity relationship did not have a direct relationship with the carbohydrate content of the proximal analysis, possibly due to interferences in this region.
On the other hand, the deconvolution process of the peaks in the region of 1,600 and 1,710 cm−1 (Yang et al., 2015), allowed finding structural information of the proteins, such as their secondary structures. Also, the deconvolution in the 1,016 cm−1 band (Roa Acosta et al., 2020) allowed to relate the crystallinity and amorphicity of the starch granules. This is important to know about the functionality of the flours, which depends not only on the concentration of proteins and starches, but also on their conformation or molecular organization. The amide I region has been determined between 1,600 and 1,700 cm−1. This region is characterized as the spectral region most sensitive to the secondary structures of the protein, and the vibrations mostly correspond to the vibration and stretching of the peptide bonds C=O (Sadat and Joye, 2020). Deconvolution analysis allowed the identification of structures such as β-sheet (1,624–1,642 cm−1), Random Coil (1,645–1,648 cm−1), α-helix (1,653–1,656 cm−1) and β-turns (1,667–1,694 cm−1). Figure 4B summarizes the areas of the bands associated with these protein structures. All cultivars showed variability in peak area in each of the secondary structures. In the flours from the Titicaca and Nariño cultivars, β -sheet 2 (1,627 cm−1) and β -turns 2 (1,675 cm−1) structures stand out, respectively, in Soracá and Puno, α-helix type structures (1,656 cm−1), while in Blanca real and Pasankalla Random Coil structures (1,648 cm−1). The significant differences (p < 0.05) found in the intensity of the peaks of each protein structure are associated with cultivar differences, but also with the effect of the production area, soil and climatic conditions and/or agronomic practices (Wang et al., 2020). It is important to highlight that the differences in secondary structures could be used as a cultivar-specific fingerprint for quality control processes, flour adulteration and even identification of genetic variability (Zeng et al., 2011). Moreover, differences in secondary structure affect the functionality of the protein. Figure 4C summarizes the intensity of the peaks in the regions associated with the starch molecules (between 800 cm−1 and 1,300 cm−1). In infrared spectroscopy analysis, the 1,076 and 1,145 cm−1 bands have been used to analyze specific carbohydrate vibrations (Wiercigroch et al., 2017). It was found that among the cultivars evaluated, there were significant differences (p < 0.05) in the intensities of these two bands (1,076 and 1,145 cm−1). In addition, a higher intensity was found in the cultivars Titicaca Soracá, Pasankalla and Nariño.
Infrared spectroscopy has been a technique used to study changes in protein structures. For example, Bock and Damodaran (2013) used it to determine changes in gluten secondary structure in model doughs added with wheat bran. Changes in protein structures can be influenced by moisture content, causing an alteration in the water-solute interaction (Marti et al., 2016). Whereas, heat treatment alters the conformation of the protein-starch structure. In starch, the crystalline/amorphous ratio is modified by the gelatinization process, while β-turns structures can collapse to form β-sheet structures within proteins. Hydrothermal treatment causes depolymerization of the starch granule, releasing low molecular weight amylopectin and amylose. Likewise, partial denaturation of the protein and changes in the secondary structures also occur in this process. Therefore, it is possible that during the cooling of the dispersions, protein-protein and polysaccharide-protein interactions with water are formed. All these phenomena help to explain the differences found in the consistency and fluidity indices of the quinoa flours before and after the heating process (Figure 2). It is also important to note that the differences in secondary structures could facilitate the use of these flours in baking, since an increase in β-sheet content and a decrease in β-turn (β-spiral) content could contribute with the poor quality of the bread. Gluten exists predominantly in β-sheet structures in flour doughs, and the relative amount of the secondary structures follows the order β-sheet > unordered > β-turn > α-helix (Bock and Damodaran, 2013). In the Figure 4B, the cultivar with the best protein distribution to be used in the formation of dough is Titicaca. However, it is possible that their tendency to retrograde is greater compared to flours from other cultivars as observed in Table 1, in the setback value and in Figure 4C for the ratio 1,041/1,014 cm−1.
In the cluster analysis, four hierarchical groups were established (Figure 5A). The analysis was done using a divisive technique, resulting in a top-down clustering, where all samples were born from the same group and then branched. In addition, a distance analysis was performed using the Manhattan metric and a Ward criterion, which grouped the quinoa cultivars into 4 clusters. The first group (red) consisted of two quinoa cultivars with high carbohydrate content, low protein content and low values of peak viscosity, breakdown, and setback (pasting properties). The second group (green) is made up of two cultivars of productive importance in the central region of Colombia, which were characterized by intermediate values of rheological and physicochemical properties. The third group consisted of the cultivar Pasankalla, and presents the highest values of final viscosity, setback and trough viscosity. Finally, the last group was constituted by the Titicaca cultivar, which was characterized by a high protein content and a low lipid content.
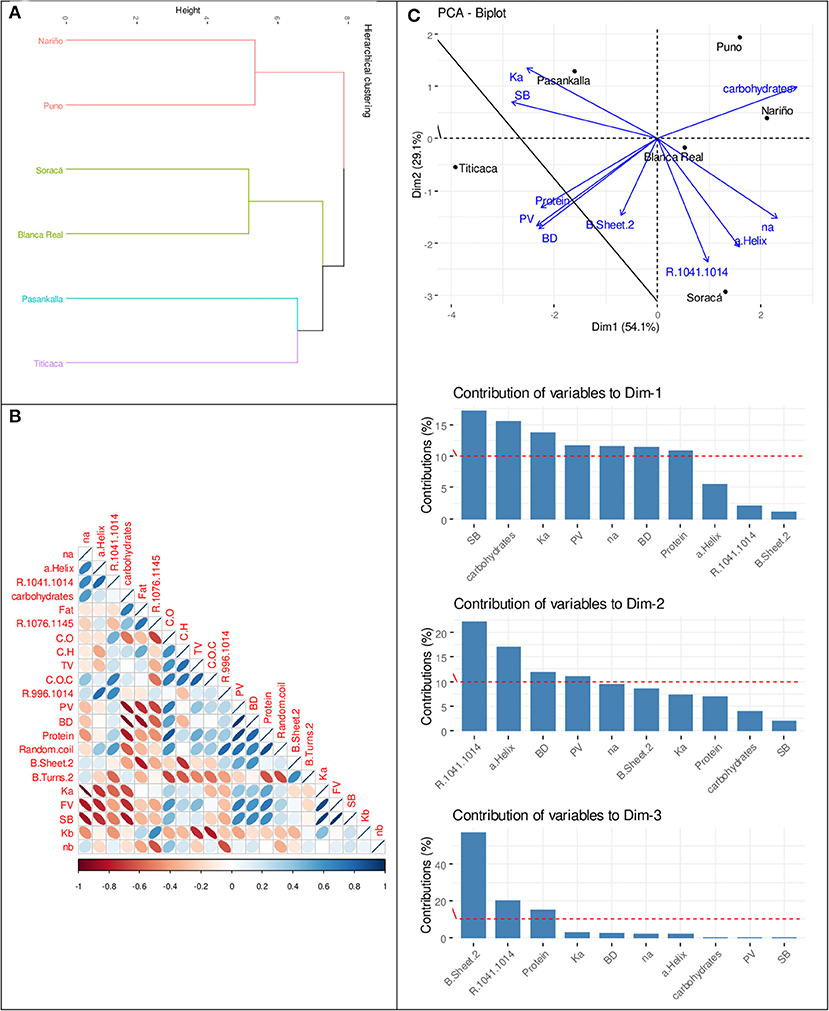
Figure 5. Hierarchical cluster analysis of the evaluated quinoa functional properties (A). Spearman correlation analysis between physicochemical, rheological and structural variables (B). Principal components analysis PCA of the physicochemical, rheological and structural variables (C). In (B), C.O is C=O; C.H is C-H; C.O.C is C-O-C; R.996.1012 is 996/1,014 cm−1 ratio; R.1076.1145 is 1,076/1,145 cm−1 ratio; PV is Peak viscosity; TV is Trough viscosity; BD is Breakdown viscosity; SB is Setback viscosity; Ka and na are Consistency index and flow index after heating, respectively; Kb and nb are consistency index and Flow index before heating respectively.
Spearman correlation analysis (Figure 5B), showed that there were significant positive correlations between flow and pasting properties, mainly between Ka and SB (r = 0.93), and between Ka and FV (r = 0.88). A negative correlation between Ka and na (r = −0.97) is also highlighted. In addition, a significantly positive correlation was found between protein content and PV (r = 0.89) and between protein and BD (r = 0.78), which is associated with the functional properties of quinoa flour.
To evaluate the differences between the flours of the quinoa cultivars and identify the most significant variables, a PCA was performed (Figure 5C). The PCA grouped the different cultivars in the four quarters in a similar way to the grouping of the hierarchical analysis, showing common characteristics among some cultivars, as discussed above. The cumulative variance explained by the first three dimensions of the model was 95.1%. In Figure 5C, viscosity parameters (SB, PV, Ka, na) and carbohydrates content mainly affected the dimension 1 (Dim 1). It is noteworthy that the high carbohydrate content, as well as the low percentage of protein, grouped the Puno and Nariño cultivars together, differentiating them from the others. Furthermore, the ratio 1,041/1,014 cm−1 and the α-helix protein structure presented a high contribution to dimension 2 (Dim 2). The ratio 1,041/1,014 cm−1 has been used to relate the molecular organization of the starch granule, represented by its crystalline and amorphous fraction, associated with amylopectin and amylose, respectively. The β-sheet structures showed the highest contribution to dimension 3 (Dim 3). These structures could be associated with the functionality of the flours of the different quinoa cultivars. For example, the Titicaca cultivar, due to its high presence of β-sheet structures, could generate more elastic mechanical properties in applications such as baked goods. While the Soracá cultivar, due to its high content of α-helix structures, would present a more rigid mechanical behavior which would be more appropriate for biscuit applications.
Conclusion
The study of flours from six quinoa cultivars provided information on their chemical composition, rheological properties and protein structure. It was concluded that in terms of protein content, the Titicaca and Pasankalla cultivars have the highest potential, while in terms of lipid content, the Puno, Pasankalla and Blanca Real cultivars have the highest potential.
The sequential rheological analysis of flow pasting flow showed that a process of cooking or heating of the dispersions can modify the type of flow, decreasing their dilatant behavior, even changing from dilatant to Newtonian (depending on the cultivar). These properties allow inferring about the possible applications of quinoa flour, for example, to be used as a nutritional contributor or a viscosity modifier in the formulation of different types of nutritional beverages.
The FTIR analysis allowed us to determine the structural characteristics of each cultivar and, at the same time, to determine certain functionality to be used in food applications such as the formulation of beverages or bakery products, thus generating a good contribution to the knowledge of food processors with nutritional or functional properties.
Data availability statement
The data that support the findings of this study are available from the corresponding author upon reasonable request.
Author contributions
MG-P: experimental develop and data analysis. MP-M: experimental, methodology develop, and data analysis. JN: application of statistical, math methods, and writing and reviewing. LA-L: methodology, data analysis, writing, reviewing, and edition. DR-A: conceptualization, study propose, supervision, and manuscript reviewer. All authors contributed to the article and approved the submitted version.
Funding
The authors acknowledge the support from Project Quinoa (SGR) BPIN 2020000100052 and ID code 5637, Universidad del Cauca, and Universidad del Quindío for their technical and financial support.
Conflict of interest
The authors declare that the research was conducted in the absence of any commercial or financial relationships that could be construed as a potential conflict of interest.
Publisher's note
All claims expressed in this article are solely those of the authors and do not necessarily represent those of their affiliated organizations, or those of the publisher, the editors and the reviewers. Any product that may be evaluated in this article, or claim that may be made by its manufacturer, is not guaranteed or endorsed by the publisher.
References
Alrosan, M., Tan, T. C., Mat Easa, A., Gammoh, S., and Alu'datt, M. H. (2022). Recent updates on lentil and quinoa protein-based dairy protein alternatives: nutrition, technologies, and challenges. Food Chemi. 383, 132386. doi: 10.1016/j.foodchem.2022.132386
AOAC (2000). Official Methods of Analysis of AOAC International, 17th ed. Association of Official Analytical Chemists, Washington DC, USA.
Barth, A. (2007). Infrared spectroscopy of proteins. Biochim. Biophys. Acta. 1767, 1073–1101. doi: 10.1016/j.bbabio.2007.06.004
Bazile, D., Jacobsen, S. E., and Verniau, A. (2016). The global expansion of quinoa: trends and limits. Front. Plant Sci. 7, 622. doi: 10.3389/fpls.2016.00622
Bhargava, A., Shukla, S., and Ohri, D. (2006). Chenopodium quinoa—an Indian perspective. Ind. Crops Prod. 23, 73–87. doi: 10.1016/j.indcrop.2005.04.002
Bock, J. E., and Damodaran, S. (2013). Bran-induced changes in water structure and gluten conformation in model gluten dough studied by fourier transform infrared spectroscopy. Food Hydrocoll. 31, 146–155. doi: 10.1016/j.foodhyd.2012.10.014
Bozdogan, N., Kumcuoglu, S., and Tavman, S. (2019). Investigation of the effects of using quinoa flour on gluten-free cake batters and cake properties. J. Food Sci. Technol. 6, 683–694. doi: 10.1007/s13197-018-3523-1
Christianson, D., and Bagley, E. (1984). Yield Stresses in Dispersions of Swollen, Deformable Cornstarch Granules - PubAg. Available online at: https://pubag.nal.usda.gov/catalog/25470 (accessed July 9, 2022).
Correia Bento, J. A., Morais, D. K., Siqueira de Berse, R., Zaczuk Bassinello, P., Caliari, M., and Soares Júnior, M. S. (2022). Functional, thermal, and pasting properties of cooked carioca bean (Phaseolus vulgaris L.) flours. ScienceDirect. doi: 10.1016/j.afres.2021.100027
Fitzgerald, M. A., Martin, M., Ward, R. M., Park, W. D., and Shead, H. J. (2003). Viscosity of rice flour: a rheological and biological study. J. Agricu. Food Chem. 51, 2295–2299. doi: 10.1021/jf020574i
Jaikishun, S., Li, W., Yang, Z., and Song, S. (2019). Quinoa: in perspective of global challenges. Agronomy 9, 176. doi: 10.3390/agronomy9040176
Li, G., and Zhu, F. (2018). Quinoa starch: Structure, properties, and applications. Carbohydr. Polym. 181, 851–861. doi: 10.1016/j.carbpol.2017.11.067
Limpisut, P., and Jindal, V. K. (2002). Comparison of rice flour pasting properties using Brabender Viscoamylograph and rapid visco analyser for evaluating cooked rice texture. Starch/Staerke, 54, 350–357. doi: 10.1002/1521-379X(200208)54:8<350::AID-STAR350>3.0.CO;2-R
Marti, A., Bock, J. E., Pagani, M. A., Ismail, B., and Seetharaman, K. (2016). Structural characterization of proteins in wheat flour doughs enriched with intermediate wheatgrass (Thinopyrum intermedium) flour. Food Chem. 194, 994–1002. doi: 10.1016/j.foodchem.2015.08.082
Mufari, J. R., Gorostegui, H. A., Miranda-Villa, P. P., Bergesse, A. E., and Calandri, E. L. (2020). Oxidative stability and characterization of quinoa oil extracted from wholemeal and germ flours. J. Am. Oil Chem. Soc. 97, 57–66. doi: 10.1002/aocs.12308
Mukrimin, M., Conrad, A. O., Kovalchuk, A., Julkunen-Tiitto, R., Bonello, P., and Asiegbu, F. O. (2019). Fourier-transform infrared (FT-IR) spectroscopy analysis discriminates asymptomatic and symptomatic norway spruce trees. Plant Sci. 289, 110247. doi: 10.1016/j.plantsci.2019.110247
Nieto-Calvache, J. E., Gerschenson, L. N., and de Escalada Pla, M. F. (2020). Papaya by-products for providing stability and antioxidant activity to oil in water emulsions. J. Food Sci. Technol. 58, 1693–1702. doi: 10.1007/s13197-020-04679-w
Nowak, V., Du, J., and Charrondière, U. R. (2016). Assessment of the nutritional composition of quinoa (Chenopodium quinoa Willd.). Food Chem. 193, 47–54. doi: 10.1016/j.foodchem.2015.02.111
Ortiz Gómez, V., Nieto Calvache, J. E., Roa Acosta, D. F., Solanilla Duque, J. F., and Bravo Gómez, J. E. (2022). Preliminary characterization of structural and rheological behavior of the quinoa hyperprotein-defatted flour. Front. Sustain. Food Syst. 6, 1–9. doi: 10.3389/fsufs.2022.852332
Pellegrini, M., Lucas-Gonzales, R., Ricci, A., Fontecha, J., Fernández-López, J., Pérez-Álvarez, J. A., et al. (2018). Chemical, fatty acid, polyphenolic profile, techno-functional and antioxidant properties of flours obtained from quinoa (Chenopodium quinoa Willd) seeds. Ind. Crops Prod. 111, 38–46. doi: 10.1016/j.indcrop.2017.10.006
Pereira, E., Encina-Zelada, C., Barros, L., Gonzales-Barron, U., Cadavez, V., and C. F. R. (2019). Chemical and nutritional characterization of Chenopodium quinoa Willd (quinoa) grains: a good alternative to nutritious food. Food Chem. 280, 110–114. doi: 10.1016/j.foodchem.2018.12.068
Polo María, P., Roa Diego, F., and Bravo Jesús, E. (2021). Propiedades reológicas de quinua (Chenopodium quinoa Wild) obtenidas mediante molienda abrasiva y tratamiento térmico. Información tecnológica, 32, 53–64. doi: 10.4067/S0718-07642021000600053
Pulvento, C., Riccardi, M., Lavini, A., Iafelice, G., Marconi, E., and D'Andria, R. (2012). Yield and quality characteristics of quinoa grown in open field under different saline and non-saline irrigation regimes. J. Agron Crop Sci. 198, 254–263. doi: 10.1111/j.1439-037X.2012.00509.x
Raphaelides, S. N., and Georgiadis, N. (2006). Effect of fatty acids on the rheological behaviour of maize starch dispersions during heating. Carbohydr. Polym. 65, 81–92. doi: 10.1016/j.carbpol.2005.12.028
Roa Acosta, D. F., Solanilla Duque, J. F., Agudelo Laverde, L. M., Villada Castillo, H. S., and Tolaba, M. P. (2020). Structural and thermal properties of the amaranth starch granule obtained by high-impact wet milling. Int. J. Food Eng. 16, 2020–0024. doi: 10.1515/ijfe-2020-0024
Roa-Acosta, D. F., Bravo-Gómez, J. E., García-Parra, M. A., Rodríguez-Herrera, R., and Solanilla-Duque, J. F. (2020). Hyper-protein quinoa flour (Chenopodium Quinoa Wild): Monitoring and study of structural and rheological properties. LWT 121, 108952. doi: 10.1016/j.lwt.2019.108952
Rodrigues, L. M., Magrini Alva, T. D., da Silva Martinho, H., and Almeida, J. D. (2019). Analysis of saliva composition in patients with burning mouth syndrome (BMS) by FTIR spectroscopy. Vib. Spectrosc. 100, 195–201. doi: 10.1016/j.vibspec.2018.12.002
Ruiz, K. B., Biondi, S., Martínez, E. A., Orsini, F., Antognoni, F., and Jacobsen, S. E. (2015). Quinoa – a model crop for understanding salt-tolerance mechanisms in halophytes. Plant Biosyst. 150, 357–371. doi: 10.1080/11263504.2015.1027317
Sadat, A., and Joye, I. J. (2020). Peak fitting applied to fourier transform infrared and raman spectroscopic analysis of proteins. Appl. Sci. 2020, 10,5918. doi: 10.3390/app10175918
Sánchez-Mendoza, N. A., Ruiz-Ruiz, J. C., Dávila-Ortiz, G., and Jiménez-Martínez, C. (2017). Propiedades tecnofuncionales y biológicas de harina, aislado y fracciones proteicas mayoritarias de semillas de Inga paterno. J. Food 15, 400–408. doi: 10.1080/19476337.2017.1286522
Sohaimy, S. A., El Mohamed, S. E., Shehata, M. G., Mehany, T., and Zaitoun, M. A. (2018). Compositional analysis and functional characteristics of quinoa flour. Ann. Res. Rev. Biol. 22, 1–11. doi: 10.9734/ARRB/2018/38435
Tiga, B. H., Kumcuoglu, S., Vatansever, M., and Tavman, S. (2021). Thermal and pasting properties of Quinoa—Wheat flour blends and their effects on production of extruded instant noodles. J. Cereal Sci. 97, 103120. doi: 10.1016/j.jcs.2020.103120
Wang, S., Opassathavorn, A., and Zhu, F. (2015). Influence of quinoa flour on quality characteristics of cookie, bread and chinese steamed bread. J. Texture Stud. 46, 281–292. doi: 10.1111/jtxs.12128
Wang, X., Zhao, R., and Yuan, W. (2020). Composition and secondary structure of proteins isolated from six different quinoa varieties from China. J. Cereal Sci. 95, 103036. doi: 10.1016/j.jcs.2020.103036
Wiercigroch, E., Szafraniec, E., Czamara, K., Pacia, M. Z., Majzner, K., Kochan, K., et al. (2017). Raman and infrared spectroscopy of carbohydrates: a review. Spectrochimica Acta Part A. 185, 317–335. doi: 10.1016/j.saa.2017.05.045
Wu, G., Morris, C. F., and Murphy, K. M. (2014). Evaluation of texture differences among varieties of cooked Quinoa. J. Food Sci. 79, S2337–S2345. doi: 10.1111/1750-3841.12672
Wu, G., Morris, C. F., and Murphy, K. M. (2017). Quinoa starch characteristics and their correlations with the texture profile analysis (TPA) of cooked quinoa. J. Food Sci. 82, 2387–2395. doi: 10.1111/1750-3841.13848
Yang, H., Yang, S., Kong, J., Dong, A., and Yu, S. (2015). Obtaining information about protein secondary structures in aqueous solution using Fourier transform IR spectroscopy. Nat. Protocol. 10, 382–396. doi: 10.1038/nprot.2015.024
Keywords: cultivar, Chenopodium quinoa Willd, proximal analysis, flow index, pasting, FTIR
Citation: García-Parra M, Polo-Muñoz MP, Nieto Calvache JE, Agudelo-Laverde LM and Roa-Acosta DF (2022) Physicochemical, rheological and structural properties of flours from six quinoa cultivars grown in Colombia. Front. Sustain. Food Syst. 6:936962. doi: 10.3389/fsufs.2022.936962
Received: 05 May 2022; Accepted: 04 July 2022;
Published: 22 July 2022.
Edited by:
José Antonio Teixeira, University of Minho, PortugalReviewed by:
Sapna Langyan, National Bureau of Plant Genetic Resources (ICAR), IndiaLochan Singh, National Institute of Food Technology Entrepreneurship and Management, India
Copyright © 2022 García-Parra, Polo-Muñoz, Nieto Calvache, Agudelo-Laverde and Roa-Acosta. This is an open-access article distributed under the terms of the Creative Commons Attribution License (CC BY). The use, distribution or reproduction in other forums is permitted, provided the original author(s) and the copyright owner(s) are credited and that the original publication in this journal is cited, in accordance with accepted academic practice. No use, distribution or reproduction is permitted which does not comply with these terms.
*Correspondence: Lina Marcela Agudelo-Laverde, bG1hZ3VkZWxvQHVuaXF1aW5kaW8uZWR1LmNv