 Fabiellen Cristina Pereira
 Pablo Gregorini
95% of researchers rate our articles as excellent or good
Learn more about the work of our research integrity team to safeguard the quality of each article we publish.
Find out more
ORIGINAL RESEARCH article
Front. Sustain. Food Syst. , 22 September 2022
Sec. Agroecology and Ecosystem Services
Volume 6 - 2022 | https://doi.org/10.3389/fsufs.2022.927568
This article is part of the Research Topic Livestock Production and the Functioning of Agricultural Ecosystems, Volume II View all 7 articles
Grasslands are heterogeneous landscapes composed of a diversity of herbaceous and shrub vegetation that varies not only taxonomically, but biochemically in terms of primary and secondary compounds. Plant Secondary Compounds (PSC) have specific nutritional, medicinal, and prophylactic properties, to which benefits depend upon dosage, type, arrangements, and concentration that changes between and within plants across time and space. The knowledge of the plant content of PSC and their distribution in grazing environments would therefore contribute to the design and creation of healthier foodscapes for ruminants; in other words, healthscapes. Geographic information systems (GIS) have been used extensively for landscape visualization and assessment, through several spatial analysis techniques applied for the creation of virtual maps to add valuable information to a particular environment. Given the knowledge of plants and their composition, GIS emerges as a readily available and low-cost tool to assess and evaluate the distribution of plants with beneficial PSC in large and heterogeneous foodscapes. We present and propose for the very first time, the application and use of GIS to determine the spatial distribution of PSC rich plants with nutraceutical properties to illustrate, visualize, and generate healthscapes for grazing ruminants. We present healthscape maps created using botanical composition analyses and advanced image classification methods to illustrate the distribution of plants regarding their PSC and nutraceutical properties. Such maps add an extra dimension and perspective to plant chemical composition, enabling graziers to visualize in space and time centers of nutrition and prophylactics or medicines, contributing to advanced grazing management decisions toward more productive, sustainable, and healthy grazing systems. The valuable information behind the mapped PSC advances the understanding of the nutritional ecology of grazing environments and foodscapes, introducing a new dimension to the holistic management of pastoral livestock production systems.
Grassland ecosystems are heterogeneous landscapes dominated by herbaceous and shrub vegetation (White et al., 2000). This heterogeneity is not only taxonomic in distinct types of grasses, forbs, shrubs, and trees, but also implicitly distinct in phytochemistry (Torres-Fajardo et al., 2020). The implicit biochemical diversity of taxonomically rich grasslands presents different biochemical structures not only in plant primary metabolites (protein, polysaccharides, minerals, vitamins, and fatty acids) but also in diverse secondary metabolites called plant secondary compounds (PSC), from which benefits for animals, humans, and the environment are multiple (nutritional, medicinal, and prophylactic).
The synthesis of plant secondary compounds (PSC) depends on the interaction between the plant and the different environmental conditions to assure its survival and protect it against biotic and abiotic stress (Pott et al., 2019), including adaptive strategies to repeal, survive, and coevolve with herbivores (Freeland and Janzen, 1974). Plant secondary compounds are specialized chemicals that fulfill plant growth and development demands and attributes of organoleptic characteristics of aroma, taste, and color (Pott et al., 2019). Although the range and dynamic of PSC production is still unknown (Dixon and Strack, 2003; Pichersky and Lewinsohn, 2011; Tedeschi et al., 2021), the nutraceutical and pharmaceutical characteristics positively affecting animal health, growth, and productivity have been extensively researched (Olagaray and Bradford, 2019; Barry et al., 2021; Tedeschi et al., 2021). Some PSCs such as vitamin E, caffeic acid, and ferulic acid have antioxidant and anti-inflammatory capacities (Chauhan et al., 2014; Zduńska et al., 2018; Tajner-Czopek et al., 2020); thus, reducing oxidative and physiological stress of animals (Beck and Gregorini, 2020). Other plants such as Plantago lanceolata, Tagetes filifolia, Taraxacum officinale, Malva neglecta, Cirsium vulgare, and fruits such as apples and grapes contain PSC (e.g., phenols and flavonoids) acting as anthelmintics, antibacterial, antifungal, antiviral, as well as having anticancer properties (Villalba et al., 2014; Díaz et al., 2017; Ganeshpurkar and Saluja, 2017; Sabudak et al., 2017; Al-Snafi, 2019; Reddy et al., 2020). Moreover, antimicrobial properties of some PSC (e.g., tannins and saponins commonly found in legumes such as Desmanthus species, Desmodium paniculatumm, and Medicago sativa) help reduce rumen methanogenesis and in the case of tannins, N excretion in the urine (Goel et al., 2008; Naumann et al., 2015; Vandermeulen et al., 2018; Lagrange et al., 2021). The latter has contributed to the reduction of negative environmental impacts by ruminants (Jayanegara et al., 2012; Peyraud and Delagarde, 2013).
Depending upon the dosage, type, and concentration, some PSC may be toxic and elicit anti-nutritional effects for animal intake (Freeland and Janzen, 1974; Villalba et al., 2017). However, upon learning, ruminants remember and avoid toxins and toxic effects by selecting parts of the plants that do not contain large amounts of these chemicals (Freeland and Janzen, 1974) or selecting specific PSC with pharmaceuticals and prophylactic traits at self-regulated safe levels of intake to self-counteract toxins (Villalba et al., 2006; Torregrossa and Dearing, 2009). On the other hand, ruminants positively search for and select plants and parts of plants to prevent and medicate illness (Provenza, 1996; Villalba and Provenza, 2007). That being the case, ruminants can modulate their diets according to their requirements considering the options of choices they are offered (Raubenheimer and Simpson, 2009).
In a grazing context, knowing the spatial distribution of plants PSC in advance would facilitate grazing management decisions and the diet choice of locally adapted ruminants. Geographic information systems (GIS) have been used extensively for landscape visualization, assessment, and spatial evaluation of agricultural lands over time (Das et al., 2020). Using GIS and spatial analysis techniques, this study presents, for the very first time, a spatio-chemical analysis methodology that consultants and/or scientists could use to determine and illustrate the spatial distribution of particular PSC with nutraceutical, medicinal, and prophylactic properties in grazing lands, with the goal of creating spatial healthscape maps that would enable grazers to add an extra dimension to pastoral livestock production systems.
The spatio-chemical analysis methodology proposed here involves multiple steps: (1) botanical survey, (2) plant primary and PSC assessment, (3) remote sensing data collection, and (4) spatial analysis (Figure 1).
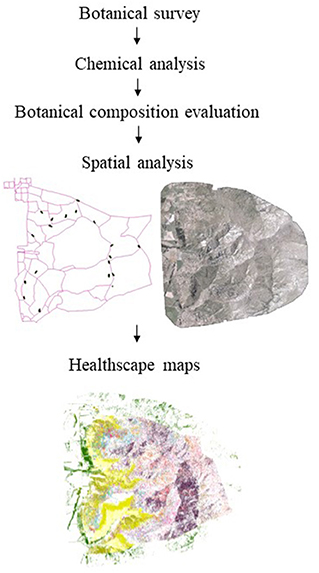
Figure 1. Spatio-chemical analysis methodology chart to create healthscape maps: (1) Botanical survey to select plants for further chemical analysis; (2) botanical composition in the case-study area to georeference the location of plants; (3) spatial analysis performed over the (Red, Green, Blue, NIR) multispectral imagery of the study area, based on the sampling points and results of the botanical composition, and (4) healthscape representative maps.
To illustrate the approach and dynamics of creating spatial healthscape maps, we used as a case study the Lincoln University Mount Grand Station (LUMGS) high-country station. The station is located close to Lake Hawea in Central Otago, South Island (lat 44°38′01.93"S; long 169°19′42.89"E), New Zealand (Figure 2) and encompasses a total area of 2,131 ha, of which 93% is a steep hill country. From the total area, 1,602 ha are used as a pastoral system, while the remainder is under a conservation area of the New Zealand Department of Conservation. The annual rainfall averages 703 mm and the annual mean temperature is 10.6°C (Maxwell et al., 2016).
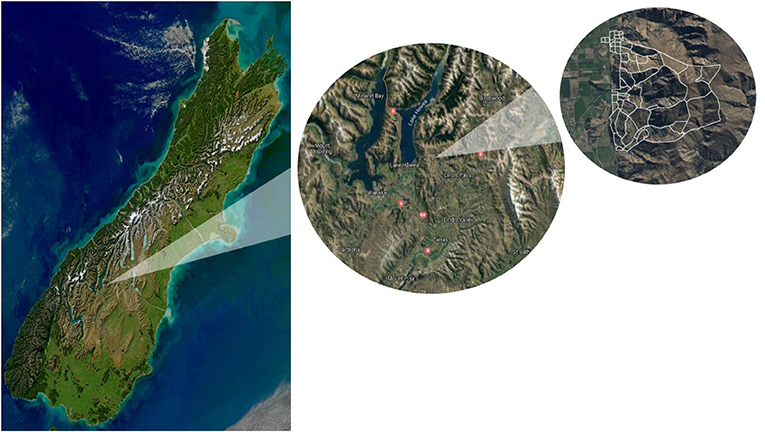
Figure 2. The geographic location of Lincoln University Mount Grand Station (LUMGS), latitude 44°38′01.93"S; longitude 169°19′42.89"E, and paddocks boundary. From left to right: The South Island of New Zealand, Lake Hawea in Central Otago, and the paddocks boundary of the station.
The database used in this study was a detailed list provided by Duncan et al. (1997), of plant species found at LUMGS. The list was used for the identification and phytochemical description of plants in LUMGS with nutraceutical, prophylactic, and medicinal potential. In addition to such a database, and as suggested by Torres-Fajardo et al. (2020), other scientific reports, expert knowledge, New Zealand national plants online database, local knowledge, and public online databases were also considered (refer to Tables 1 and 2).
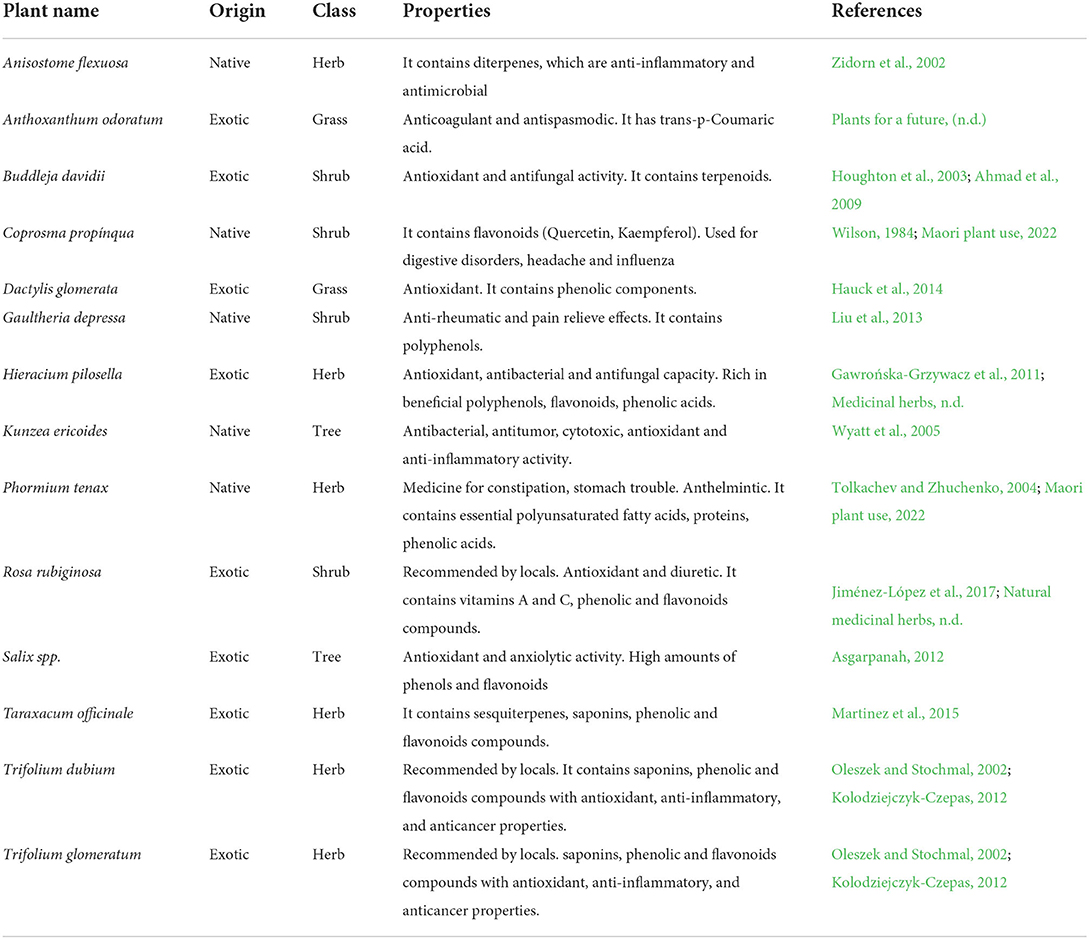
Table 1. Characteristics and properties of plant species selected for chemical analysis to illustrate a methodology to create healthscape maps, using the Lincoln University Mount Grand Station (LUMGS) high-country station as a case study.
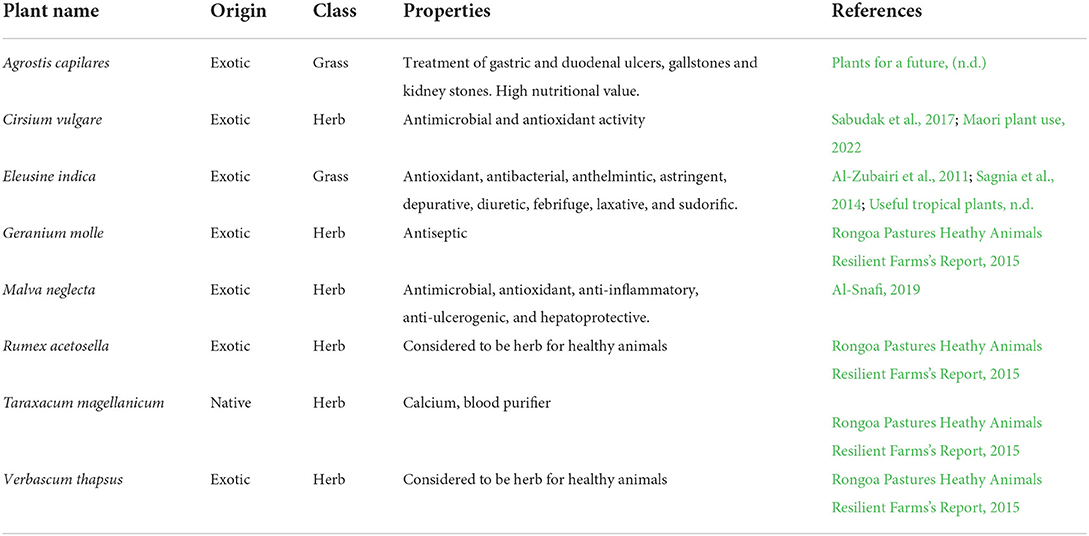
Table 2. Properties of plant species selected from the literature to illustrate a methodology to create healthscape maps, using the Lincoln University Mount Grand Station (LUMGS) high-country station as a case study.
A total of 22 plants were identified and considered as illustrative of the case study for the methodology proposed here in this study. Based on the abundance of LUMGS and spread in New Zealand high country grasslands, 11 of those 22, including grasses, herbs, shrubs, and trees (Table 1), were selected for further chemical analyses and an additional three were indicated by local experts and the station manager, due to their abundance in the area and LUMGS, and because those plants are known to have medicinal properties.
At least three subsamples of leaves and flowers (if present) of the selected plants were manually collected from different locations in the case study area, indicated by local knowledge. Subsamples were pooled together to create representative samples of each plant species at the station and immediately frozen and stored for further chemical (primary and secondary composition) analysis at Lincoln University Riddolls laboratory.
Plant samples (size ±20 g) were freeze-dried and ground through a 1 mm sieve prior to analysis. The AOAC (Cunniff, 1995) methods were used for neutral detergent fiber (NDF), acid detergent fiber (ADF), ash, and DM estimation. Crude protein (CP) was determined by using combustion under oxygen (Elemental Analyser vario MAX CN, Analysensysteme GmbH. Hanau, Germany) and weight content of water-soluble carbohydrates (WSC) was determined following the methodology described by Pollock and Jones (1979).
Plant total phenolic content (TPC), polyphenols analysis, and 2.2-diphenyl-1-picrylhydrazyl (DPPH) were determined to evaluate plant total antioxidant capacity (TAC) and polyphenols composition.
Phenolic compounds were extracted with ethanol in a similar process as described in Le et al. (2019). Freeze-dried samples were weighed (0.25 g) into centrifuge tubes and mixed with 3.0 ml of mixed solvent (50% ethanol/ 50% water). Tubes were placed in a shaking water bath for 45 min, 50°C, and then centrifuged at 4,000 g rcf for 10 min. The supernatant was collected and filtered through a 0.45 um PTFE syringe filter into 2 ml Eppendorf tubes. Eppendorf tubes for DPPH were analyzed straight away and tubes for polyphenols and TPC were stored at −20°C in dark until analysis.
The DPPH (Antioxidant Assay Kit, Dojindo molecular technologies) free radical scavenging effect was determined according to Ghagane et al. (2017), with slight modifications. Briefly, 180ul of the DPPH working solution (1.0 mg/100 ml 100% ethanol) was added to one of the 96 well plates with 20.0 ul of diluted samples (with no dilution, 10; 100; 1,000; 10,000; 100,000 times dilution) in triplicate. The plate was incubated for 30 min in the dark at 25°C and the absorbance was measured at 517 nm. The optimal dilution ratio range was determined for each sample by plotting the inhibition ratio against the dilution ratio encompassing the 50% scavenging efficiency for DPPH radicals (IC50 value).
The DPPH radical scavenging activity was expressed as the TROLOX equivalent antioxidant capacity (TEAC), calculated as:
The different phenolic compounds analyzed, expressed as milligrams of each compound per g of dried sample, were identified according to their order of elution, retention times of pure compounds and the characteristics of the UV-Vis spectra.
The analyses followed the methodology described by Gómez-Alonso et al. (2007) and were performed on an Agilent HPLC (Agilent Technologies, Inc., Santa Clara, CA, USA) with a quaternary pump and DAD and FLD detectors. After injecting 10μl of each sample, separation was performed in an EXL-1110-1546U, ACE 3 μ C18-PFP 150X4.6mm column (Advanced Chromatography Technologies, Aberdeen, Scotland) thermostated at 20°C. For DAD detection, chromatograms were recorded at 280 nm, 320 nm, 360 nm, and 520 nm, corresponding to excitation at 280 nm and emission at 320 nm in the FLD detector at a flow rate of 0.8 ml/min. Solvent gradient used for separation were: Solvent A: 0.05M NH4H2PO4, pH = 2.6 (99%, from BDH) (consume 20 ml/sample). Solvent B: 100% Acetonitrile (Lichrosolv) HPLC grade (consume 17 ml/sample). Solvent C: 0.2M H3PO4, pH = 1.5 (Analytical grade, from Ajax Finechem) (6.8 ml concentrated H3PO4 in 500 ml water) (consume 35 ml/sample).
Plants samples were methylated and extracted in n-heptane for fatty acids estimation as methyl esters (FAME) by using a gas-liquid chromatography (Shimadzu GC-2010 Gas Chromatograph (Shimadzu Corporation, Kyoto, Japan) equipped with a flame ionization detector and an AOC-20i auto sampler, following a similar method as described by Sukhija and Palmquist (1988). One microlitre of the n-heptane sample extract was injected into a 100 m GC column (250 μm x 0.25 μm capillary column), undertaken with a pure helium carrier gas, and was run for 92 min. The temperature of both injector and detector were set at 250°C and the thermal profile of the column consisted of 45°C for 4 min, followed by 27 min at 175°C. Individual FAMEs as mg per g of dried sample were identified by the peak retention time compared to internal standards.
Historical data of LUMGS vegetation cover and composition has been previously reported by Duncan et al. (1997) and was the data source used in our database. Nevertheless, due to the period elapsed since that report, botanical composition analysis was conducted during Summer (December 2020 and January 2021) to update and add detail about the vegetation cover and composition of LUMGS.
According to New Zealand National Land Cover Database (LCDB), and based on vegetation abundance, LUMGS is classified into different vegetation types, including grassland (dominated by grasses, forbs, and herbs), Manuka and/or Kanuka, exotic forest, and indigenous forest. Because the “grassland” area is the most representative part of the animal foodscapes in the station, besides the most abundant class in LUMGS, sampling for botanical composition was restricted to that area. Eighteen transects of 100 m were randomly positioned in the “grassland” areas on LUMGS, and five (1 × 1 m) quadrats were equally distributed over each transect for the visual evaluation and register of the absolute cover percentage of species present on each quadrat (Ellenberg and Mueller-Dombois, 1974).
Sampling points of the botanical composition surveys were georeferenced with a GPS (GPSMAP 76S Garmin, 3 m), indicating the location and name of plant species. Fourteen plants from our database were located during the botanical composition and georeferenced – six from the ones selected for chemical analysis (grasses, herbs, or forbs) and eight other plants from our database that were not selected for further analysis (Table 2). Although Trifolium dubiom, Trifolium glomeratum, and Phormium tenax are known to be present in LUMGS, there were not detected during the botanical composition sampling; and, therefore, were not included in the healthscape maps.
The geographic coordinates of sampling points were used to map plants over a high-resolution image at ArcGIS/Arcmap 10.7.1® software. The high-resolution base dataset was captured (flighting at 1,550 m) from LUMGS during Summer 2020 in terms of RGBN 16-bit (Red, Green, Blue, NIR) multispectral imagery at 12.5 cm of ground sampling distance. By using advanced image classification methods (machine learning and object/pixel-based classification) at ArcGIS, plant species locations were drawn as polygons over pixels values of the RGBN image to create a training dataset (signature file). By using the train support vector machine classifier tool, the training dataset was used to train a machine-learning model and create a Esri classifier definition (.ecd) file to recognize patterns over the RGBN image in terms of plant species distribution. The support vector machine-learning tool is a supervised learning method based on statistical learning theory (Vapnik, 1998). The “classify raster” tool was used to extrapolate the information from the .ecd file over the areas considered as “grassland” according to LCDB.
Healthscape maps were created following three different approaches. The first one was based on the spatial distribution of plants and the other two were based on the plant composition according to the chemical analysis.
For the first healthscape map, only the spatial distribution of plants was considered. We mapped the plants geolocated from the botanical composition, plus the vegetation classes from LCDB, where shrubs and trees from our database were located (Table 1), according to local knowledge—Coprosma propínqua, Salix spp, Buddleja davidii, Kunzea ericoides, and Rosa rubiginosa.
The other two maps were created based on the potential distribution and location of either plant phenolic compounds that have potential medicinal effects or fatty acids variety, having the spatial distribution of plants and the chemical analysis results as the approach. For the phenolic medicinal effects maps, we choose to illustrate four different medicinal effects from the PSC found in the analyzed plants according to the literature: antioxidant, antimicrobial, and anti-inflammatory. For each of those effects, plants were ranked hierarchically according to their total concentration of all compounds that show that effect. Thus, four different maps were created in ArcGIS/Arcmap 10.7.1® software to illustrate the location of plants according to the concentration of compounds that have potential medicinal effect. The same process was used for the fatty acids maps, but the plant rank was based on their total concentration of short, medium, long, or very long chain fatty acids, and saturated, monounsaturated, or polyunsaturated fatty acids.
Primary chemical composition of plants (DM, CP, NDF, ADF, Ash, and WSC) is presented in Table 3. The results indicate numerical divergencies for all the parameters analyzed. Protein was on average 13.96%, ranging from 6.80 to 26.65% for Gaultheria depressa and Salix spp., respectively. Buddleja davidii, Hieracium pilosella, Rosa rubiginosa, Salix spp., Taraxacum officinale, and Trifolium dubium had minimum values of NDF (±20.17%) and ADF (±15.10). Anthoxanthum odoratum, Dactylis glomerata and Phormium tenax had high values of NDF (±62.24%), but only Phormium tenax had a high value of ADF (44.18%). Ash ranged from 3.29% (Phormium tenax) to 14.43% (Anisostome flexuosa) and the highest values of WSC were found in Hieracium pilosella and Phormium tenax (±26.34%), while Anisostome flexuosa, Buddleja davidii, Gaultheria depressa, Kunzea ericoides, Rosa rubiginosa, Salix spp., Trifolium dubium and Trifolium glomeratum showed minimum values (±6.08%), with remaining plants (Anthoxanthum odoratum, Coprosma propínqua, Dactylis glomerata, Taraxacum officinale) showing medium values (±11.13%).
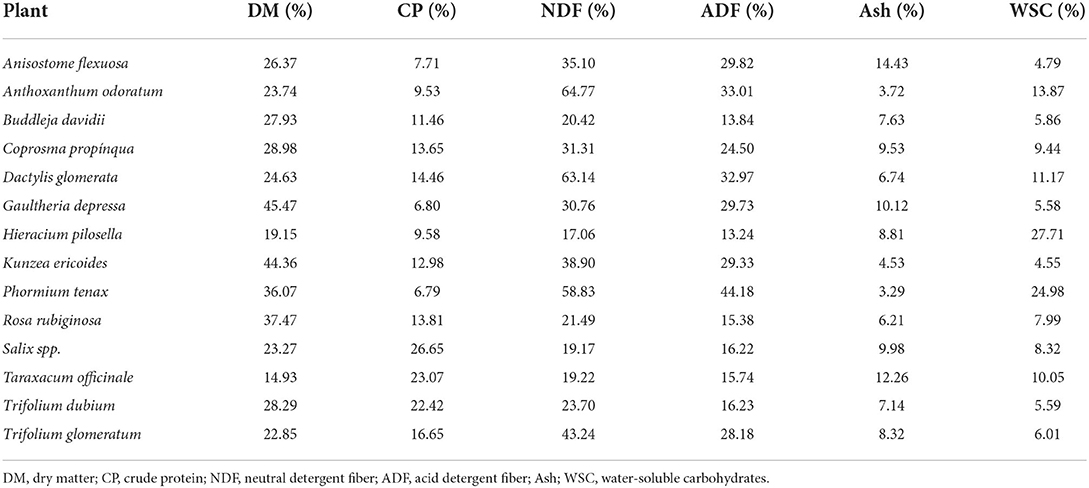
Table 3. Primary nutrients composition (% of DM) of 14 plants purposely selected in terms of phytochemical and nutraceutical composition.
Table 4 presents the DPPH activity and total polyphenols content of each of the analyzed plants. In total, 29 polyphenols compounds were found: Gallic acid, Vascalagin, Castalagin, Procyanidin B2, Hydroxybenzoric acid, Caftaric acid, Chlorogenic acid, Catechin, Cyanidin-3-glucoside, Syringic acid, Caffeic acid, Cyanidin-3-rutinoside, Epicatechin, Malvidin-3-O-glucoside, Epigallocatechin gallate, p-Coumaric acid, Ferulic, Sinapic acid, Rutin, Epicatechin gallate, Quercetin-3-glucoside, Apigenin-7-glucoside, Cinnimic acid, Resveratrol, Luteolin, Quercetin, Apigenin, Diosmetin, and Kaempferol. The number of individual compounds in each plant is available in the Supplementary Table S1.
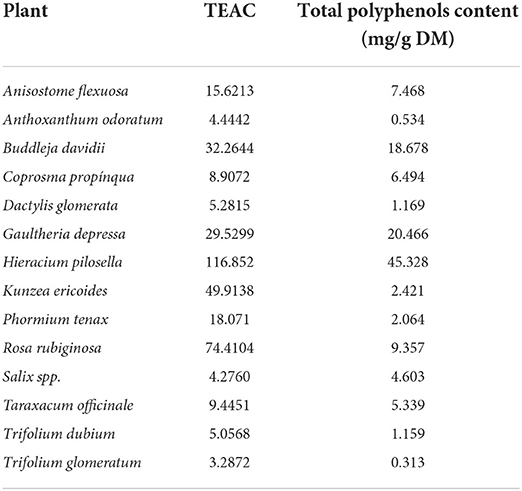
Table 4. The diphenyl-1-picrylhydrazyl radical scavenging activity, expressed as the TROLOX equivalent antioxidant capacity (TEAC), and total polyphenols content of 14 plants purposely selected in terms of phytochemical and nutraceutical composition.
Fatty acids profiles of the selected plants are presented in Table 5. All plants had a high concentration of C18:3 c9,12,15, apart from Anisostome flexuosa, which presented the highest concentration in C18:2 c9,12. No plant contained C7:0 fatty acids, while some fatty acids were found only in one or two plants. For example, C4:0 was found only in Anisostome flexuosa and Kunzea ericoide. Anisostome flexuosa was also the only plant containing C18:2 t9,12 and C20:3 c8,11,14 fatty acids, while C11:1, C12:1, C14:1 t9, and C15:0 were only found in Kunzea ericoides. Dactylis glomerata was the only plant presenting C17:0 iso fatty acid and C24:1 c15 was only found in Taraxacum officinale.
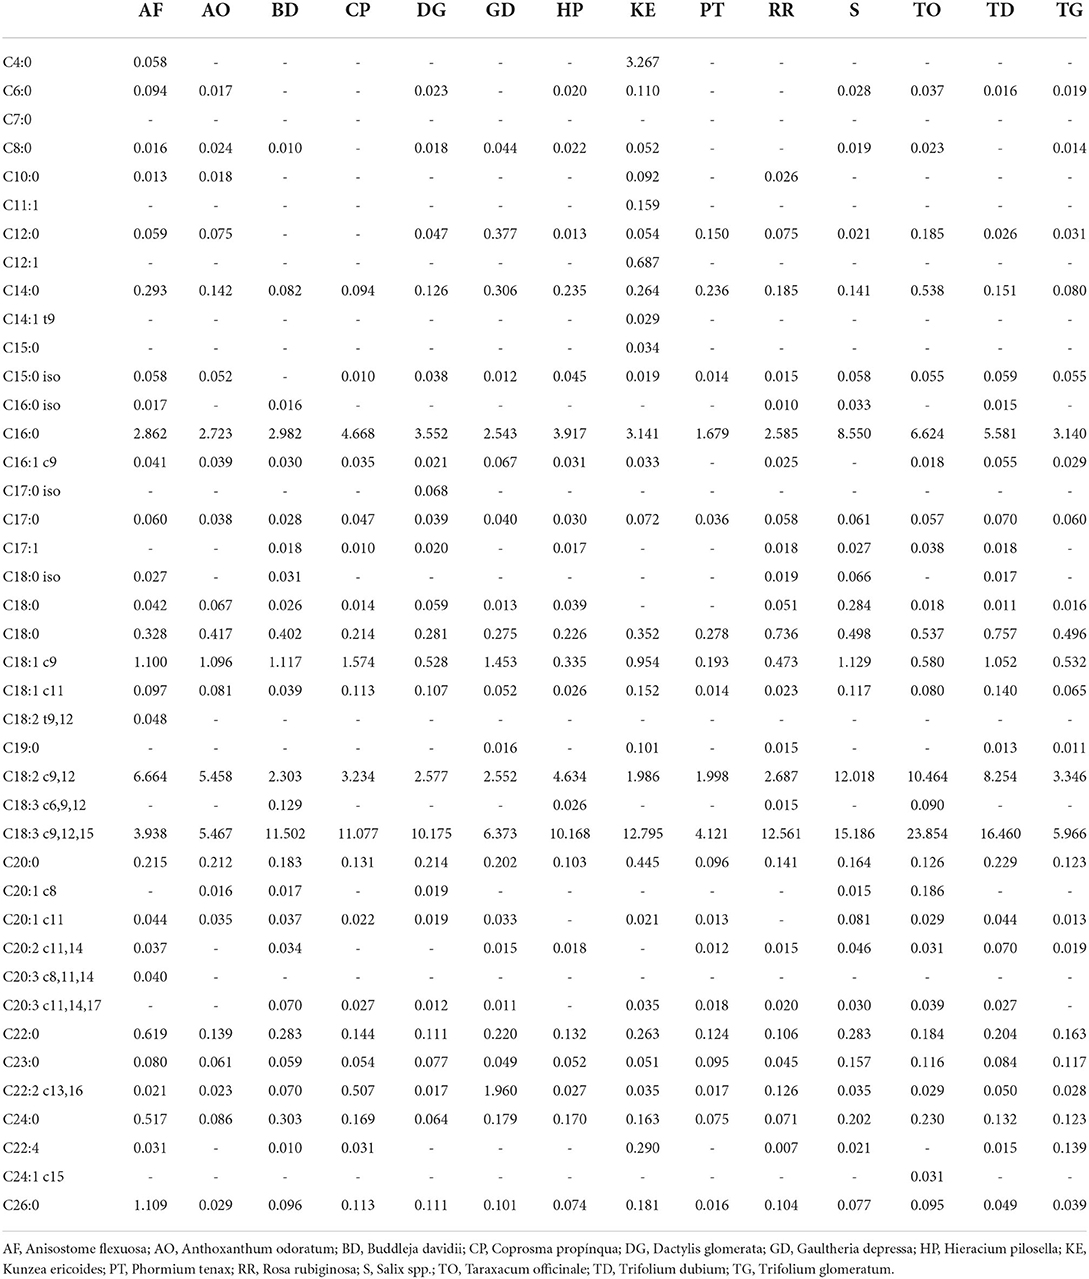
Table 5. Fatty acid composition as methyl esters (FAME) (in mg/g of dried sample) of 14 plants purposely selected in terms of phytochemical and nutraceutical composition.
Healthscape maps are presented in Figures 3–5. Figure 3 presents the distribution and location of phytochemical-rich plants with potential medicinal use in LUMGS. Plants from grassland areas were well distributed along all the station, showing a high diversity, with an exemption of Anthoxanthum odoratum, which is more abundant in the bottom and right boundary of grassland areas. Among all the plants in grassland, the highest abundance is noticed for Hieracium pilosella, through the presence of big clusters. Low abundance is noticed for Geranium mole, Anisotome flexuosa, Agrostis capilares, Verbascm Thapsus, Taraxacum magellanicum, Taraxacum officinale, Cirsium vulgare, and Malva neglecta. Other areas of the station, containing shrubs and trees are concentrated in the bottom parts of the station and around it.
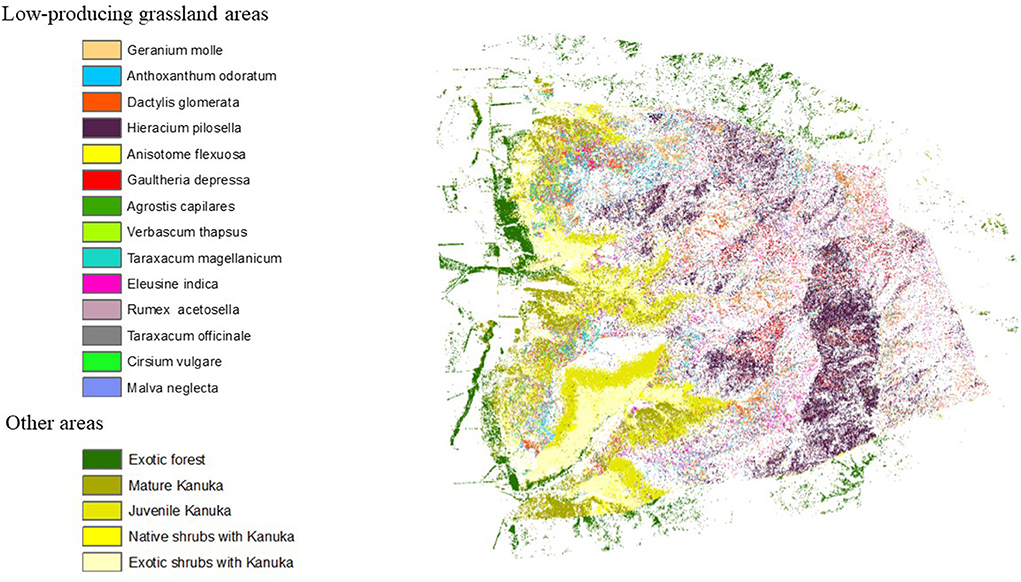
Figure 3. Healthscape map illustrating distribution and location of phytochemical rich plants with potential medicinal use in LUMGS.
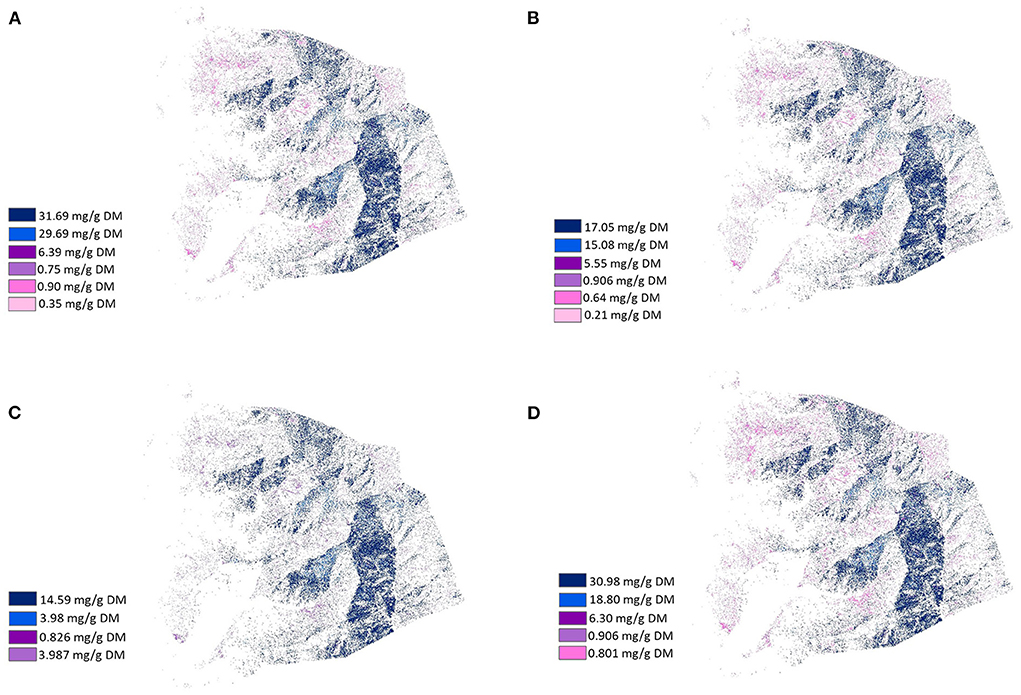
Figure 4. Healthscape maps presenting the distribution and location of phenolic compounds that have potential medicinal effects according to their concentration in plants (mg/g DM) from LUMGS (Darkest color means the highest concentration). (A) Antioxidant, (B) Antimicrobial, (C) Anti-inflammatory, and (D) Anti-carcinogenic.
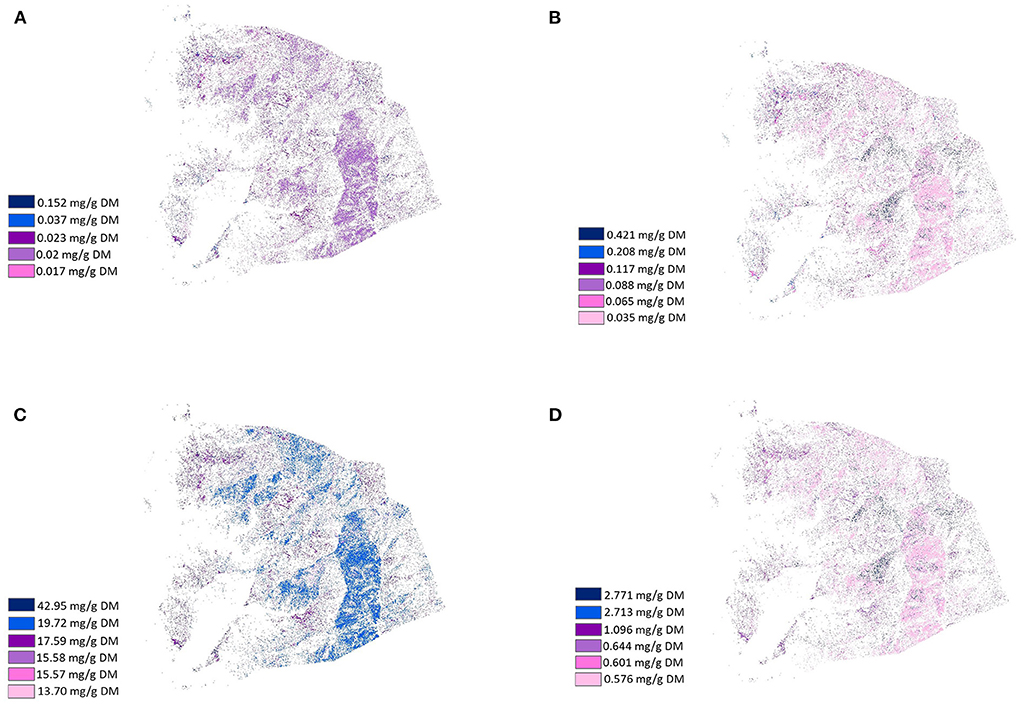
Figure 5. Healthscape maps presenting the distribution and location of the variety of fatty acids chain according to their concentration in plants (mg/g DM) from LUMGS (Darkest color means the highest concentration). (A) Short chain, (B) Medium chain, (C) Long chain, and (D) Very long chain.
Figures 4–6 present the distribution and location of the plant phenolic compounds that have potential medicinal effects and fatty acids variety in terms of chain structure and saturation, respectively, according to concentration in the selected plants. The phenolic maps depict different medicinal effects from different phenolic properties. The highest concentrations of each effect in each map are represented with dark colors, while the lowest concentrations are represented with light colors, according to the location and distribution of the plants containing the specific medicinal effects. Although depicting different effects, the phenolic maps show strong similarities to each other, with slight differences coming from plants with a lower concentration of each effect. The fatty acids maps follow the same scheme, a gradient color variation from dark to light representing the highest concentration to the lowest concentration of fatty acids in terms of chain structure and saturation. Plants showed a high variance of fatty acids profile, thus resulting in very divergent maps.
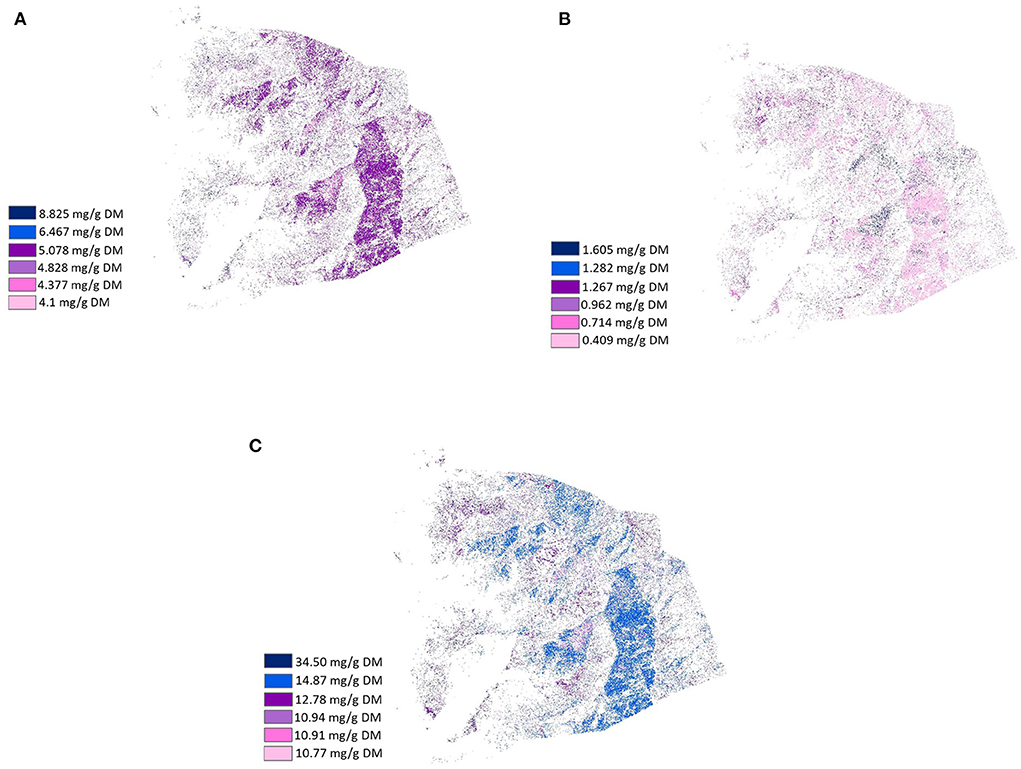
Figure 6. Healthscape maps presenting the distribution and location of the variety of fatty acids saturation according to their concentration in plants (mg/g DM) from LUMGS (the Darkest color means the highest concentration). (A) Saturated, (B) Monounsaturated, and (C) Polyunsaturated.
The inclusion of nutraceutical plants in ruminant foodscapes and their benefits for animals is already recognized (Provenza et al., 2015, 2019; Villalba et al., 2017), similarly, the use of GIS for agriculture purposes (Moore et al., 2016; Das et al., 2020). However, to date, no study has proposed the creation of healthscape maps. We propose a new methodology that combines chemical and spatial analyses to create healthscape maps to help grazers to visualize the spatial distribution of nutraceuticals and plants containing them to make more informed decisions of grazing management in pursuit of health, introducing an extra dimension and perspective to the time of designing foodscapes for ruminants. Thus, the creation of healthscapes emerges as a tool to enhance the holistic management of pastoral livestock production systems.
As a new methodology, we acknowledge the importance of identifying the strength, constraints, and weaknesses of our study. This methodology shows versatility for creating different maps with distinct informative value in terms of plant prophylactics or medicinal properties. However, as the maps were created from the same spatial distribution of plants, they show similar patterns for different information.
The first map (Figure 3) depicts the distribution and location of phytochemical-rich plants with nutraceutical properties, according to literature or laboratory analysis. We used the result of our botanical survey as a second source to enrich the information on the map. The following maps (Figures 4–6) depict the distribution and location of plant phenolic compounds that have potential medicinal effects and the variety of fatty acid compounds and their classification in terms of chain structure and saturation. Only the plants that were analyzed in this study were mapped, producing a total of 11 different maps. The maps depicting the medicinal effects of phenolic compounds change slightly according to different effects, mainly because of the total concentration of phenolics in each plant (Table 4). The medicinal effects of phenolics are not restricted to only one compound, and plants have multiple compounds. Thus, plants with a greater amount of total phenolics will most likely have a greater total concentration of the effects, making the rank of plants for different effects to be very similar. In contrast, the maps illustrating the variety of fatty acids are more distinct in space (Figures 5, 6). The first fatty acids maps (Figure 5) distinguish plants in terms of fatty acids concentration with different chain lengths, while the second maps (Figure 6) distinguish plants with fatty acids with different chain saturation. We used an image classification tool at ArcGIS/Arcmap 10.7.1® software to extrapolate information from the transects and quadrats collected during fieldwork to the whole “grassland” area of the station, from which sampling points were based on different altitudes. By doing this, we restricted divergences in vegetation patterns to altitude factors only, which may have neglected the heterogeneity of LUMGS grassland and affected the results. However, the strategy used was based on the method used by Duncan et al. (1997) where the altitude is indeed a factor of influence on plant pattern distribution. The use of GIS enabled the information collected by fieldwork to be extrapolated beyond the altitude boundary based on similarities between trained samples over object/pixel classification. Although it is still not a precise representation of LUMGS, this technique is a fast and low-cost option to design valuable information from a particular location. A ground proof could be performed to confirm the probability of species to be found in the areas they were mapped to validate the map. Map validation could be done by returning to the field, registering and georeferencing the most abundant species at some points of the station, and matching them with defined classes on the map. However, considering the level of details of our map (species), the size of the unit samples (1 m2 quadrats), and the GPS accuracy, the validation would not offer precise outcomes. A higher number of samples could be an alternative for increasing the precision of the map, followed by ground proof.
Healthscape maps depict different perspectives from plants with multiple benefits for animals, humans, and the environment, presenting a new strategy for illustrating and designing heuristically healthier and more holistic pastoral livestock production systems, where plants are seen not only as food source, but also as medicines. For example, ewes during sensitive periods to gastrointestinal parasitism, such as the peripartum could be placed in paddocks with plants rich in anthelmintic properties to have the effects of parasitic burdens attenuated. Animals during the weaning transition could graze plants with properties that enhance their immune system or plants that increase antioxidant activities and reduce oxidative stress to help them go through this challenging period. Sick animals could be separated from the herd to strategically graze plants with specific properties to treat the disease, such as antibacterial properties. Similarly, finishing animals could have diets rich in plants with long-chain polyunsaturated fatty acids to produce higher quality and nutraceutical meat. These examples illustrate some of the benefits of using healthscape maps as a new facilitating management strategy for the inclusion of different plants for different medicinal purposes to create healthier animals.
The mapped plants are rich in PSC with anti-inflammatory, antiseptic, antidiabetic, anti-obesity, antioxidant, antiviral, antimicrobial, anthelmintic, anticancer, antifungal, and antiprotozoal activities that act in the most varied systems in the body (Sharma et al., 2013; Chevallier, 2016; Díaz et al., 2017; Ganeshpurkar and Saluja, 2017; Naveed et al., 2018; Frutos et al., 2019; Mazur et al., 2019), with positive effects extended to prevent and treat animals from diseases (Villalba et al., 2014; Reddy et al., 2020), to enhance welfare (Chauhan et al., 2014; Beck and Gregorini, 2020), and productive efficiency, while reducing environmental impacts (Jayanegara et al., 2012; Peyraud and Delagarde, 2013; Hoste et al., 2015). As some exogenous factors constraint the ability of animals in consuming and choosing a diverse feed, such as paddock fencing and variability of feeding sites, the knowledge of the spatial diversity of plants in terms of medicinal properties composition would facilitate animal access to a particular/desirable site (Zanon et al., 2022), being a new management tool to positively manipulate animals within a phytotherapeutic diverse foodscape. For example, animals can be managed to eat plants that reduce their stress and, thus, enhance their welfare, which is a big concern within livestock production systems (Fisher, 2020). Farmers can also use the maps to manipulate ruminants to graze prophylactic plants that enhance their immunity against disease infections or plants that act as treatments against infectious pathogens and parasitism. This would also reduce the use and dependency on drugs such as antibiotics and vermifuges, which besides being an economic issue in livestock production systems, have created microorganism resistance, thus reducing drugs efficiency, and generating residues in milk and meat which consequences are hazardous to human health (Beyene, 2016). Furthermore, as some compounds have other nutraceutical properties, such as modifying rumen fermentation as aforementioned, animals could be managed to eat plants that reduce CH4 production and/or N excretion, thus benefiting the environment health.
A phytotherapeutic diverse diet enhances not only ruminant health but also human health (Gregorini et al., 2017). Besides the aforementioned compounds, the plants also present different fatty acids profiles, some of which are essential for humans, as they are not synthesized by the human body and have positive effects in the prevention and treatment of many diseases due to their anticarcinogenic, anti-diabetic, anti-inflammatory, anti-obesity and anti-atherogenic activities (Rajaram, 2014; Blondeau et al., 2015; Yang et al., 2015; Fuke and Nornberg, 2017). Thus, animals consuming medicinal plants can not only self-medicate but also incorporate those compounds in tissues enhancing the quality and nutraceutical composition of meat and dairy that will feed and, therefore, medicate humans (Wrage et al., 2011). For example, animals can be managed to produce meat with potential anticarcinogenic properties to prevent or ameliorate cancer incidence in consumers (Van Vliet et al., 2021), or meat with a greater content of fatty acids that humans are not able to synthesize.
The creation of specific maps identifying fatty acids with different structures can be of great use as their biological functions, metabolism, source, and effects change accordingly. Polyunsaturated fatty acids (PUFAs), for instance, are only produced by plants and phytoplankton and must be included in the animal diet as they are a source of the endogenous synthesis of further fatty acids, such as Eicosapentaenoic acid (EPA; 20:5o-3) and docosahexaenoic acid (DHA; 22:6o-3) that have essential effects on animal health (Rustan and Drevon, 2005). It is also well known that replacing saturated fatty acids (SFAs) for MUFAs or PUFAs in human diets reduces the risk of cardiovascular diseases (Briggs et al., 2017), thus, the healthscape maps could also be used to reduce the presence of specific plants on the ruminant diet, such as plants with a high abundance of SFAs. As animal products are influenced by their diets and thus, influencing human health (Provenza et al., 2019), the fatty acids maps would contribute to the design of animal products with enhanced beneficial fatty acids and reduced undesirable fatty acids toward the enhancement of not only animals but human health as well. All the healthscape maps bring valuable information in terms of plant benefits for animals, humans, and the environment, and could, therefore, be cooperatively used for enhanced multi purposes achievements.
Our methodology is just a starting point. We cited the benefits of only some of the powerful constituents plants may have, but actually, plants contain hundreds or thousands of different constituents that interact in complex ways, which details and benefits are still not understood fully. In addition, it is known that some plant properties effects might be opposite at different doses (Chevallier, 2016). Although animals can select plant properties at self-regulated safe levels of intake (Provenza, 1996), a better knowledge of the most abundant plant properties and their interaction with other plants would facilitate animal decisions during grazing and animal access to specific plants in terms of offering them adequate doses of adequate plants according to their physiology. It is also important to understand the actual effect of plants and arrange plants in different doses on ruminants, as the effects of PSCs are dose dependent (Raubenheimer and Simpson, 2009), which should be subject to further research.
The spatial reference taken in this methodology approach refers to the heterogeneity in terms of plant species across the case study station, which is the reason why we pooled the subsamples of our plants together to represent each specie selected. However, as the concentration and arrangement of PSC, as well as its medicinal and nutritional effects, change across plants and parts of plants (Provenza, 1995; Villalba et al., 2017), keeping subsamples from different locations at the station, or different parts of the same plant separately and statistically comparing their PSC concentration would enrich the spatial information used in the building of the maps. Similarly, we applied the methodology for only one season—Summer. As the concentration of PSC changes with the phenology of plants (Kuhnen et al., 2021), the growth pattern of plants and seasonal influence on their PSC content and effects would further inform management decisions to enhance the particular effects of some dietary PSC on the health and wellbeing of the animals. Therefore, we strongly recommend the inclusion of temporal variability on PSC synthesis for future studies.
We also highlight the importance of understanding the effect of herbivory on plants. Ruminants may induce the development of some swards while depriving the survival of others, due to their highly selective activity, affecting the diversity of plants and, therefore, threatening the stability and resilience of the system (Wrage et al., 2011). If the distribution, composition, and growth pattern of plants along the different seasons is known, grazing can be adjusted for the available plants in space and time according to animal feeding patterns and selectivity to better manipulate the vegetation dynamics and improve the diversity, stability, and resilience of the system. This highlights the need of creating different healthscapes for different environments not only spatially but also in a temporal context.
This study provides a novel approach to the study and management of grasslands by incorporating spatial dimensions to plant chemistry. The methodology presented in this study emerges as a heuristic tool for the design and analysis of modern pastoral livestock production systems to promote health as a whole. As an innovative approach, we caution the reader on the need for proper adjustment of building variables and analyses according to the particular contexts and goals.
A novel and multi-methods approach was taken to successfully create healthscape maps that present an extra perspective of plant nutritional value. The maps illustrate a phytotherapeutically diverse environment that contributes to provide more productive, sustainable, and healthier livestock production systems. It straightens the link between plants and animals as management tools and strategies to design pastoral livestock production systems to positively affect humans and grasslands and calls for the extension of interdisciplinary research. The valuable information behind the mapped plants is placed in another dimension of science, achieves multi areas of expertise, and suggests advances in the understanding of the nutritional ecology of grazing animals, to induce a new and holistic panorama of pastoral livestock production systems.
The original contributions presented in the study are included in the article/Supplementary material, further inquiries can be directed to the corresponding author/s.
FP and PG contributed to the concept of this study. FP wrote the manuscript. PG contributed to the review and edition. FP performed the field sampling, laboratory analysis, and the creation of the maps in consultation with PG. All authors have read and agreed to the published version of the manuscript.
This research was funded by the Center of Excellence, Designing Future Productive Landscapes, Lincoln University (4350 AGLS—INT 4908 AGLS−113043) and by the John Barnes Postgraduate Scholarship from Lincoln University.
The authors acknowledge the assistance of Renata Evangelista de Oliveira and Jozivaldo Prudêncio Gomes de Morais on the botanical survey and the assistance of Renata Evangelista de Oliveira, Jozivaldo Prudêncio Gomes de Morais, Leonardo Rescia, Richard McNeilly, and Nadia McNeilly on the data sampling. Thanks to Jenny Zhao, Rosy Tung, and Shuang Jiang for assisting with laboratory analysis and thanks to Crile Doscher for helping with GIS techniques.
The authors declare that the research was conducted in the absence of any commercial or financial relationships that could be construed as a potential conflict of interest.
All claims expressed in this article are solely those of the authors and do not necessarily represent those of their affiliated organizations, or those of the publisher, the editors and the reviewers. Any product that may be evaluated in this article, or claim that may be made by its manufacturer, is not guaranteed or endorsed by the publisher.
The Supplementary Material for this article can be found online at: https://www.frontiersin.org/articles/10.3389/fsufs.2022.927568/full#supplementary-material
Ahmad, I., Ahmad, N., and Wang, F. (2009). Antioxidant phenylpropanoid glycosides from Buddleja davidii. J. Enzyme Inhib. Med. Chem. 24, 993–997. doi: 10.1080/14756360802565072
Al-Zubairi, A. S., Abdul, A. B., Abdelwahab, S. I., Peng, C. Y., Mohan, S., and Elhassan, M. M. (2011). Eleucine indica possesses antioxidant, antibacterial and cytotoxic properties. Evid. Based Complement. Alternat. Med. 2011, 965370. doi: 10.1093/ecam/nep091
Asgarpanah, J. (2012). Phytopharmacology and medicinal properties of Salix aegyptiaca L. Afr. J. Biotechnol. 11, 7145–7150. doi: 10.5897/AJB12.418
Barry, T. N., McNeill, D. A., and McNabb, W. C. (2021). Plant secondary compounds; their impact on forage nutritive value and upon animal production. In: Gomide, J.A., Mattos, W.R.S., da Silva, S.C. eds. Proceedings of the XIX International Grasslands Congress. São Paulo, Brazil. p. 445–452.
Beck, M. R., and Gregorini, P. (2020). How dietary diversity enhances hedonic and eudaimonic well-being in grazing ruminants. Front. Vet. Sci. 7, 191. doi: 10.3389/fvets.2020.00191
Beyene, T. (2016). Veterinary drug residues in food-animal products: its risk factors and potential effects on public health. J. Vet. Sci. Technol. 7, 1–7. doi: 10.4172/2157-7579.1000285
Blondeau, N., Lipsky, R. H., Bourourou, M., Duncan, M. W., Gorelick, P. B., and Marini, A. M. (2015). Alpha-linolenic acid: an omega-3 fatty acid with neuroprotective properties—ready for use in the stroke clinic?. Biomed Res. Int. 2015, 519830. doi: 10.1155/2015/519830
Briggs, M. A., Petersen, K. S., and Kris-Etherton, P. M. (2017). Saturated fatty acids and cardiovascular disease: replacements for saturated fat to reduce cardiovascular risk. Healthcare. 5, 29. doi: 10.3390/healthcare5020029
Chauhan, S. S., Celi, P., Leury, B. J., Clarke, I. J., and Dunshea, F. R. (2014). Dietary antioxidants at supranutritional doses improve oxidative status and reduce the negative effects of heat stress in sheep. J. Anim. Sci. 92, 8. doi: 10.2527/jas.2014-7714
Chevallier, A. (2016). Encyclopedia of Herbal Medicine: 550 Herbs and Remedies for Common Ailments. New York, NY: Penguin.
Cunniff, P. (1995). Official Methods of Analysis. 16th ed. Arlington, VA: Association of Official Analytical Chemists (AOAC).
Das, A. C., Noguchi, R., and Ahamed, T. (2020). Integrating an expert system, GIS, and satellite remote sensing to evaluate land suitability for sustainable tea production in Bangladesh. Remote Sens. 12, 4136. doi: 10.3390/rs12244136
Díaz, G. J., Hernández, G. T., Zamilpa, A., Pérez, C. M. B., Bribiesca, J. E. R., Mendo, O. H., et al. (2017). In vitro assessment of Argemone mexicana, Taraxacum officinale, Ruta chalepensis and Tagetes filifolia against Haemonchus contortus nematode eggs and infective (L3) larvae. Microb. Pathog. 109, 162–168. doi: 10.1016/j.micpath.2017.05.048
Dixon, R. A., and Strack, D. (2003). Phytochemistry meets genome analysis, and beyond. Phytochemistry 62, 815–816.
Duncan, R., Lucas, D., and Palmer, C. (1997). Mt Grand Station: Baseline Survey for Vegetation and Soils. Departament of Plant Sciences. Lincoln University. New Zealand.
Ellenberg, D., and Mueller-Dombois, D. (1974). Aims and methods of vegetation ecology. New York, NY: Wiley.
Fisher, M. W. (2020). Pastoral farming ethics and economics-Aligning grazing practices and expectations. Front. Vet. Sci. 7:209. doi: 10.3389/fvets.2020.00209
Freeland, W. J., and Janzen, D. H. (1974). Strategies in herbivory by mammals: the role of plant secondary compounds. Am. Nat. 108, 269–289. doi: 10.1086/282907
Frutos, M. J., Rincón-Frutos, L., and Valero-Cases, E. (2019). Rutin. In: Nonvitamin and Nonmineral Nutritional Supplements. Cambridge, MA, Academic Press. p. 111–117.
Fuke, G., and Nornberg, J. L. (2017). Systematic evaluation on the effectiveness of conjugated linoleic acid in human health. Crit. Rev. Food Sci. Nutr. 57, 1–7. doi: 10.1080/10408398.2012.716800
Ganeshpurkar, A., and Saluja, A. K. (2017). The pharmacological potential of rutin. Saudi Pharm. J. 25, 149–164. doi: 10.1016/j.jsps.2016.04.025
Gawrońska-Grzywacz, M., Krzaczek, T., Nowak, R., Los, R., Malm, A., Cyranka, M., et al. (2011). Biological activity of new flavonoid from Hieracium pilosella L. Cent. Eur. J. Biol. 6, 397–404. doi: 10.2478/s11535-011-0017-9
Ghagane, S. C., Puranik, S. I., Kumbar, V. M., Nerli, R. B., Jalalpure, S. S., Hiremath, M. B., et al. (2017). In vitro antioxidant and anticancer activity of Leea indica leaf extracts on human prostate cancer cell lines. Integr. Med. Res. 6, 79–87. doi: 10.1016/j.imr.2017.01.004
Goel, G., Makkar, H. P. S., and Becker, K. (2008). Changes in microbial community structure, methanogenesis and rumen fermentation in response to saponin-rich fractions from different plant materials. J. Appl. Microbiol. 105, 770–777. doi: 10.1111/j.1365-2672.2008.03818.x
Gómez-Alonso, S., García-Romero, E., and Hermosín-Gutiérrez, I. (2007). HPLC analysis of diverse grape and wine phenolics using direct injection and multidetection by DAD and fluorescence. J. Food Compos. Anal. 20, 618–626. doi: 10.1016/j.jfca.2007.03.002
Gregorini, P., Villalba, J. J., Chilibroste, P., and Provenza, F. D. (2017). Grazing management: setting the table, designing the menu and influencing the diner. Anim. Prod. Sci. 57, 1248–1268. doi: 10.1071/AN16637
Hauck, B., Gallagher, J. A., Morris, S. M., Leemans, D., and Winters, A. L. (2014). Soluble phenolic compounds in fresh and ensiled orchard grass (Dactylis glomerata L.), a common species in permanent pastures with potential as a biomass feedstock. J. Agric. Food Chem. 62, 468–475. doi: 10.1021/jf4040749
Hoste, H., Torres-Acosta, J. F. J., Sandoval-Castro, C. A., Mueller-Harvey, I., Sotiraki, S., Louvandini, H., et al. (2015). Tannin containing legumes as a model for nutraceuticals against digestive parasites in livestock. Vet. Parasitol. 212, 5–17. doi: 10.1016/j.vetpar.2015.06.026
Houghton, P. J., Mensah, A. Y., Iessa, N., and Hong, L. Y. (2003). Terpenoids in Buddleja: relevance to chemosystematics, chemical ecology and biological activity. Phytochemistry. 64, 385–393. doi: 10.1016/S0031-9422(03)00264-4
Jayanegara, A., Leiber, F., and Kreuzer, M. (2012). Meta-analysis of the relationship between dietary tannin level and methane formation in ruminants from in vivo and in vitro experiments. J. Anim. Physiol. Anim. Nutr. 96, 365–375. doi: 10.1111/j.1439-0396.2011.01172.x
Jiménez-López, J., Ruiz-Medina, A., Ortega-Barrales, P., and Llorent-Martínez, E. J. (2017). Rosa rubiginosa and Fraxinus oxycarpa herbal teas: characterization of phytochemical profiles by liquid chromatography-mass spectrometry, and evaluation of the antioxidant activity. New J. Chem. 41, 7681–7688. doi: 10.1039/C7NJ01743J
Kolodziejczyk-Czepas, J. (2012). Trifolium species-derived substances and extracts—Biological activity and prospects for medicinal applications. J. Ethnopharmacol. 143, 14–23. doi: 10.1016/j.jep.2012.06.048
Kuhnen, S., Holz, D.T., Moacyr, J.R., Piccinin, I.N., and Pinheiro Machado Filho, L.C. (2021). Effect of pasture management on bioactive compounds of Lolium multiflorum and Avena strigosa for dairy cows and its effect on milk quality. Agroecol. Sustain. Food Syst. 46, 3–22. doi: 10.1080/21683565.2021.1964672
Lagrange, S. P., MacAdam, J. W., and Villalba, J. J. (2021). The use of temperate tannin containing forage legumes to improve sustainability in forage–livestock production. Agronomy 11, 2264. doi: 10.3390/agronomy11112264
Le, X. T., Huynh, M. T., Pham, T. N., Than, V. T., Toan, T. Q., Bach, L. G., et al. (2019). Optimization of total anthocyanin content, stability and antioxidant evaluation of the anthocyanin extract from Vietnamese Carissa carandas L. fruits. Processes 7, 468. doi: 10.3390/pr7070468
Liu, W. R., Qiao, W. L., Liu, Z. Z., Wang, X. H., Jiang, R., Li, S. Y., et al. (2013). Gaultheria: Phytochemical and pharmacological characteristics. Molecules 18, 12071–12108. doi: 10.3390/molecules181012071
Maori plant use (2022). https://maoriplantuse.landcareresearch.co.nz (accessed September 25, 2020).
Martinez, M., Poirrier, P., Chamy, R., Prüfer, D., Schulze-Gronover, C., Jorquera, L., et al. (2015). Taraxacum officinale and related species—An ethnopharmacological review and its potential as a commercial medicinal plant. J. Ethnopharmacol. 169, 244–262. doi: 10.1016/j.jep.2015.03.067
Maxwell, T. M., Moir, J. L., and Edwards, G. R. (2016). Grazing and soil fertility effect on naturalized annual clover species in New Zealand high country. Rangel. Ecol. Manag. 69, 444–448. doi: 10.1016/j.rama.2016.07.009
Mazur, M., Zwyrzykowska-Wodzińska, A., Wojtas, E., Zachwieja, A., and Salejda, A. M. (2019). Effect of yerba mate (Ilex paraguariensis A. St.-Hil.) supplementation on oxidative stress in ruminants. Chil. J. Agric. Res. 79, 316–322. doi: 10.4067/S0718-58392019000200316
Moore, A., Johnson, M., Lord, J., Coutts, S., Pagan, M., Gbolagun, J., et al. (2016). Applying spatial analysis to the agroecology-led management of an indigenous farm in New Zealand. Ecol. Inform. 31, 49–58. doi: 10.1016/j.ecoinf.2015.11.009
Natural medicinal herbs (n.d.). http://www.naturalmedicinalherbs.net/herbs (accessed October 15, 2020)..
Naumann, H. D., Lambert, B. D., Armstrong, S. A., Fonseca, M. A., Tedeschi, L. O., Muir, J. P., et al. (2015). Effect of replacing alfalfa with panicled-tick clover or sericea lespedeza in corn-alfalfa-based substrates on in vitro ruminal methane production. J. Dairy Sci. 98, 3980–3987. doi: 10.3168/jds.2014-8836
Naveed, M., Hejazi, V., Abbas, M., Kamboh, A. A., Khan, G. J., Shumzaid, M., et al. (2018). Chlorogenic acid (CGA): A pharmacological review and call for further research. Biomed. Pharmacother. 97, 67–74. doi: 10.1016/j.biopha.2017.10.064
Olagaray, K. E., and Bradford, B. J. (2019). Plant flavonoids to improve productivity of ruminants–A review. Anim. Feed Sci. Technol. 251, 21–36. doi: 10.1016/j.anifeedsci.2019.02.004
Oleszek, W., and Stochmal, A. (2002). Triterpene saponins and flavonoids in the seeds of Trifolium species. Phytochemistry 61, 165–170. doi: 10.1016/S0031-9422(02)00230-3
Peyraud, J. L., and Delagarde, R. (2013). Managing variations in dairy cow nutrient supply under grazing. Animal 7, 57–67. doi: 10.1017/S1751731111002394
Pichersky, E., and Lewinsohn, E. (2011). Convergent evolution in plant specialized metabolism. Annu. Rev. Plant Biol. 62, 549–566. doi: 10.1146/annurev-arplant-042110-103814
Plants for a future (n.d.). https://pfaf.org/ (accessed November 10, 2021)..
Pollock, C. J., and Jones, T. (1979). Seasonal patterns of fructan metabolism in forage grasses. New Phytol. 83, 9–15. doi: 10.1111/j.1469-8137.1979.tb00720.x
Pott, D. M., Osorio, S., and Vallarino, J. G. (2019). From Central to Specialized Metabolism: An overview of some secondary compounds derived from the primary metabolism for their role in conferring nutritional and organoleptic characteristics to fruit. Front. Plant Sci. 10, 835. doi: 10.3389/fpls.2019.00835
Provenza, F. D. (1995). Postingestive feedback as an elementary determinant of food preference and intake in ruminants. J. Range Manag. 48, 2–17. doi: 10.2307/4002498
Provenza, F. D. (1996). Acquired aversions as the basis for varied diets of ruminants foraging on rangelands. J. Anim. Sci. 74, 2010–2020. doi: 10.2527/1996.7482010x
Provenza, F. D., Kronberg, S. L., and Gregorini, P. (2019). Is grassfed meat and dairy better for human and environmental health?. Front. Nutr. 6, 26. doi: 10.3389/fnut.2019.00026
Provenza, F. D., Meuret, M., and Gregorini, P. (2015). Our landscapes, our livestock, ourselves: Restoring broken linkages among plants, herbivores, and humans with diets that nourish and satiate. Appetite 95, 500–519. doi: 10.1016/j.appet.2015.08.004
Rajaram, S. (2014). Health benefits of plant-derived α-linolenic acid. Am. J. Clin. Nutr. 100 (Suppl. 1), 443S-448S. doi: 10.3945/ajcn.113.071514
Raubenheimer, D., and Simpson, S. J. (2009). Nutritional PharmEcology: doses, nutrients, toxins, and medicines. Integr. Comp. Biol. 49, 329–337. doi: 10.1093/icb/icp050
Reddy, P. R. K., Elghandour, M. M. M. Y., Salem, A. Z. M., Yasaswini, D., Reddy, P. P. R., Reddy, A. N., et al. (2020). Plant secondary metabolites as feed additives in calves for antimicrobial stewardship. Anim. Feed Sci. Technol. 264, 114469. doi: 10.1016/j.anifeedsci.2020.114469
Rongoa Pastures Heathy Animals Resilient Farms's Report (2015). Available online at: www.bhu.org.nz/future-farming-centre (accessed January 26, 2022).
Rustan, A. C., and Drevon, C. A. (2005). Fatty acids: structures and properties. eLS. doi: 10.1038/npg.els.0003894
Sabudak, T., Orak, H. H., Gulen, D., Ozer, M., Caliskan, H., Bahrisefit, I., et al. (2017). Investigation of some antibacterial and antioxidant properties of wild Cirsium vulgare from Turkey. Indian J. Pharm. Educ. Res. 51, 363. doi: 10.5530/ijper.51.3s.48
Sagnia, B., Fedeli, D., Casetti, R., Montesano, C., Falcioni, G., and Colizzi, V. (2014). Antioxidant and anti-inflammatory activities of extracts from Cassia alata, Eleusine indica, Eremomastax speciosa, Carica papaya and Polyscias fulva medicinal plants collected in Cameroon. PloS ONE 9, e103999. doi: 10.1371/journal.pone.0103999
Sharma, S., Ali, A., Ali, J., Sahni, J. K., and Baboota, S. (2013). Rutin: therapeutic potential and recent advances in drug delivery. Expert Opin. Investig. Drugs. 22, 1063–1079. doi: 10.1517/13543784.2013.805744
Sukhija, P. S., and Palmquist, D. L. (1988). Rapid method for determination of total fatty acid content and composition of feedstuffs and feces. J. Agric. Food Chem. 36, 1202–1206. doi: 10.1021/jf00084a019
Tajner-Czopek, A., Gertchen, M., Rytel, E., Kita, A., Kucharska, A. Z., and Sokół-Łetowska, A. (2020). Study of antioxidant activity of some medicinal plants having high content of caffeic acid derivatives. Antioxidants. 9, 412. doi: 10.3390/antiox9050412
Tedeschi, L. O., Muir, J. P., Naumann, H. D., Norris, A. B., Ramírez-Restrepo, C. A., and Mertens-Talcott, S. U. (2021). Nutritional aspects of ecologically relevant phytochemicals in ruminant production. Front. Vet. Sci. 8, 628445. doi: 10.3389/fvets.2021.628445
Tolkachev, O. N., and Zhuchenko, A. A. (2004). Biologically active substances of flax: medicinal and nutritional properties (a review). Pharm. Chem. J. 34, 360–367. doi: 10.1023/A:1005217407453
Torregrossa, A. M., and Dearing, M. D. (2009). Nutritional toxicology of mammals: regulated intake of plant secondary compounds. Funct. Ecol. 23, 48–56. doi: 10.1111/j.1365-2435.2008.01523.x
Torres-Fajardo, R. A., González-Pech, P. G., Sandoval-Castro, C. A., and Torres-Acosta, J. F. D. J. (2020). Small ruminant production based on rangelands to optimize animal nutrition and health: Building an interdisciplinary approach to evaluate nutraceutical plants. Animals. 10, 10. doi: 10.3390/ani10101799
Useful tropical plants (n.d.). http://tropical.theferns.info/viewtropical.php?id=Eleusine+indica [Accessed January 16, 2022].
Van Vliet, S., Provenza, F. D., and Kronberg, S. L. (2021). Health-promoting phytonutrients are higher in grass-fed meat and milk. Front. Sustain. Food Syst. 4, 299. doi: 10.3389/fsufs.2020.555426
Vandermeulen, S., Singh, S., Ramírez-Restrepo, C. A., Kinley, R. D., Gardiner, C. P., Holtum, J. A., et al. (2018). In vitro assessment of ruminal fermentation, digestibility and methane production of three species of Desmanthus for application in northern Australian grazing systems. Crop Pasture Sci. 69, 797–807. doi: 10.1071/CP17279
Villalba, J. J., Costes-Thir,é, M., and Ginane, C. (2017). Phytochemicals in animal health: diet selection and trade-offs between costs and benefits. Proc. Nut. Soc. 76, 113–121. doi: 10.1017/S0029665116000719
Villalba, J. J., Miller, J., Ungar, E. D., Landau, S. Y., and Glendinning, J. (2014). Ruminant self-medication against gastrointestinal nematodes: evidence, mechanism, and origins. Parasite 21, 21–31. doi: 10.1051/parasite/2014032
Villalba, J. J., and Provenza, F. D. (2007). Self-medication and homeostatic behaviour in herbivores: learning about the benefits of nature's pharmacy. Animal 1, 1360–1370. doi: 10.1017/S1751731107000134
Villalba, J. J., Provenza, F. D., and Shaw, R. (2006). Sheep self-medicate when challenged with illness-inducing foods. Anim. Behav. 71,1131–1139. doi: 10.1016/j.anbehav.2005.09.012
White, R. P., Murray, S., and Rohweder, M. (2000). Grassland Ecosystems. Washington, DC: World Resources Institute.
Wilson, R. D. (1984). Chemotaxonomic studies in the Rubiaceae 2. Leaf flavonoids of New Zealand coprosmas. N. Z. J. Bot. 22, 195–200. doi: 10.1080/0028825X.1984.10425251
Wrage, N., Strodthoff, J., Cuchillo, H. M., Isselstein, J., and Kayser, M. (2011). Phytodiversity of temperate permanent grasslands: ecosystem services for agriculture and livestock management for diversity conservation. Biodivers. Conserv. 20, 3317–3339. doi: 10.1007/s10531-011-0145-6
Wyatt, R. M., Hodges, L. D., Kalafatis, N., Wright, P. F., Wynne, P. M., and Macrides, T. A. (2005). Phytochemical analysis and biological screening of leaf and twig extracts from Kunzea ericoides. Phytother. Res. 19, 963–970. doi: 10.1002/ptr.1767
Yang, B., Chen, H., Stanton, C., Ross, R. P., Zhang, H., Chen, Y. Q., et al. (2015). Review of the roles of conjugated linoleic acid in health and disease. J. Funct. Foods. 15, 314–325. doi: 10.1016/j.jff.2015.03.050
Zanon, T., Komainda, M., Ammer, S., Isselstein, J., and Gauly, M. (2022). Diverse feed, diverse benefits-the multiple roles of feed diversity at pasture on ruminant livestock production-a review. J. Vet. Sci. Ani. Husb. 10, 101.
Zduńska, K., Dana, A., Kolodziejczak, A., and Rotsztejn, H. (2018). Antioxidant properties of ferulic acid and its possible application. Skin Pharmacol. Physiol. 31, 6. doi: 10.1159/000491755
Keywords: grazing, holistic, landscapes, pharmacology, ruminants
Citation: Pereira FC and Gregorini P (2022) Applying spatio-chemical analysis to grassland ecosystems for the illustration of chemoscapes and creation of healthscapes. Front. Sustain. Food Syst. 6:927568. doi: 10.3389/fsufs.2022.927568
Received: 24 April 2022; Accepted: 23 August 2022;
Published: 22 September 2022.
Edited by:
Gary S. Kleppel, University at Albany, United StatesReviewed by:
Kathy Soder, Agricultural Research Service (USDA), United StatesCopyright © 2022 Pereira and Gregorini. This is an open-access article distributed under the terms of the Creative Commons Attribution License (CC BY). The use, distribution or reproduction in other forums is permitted, provided the original author(s) and the copyright owner(s) are credited and that the original publication in this journal is cited, in accordance with accepted academic practice. No use, distribution or reproduction is permitted which does not comply with these terms.
*Correspondence: Fabiellen Cristina Pereira, ZmFiaWVsbGVuLnBlcmVpcmFAbGluY29sbnVuaS5hYy5ueg==; Pablo Gregorini, cGFibG8uZ3JlZ29yaW5pQGxpbmNvbG4uYWMubno=
Disclaimer: All claims expressed in this article are solely those of the authors and do not necessarily represent those of their affiliated organizations, or those of the publisher, the editors and the reviewers. Any product that may be evaluated in this article or claim that may be made by its manufacturer is not guaranteed or endorsed by the publisher.
Research integrity at Frontiers
Learn more about the work of our research integrity team to safeguard the quality of each article we publish.