 Kirti Das
 Anu Ramaswami
95% of researchers rate our articles as excellent or good
Learn more about the work of our research integrity team to safeguard the quality of each article we publish.
Find out more
PERSPECTIVE article
Front. Sustain. Food Syst. , 06 July 2022
Sec. Urban Agriculture
Volume 6 - 2022 | https://doi.org/10.3389/fsufs.2022.923079
Urban agriculture, is increasingly incorporated into food system policies to address social equity. However, assessing its effectiveness requires primary data on the demographics of agricultural gardeners and the type of gardening pursued, which are limited. This paper reports on a first detailed survey of 6,152 representative urbanites in three US cities, enabling a detailed demographic analysis of agricultural gardeners. We find low engagement in community vs. household agricultural gardening (~2% vs. ~27%). Indoor and outdoor household agricultural gardening was generally dominated by higher-income, White, males (24–44%). Community agricultural gardening appears more diverse; however, participation is low, hence, benefits may not scale up. Designing urban agriculture to address social equity requires gathering data on who gardens and how, for which our paper provides a first template.
Globally, there is growing policy interest in urban agriculture (UA) as a crucial component of sustainable food systems. This can be seen in the agenda of the Milan Urban Food Policy Pact (MUFPP) (Milan Urban Food Policy Pact, 2020) and in the cities collaborating with the Food and Agriculture Organization (FAO) on the Urban Food Actions Platform (e.g., the C40 cities and ICLEI – Local Governments for Sustainability) (Food Agriculture Organisation, 2019). Among its many presumed benefits, UA is often identified as an instrument to promote social equity, for example, in the MUFPP and city-level food policy plans (City of Seattle, 2013; City of Denver, 2017; Milan Urban Food Policy Pact, 2020; City of Columbus Franklin County Ohio, 2021; The City of New York, 2021). Social equity includes consideration of both distributive equity (i.e., just distribution of burdens and benefits) with the goal of reducing disparity for the most underserved (Braveman, 2006; Tong et al., 2021), as well as procedural equity (Sovacool et al., 2016). Both together are often referred to as social equity or social justice (Clark et al., 2022).
UA can be defined as agri-food production that occurs within urban administrative boundaries and in peri-urban areas around urban centers (Ayuk et al., 2022). It reflects gardening for food production vs. ornamentals (flowers, etc.). UA incorporates many modes of agri-food production, including conventional land-based agriculture, poultry and livestock rearing, indoor farming in greenhouses, and high-technology controlled-environment agriculture, as well as aquaculture, mushroom farming, and insect farming (Goldstein et al., 2016; Dorr et al., 2021). Land-based agriculture, which is most prevalent, can also be classified into various types based on the scale/size of farms, sale of produce or use for personal consumption, and location of the farms. Specifically, researchers have identified three scales: household UA gardens, community or allotment gardens (neither of which typically sells produce), and larger-scale UA for commercial sales (Krikser et al., 2016; Ayuk et al., 2022).
In the United States (US), UA has evolved to include a wide range of household gardens, community gardens, and commercial urban farms. However, there is a fundamental lack of knowledge regarding who gardens (demographics) and how (typology), particularly at the smaller scales where policy makers are more actively promoting agriculture (Reynolds, 2015; Horst et al., 2017; Young et al., 2018; Philpott et al., 2020). For example, in the US, several food policy plans promote community agriculture [e.g., in Seattle (City of Seattle, 2013) and Columbus (City of Columbus Franklin County Ohio, 2021)] although some now address household agriculture [e.g., the Homegrown Program in Pittsburgh (Sickler, 2018)]. However, a lack of information on how many people garden in these two typologies and their demographics can hinder the evaluation of UA's effectiveness in advancing social equity. Publicly available demographic data on urban gardeners are typically not representative of the population, or are project specific (e.g., they describe particular community gardens) (Philpott et al., 2020; Grebitus, 2021). To our knowledge, the only survey that has recently examined the demographics of those engaged in UA (who grow their own food) across multiple cities is the National Gardening Survey (National Gardening Association Research Division, 2021). However, such national data are unable to provide the granular/tailored findings that cities need to plan local UA, and there are no clear distinctions between gardening typologies (i.e., gardening at home vs. community gardens).
Therefore, the goal of this research was to conduct a novel, multi-city study of UA, including its demographics and typology, in New York City (NYC), Los Angeles (LA), and Newark, using a representative sample to explore household and community gardening (UA) and to enable a more nuanced understanding of how different gardening types can advance social equity. The research sought to answer three questions: (Q1) What are the demographics of people who report UA and its different types, specifically household gardening (indoor and outdoor) and community gardening? (Q2) How do the demographics for different types of UA compare to the general population/survey sample? (Q3) What are the potential demographic predictors of UA by type? While the survey was limited to three cities and the findings are context sensitive, they showcase important trends and insights for policymakers.
Data for the study were from the Role of Local Built Infrastructure and Provisioning Systems on Well-Being in Cities survey conducted in three cities: Los Angeles, Newark, and New York City. The online survey was conducted between August 2020 and September 2021 and required approximately 30 minutes to complete. The data used in this study are available from the corresponding author upon reasonable request.
The survey was created and distributed using the online survey tool Qualtrics. Once the online survey was created, Qualtrics participant panels were used to locate, contact, and invite individuals to participate. Qualtrics builds these panels using multiple methods, including intercept recruitment, member referrals, targeted email lists, permission-based networks, and social media. Using data from the American Community Survey (ACS), the researchers set demographic quotas for the data collection based on gender, race, income, and age to collect representative data from each city. Participants were contacted by Qualtrics via email or through their survey platform to participate in the survey. Incentives (such as cash, gift cards, airline miles, retail points, etc.) were provided to participants directly by Qualtrics based on preexisting incentive agreements. To avoid self-selection bias, the survey invitations did not include specific details about the content of the survey and were instead very general.
The final sample used for this study consisted of 6,152 participants (Los Angeles = 1,235; Newark = 1,869; New York City = 3,048). Best efforts were made to collect a representative sample of the key demographics in the cities. Table 1 shows the sample distribution by key demographic variables as compared to the ACS 5-year estimates for 2019. With the exception of race and income in Newark, the sample distribution was relatively similar for gender, race/ethnicity, income, and age for all three cities.
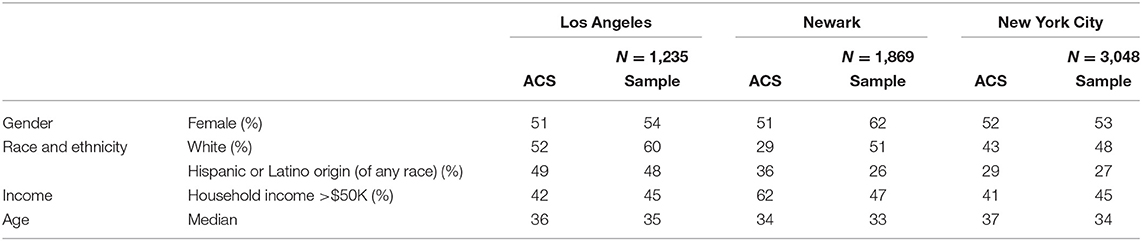
Table 1. Sample distribution of key demographic variables compared to the American Community Survey (ACS) 5-year estimates (US Census Bureau, 2015–2019).
While the survey collected data on numerous topics, we focused on UA data in this research. In addition to data on participant demographics, data on UA participation analyzed here were collected from participants using two questions. They were as follows:
Q1. Do you typically grow some of your own fresh produce (e.g., fruits and vegetables) at home or at a community garden?
Response options:
1. Yes.
2. No.
Q2. Where do you typically grow your own fresh produce (e.g., fruits and vegetables)? (Select all that apply).
Response options:
1. Indoor garden in my home (e.g., container gardening in the kitchen, porch, patio, or balcony).
2. Outdoor garden in my home's yard (in-ground or raised beds).
3. Community garden away from my home (in-ground or raised beds).
For our analysis, those reporting UA participation were classified into four mutually exclusive gardening categories: indoor home, outdoor home, community, and a combination (those engaged in two or three of the other categories). Table 2 shows the number and percentage of participants in the four groups by city.
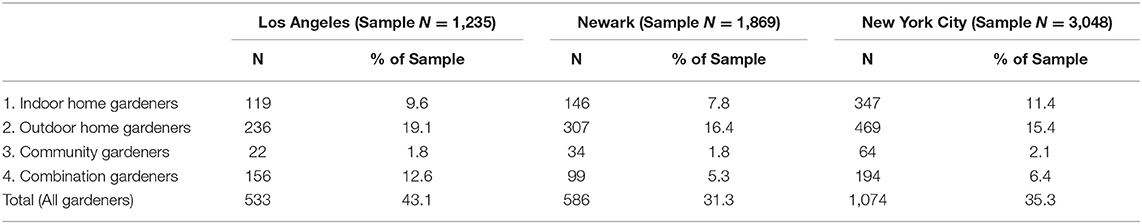
Table 2. Survey participants in the four mutually exclusive gardening categories (indoor home, outdoor home, community, and combination) by city.
The demographics of people who reported participating in UA to grow their own fresh produce (as shown in Figure 1) were explored by first calculating the percentage of each demographic group engaged in the four gardening categories; then, t-tests (with 95% CI) were conducted for comparisons across pairs by income (high/low), education, race (White vs. non-White), gender, living with spouse/partner, homeownership, and housing type. For a demographic comparison of those who garden compared to the general population/survey sample (see Figure 2), the sample was divided into eight mutually exclusive demographic groups, as shown in Table 3. The percentage of each group reporting the various categories of gardening was then compared to the percentage in the sample for each city using t-tests (with 95% CI), as shown in Figure 2.
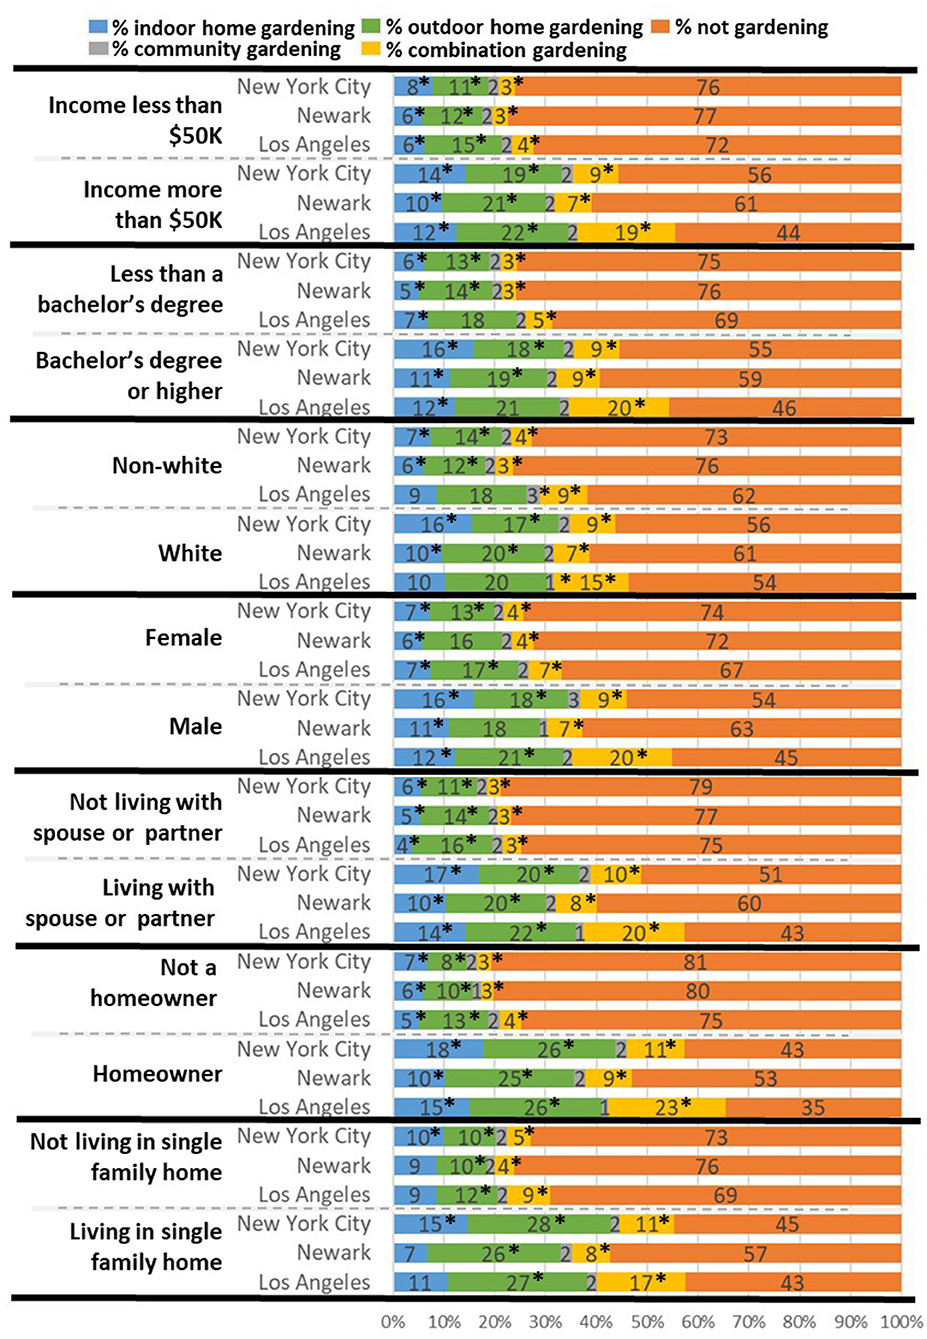
Figure 1. Demographic group comparisons of those engaged in urban agriculture by gardening category. Comparisons are across pairs for each gardening category by income (high/low), education, race (White vs. non-White), gender, living with spouse/partner, homeownership, and housing type. *statistical significance across pairs at 95% CI.
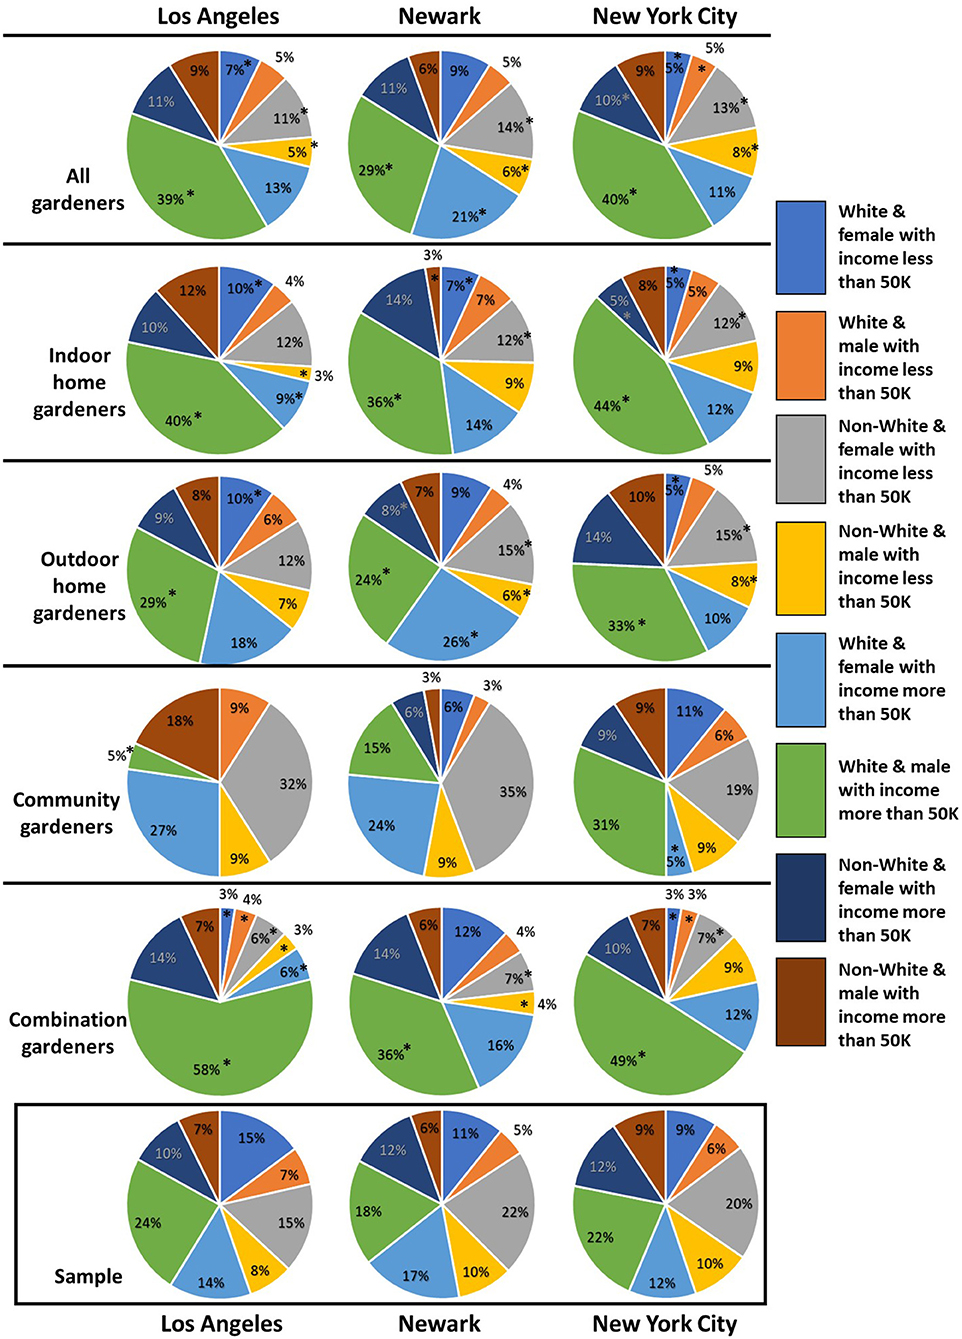
Figure 2. Percentage of agricultural gardeners represented as eight mutually exclusive demographic groups based on race, gender and income. Compares all gardeners, indoor, outdoor, community, and combination gardeners in three cities to the sample. All gardeners include all four mutually exclusive gardening categories (indoor, outdoor, community, and combination gardeners) *statistical significance at 95% CI relative to the survey sample.
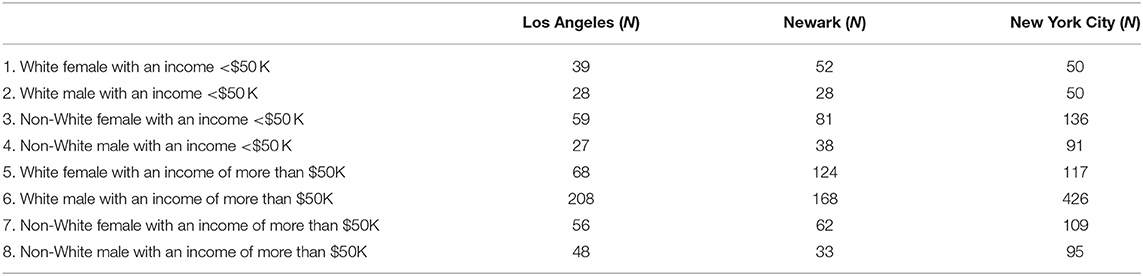
Table 3. Survey participants that garden according to the eight mutually exclusive demographic groups by city.
Potential predictors of gardening to grow fresh produce were assessed using multivariate logistic regression in which engaging in overall (all gardeners), indoor and outdoor home, and combination gardening were the dependent variables and select demographic characteristics were the independent variables. The community gardeners were excluded from the regression analysis due to their low representation in the sample. Based on the gardening categories and cities studied, 12 models were estimated.
Our survey of 6,152 urbanites in NYC, LA, and Newark was designed to broadly represent each city's population distribution by gender, race/ethnicity, income, and age, as illustrated in Table 1.
In the context of participation in UA, 43% of the participants in LA, 31% in Newark, and 35% in NYC reported engaging in agricultural gardening. We further assessed participation in four mutually exclusive gardening categories: indoor home, outdoor home, community, and a combination. Consistently across the three cities, only ~2% of the survey population was engaged in community gardening. The percentage ranges for household gardening were 15–19% for outdoor settings and 8–11% for indoor settings in the three cities (see Table 2).
To evaluate the demographics of those who reported gardening in the different types, we conducted pairwise comparisons (see Figure 1) by income, education, race, gender, living with spouse/partner, homeownership, and housing type. Across all the cities, participants with higher income and living with a spouse/partner, homeowners, and those with higher education had a higher statistically significant proportion participating in household indoor and outdoor gardening (with the exception of outdoor home gardening in LA). Likewise, a higher proportion of male participants reported gardening compared to their female counterparts for all types except (i) community gardening in all cities and (ii) outdoor home gardening in Newark. In terms of racial differences, a higher proportion of White respondents reported household indoor and outdoor gardening compared to non-Whites in NYC and Newark. As might be expected, across all cities, a higher proportion of participants living in single-family homes were engaged in outdoor gardening. Finally, the number of community gardeners in the sample was too low in the three cities to draw statistically significant differences by demographics in all cases except community gardening in LA, where the proportion of non-White participants was higher than their White counterparts and their proportion in the survey sample. These results suggest that community gardening may engage more diverse participants.
For a demographic comparison of those who gardened, the sample was divided into eight mutually exclusive groups (Table 3) and compared to the sample. Figure 2 shows that White men with incomes of more than $50K by far comprised the largest proportion of household and combination gardeners in all three cities (the only exception was outdoor gardeners in Newark). This population segment (i.e., higher-income White men) showed a greater proportion engaged in gardening compared to their proportion in the survey sample. These data were the first to exhibit demographic disparities in gardening across multiple cities. In contrast, other patterns were city specific. A lower percentage of non-White women with incomes of <$50 K reported indoor, outdoor, and combination gardening in Newark and NYC compared to the sample. Similarly, a lower percentage of White women with incomes of <$50 K reported indoor, outdoor, and combination gardening in LA and NYC compared to the sample. In addition, a lower percentage of White men and women with incomes of more than $50 K reported community gardening in LA and NYC, respectively. Except for community gardening, White men and women with incomes of more than $50 K constituted between 43 and 64% of all gardeners across all cities, while their numbers in the sample were in the 34–38% range. While not statistically significant, for community gardeners in LA and Newark, non-White women with incomes of <$50 K were the largest group, followed by White women with incomes of more than $50K. These results suggest that although community gardening can reach a smaller proportion of the population, it may have great potential in reaching lower-income, women, and minority gardeners. These results also demonstrate the value of gathering city-specific and demographic data by gardening typology.
As shown in Table 4, the potential demographic predictors of gardening were assessed using multivariable logistic regression. Based on the data available and consideration of multicollinearity, the potential demographic predictors of gardening tested included race, income, education, gender, living with a spouse/partner, age, and homeownership. The significance level for the results was set at p = 0.05. Models were estimated for all gardeners, indoor home gardeners, outdoor home gardeners, and combination gardeners by city. Community gardening was excluded from the regression analysis due to the limited size of the sample in that category.
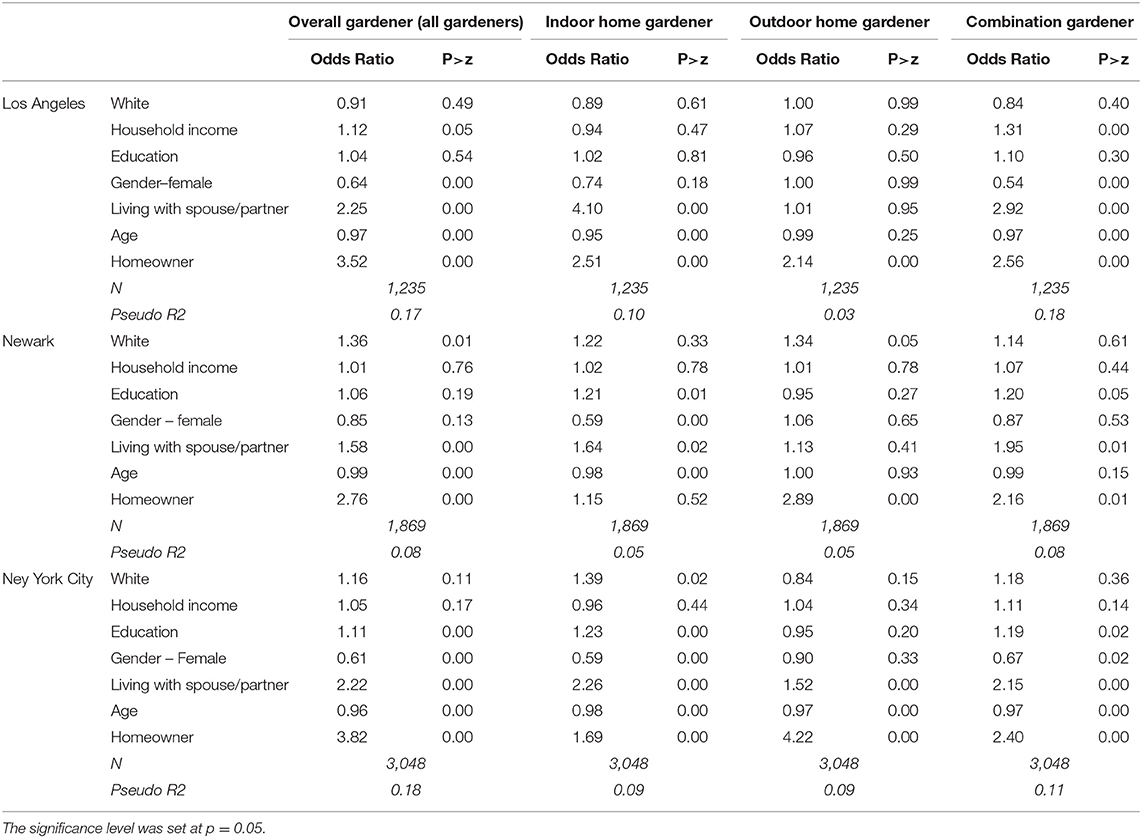
Table 4. Multivariate logistic regression results assessing potential demographic predictors of overall (all gardeners), indoor, outdoor, and combination gardening across three cities (12 models).
First, we identified predictors of gardening types that were consistent across all the cities. For overall (all gardening types) and indoor home gardening across all cities, homeownership increased the odds of being a gardener, even after controlling for income, gender, education, and race. Similarly, living with a spouse/partner increased the odds of being an overall or indoor home gardener across all cities. In contrast, age reduced the odds of being an overall or indoor home gardener across all cities. This aligns with findings from previous studies suggesting that older participants typically have to reduce gardening related physical exertion for their health (Blaine et al., 2010; Grebitus, 2021). Finally, only homeownership increased the odds of being an outdoor gardener across all the cities.
Other predictors of different gardening types were city-specific, highlighting the importance of localized context-sensitive data. Being White increased the odds of being an overall (all gardening types) or outdoor home gardener in Newark, an indoor home gardener in NYC, but was not a predictor of any type of gardening in LA. Having a higher level of education in Newark and NYC increased the odds of being an indoor gardener, but did not predict any type of gardening in LA. In terms of gender, being female lowered the odds of being an overall or combination gardener in LA; indoor home gardener in LA; and overall, indoor home, or combination gardener in NYC. The gender-based findings align with limited existing city-specific studies that find that women tend to focus more on ornamental gardening than gardening to grow produce (Philpott et al., 2020; Grebitus, 2021). However, the multi-city nature of the data used in this research was able to highlight that this relationship was not consistent and can vary by city and gardening type.
First, it is important to highlight the limitations of our study. While our study was aimed at exploring who gardens (demographics) and how (gardening type) in the United States, the data limitations did not allow us to explore why the relationships we found existed. For example, we found that homeownership consistently increased the odds of gardening, even after controlling for confounding variables; however, based on our data, we did not have the ability to explore why this was so. However, in the discussion, wherever possible, we draw links to the existing literature for potential explanations. Also, the analysis of community gardeners in this study was limited due to their apparently low numbers in the cities studied (~2% of the sample reported being engaged in community gardening), and we acknowledge the need for further demographic analysis, with larger samples, to further explore the potential of community gardening to advance social equity.
Despite these limitations, our results showcase important trends and insights for policymakers interested in designing more equitable UA policies. In the US context, some findings were consistent across cities.
First, a very small proportion of the general population engaged in community gardening (~2%), although this segment exhibited more demographic diversity and included a greater proportion of underserved population groups, such as racial minorities. Low participation in community gardening was not surprising, given the time and resources (financial and material) needed to maintain a productive gardening plot and the fact that many community gardens in the US are member-only gardens with long waiting lists that make entry a barrier (Meenar and Hoover, 2012).
Second, individuals with higher education and income, those living with a spouse/partner, homeowners and, more specifically, White men who earn more than $50 K represented the largest segment of household and combination gardeners. These results, along with other studies that suggested a higher likelihood of lower-income residents participating in community gardening (Grebitus, 2021) suggest that if UA is to advance social equity, one avenue is to expand such community gardening efforts (which is already on the agenda of many cities). However, our results show that even doubling community gardening is unlikely to reach more than ~5% of the population.
Therefore, from a policy perspective, if community gardening is to be used as a tool to promote social equity by engaging underserved population groups, it is important for cities to provide residents with easy and wait-free access to community gardens where they can engage in UA. This need is reflected in plans such as the Greater Pittsburgh Food Action Plan, which recommends increasing access to land and capital for farmers of color (Pittsburgh Food Policy Council, 2020). Additionally, it is important to identify barriers to participation that are unique to underserved population groups. For example, a study in Philadelphia found that residents of poor neighborhoods faced significant barriers to accessing information regarding community gardens due to a lack of access to digital technologies, which are often the preferred mode of communication and outreach (Meenar and Hoover, 2012). Therefore, making information and outreach about community gardening more accessible (using diverse media) could potentially boost interest and participation in low-income minority neighborhoods.
Another avenue indicated by our data is to focus on understanding why underrepresented groups (i.e., low-income individuals, women, and minorities) are not engaging in household gardening, as increasing participation in this type of gardening may be more fruitful for scaling up UA, given the higher percentage of household gardeners. The results of this study provide some indication of factors that may inhibit or promote household gardening. In alignment with existing national data (National Gardening Association Research Division, 2021) and city-specific studies (Grebitus, 2021), we found that homeownership increased the odds of gardening across all three cities for the home-based and combination gardening typologies. The association of gardening with homeownership, along with higher education and income, suggests that economic advantage may play a part in an individual's ability to participate in UA. This advantage can include time, money, and reliable access to land (Smith et al., 2013). Additionally, historical patterns of homeownership in the United States, in which a higher percentage of White households own homes (e.g., 73.1% in the second quarter of 2019 compared to 40.6% for Black households) (Haughwout et al., 2020), suggest that institutionalized race- and class-based disparities may also be prevalent in UA participation (Cohen and Reynolds, 2014; Reynolds, 2015). While improving the homeownership, income, and education of underrepresented groups may be beyond the scope of UA policy makers, carefully designed programs can address some of the barriers these groups face in participating in household gardening. For example, to address the issue of a lack of access to outdoor gardening space, Seattle's Urban Garden Share program connects gardeners who lack access to growing space with local residents with available space (Young et al., 2018).
Additionally, the city-specific findings indicated the critical need for context-sensitive data collection to inform UA policy making and promotion. For example, in NYC, a lower percentage of non-White women with incomes <$50 K engaged in home-based gardening relative to the sample, which was not the case in LA. Finally, with gardening classified into four typologies, the findings highlighted the value of more granular data on gardening as key distinctions between typologies, the demographics engaged in them, and their predictors are lost if studied together.
To the best of our knowledge, our study is the first to exhibit demographic disparities in UA across multiple cities and gardening types using a representative sample. Overall, our results support concerns regarding UA's ability to address issues related to social equity due to race- and class-based disparities that may perpetuate systemic inequities in UA accessibility, participation, and the distribution of associated benefits (Meenar and Hoover, 2012; Reynolds, 2015; Rosan and Pearsall, 2017), making it an elite hobby/activity. Across the three cities, the effectiveness of UA in promoting social equity is questionable, as the most vulnerable constitute only a minority of those gardening. Previous studies that focused on the equity benefits of UA are typically not representative of the population of the cities in which they were conducted, or are project-specific (e.g., looking at a single or a group of community gardens) (Philpott et al., 2020; Grebitus, 2021), thereby missing the actual demographics of the UA participants, which limits the ability of cities to plan for and successfully implement UA projects.
Because existing research points to the benefits of UA, particularly for low-income and minority groups (Algert et al., 2016; Santo et al., 2016; Sickler, 2018; Ambrose et al., 2020), there is a drastic need for research and data-driven policies specific to these groups that reduce barriers to UA participation. In this research, by using a novel, multi-city study, we are able to assess participation in community and home-based UA while identifying commonalities and differences across cities. Additionally, as we identified the demographics of participants across different types of gardening, the results of our study allow policy makers to better identify underserved populations and design tailored policies and/or evaluate existing policies to enhance UA engagement based on local and context-sensitive UA needs/goals. More specifically, policies and data collection to promote equity in UA could be connected with the social purpose of UA, which is often stated as improving nutrition, food security, health and wellbeing, and social equity.
Future surveys could therefore include not only demographic and gardening types, but also the purpose of gardening and outcomes related to health and nutrition so that urban food action plans and agricultural policies can be fine-tuned to local demographic and participation patterns. Expanding such an analysis across multiple cities in the US and beyond will help in understanding who gardens and how, informing future UA polices.
Finally, as food policy councils are formed in cities, it is important to recognize that there may be a natural inclination or tendency for them to be populated with the majority segments engaged in UA. For example, to create collaborative, inclusive equitable food policies, the city of Baltimore initiated the Resident Food Equity Advisors (RFEA) program, which brings together diverse cohorts of residents (Pittsburgh Food Policy Council, 2020). Such efforts to engage not only with mainstream participants but also less represented groups across different urban gardening typologies can advance both procedural and distributive equity (Sovacool et al., 2016; Tong et al., 2021; Clark et al., 2022) and thereby contribute to advancing social justice in food action plans.
The data supporting the conclusions of this article are available from the corresponding author upon reasonable request.
The studies involving human participants were reviewed and approved by Institutional Review Board, Princeton University. The patients/participants provided their written informed consent to participate in this study.
KD and AR equally contributed to the study and survey design, data analysis, writing of the paper, and design of graphics. KD conducted field implementation of the survey with primary advising from AR. Both authors contributed to the article and approved the submitted version.
This study was funded by an Agriculture and Food Research Initiative (AFRI) grant from the National Institute of Food and Agriculture at the United States Department of Agriculture (Grant No. 2019-67019-30463). Additional funding was provided through an internal research grant at Princeton University.
The authors declare that the research was conducted in the absence of any commercial or financial relationships that could be construed as a potential conflict of interest.
All claims expressed in this article are solely those of the authors and do not necessarily represent those of their affiliated organizations, or those of the publisher, the editors and the reviewers. Any product that may be evaluated in this article, or claim that may be made by its manufacturer, is not guaranteed or endorsed by the publisher.
Algert, S., Diekmann, L., Renvall, M., and Gray, L. (2016). Community and home gardens increase vegetable intake and food security of residents in San Jose, California. Calif. Agric. 70, 77–82. doi: 10.3733/ca.v070n02p77
Ambrose, G., Das, K., Fan, Y., and Ramaswami, A. (2020). Is gardening associated with greater happiness of urban residents? a multi-activity, dynamic assessment in the Twin-Cities region, USA. Landsc. Urban Plan. 198, 103776. doi: 10.1016/j.landurbplan.2020.103776
Ayuk, E. T., Ramaswami, A., Teixeira, I., Akpalu, W., Eckart, E., Ferreira, J., et al. (2022). Urban Agriculture's Potential to Advance Multiple Sustainability Goals: An International Resource Panel Think Piece, Nairobi: United Nations Environment Programme. Available online at: https://www.unep.org/resources/publication/urban-agricultures-potential-advance-multiple-sustainability-goals (accessed February 24, 2022).
Blaine, T. W., Grewal, P. S., Dawes, A., and Snider, D. (2010). Profiling community gardeners. J. Ext. 48, 1–12.
Braveman, P. (2006). Health disparities and health equity: concepts and measurement. Annu. Rev. Public Health 27, 167–194. doi: 10.1146/annurev.publhealth.27.021405.102103
City of Columbus Franklin County Ohio (2021). Local Food Action Plan - 2020 Annual Report, City of Columbus. Available online at: https://www.columbus.gov/uploadedFiles/Columbus/Departments/Public_Health/All_Programs/Local_Food_Plan/LFAP_2020AnnualReport_4.13.2021.pdf (accessed March 1, 2022).
City of Denver (2017). Denver Food Vision. Denver, CO. Available online at: https://www.denvergov.org/content/dam/denvergov/Portals/771/documents/CH/Final_FoodVision_120717.pdf (accessed March 1, 2022).
City of Seattle (2013). Food Action Plan. Seattle. Available online at: https://www.seattle.gov/environment/sustainable-communities/food-access/food-action-plan (accessed March 1, 2022).
Clark, L. P., Tabory, S., Tong, K., Servadio, J. L., Kappler, K., Xu, C. K., et al. (2022). A data framework for assessing social inequality and equity in multi-sector social, ecological, infrastructural urban systems: focus on fine-spatial scales. J. Ind. Ecol. 26, 145–163. doi: 10.1111/jiec.13222
Cohen, N., and Reynolds, K. (2014). 'Urban agriculture policy making in New York's “New Political Spaces” strategizing for a participatory and representative system. J. Plan. Educ. Res. 34, 221–234. doi: 10.1177/0739456X14526453
Dorr, E., Koegler, M., Gabrielle, B., and Aubry, C. (2021). Life cycle assessment of a circular, urban mushroom farm. J. Clean. Prod. 288, 125668. doi: 10.1016/j.jclepro.2020.125668
Goldstein, B., Hauschild, M., Fernández, J., and Birkved, M. (2016). Urban versus conventional agriculture, taxonomy of resource profiles: a review. Agron. Sustain. Dev. 36, 9. doi: 10.1007/s13593-015-0348-4
Grebitus, C. (2021). Small-scale urban agriculture: drivers of growing produce at home and in community gardens in Detroit. PLoS ONE 16, e0256913. doi: 10.1371/journal.pone.0256913
Haughwout, A. F., Lee, D., Scally, J., and Van der Klaauw, W. (2020). Inequality in US Homeownership Rates by Race and Ethnicity. New York, NY: Liberty Street Economics; Federal Reserve Bank of New York.
Horst, M., McClintock, N., and Hoey, L. (2017). 'The intersection of planning, urban agriculture, and food justice: a review of the literature. J. Am. Plann. Assoc. 83, 277–295. doi: 10.1080/01944363.2017.1322914
Krikser, T., Piorr, A., Berges, R., and Opitz, I. (2016). Urban agriculture oriented towards self-supply, social and commercial purpose: a typology. Land 5, 28. doi: 10.3390/land5030028
Meenar, M., and Hoover, B. (2012). Community food security via urban agriculture: Understanding people, place, economy, and accessibility from a food justice perspective. J. Agric. Food Syst. Community Dev. 3, 143–160. doi: 10.5304/jafscd.2012.031.013
Milan Urban Food Policy Pact (2020). Milan Urban Food Policy Pact. Available online at: https://www.milanurbanfoodpolicypact.org/ (accessed February 10, 2022).
National Gardening Association Research Division (2021). National Gardening Survey 2021. Available online at: https://gardenresearch.com/view/national-gardening-survey-2021-edition/ (accessed February 10, 2022).
Philpott, S., Egerer, M., Bichier, P., Cohen, H., Cohen, R., Liere, H., et al. (2020). Gardener demographics, experience, and motivations drive differences in plant species richness and composition in urban gardens. Ecol. Soc. 25, 8. doi: 10.5751/ES-11666-250408
Pittsburgh Food Policy Council (2020). Greater Pittsburgh Food Action Plan, City of Pittsburgh. Available online at: https://foodactionplan.org/ (accessed May 20, 2022).
Reynolds, K. (2015). Disparity despite diversity: Social injustice in New York City's urban agriculture system. Antipode 47, 240–259. doi: 10.1111/anti.12098
Rosan, C. D., and Pearsall, H. (2017). Growing a Sustainable City?: The Question of Urban Agriculture. Toronto, ON: University of Toronto Press.
Santo, R., Palmer, A., and Kim, B. (2016). Vacant Lots to Vibrant Plots: A Review of the Benefits and Limitations of Urban Agriculture. Baltimore, MD, USA: Johns Hopkins Center for a Livable Future.
Sickler, J. (2018). Homegrown Program Evaluation Results: 2015-2017. Available online at: https://static1.squarespace.com/static/56283119e4b081f403bf3d40/t/5abea8cb8a922d9f461392ed/1522444491822/Phipps+-+Homegrown+Final+Evaluation+Report+2017+-+FINAL.pdf (accessed March 1, 2022).
Smith, V. M., Greene, R. B., and Silbernagel, J. (2013). The social and spatial dynamics of community food production: a landscape approach to policy and program development. Landsc. Eco. 28, 1415–1426. doi: 10.1007/s10980-013-9891-z
Sovacool, B. K., Heffron, R. J., McCauley, D., and Goldthau, A. (2016). Energy decisions reframed as justice and ethical concerns. Nat. Energy 1, 1–6. doi: 10.1038/nenergy.2016.24
The City of New York (2021). Food Forward NYC: A 10-Year Food Policy Plan, City of New York. Available online at: https://www1.nyc.gov/assets/foodpolicy/downloads/pdf/Food-Forward-NYC.pdf (accessed March 1, 2022).
Tong, K., Ramaswami, A., Xu, C. K., Feiock, R., Schmitz, P., and Ohlsen, M. (2021). Measuring social equity in urban energy use and interventions using fine-scale data. Proc. Natl. Acad. Sci. 118, e2023554118. doi: 10.1073/pnas.2023554118
Keywords: urban agriculture, urban agriculture policy, sustainable food systems, social equity, community agricultural gardening, household agricultural gardening, participant demographics, multi-city
Citation: Das K and Ramaswami A (2022) Who Gardens and How in Urban USA: Informing Social Equity in Urban Agriculture Action Plans. Front. Sustain. Food Syst. 6:923079. doi: 10.3389/fsufs.2022.923079
Received: 18 April 2022; Accepted: 01 June 2022;
Published: 06 July 2022.
Edited by:
Chris Duvall, University of New Mexico, United StatesReviewed by:
Jana Siftova, Charles University, CzechiaCopyright © 2022 Das and Ramaswami. This is an open-access article distributed under the terms of the Creative Commons Attribution License (CC BY). The use, distribution or reproduction in other forums is permitted, provided the original author(s) and the copyright owner(s) are credited and that the original publication in this journal is cited, in accordance with accepted academic practice. No use, distribution or reproduction is permitted which does not comply with these terms.
*Correspondence: Anu Ramaswami, YW51LnJhbWFzd2FtaUBwcmluY2V0b24uZWR1
†These authors have contributed equally to this work and share first authorship
Disclaimer: All claims expressed in this article are solely those of the authors and do not necessarily represent those of their affiliated organizations, or those of the publisher, the editors and the reviewers. Any product that may be evaluated in this article or claim that may be made by its manufacturer is not guaranteed or endorsed by the publisher.
Research integrity at Frontiers
Learn more about the work of our research integrity team to safeguard the quality of each article we publish.