 Yuksel Bayram1*
 Cigdem Elgin Karabacak2
- 1Food Technology, Department of Food Processing, Cal Vocational High School, Pamukkale University, Denizli, Turkey
- 2Organic Agriculture, Department of Food Processing, Cal Vocational High School, Pamukkale University, Denizli, Turkey
Thinning pruning is a process in modern viticulture to improve product quality when grapes are still in the immature fruit stage. Unripe grapes, which are waste, are mostly consumed locally as verjuices to meet domestic demand. This study aims to optimize a more efficient “green” technique for the extraction of total phenolic compounds (TPC) and antioxidant capacity (AC) from three varieties of unripe grape juice by response surface method (RSM) using ultrasound-assisted extraction (UAE). The influence of temperature (25–65°C) and extraction time (5–30 min) on total phenolic content (TPC) and antioxidant capacity (DPPH and CUPRAC) was investigated. In this study, physicochemical properties, mineral composition, phenolic and organic acid components of three different verjuices were also investigated. As a result, the optimal extraction points for extraction time (12 min) and temperature (30°C) were determined. All independent variables were found to be significantly effective on TPC and AC content during UAE. Verjuices are a rich source of antioxidants, phenols, organic acids, minerals, and vitamin C. This study is expected to contribute to the evaluation of unripe grape wastes, which are very rich in bioactive components, and to increase its economic potential by expanding local production, thus contributing to sustainable agri-food processing.
Introduction
Grapevine (Vitis vinifera L.) is cultivated on an area of 7.341.771 hectares worldwide and (OIV, 2019) on an area of 4.009.979 decares in Turkey (TUIK, 2020). To increase the grain size and weight of grapes, to facilitate the control of diseases and pests, and to obtain quality products in viticulture, thinning pruning of grapes is carried out while the grapes are in veraison which is the stage before the grapes begin to ripen (Drevelegka and Goula, 2020). The dilution rate is around 30%, as a result of throwing the pruned clusters into the field, rot occurs, which causes the spread of diseases and pests, and soil and environmental pollution problems (Carmona-Jiménez et al., 2021). The production of value-added products from waste products can benefit the infrastructure development, transportation, food processing, and packaging industries (Torres-León et al., 2018). It is of great importance that unripe grapes in the waste state, which are rich in bioactive components, are an important source of raw materials for the conversion into high value-added products in the food, cosmetics, and pharmaceutical industries.
Grapes are one of the most widely grown crops in the world, with more than 80% of the yield coming from the wine industry (Drevelegka and Goula, 2020). The unripe grapes are called “koruk” in Turkey, “agraz” in Spanish and German, “verjuice” in English, “abe-ghureh” in Persian, “verjus” in French, and “agresto” in Italian (Öncül and Karabiyikli, 2015; Turkmen et al., 2019). Verjuices is an unfermented green grape juice that is rich in phenolic substances and has an acidic and pleasant taste. It is obtained by pressing unripe grapes using physical pressure (De Matos et al., 2017; Özturk and Şengun, 2019). Australia, New Zealand, South Africa, the United States, and Spain were among the first countries in the world to grow and use unripe grapes (Fia et al., 2021).
Verjuice is a good alternative with the same acid-base balance as lemon and vinegar and can be used as an acidifier in foods (De Matos et al., 2019) and as a flavoring ingredient (Hildebrandt and Matchuk, 2003). In recent years, it has been used to prevent the enzymatic browning of fruits and vegetables (Tinello and Lante, 2017). It is also a common ingredient in Turkish sorbets (Ekici et al., 2018; Fia et al., 2021).
Verjuice is made from unripe grapes and contains compounds similar to those found in grape juice. It contains water, carbohydrates, protein, potassium, calcium, sodium, iron, phosphorus, ascorbic acid thiamine, niacin, and riboflavin (Fia et al., 2021). Unripe grapes have antioxidant and antimicrobial effects due to their rich structure of organic acids and phenolic compounds such as malic acid, tartaric acid, catechin, caffeic acid, gallic acid, and quercetin (De Matos et al., 2017; Özturk and Şengun, 2019; Turkmen et al., 2019). The physicochemical properties of grapes are influenced by grape variety, ripening time, and environmental conditions (Ahmadi and Romney, 2014). The groves are harvested about 45 days after flowering (Hayoglu et al., 2009), they should be harvested before ripening to prevent the decline of sugar content, polyphenols, and organic acids (Soyer et al., 2003; De Matos et al., 2017). Yediveren, Kabarcik and Thompson seedless grape varieties are generally used in the production of verjuice. The “ripeness index” of unripe grape (total soluble solids [Brix°] / acidity ratio) determines when it should be harvested (Palomo et al., 2007). Grapes undergo great changes during the ripening process, especially in terms of total acidity and phenolic content. Unripe grapes had titration acidity levels about ten times higher than ripe grapes. The total number of phenolic compounds varies based on the year of production, ripening duration, grape variety, and grape components, according to several studies, and the total amount of phenolic compounds decreases during the ripening process (Öztürk and Şengün, 2021).
Phenolic compound concentration is affected by grape variety, geographic location, climate, soil characteristics, and process technology (Torres-León et al., 2016). Variability in extraction yields depends on temperature, extraction time, and solvent type (Torres-León et al., 2017). Conventional extraction methods such as mechanical mixing may be ineffective in the extraction of some phenolic compounds. Proteins, polysaccharides, and cell walls may be esterified or entrapped with phenolics that cannot be extracted. Ultrasound-assisted extraction (UAE), a green extraction technique, is a non-traditional approach to recovering phenolic chemicals from grape marc. The phenomenon of cavitation, in which bubbles implode in a liquid medium, resulting in rapid adiabatic compression of gasses and vapors within the bubbles and allowing solvent penetration, is the most common consequence of ultrasound (Drevelegka and Goula, 2020).
In studies on its effects on human health, verjuice has been found to protect against cardiovascular disease and to have blood pressure, cholesterol, and lipid-lowering properties (Setorki et al., 2010). It is also used to combat atherosclerosis, promote digestion, and treat ulcers (ZibaeeNezhad et al., 2012; Shojaee-Aliabadi et al., 2013). In addition, verjuices with a highly acidic structure have antimicrobial capacity (Özturk and Şengun, 2019).
To date, there are many studies on the bioactive compounds of grapes and their juices. However, there are few studies (Hayoglu et al., 2009; Öncül and Karabiyikli, 2015) on verjuices (red/white; seedless/seeded) from local grape varieties grown in Turkey.
The aim of this study is to determine the phenolic compound and antioxidant capacity of Yediveren (dark red/seeded), Cal Karasi (black/seeded), and Sultaniye (white/seedless), indigenous grape varieties that are widely grown in Denizli province in the Aegean region of Turkey, using an optimization method. This study also provides comprehensive information on the physicochemical properties, mineral composition, phenols, organic acidity, and vitamin C of three different unripe grapes juice.
Materials and Methods
Material, Standards, and Reagents
In the study, the verjuices of 3 different unripe grape varieties were examined. The characteristics of these cultivars are shown in Table 1 and their images are shown in Figure 1. Grapes of local grape varieties were harvested at the end of June weighing 10 kg for each variety from different vineyard plots in Cal district, Denizli (38°4′58″N 29°23′46″E; elevation 851 m). Unripe grapes were harvested before the veraison, the stage before the grapes began to ripen. The unripe grapes were washed and drained before freezing at −20°C. All chemicals used in the tests were purchased from Merck and were of analytical grade (Darmstadt, Germany). Gallic acid (CAS No:149-91-7)−6-Hydroxy-2,5,7,8-tetramethylchromane-2-carboxylic acid (Trolox) (CAS No:53188-07-1), obtained from Sigma-Aldrich (Germany). The ascorbic acid (C6H8O6) standard (Cas No: 50-81-7) was purchased from Carlo Erba (France). The ICP-MS standard solutions were purchased from Perkin Elmer (USA). The HPLC standards were provided by Sigma-Aldrich (Steinheim, Germany).
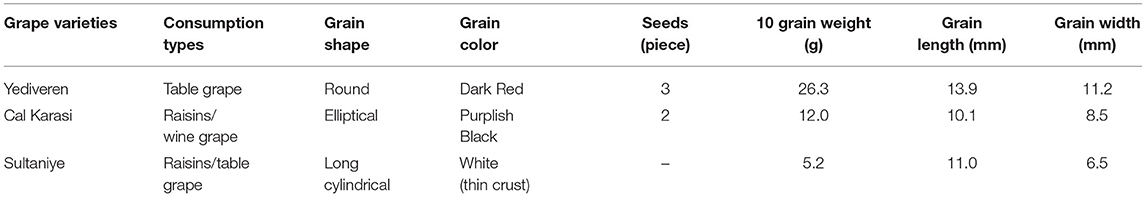
Table 1. Characteristics of grape varieties used in the experiment.
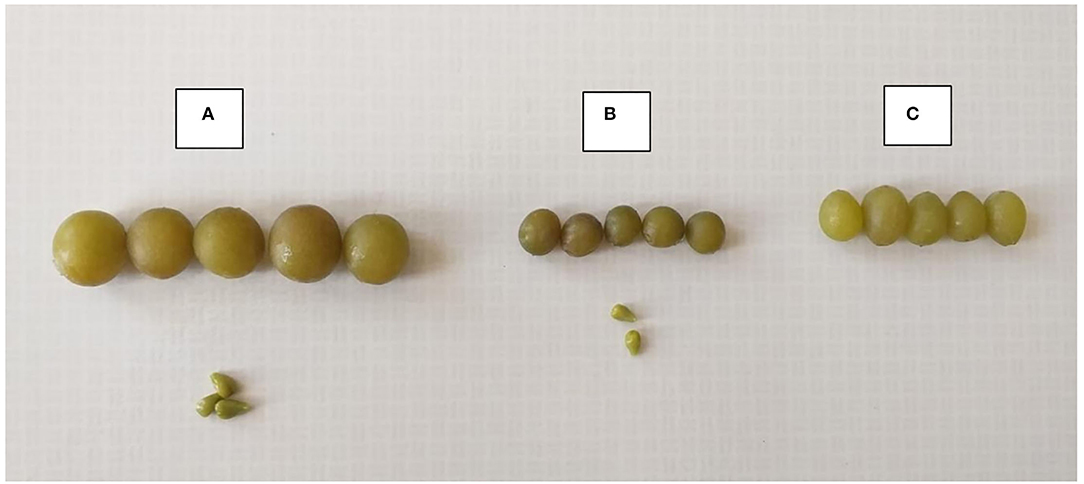
Figure 1. General view of the grape varieties used in the experiment. (A) Yediveren, (B) Cal Karasi, (C) Sultaniye.
Physicochemical Analysis
Verjuices, unripe grapes (Yediveren, Çal Karasi, and Sultaniye) used in the chemical analysis were taken out of the freezer at −20°C and prepared by crushing after their ice melted. Verjuices obtained after filtration (2.5 μm filters) were used in the analyses.
°Brix values of the verjuices were determined using a portable refractometer (Atago PAL-1 Pocket Refractometer, Japan) calibrated with distilled water. The results were expressed as °Brix. The acidity of the samples was titrated with 0.1 N NaOH to a pH of 8.1, using 10 mL of verjuices. The results were expressed as malic acid equivalent and the pH of the verjuices was also determined using a pH meter calibrated with buffer solution (Ohaus Starter 3100, USA).
Color analysis was determined using a CIELAB colorimeter (ColorFlex EZ Standard Box s/n: CFEZ 1010, HunterLab, USA) and expressed as L*, a*, and b* values. The color brightness of the samples (L*), red-green (a*), yellow-blue (b*) were expressed. The color measurements were performed at 3 parallel sites and the average values were calculated from the average of the determined values.
The content of chlorophyll a, chlorophyll b and carotenoids was determined according to the method proposed by Nagata and Yamashita (1992). After all pigments in the samples were extracted with acetone (90%), the optical density of the supernatant was measured with a spectrophotometer at 663 nm, 645 nm, 505 nm, and 453 nm. Chlorophyll a, chlorophyll b content, and carotenoid levels were calculated using the following equations (Equation 1).
Determination of Extraction Yield
The juice yield of the unripe grapes was determined by dividing the weight of the juice by the weight of the fresh fruit (Equation 2).
Experimental Design and Statistical Model
Ultrasound-assisted extraction (UAE) of three types of unripe grape juice was optimized using the response surface approach. The influence of temperature (25–65°C) and extraction time (5–30 min) on total phenolic content (TPC) and antioxidant capacity (DPPH and CUPRAC) was investigated. A total of 11 experiments were obtained by using the Design-Expert 7.0.0 (Minneapolis, USA). Table 4 shows the experimental design and optimization results. In order to limit the effects of random influences on the results, the tests were performed in a randomized order.
Extraction Process
Unripe grapes (Yediveren, Çal Karasi, and Sultaniye) were taken out of the freezer at −20°C and crushed after the ice melted to prepare verjuices. The extractions of the verjuices with their pulp were performed in an ultrasonic water bath (GREATSONIC Ultrasonic Cleaner/ GS -DS360-P, China) with distilled water (10 g/100 ml) according to the parameters of temperatures ranging from 25 to 65°C between 5 and 30 min extraction time, which were determined by the Response Surface Method (RSM). After filtration (2.5 μm filters), the obtained extracts were stored in bottles at −20°C until analysis.
Determination of Total Polyphenols (TPC) and Antioxidant Capacity (DPPH and CUPRAC) According to RSM
TPC was measured spectrophotometrically in verjuices extracts using the Folin-Ciocalteu technique (Singleton et al., 1999). Gallic acid (50–500 mg/L) was used to calibrate a standard curve. Results were expressed in gallic acid equivalents mg (GAE)/g.
The radical scavenging capacity (DPPH) was measured using a spectrophotometer (Shimadzu UV-1800 spectrophotometer, Japan) at 517 nm according to the method published by Singh et al. (2002). 4.9 mL of DPPH solution was added to a 0.1 mL sample (0.1 mM). The mixture was then kept at 27°C for 25 min. The DPPH radical inhibition rates (% inhibition) of the sample for each application were calculated according to Equation 3.
Copper reduction capacity (CUPRAC) was calculated according to the method proposed by Apak et al. (2004). A test tube was filled with 1 mL of neocuproine (7.5 mM), CuCI2 (0.01 M), and 1 M NH4COOH buffer solution (pH 7.0). The test tube was then filled with 0.1 mL verjuice extracts and 1 mL pure water. The sample solutions were combined and the reaction was run for 1 h at 25°C in a dark environment. A spectrophotometer was used to measure the absorbance of the resulting solution at 450 nm (Shimadzu UV-1800 spectrophotometer, Japan). With a linear range of 0.025–0.8 mg/mL (r2 = 0.99), the results were expressed as mg Trolox equivalents (TE)/L in sample. All experiments were performed three times.
HPLC Analysis of Organic Acids and Phenolic Compounds
Verjuices were extracted with UAE according to the optimum results (12 min, 30°C) determined by RSM. Malic acid, tartaric acid, citric acid, and fumaric acid were determined by HPLC (Thermo Ultimate 3000, USA) using Inertsil column ODS-4 100 Å, 5 μm, 4.6 × 250 mm, C18. Chromatographic conditions were studied as solvent: 10 mM potassium dihydrogen phosphate, flow rate 1 mL/min, injection volume 20 μL, temperature 30°C, and DAD 210 nm.
The phenolic profiles of the verjuices were evaluated using the high-performance liquid chromatography (HPLC) system (Agilent 1260 Infinity Series). Phenols were separated using a Zorbax eclipse plus column (3C18, 4.6 × 250 mm) at a column temperature of 25°C and a flow rate of 0.6 mL/min, an injection volume of 8.5 μL, a column temperature of 25°C, and DAD at 280 nm. Gallic acid, caffeic acid, p-coumaric acid, quercetin, and ferulic acid were used to generate standard calibration curves. Samples were filtered using a 0.45 m membrane filter, and 1 mL of the filtered samples were placed in vials and analyzed. A ternary linear elution gradient with (A) water + 0.2% H3PO4 (v/v), (B) methanol, and (C) acetonitrile was used to perform the separation. Table 2 shows the gradient elution program for the HPLC.
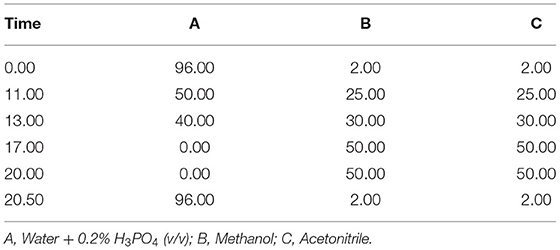
Table 2. The chromatographic conditions for the gradient elution program for the HPLC.
Standards were provided by Sigma-Aldrich (Steinheim, Germany). Compounds were identified by comparing the UV spectra and retention time of the compounds with those of real chemicals. Calibration curves were used to calculate the amounts of the chemicals. The results were expressed as milliliter per liter (ppm).
Analysis of Vitamin C (Ascorbic Acid)
Ascorbic acid decolorizes by reducing 2,6 dichloroindophenol, an oxidation-reduction dye. At the end of the reaction, the excess of the unreduced dye in the acidic solution shows a pinkish-pink-violet color. The oxalic acid solution (0.004%) was reacted with the dye to prevent the autoxidation of ascorbic acid and to supply the reaction with the appropriate acid. The color consisting of excess dye was read at 518 nm in a UV spectrophotometer. The calibration curve was determined by preparing ascorbic acid standard (Carlo Erba, France) solutions (2, 2.5, 5, 10, 20, 30, and 40 ppm) (Pearson, 1970).
Mineral Analyses by Inductively Coupled Plasma Mass Spectrometry (ICP-MS)
Verjuices were extracted with UAE according to the optimum results (12 min, 30°C) determined by RSM. Elements were determined using a NexION 2000 B Perkin Elmer Inductively Coupled Plasma-Mass Spectrometer (ICP-MS). Sigma Aldrich provided analytical-grade chemicals and organic solvents. Certified standard solutions include Ca, K, Mg, Na, Co, Cd, Cr, Cu, Fe, Mn, Zn, and Ni. The ICP-MS standard solutions were purchased from Perkin Elmer (USA). Internal standards for ICP-MS analysis included Bi, In, Sc, Y, and Ge (Data were checked for accuracy using various statistical approaches, e.g., 95% confidence interval, significance, P < 0.05).
Statistics Analyzes
The statistical analyses were carried out using SPSS Statistics (PASW Statistics 18, USA). The significant differences between the samples were determined via Duncan's multiple comparison tests in a 95% confidence interval when the one-way analysis of variance (ANOVA) result was significant. All analyses were performed in triplicate, and results were statistically analyzed and reported as mean (n = 3) ± standard deviation (SD).
HPLC analyses, measurement of peak area, and repeatability of sample application were performed with ten replicates of the same sample and expressed as % relative standard deviation (RSD%). Response optimization (RSM) of the extraction conditions and analysis of variance was performed using Design-Expert 7.0.0 (Minneapolis, USA).
Results and Discussion
Physicochemical Composition of Unripe Grape Juice
The physicochemical properties of the unripe grape juices (Yediveren, Cal Karasi, and Sultaniye) are shown in Table 3. The pH ranged from 2.51 to 2.52, and the soluble solids (°Brix) ranged from 4.1 to 6. While our results are similar to the study by Öncül and Karabiyikli (2015) (pH: 2.1–2.7) and Karapinar and Sengun (2007) (pH: 2.4–2.8), they were found to be lower than those of Hayoglu et al. (2009) (pH: 2.9–3.0) and Simone et al. (2013) (pH:2.8). Similar results were previously reported for soluble solids (°Brix): 4.2-8.0 (Öncül and Karabiyikli, 2015) and 4.5–7.5 (Hayoglu et al., 2009). To extend the shelf life of foods, unripe grapes can be used as acidifiers (Shakir and Rashid, 2019).
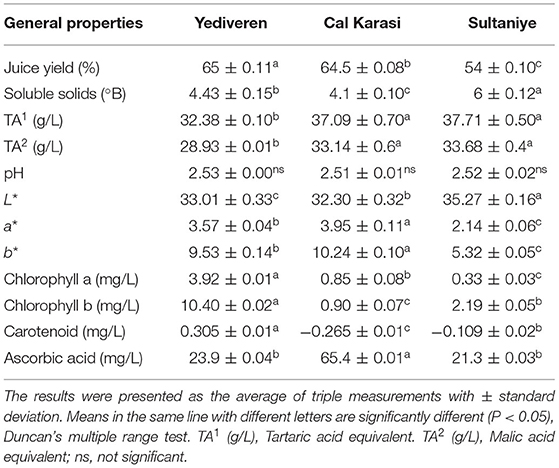
Table 3. Physicochemical values of verjuices of different unripe grape varieties.
Titration acidity, measured as tartaric acid and malic acid for Yediveren, Cal Karasi, and Sultaniye, ranged from 32.38 to 37.71 g/L and 29.93 to 33.68 g/L, respectively (Table 7). Total acidity (tartaric acid equivalents) of verjuices in previous studies have been reported for Yediveren varieties, 33.3 g/L (Öncül and Karabiyikli, 2015) and 16.2–19.2 g/L (Hayoglu et al., 2009), for the other varieties (Sauvignon blanc and Chardonnay) ranged from 17.4 to 40.5 g/L (De Matos et al., 2017) and 32.7–39.8 g/L (red-skinned and white-skinned grape) (Simone et al., 2013).
Yield of Juice
The unripe grapes in the growth phase are small, green, and hard, and their acidity increases. After veraison, the fruits become softer and the sugar begins to accumulate. Veraison is a crucial step in the development of the grape because it occurs at about the same time that the volume of the berries regularly increases, the sugar accumulates and the acidity decreases. The difficulty of pressing unripe grapes is due to their structure, content, and rigid consistency, which explains the low juice yield obtained from this raw material (Fia et al., 2021).
The yield of verjuices ranged from 54 to 65, as shown in Table 3. The highest yield of fruit juice was found in Yediveren and the lowest in Sultaniye. While our results are consistent with those of a study (De Matos et al., 2017) that reported 54–60%, they differ from Hayoglu et al. (2009) who found a juice yield of 47%. It is thought that the result varies depending on the variety or time of harvest.
Color, Chlorophyll, and Carotenoid
The color parameters L*, a*, and b* were measured to determine the mean color values of the unripe grape juices, as shown in Table 3. The L*, a*, and b* values for the verjuices were 32.30–35.27, 2.14–3.95, and 5.32–10.24, respectively. Among the L* values of the verjuice samples, Sultaniye has the highest value. This can be attributed to the fact that the Sultaniye variety is white grapes. The L* value of the verjuice samples of Öncül and Karabiyikli (2015) was <50, similar to the studies.
The values of redness (a*) and yellowness (b*) of the surfaces increased in Cal Karasi, and the difference was significant compared to Yediveren and Sultaniye. Even though the color is one of the most important characteristics of grape products, there is currently no agreed standard for identifying the quality of unripe grape juice (De Matos et al., 2017). Nikfardjam (2008), Hayoglu et al. (2009), De Matos et al. (2017), and Salah Eddine et al. (2020) found that A420, which is a yellow-orange color index, ranges from 0.19 to 0.32, 0.28 to 0.40, 0.20 to 0.19, and 0.23 to 0.78, respectively.
In the absence of anthocyanins, the optical properties of chlorophyll and carotenoids play a decisive role in the color of grapes. The color differences between fruits are caused by their distinct absorption bands in the visible spectral region, which have crucial effects on grape appearance and cultivar identification (Rocchi et al., 2016). Chlorophyll a (bluish-green), chlorophyll b (yellowish-green), and carotenoid levels of all samples were determined in the range of 3.92–0.33 (mg/L), 10.40–0.90 (mg/L), and 0.305-(-0.265), respectively (Table 3). Chlorophyll b values are higher than chlorophyll an in all three cultivars. Yediveren cultivar has the highest chlorophyll a and b. The highest amounts of carotenoids were found in Yediveren. The main green pigments in plants are chlorophyll a (bluish-green) and chlorophyll b (yellowish-green) (Zheng et al., 2014). The final color is mainly determined by the amount and ratio of chlorophylls and carotenoids, as well as melanin-like pigments and degradation products (Rustioni et al., 2015). This is the first study on the chlorophyll and carotenoid pigments of verjuices, although they have already been studied in some grapes. Zheng et al. (2014) studied the effects of various factors (heat treatment, pH, sugar concentration, and metal) on chlorophyll pigment in Thompson seedless grapes. In another study, Rocchi et al. (2016) measured the levels of chlorophyll and carotenoids in white grapes (Chardonnay, Italia, Matilde, Regina, etc). During fruit growth, they reported a decrease in carotenoids and chlorophylls.
Experimental Design and Optimization Results
Statistical optimization was used to investigate the optimal extractions of TPC and AC (DPPH and CUPRAC) by changing critical variables such as extraction temperature (X1: 25–65°C) and extraction time (X2: 5–30 min). The optimal extraction conditions of each verjuice were determined in 11 experimental points according to the central composite design. Table 4 shows the experimental design and optimization results. The desirability approach was used to determine the best ultrasound conditions using response surface methodology (RSM). RSM is a set of statistical and mathematical procedures based on fitting a polynomial equation to experimental data. It accurately represents the behavior of a data set attempting to optimize a particular parameter, as it saves time, space, and raw materials (Živković et al., 2018).
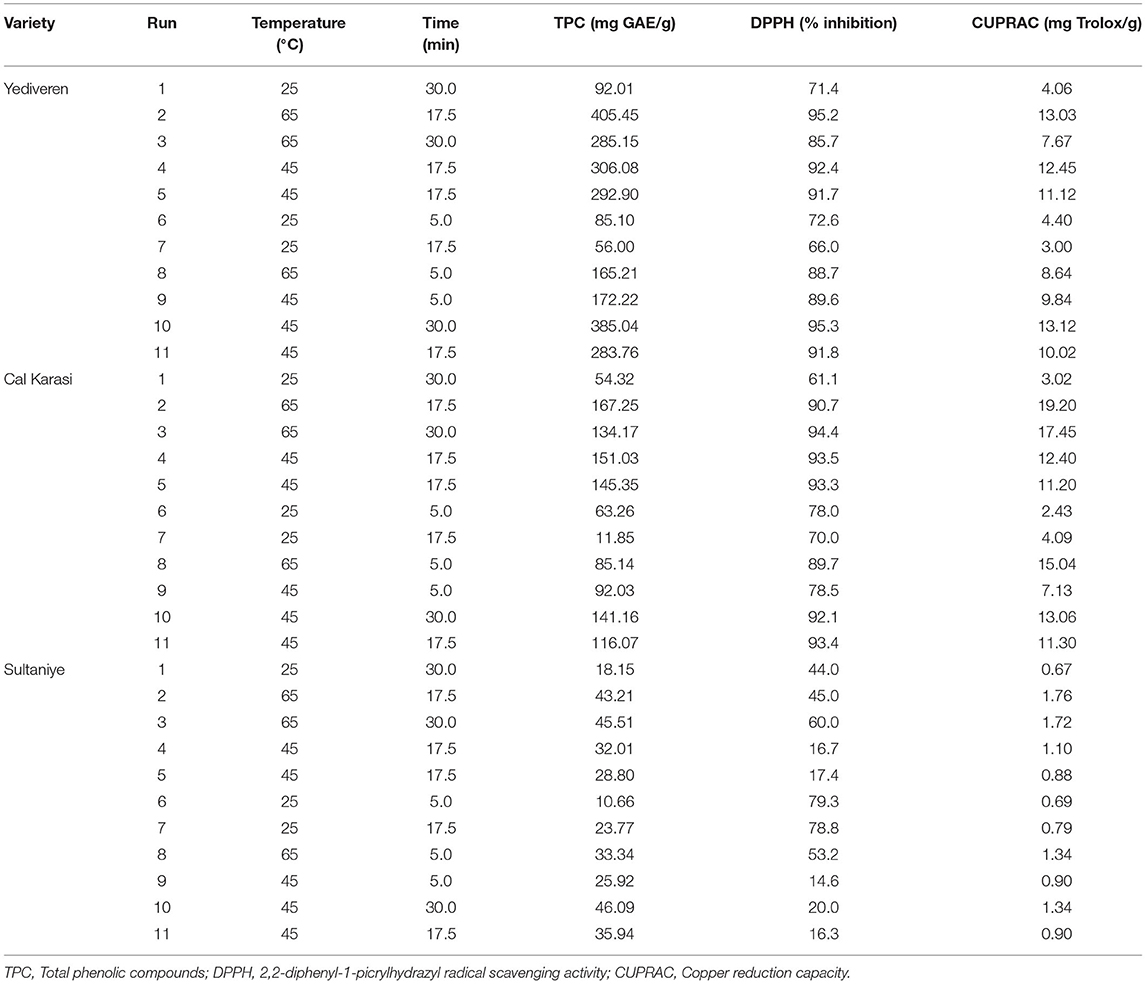
Table 4. TPM, DPPH and CUPRAC amounts of verjuice obtained by ultrasonic water bath extraction.
Shojaee-Aliabadi et al. (2013) studied the effects of extraction time (1–24 h), temperature (25–50°C), and solvent type (ethanol and distilled water) in the preparation of extracts from unripe grapes using the classical extraction method and selected TPC and radical scavenging capacity of 2,2-diphenyl-1-picrylhydrazil (DPPH) as dependent variables.
The influence of the process parameters at a time and temperature value (12 min, 30°C) dramatically changed the extraction yields of TPC, DPPH, and CUPRAC. The adequacy of the model was also demonstrated by an insignificant lack of fit (P > 0.05). Table 5 ANOVA showed that temperature and time of extraction had significant linear effects (P < 0.05). An increase in extraction efficiency as a function of temperature was observed in all experiments. Similar to our findings, Bagheri and Esmaiili (2017), who applied ultrasonic processes in the extraction of verjuice juice, stated that the increase in temperature and time increased the phenolic content. Shojaee-Aliabadi et al. (2013) published similar findings, stating that the extract composition of unripe grapes was temperature-dependent. They determined the optimum extraction time of unripe grapes as 19.34 h in their study with the classical method. Bagheri and Esmaiili (2017) reported that the best condition for the extraction of the phenolic component in qora juice is the application of ultrasonic at a frequency of 20 kHz at 70°C for 60 min. It seems that the use of ultrasonic devices shortens the extraction time. Karasu et al. (2019) have observed similar behavior during ultrasound-assisted extraction, which they ascribe to the fact that ultrasonic waves primarily affect the mass transfer rate during the solvent penetration stage. With the use of an efficient extraction technique, the highest amount of physiologically active substances should be recovered with the least degree of degradation. Different extraction conditions promote varying degrees of extraction of certain compounds (Živković et al., 2018).
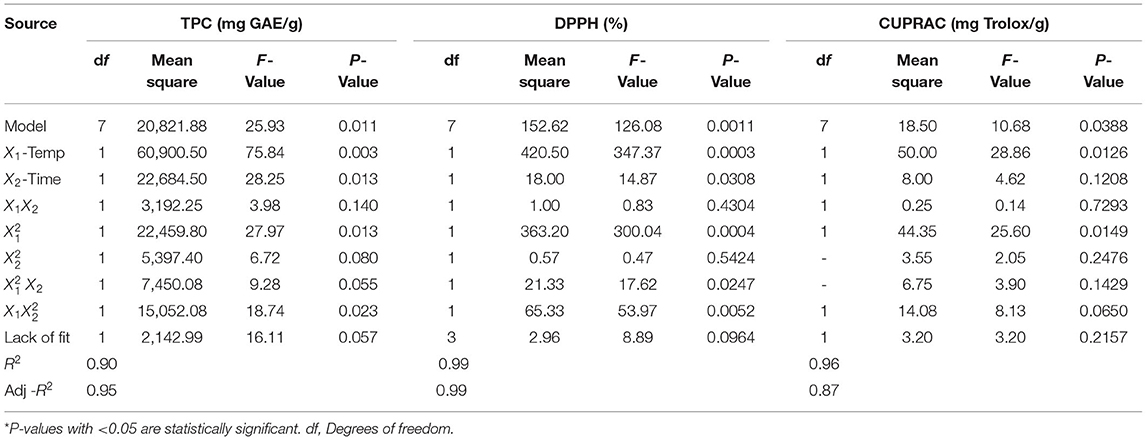
Table 5. Analysis of variances for Yediveren.
Effect of Extraction Parameters on TPC and AC (DPPH, CUPRAC)
The extraction yield of total phenolic compounds from three different extractions of unripe grapes was compared with ultrasound-assisted extraction (UAE) under optimal conditions. We used an RSM with three variables evaluated at three levels to obtain the verjuices with the highest content of TPC and antioxidant capacity (DPPH, and CUPRAC) measured by spectrophotometer in this study (Table 4). The experimentally determined TPC, DPPH, and CUPRAC values were fitted to a quadratic polynomial, cubic, and linear model, respectively, and ANOVA was used to investigate the effects of the variables studied, their interactions, and the statistical significance of the model. Table 5 shows the significance of each coefficient as assessed by the F-test and P-value for Yediveren. The corresponding variables become increasingly significant as the absolute F-value increases and the P-value decreases (Wang et al., 2008). The results show that the assessed parameters had a significant effect on the responses (P < 0.05).
The P-values of the regression coefficients for each of the responses studied for Yediveren verjuices are summarized in Table 5. According to the statistically significant P-values, the cubic model (TPC) and (DPPH, and CUPRAC) were appropriate approximations for the responses studied. The coefficients of multiple determinations for TPC, DPPH, and CUPRAC were all relatively high (R2), with values of 0.98, 0.99, and 0.96, respectively. The adequacy of the model was also evidenced by an insignificant lack of fit (P > 0.05). The cubic model modeled the effects of extraction parameters on TPC, DPPH, and CUPRAC. All parameter models had a significant effect on the response variables (P < 0.05). The effect of extraction parameters on TPC (Equation 4) and AC (DPPH (Equation 5) and CUPRAC (Equation 6) was described by the following cubic equation.
where, x1 and x2 were temperature and time, respectively. The model parameters of temperature and time had a significant effect on TPC and DPPH, as shown in Table 5. These parameters are important because they affect extraction efficiency and production costs.
The values of TPC, AC (DPPH and CUPRAC) in the extracts from Yediveren verjuice prepared by the UAE method ranged from 56 to 405.45 mg GAE/g, 66–95% ARA and 3–13.12 mg Trolox/g, respectively (Table 4).
Table 6 summarizes the P-values of the regression coefficients for each of the responses examined for Cal Karasi verjuices. According to the statistically significant P-values, the cubic model (TPC), quadratic model (DPPH), and linear model (CUPRAC) were appropriate approximations for the responses studied. TPC, DPPH, and CUPRAC all had high coefficients of multiple determination (R2) with values of 0.96, 0.86, and 0.94, respectively. Values of “Prob > F” <0.0500 indicate that the model terms were significant. The adequacy of the model was also evidenced by an insignificant lack of fit (P > 0.05). While the temperature and time parameters were significant for CUPRAC, the time parameter was insignificant for TPC and DPPH. The following cubic equation describes the effect of extraction parameters on TPC (Equation 7) and AC [DPPH (Equation 8) and CUPRAC (Equation 9)].
The contents of TPC, AC (DPPH and CUPRAC) in Cal Karasi verjuice extracts prepared by the UAE method ranged from 11.85 to 167.35 mg GAE/g, 61–94% ARA and 2.43–19.20 mg Trolox/g, respectively (Table 4).
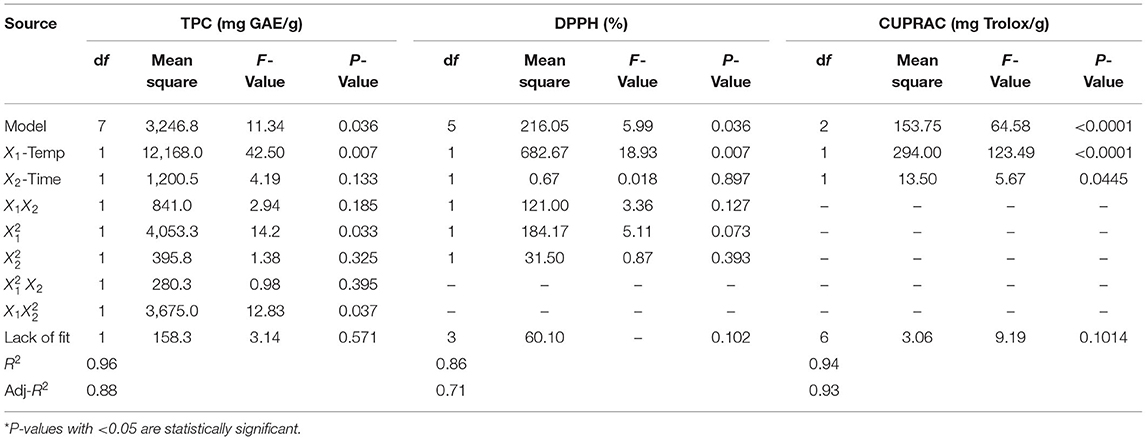
Table 6. Analysis of variances for Cal Karasi.
Table 7 shows the P-values of the regression coefficients for each of the responses examined for Sultaniye verjuices. According to the statistically significant P-values, the quadratic polynomial models (TPC, DPPH, and CUPRAC) were appropriate approximations for the responses studied. TPC, DPPH, and CUPRAC all had high coefficients of multiple determination (R2) with values of 0.89, 0.94, and 0.92, respectively. Values of “Prob > F” <0.0500 indicate that the model terms were significant. The adequacy of the model was also demonstrated by an insignificant lack of fit (P > 0.05). All parameters of the model had a significant effect on TPC and AC (DPPH, CUPRAC) (P < 0.05). The following cubic equation defines the influence of extraction parameters on TPC (Equation 10) and AC [DPPH (Equation 11) and CUPRAC (Equation 12)].
The contents of TPC, AC (DPPH, and CUPRAC) in the Sultaniye verjuice extracts prepared by the UAE method ranged from 10.66 to 46.09 mg GAE/g, 15–80% ARA and 1–2 mg Trolox/g, respectively (Table 4).
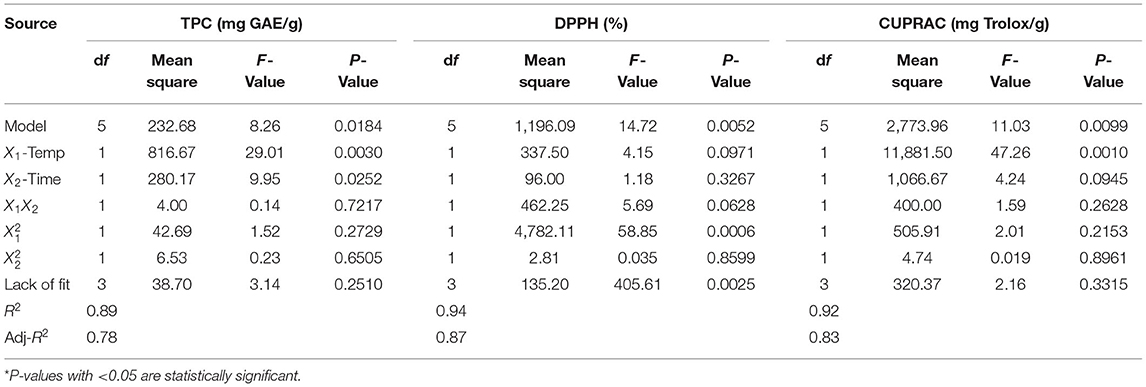
Table 7. Analysis of variances for Sultaniye.
As can be seen, Yediveren gives a total phenolic compounds extraction yield (405.45 mg GAE/g) higher than that of Cal Karasi (167.25 mg GAE/g) and Sultaniye (46.09 mg GAE/g). The difference in total phenolic content between grape varieties may vary depending on whether the grapes are black and have seeds. The total phenolic content of verjuices was reported as 307 mg/L for black grape (Shakir and Rashid, 2019), for Thompson Seedless variety 49.89 mg/L (Bagheri and Esmaiili, 2017), 388.79 mg/100 g for the Asgari variety (Shojaee-Aliabadi et al., 2013) and for Yediveren variety 227.48 mg/100 mL (Hayoglu et al., 2009) in previous studies. The reason why the results differ from ours is that the grape variety, harvest time and analysis methods affect the total phenolic content.
In the present study, the total antioxidant capacity of Yediveren verjuice was 66–95% (DPPH), 3–13 mg Trolox/g (CUPRAC); Cal Karasi 61–94% (DPPH), 2–19 mg Trolox/g (CUPRAC) and Sultaniye 15–80% (DPPH), 1–2 mg Trolox/g (CUPRAC). While the antioxidant values of Yediveren and Cal Karasi are close, they are higher than those of Sultaniye. This may be attributed to the fact that Yediveren and Cal Karasi are black-colored and seeded varieties. Similar to our study, Shojaee-Aliabadi et al. (2013) and Shakeri et al. (2016) reported 91% and 92% (DPPH), respectively, in verjuices from different grape varieties. Öncül and Karabiyikli (2015) detected 0.108 and 0.491 μmol TE/ml using the ferric reducing ability of plasma (FRAP) and Trolox equivalent antioxidant capacity (TEAC), respectively in verjuices from the Yediveren variety.
Figure 2 shows the effect of process parameters and the interaction of these parameters on Response surface-3D. The temperature and time were the variables impacting TPC and AC extraction (DPPH, CUPRAC) (Figure 2). TPC and AC extraction rose as the temperature and time were increased to 65 C and 17.5 min, respectively (Figure 2A). However, following these maximum points, TPC and AC extraction declined significantly, showing that a further increase in extraction time was not beneficial for extraction due to the degradation of the TPC for Yediveren. As seen in Figure 2B, TPC and CUPRAC values increased when the temperature and time were increased to 65°C and 17.5 min. After this maximum point, TPC and CUPRAC decreased with increasing time, while DPPH values continued to increase. For Sultaniye, TPC, and CUPRAC extraction increased when the temperature and time were increased to 65°C and 17.5 min, respectively (Figure 2C). However, TPC and CUPRAC inference decreased after these maximum points. For Sultaniye, TPC and CUPRAC extraction increased when the temperature and time were increased to 65°C and 17.5 min, respectively (Figure 2C). However, TPC and CUPRAC inference decreased after these maximum points. The highest DPPH value was determined at 25°C for 5 min.
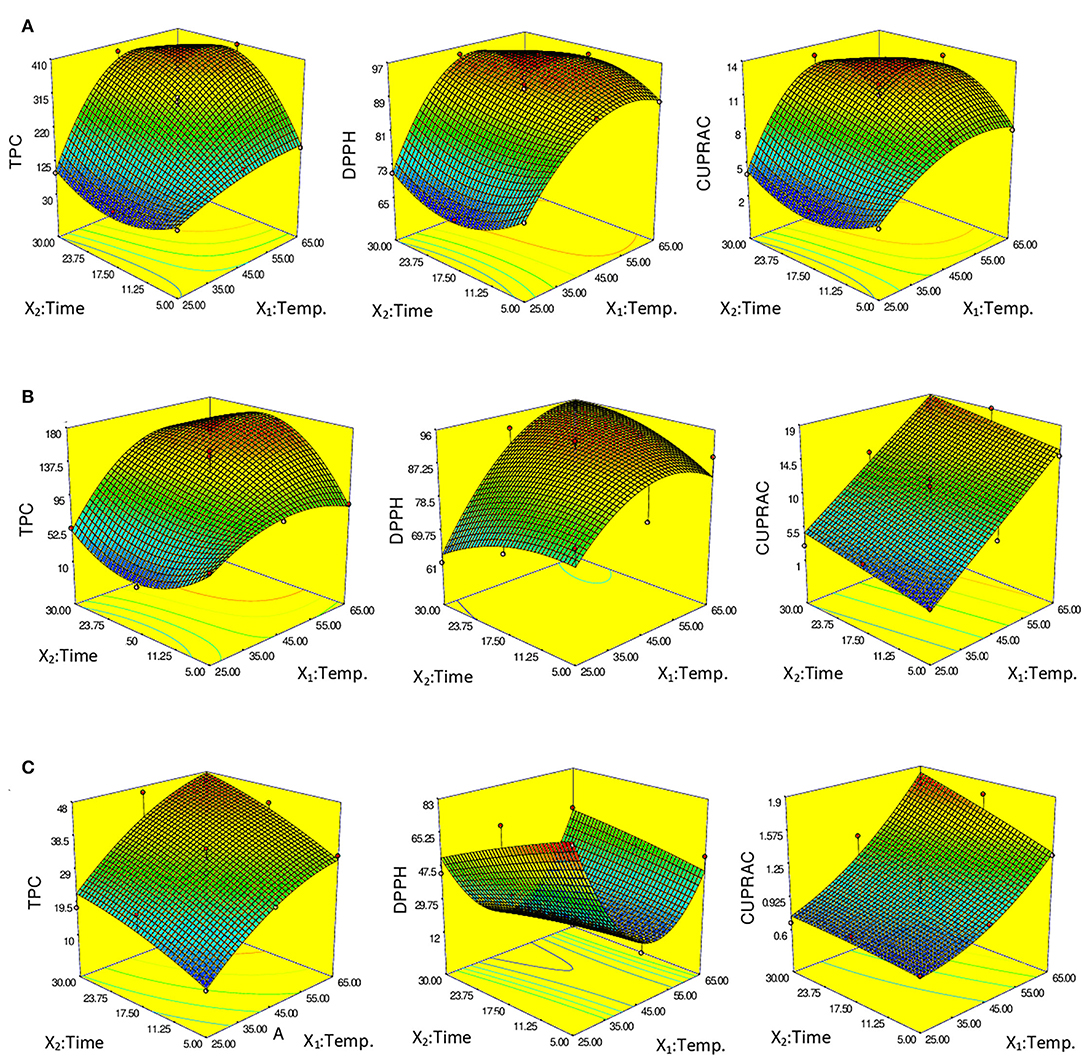
Figure 2. Response surface-3D—showing the effects of the extraction parameters on total polyphenols (TPC) and antioxidant capacity (DPPH and CUPRAC) of the extracts. (A) Yediveren, (B) Cal Karasi, (C) Sultaniye.
The effect of temperature was found to be significant (P < 0.05) on TPC according to ANOVA results (Tables 3–5). The effect of an increase in temperature on the extraction rate of bioactive chemicals has been previously reported in the literature. Živković et al. (2018) discovered a similar trend of increased TPC extraction with increasing temperature.
According to the ANOVA results, the effect of time for TPC was significant (P < 0.05) in Yediveren and Sultaniye cultivars, but insignificant (P > 0.05) in Cal Karasi. Longer extraction time with UAE may result in more cell wall disintegration and solvent penetration into cells. Under these circumstances, the damaged cells release a greater amount of phenolic compounds (Karasu et al., 2019). The mass transfer process is affected by temperature, resulting in improved solvent penetration. As temperatures increase, the plant matrix and cell structures dissolve more rapidly, making the cells more permeable. As temperatures increase, interactions between phenolic compounds, proteins, and polysaccharides decrease, and the diffusion rate of phenolic compounds increases (Živković et al., 2018). An extraction time of 12 min and a temperature of 30°C proved to be the best conditions for the extraction of the maximum TPC and AC (DPPH, CUPRAC) in our study. This shows that the selected RSM model was successfully applied to the UAE of verjuices to produce extracts with the highest TPC and AC concentration.
HPLC Analysis
Gallic acid, caffeic acid, p-coumaric acid, ferulic acid, and quercetin were the phenolics detected in the verjuices (Table 8). In our study, the total content of these five phenolic acids was significantly higher in Cal Karasi, followed by Sultaniye and Yediveren. Quercetin was the most detected phenolic compound in the three verjuices. The content of this phenolic compound ranged from 89.70 to 122.60 mg/L, and the highest concentration was found in Sultaniye and Yediveren, followed by Cal Karasi. While there was no statistical difference between the amounts of quercetin in Sultaniye and Yediveren, the difference between these cultivars and Cal Karasi was significant. In general, the verjuices of Yediveren and Sultaniye had similar levels of quercetin regardless of cultivar but lacked gallic acid. Gallic acid (87.90 mg/L) was detected only in Cal Karasi, while ferulic acid was not detected in any verjuices. The content of caffeic acid ranged from 20.40 to 55.01 mg/L, and the difference between all samples was significant (P < 0.05). The content of p-coumaric acid ranged from 19.30 to 39.70 mg/L, and Cal Karasi had the highest content, and the difference between Yediveren and Sultaniye was not significant (Table 8). In previous work, caffeic acid, p-coumaric acid, and ferulic acid were reported as the most abundant phenolic compounds in juice from unripe grapes (Honisch et al., 2020). In a study, quercetin was found to account for 14 mg/kg, coumaric acid 19.60 mg/kg, caffeic acid 11 mg/kg, ferulic acid 4.63 mg/kg, and gallic acid 1.63 mg/kg of the extract from unripe grapes of the Merlot variety (Bucalossi et al., 2020). While the results of coumaric acid are comparable to those of our study, the amounts of the other components are lower. In another study, Bagheri and Esmaiili (2017) determined the compounds rutin, gallic acid, hydroxybenzoic acid, p-coumaric acid (para-coumaric acid), and resveratrol in verjuices from Thompson Seedless grape variety. They reported that it contains the most p-coumaric acid, in contrast to our study. Chromatograms of phenolic compounds and standards are shown in Figure 3 and Supplementary 1, respectively. When HPLC chromatograms of five phenolic compounds of three samples were compared, it was seen that three phenolic compounds with similar peak elution times showed the same elution sequence.
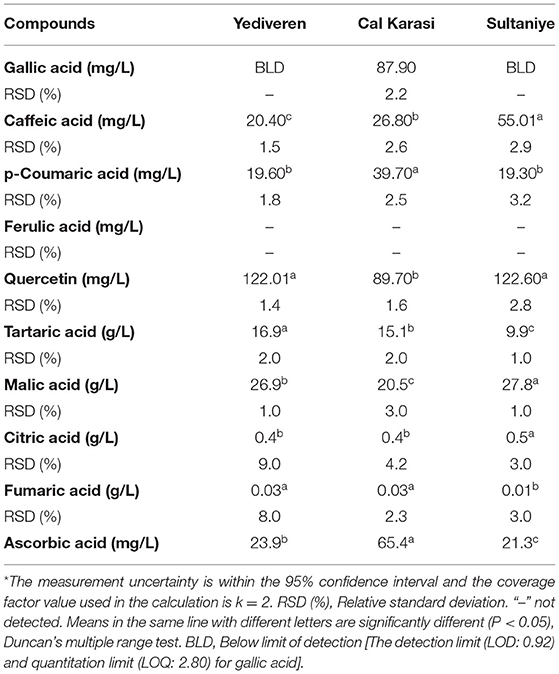
Table 8. Contents of phenolics and organic acids compound in verjuices.
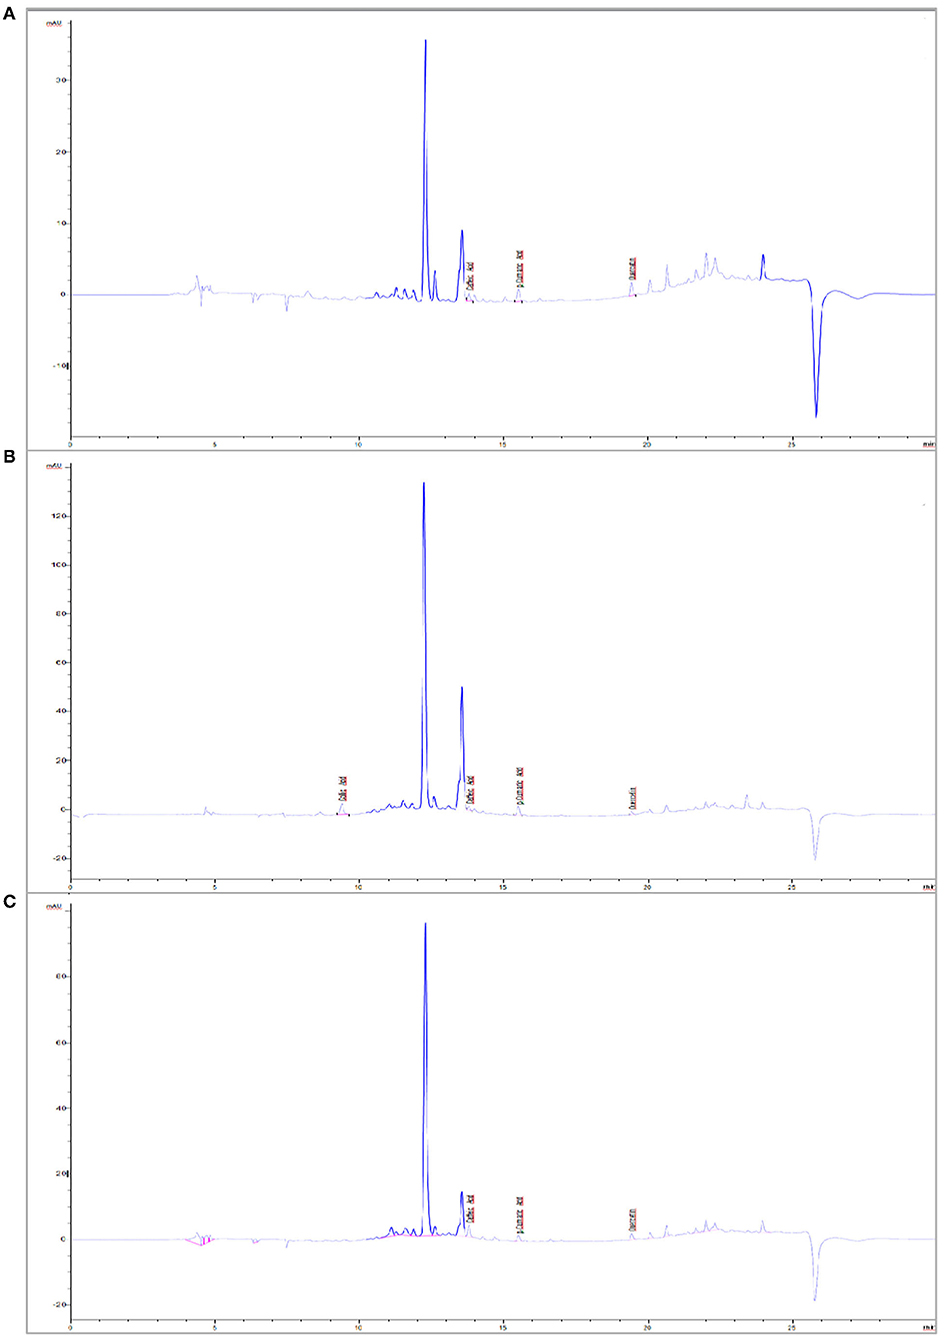
Figure 3. Chromatogram of phenolic compounds of verjuices. (A) Yediveren, (B) Cal Karasi, (C) Sultaniye.
The content of organic acids in unripe grapes is the main criterion for their direct use or as a natural sour flavor in other beverages in the food industry. It also has antioxidant, antimicrobial, and anti-browning properties. Tartaric and malic acids are the most abundant organic acids in grapes and account for 90% of total organic acids (Shakir and Rashid, 2019). Tartaric acid, malic acid, citric acid, and fumaric acid are organic acids that were identified in three varieties of unripe grape juices using ICP-MS. The results are shown in Table 8. Malic and tartaric acid contents of the three verjuices ranged from 20.5 to 27.8 g/L and 9.9 to 16.9 g/L, respectively. Malic acid was the most abundant organic acid in each verjuice variety, followed by tartaric acid, citric acid and fumaric acid. As organic acids, tartaric acid, malic acid, citric acid and fumaric acid in verjuices have been identified in previous findings (Guler and Tokusoglu, 2016; De Matos et al., 2019). Similar to our study, malic acid was found to be the most abundant organic acid in these studies. Malic acid content ranged from 20.5 to 27.8 g/L and contained the most Sultaniye among the samples. Tartaric acid content ranged from 9.9 to 16.9 g/L and was mostly detected in Yediveren cultivar. In all samples, significant statistical differences were observed for malic and tartaric acids (P < 0.05). Our results are similar to those of a study (De Matos et al., 2019) in which malic and tartaric acid values ranged from 10.9 to 30.4 g/L and 5.5 to 14.0 g/L, respectively. In another study using samples of black grape juice, Shakir and Rashid (2019) reported malic and tartaric acid values of 7.4–15.2 g/L, respectively.
Citric and fumaric acid contents of all samples were ranged from 0.4 to 0.5 and 0.01 to 0.03 respectively. Citric and fumaric acid contents in Yediveren and Cal Karasi varieties, no significant statistical differences (P > 0.05) whereas significant statistical alterations were observed in Sultaniye (P < 0.05). Chromatograms of organic acids and standards are shown in Figure 4 and Supplementary 2, respectively.
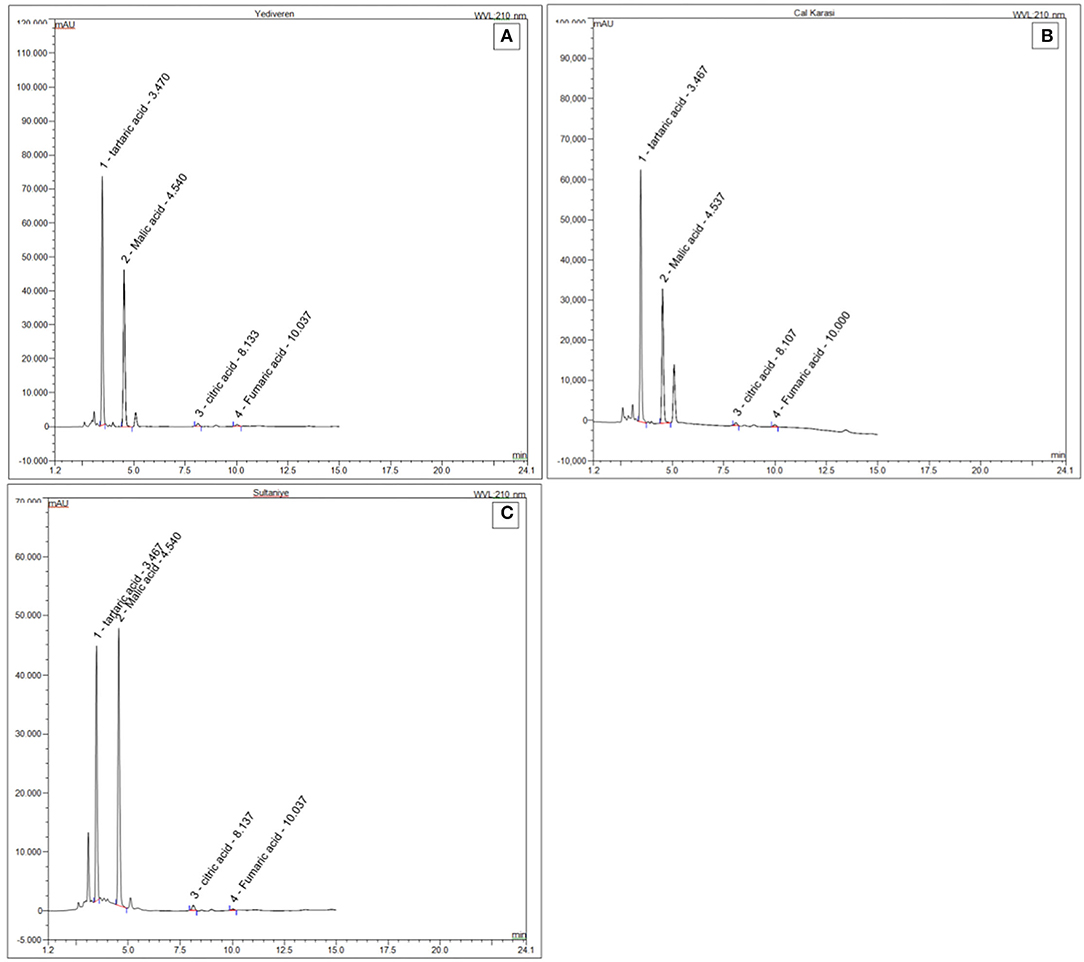
Figure 4. Chromatogram of organic acids of verjuices. (A) Yediveren, (B) Cal Karasi, (C) Sultaniye.
Vitamin C (Ascorbic Acid)
Fruits and vegetables provide more than 90% of vitamin C in the human diet, and unripe fruits often contain more vitamin C than ripe fruits (Fia et al., 2021). In this study, the vitamin C content of verjuices was found to be 21.3–65.4 mg/L (Table 8). The Cal Karasi variety has the highest vitamin C. These results showed that the vitamin C content of verjuice juice from Yediveren and Kabarcik was higher than 15–20 mg/L (Hayoglu et al., 2009) and lower than 150 mg/L from black grape juice (Shakir and Rashid, 2019). According to Evers et al. (2021), the vitamin C concentration in grapes ranges from 30 to 572 mg/L. Fia et al. (2021) reported that grapes accumulate more vitamin C than unripe fruits and reach the maximum concentration by veraison.
Minerals
In this study, macroelements such as potassium, magnesium, calcium, sodium, and microelements such as manganese, copper, zinc, iron, nickel, chromium, cobalt, and cadmium were investigated. Twelve mineral contents in the three different verjuices are shown in Table 9. Potassium, magnesium and calcium were determined the most in Yediveren, Cal Karasi, and Sultaniye. There was a statistically significant (P < 0.05) difference between the contents of these minerals in all cultivars. Grapes contain important minerals such as calcium, potassium, phosphorus, and sulfur and trace minerals such as iron and copper (Fia et al., 2021). Panceri et al. (2013) identified and quantified fifteen mineral elements in grapes. In the present study, potassium is the element with the highest concentrations (738796.95-1298809.91 ppb) in the three varieties of verjuice. Similar to our study, the juices from unripe black grapes were also found to have the highest amount of potassium among the other minerals such as calcium, magnesium, sodium, and iron (Shakir and Rashid, 2019). In these varieties, calcium and magnesium are present in a much higher amount than sodium.
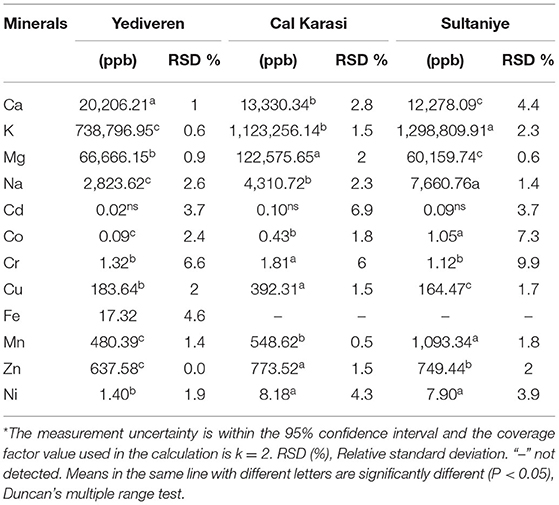
Table 9. Mineral content of verjuices of different varieties.
The mineral elements in grapes can be divided into two groups depending on how they accumulate in the berry. The first group of elements, which includes phloem-mobile potassium, magnesium, phosphorus, sulfur, copper, iron, and, boron continues to accumulate as the berries grow and ripen. The xylem-mobile minerals calcium, manganese, and zinc belong to the second group of elements that accumulate before ripening (Fia et al., 2021). Mineral content and concentration vary depending on the grape variety, temperature, soil structure, fertilization, solar radiation, and precipitation. In addition, mineral concentration increases two to fourfold during ripening. The diversity in mineral composition affects the sensory characteristics of the grapes and their products (Shakir and Rashid, 2019).
Conclusion
This study provides information on the optimization of extraction parameters for three different grape varieties in terms of total phenolic content and antioxidant capacity, as well as their physicochemical properties, mineral composition, individual phenolics, and organic acids. Statistical optimization was used to establish the optimal extraction of TPC and AC (DPPH; CUPRAC) by changing extraction temperature and extraction time. The optimal time and temperature were 12 min and 30°C, respectively.
The present study showed that verjuices obtained from three varieties of unripe grapes are a natural source rich in bioactive components such as phenolic acids, antioxidants, organic acids, ascorbic acid, and minerals. In viticulture, it is important to transform the grapes, which are wasted during the bunch thinning process, into value-added products such as verjuice, in terms of increasing the sustainability of viticulture and economic gains of the farmers. Unripe grapes are a natural and inexpensive source of antioxidants and have a high potential for use as functional foods due to their richness in nutritional values. Verjuices are promising as an innovative alternative that can replace artificial ingredients, especially as consumption of healthy foods is increasing globally.
This is the first work that deals with the optimization of UAE using antioxidant properties as dependent variables for verjuices. It is predicted that this study may contribute to sustainable agro-food processing as it utilizes grapes eliminated in thinning vineyards as a measure to improve the quality of remaining clusters. More work needs to be done to use these wastes in innovative new applications beyond their traditional use.
Data Availability Statement
The original contributions presented in the study are included in the article/Supplementary Material, further inquiries can be directed to the corresponding author/s.
Author Contributions
YB: conceptualization, methodology, investigation, formal analysis, writing reviewing and editing, and project administration. CE: formal analysis, writing reviewing, and resources. All authors contributed to the article and approved the submitted version.
Funding
This work has been financially supported by the Pamukkale University (BAP) under the Project Number of 2021BSP003.
Conflict of Interest
The authors declare that the research was conducted in the absence of any commercial or financial relationships that could be construed as a potential conflict of interest.
Publisher's Note
All claims expressed in this article are solely those of the authors and do not necessarily represent those of their affiliated organizations, or those of the publisher, the editors and the reviewers. Any product that may be evaluated in this article, or claim that may be made by its manufacturer, is not guaranteed or endorsed by the publisher.
Supplementary Material
The Supplementary Material for this article can be found online at: https://www.frontiersin.org/articles/10.3389/fsufs.2022.909894/full#supplementary-material
References
Ahmadi, L., and Romney, S. K. (2014). Pharmacological and phytochemical properties of unripe grape juice (verjuice): a review. Austin J. Nutr. Metab. 1, 9.
Apak, R., Guclu, K., Ozyurek, M., and Karademir, S. E. (2004). Novel total antioxidant capacity index for dietary polyphenols and vitamins C and E, using their cupric ion reducing capability in the presence of neocuproine: CUPRAC method. J. Agri. F. Chem. 52, 7970–7981. doi: 10.1021/jf048741x
Bagheri, H., and Esmaiili, M. (2017). Ultrasound-assisted extraction of phenolic compounds from unripe grape (Qora). Erwerbs-Obstbau. 59, 221–226. doi: 10.1007/s10341-016-0315-5
Bucalossi, G., Fia, G., Dinnella, C., Toffoli, D. e., Canuti, A., Zanoni, V. B., et al. (2020). Functional and sensory properties of phenolic compounds from unripe grapes in vegetable food prototypes. F. Chem. 315, 126291. doi: 10.1016/j.foodchem.2020.126291
Carmona-Jiménez, Y., Palma, M., Guillén-Sánchez, D. A., and García-Moreno, M. V. (2021). Study of the cluster thinning grape as a source of phenolic compounds and evaluation of its antioxidant potential. Biomolecules. 11, 227. doi: 10.3390/biom11020227
De Matos, A. D., Curioni, A. T., Bakalinsky, M., Marangon Pasini., G, and Vincenzi, S. (2017). Chemical and sensory analysis of Verjuice: an acidic foodstuff from unripe grapefruit, Innovative. F. Sci. Emrg. Technol. 44, 9–14. doi: 10.1016/j.ifset.2017.09.014
De Matos, A. D., Marangon, M., Magli, M., Cianciabella, M., Predieri, S., Curioni, A., et al. (2019). Sensory characterization of cucumbers pickled with verjuice as novel acidifying agent. F. Chem. 286, 78–86. doi: 10.1016/j.foodchem.2019.01.216
Drevelegka, I., and Goula, A. M. (2020). Recovery of grape pomace phenolic compounds through optimized extraction and adsorption processes. Chem. Eng. Pro. Process Intens. 149, 107845. doi: 10.1016/j.cep.2020.107845
Ekici, L., Kafadar, A. D., and Albayrak, S. (2018). Physicochemical, sensory, and bioactive properties of some traditional Turkish sorbets. J. F. Pro. Prsvn. 42, e13664. doi: 10.1111/jfpp.13664
Evers, M. S., Roullier-Gall, C., Morge, C., Sparrow, C., Gobert, A., and Alexandre, H. (2021). Vitamins in wine: Which, what for, and how much? Compr. Rev. F. Sci. F. Saf. 20, 2991–3035. doi: 10.1111/1541-4337.12743
Fia, G., Bucalossi, G., Proserpio, C., and Vincenzi, S. (2021). Unripe grapes: an overview of the composition, traditional and innovative applications, and extraction methods of a promising waste of viticulture. Aust. J. Grape Wine Res. 28, 8–26 doi: 10.1111/ajgw.12522
Guler, A., and Tokusoglu, O. (2016). Quality evaluation, total phenolic content, organic acid profiles and antioxidant capacity of soft drinks with koruk (sour grape) concentrate. Nat. Sci. Discov. 2, 41–47. doi: 10.20863/nsd.33300
Hayoglu, I., Kola, O., Kaya, C., Özer, S., and Turkoglu, H. (2009). Chemical and sensory properties of verjuice, a traditional Turkish non-fermented beverage from Kabarcik and Yediveren grapes. J. F. Pro. Prsvn. 33, 252–263. doi: 10.1111/j.1745-4549.2008.00339.x
Hildebrandt, A., and Matchuk, J. (2003). More than ordinary gring. In: Food Product Design. Northbrook, IL: Weeks Publishing Co. Available online at: http://www.foodproductiondesign.com. (accessed February 1, 2022.).
Honisch, C., Osto, A., de Matos, A. D., Vincenzi, S., and Ruzza, P. (2020). Isolation of a tyrosinase inhibitor from unripe grapes juice: a spectrophotometric study. F. chem. 305, 125506. doi: 10.1016/j.foodchem.2019.125506
Karapinar, M., and Sengun, I. Y. (2007). Antimicrobial effect of koruk (unripe grape-Vitis vinifera) juice against Salmonella typhimurium on salad vegetables. F. Cont. 18, 702–706. doi: 10.1016/j.foodcont.2006.03.004
Karasu, S., Bayram, Y., Ozkan, K., and Sagdic, O. (2019). Extraction optimization crocin pigments of saffron (Crocus sativus) using response surface methodology and determination stability of crocin microcapsules. J. F. Meas. Charact. 13, 1515–1523. doi: 10.1007/s11694-019-00067-x
Nagata, M., and Yamashita, I. (1992). Simple method for simultaneous determination of chlorophyll and carotenoids in tomato fruit. NSKGA. 39, 925–928. doi: 10.3136/nskkk1962.39.925
Nikfardjam, M. S. P. (2008). General and polyphenolic composition of unripe grape juice (verjus/verjuice) from various producers. Mitt. Klosterneuburg. 58, 28–31.
OIV (2019). International Vine and Wine Organization. Available online at: https://www.oiv.int/en/statistiques/recherche?year=2019andcountryCode=oiv (accessed February 9, 2022).
Öncül, N., and Karabiyikli, S. (2015). Factors affecting the quality attributes of unripe grape functional food products. J. F. Biochem. 39, 689–695. doi: 10.1111/jfbc.12175
Özturk, B., and Şengun, I. Y. (2019). Inactivation effect of marination liquids prepared with koruk juice and dried koruk pomace on Salmonella Typhimurium, Escherichia coli O157, H7. and Listeria monocytogenes inoculated on meat. Int. J. F. MBIO. 304, 32–38. doi: 10.1016/j.ijfoodmicro.2019.05.013
Öztürk, B., and Şengün, I. Y. (2021). Bioactive, physicochemical and antimicrobial properties of koruk (Unripe Grape, Vitis vinefera L.) products. TURJAF. 9, 1537–1544. doi: 10.24925/turjaf.v9i8.1537-1544.4450
Palomo, E. S., Diaz-Maroto, M. C., Vinas, M. A., Soriano-Perez, A., and Perez-Coello, M. S. (2007). Aroma profile of wines from Albillo and Muscat grape varieties at different stages of ripening. F. Cont. 18, 398–403. doi: 10.1016/j.foodcont.2005.11.006
Panceri, C. P., Gomes, T. M., De Gois, J. S., Borges, D. L., and Bordignon-Luiz, M. T. (2013). Effect of dehydration process on mineral content, phenolic compounds and antioxidant capacity of Cabernet Sauvignon and Merlot grapes. F. Res. Int. 54, 1343–1350. doi: 10.1016/j.foodres.2013.10.016
Pearson, D. (1970). The Chemical Analysis of Foods. New York: Chem. Pub. Available online at: https://books.google.gg/books/about/The_chemical_analysis_of_foods (accessed March 21, 2022.).
Rocchi, L., Rustioni, L., and Failla, O. (2016). Chlorophyll and carotenoid quantifications in white grape (Vitis vinifera L.) skins by reflectance spectroscopy. Vit. J. Grapevine Res. 55, 11–16. doi: 10.5073/vitis.2016.55.11-16
Rustioni, L., Milani, C., Parisi, S., and Failla, O. (2015). Chlorophyll role in berry sunburn symptoms studied in different grape (Vitis vinifera L.) cultivars. Sci. Hort. 185, 145–150. doi: 10.1016/j.scienta.2015.01.029
Salah Eddine, N., Tlais, S., Alkhatib, A., and Hamdan, R. (2020). Effect of four grape varieties on the physicochemical and sensory properties of unripe grape verjuice. Int. J. F. Sci. 2020, 7. doi: 10.1155/2020/6457982
Setorki, M., Asgary, S., Eidi, A., and Rohani, A. H. (2010). Effects of acute verjuice consumption with a high-cholesterol diet on some biochemical risk factors of atherosclerosis in rabbits. Med. Sci. Mont. 16, BR124–BR130.
Shakeri, S., Mesbahi, G., and Niakousari, M. (2016). Characterization of fresh unripe grape juice (verjuice) and evaluation of some physicochemical properties changes of pasteurized unripe grape concentrate juice during storage. Iran. J F. Sci. Tech. 13, 137–148.
Shakir, B. K., and Rashid, R. M. S. (2019). Physiochemical and phytochemical profile of unripe black grape juice (verjuice). ATMPH. 22, 48–61. doi: 10.36295/ASRO.2019.22126
Shojaee-Aliabadi, S., Hosseini, S. M., Tiwari, B., Hashemi, M., Fadavi, G., and Khaksar, R. (2013). Polyphenols content and antioxidant capacity of G hure (unripe grape) marc extract: influence of extraction time, temperature and solvent type. Int. J. F. Sci. and Tech. 48, 412–418. doi: 10.1111/j.1365-2621.2012.03203.x
Simone, V., Montevecchi, G., Masino, G., Matrella, F., Imazio, V., Antonelli, S. A., et al. (2013). Ampelographic and chemical characterization of Reggio Emilia and Modena (northern Italy) grapes for two traditional seasonings:‘saba'and ‘agresto'. J. Sci. F. Agri. 93, 3502–3511. doi: 10.1002/jsfa.6296
Singh, R., Chidambara Murthy, K., and Jayaprakasha, G. (2002). Studies on the antioxidant capacity of pomegranate (Punica granatum) peel and seed extracts using in vitro models. J. Agri. F. Chem. 50, 81–86. doi: 10.1021/jf010865b
Singleton, V. L., Orthofer, R., and Lamuela-Raventos, R. M. (1999). Analysis of total phenols and other oxidation substrates and antioxidants by means of Folin–Ciocalteu reagent. Meth. Enzym. 299, 152–178. doi: 10.1016/S0076-6879(99)99017-1
Soyer, Y., Koca, N., and Karadeniz, F. (2003). Organic acid profile of Turkish white grapes and grape juices. J F. Comp. Anal. 16, 629–636. doi: 10.1016/S0889-1575(03)00065-6
Tinello, F., and Lante, A. (2017). Evaluation of antibrowning and antioxidant activities in unripe grapes recovered during bunch thinning. Aust. J. Grape Wine Res. 23, 33–41. doi: 10.1111/ajgw.12256
Torres-León, C., Ramírez-Guzman, N., Londoño-Hernandez, L., Martinez-Medina, G. A., Díaz-Herrera, R., Navarro-Macias, V., et al. (2018). Food waste and byproducts: an opportunity to minimize malnutrition and hunger in developing countries. Front. Sustain. Food Syst. 2, 52. doi: 10.3389/fsufs.2018.00052
Torres-León, C., Rojas, R., Contreras-Esquivel, J. C., Serna-Cock, L., and Belmares-Cerda, R. E. (2016). Mango seed: Functional and nutritional properties. Trends Food Sci. Technol. 55, 109–17. doi: 10.1016/j.tifs.2016.06.009
Torres-León, C., Rojas, R., Serna-Cock, L., and Belmares-Cerda, R. (2017). Extraction of antioxidants from mango seed kernel: Optimization assisted by microwave. Food Bioprod. Process. 105, 188–196. doi: 10.1016/j.fbp.2017.07.005
TUIK (2020). Türkiye Istatistik Kurumu / Turkish Statistical Institute. TUIK. Available online at: https://data.tuik.gov.tr/Kategori/GetKategori?p=Tarim-111 (accessed February 9, 2022).
Turkmen, F. U., Takci, H. M., Saglam, H., and Sekeroglu, N. (2019). Investigation of some quality parameters of pomegranate, sumac and unripe grape sour products from Kilis markets. Qual. Assur. Saf. 11, 61–71. doi: 10.3920/QAS2018.1293
Wang, J., Sun, B., Cao, Y., Tian, Y., and Li, X. (2008). Optimisation of ultrasound-assisted extraction of phenolic compounds from wheat bran. F. Chem. 106, 804–810. doi: 10.1016/j.foodchem.2007.06.062
Zheng, Y., Shi, J., Pan, Z., Cheng, Y., Zhang, Y., and Li, N. (2014). Effect of heat treatment, pH, sugar concentration, and metal ion addition on green color retention in homogenized puree of Thompson seedless grape. (LWT) F. Sci. Tech. 55, 595–603. doi: 10.1016/j.lwt.2013.10.011
ZibaeeNezhad, M. J., Mohammadi, E., Babaie Beigi, M. A., Mirzamohammadi, F., and Salehi, O. (2012). The effects of unripe grape juice on lipid profile improvement. Cholesterol 2012. doi: 10.1155/2012/890262
Keywords: antioxidants, phenolic compounds, RSM, ICP-MS, ultrasound-assisted extraction, unripe grape waste, verjuice, agro-food processing
Citation: Bayram Y and Elgin Karabacak C (2022) Characterization of Unripe Grapes (Vitis vinifera L.) and Its Use to Obtain Antioxidant Phenolic Compounds by Green Extraction. Front. Sustain. Food Syst. 6:909894. doi: 10.3389/fsufs.2022.909894
Received: 31 March 2022; Accepted: 03 June 2022;
Published: 29 June 2022.
Edited by:
Liliana Londono Hernandez, National Open and Distance University, ColombiaReviewed by:
Pablo Martín Cañón, Universidad Mayor, ChileCristian Torres-León, Universidad Autónoma de Coahuila, Mexico
Copyright © 2022 Bayram and Elgin Karabacak. This is an open-access article distributed under the terms of the Creative Commons Attribution License (CC BY). The use, distribution or reproduction in other forums is permitted, provided the original author(s) and the copyright owner(s) are credited and that the original publication in this journal is cited, in accordance with accepted academic practice. No use, distribution or reproduction is permitted which does not comply with these terms.
*Correspondence: Yuksel Bayram, eWJheXJhbUBwYXUuZWR1LnRy