
94% of researchers rate our articles as excellent or good
Learn more about the work of our research integrity team to safeguard the quality of each article we publish.
Find out more
ORIGINAL RESEARCH article
Front. Sustain. Food Syst. , 04 July 2022
Sec. Crop Biology and Sustainability
Volume 6 - 2022 | https://doi.org/10.3389/fsufs.2022.878013
This article is part of the Research Topic Insights in Crop Biology and Sustainability: 2021 View all 7 articles
 Robin Tim Biermann1,2*
 Linh T. Bach1
 Hans-Peter Kläring1
 Susanne Baldermann1,3
 Frederik Börnke1,2
 Dietmar Schwarz1
Modern plant cultivars often possess superior growth characteristics, but within a limited range of environmental conditions. Due to climate change, crops will be exposed to distressing abiotic conditions more often in the future, out of which heat stress is used as example for this study. To support identification of tolerant germplasm and advance screening techniques by a novel multivariate evaluation method, a diversity panel of 14 tomato genotypes, comprising Mediterranean landraces of Solanum lycopersicum, the cultivar “Moneymaker” and Solanum pennellii LA0716, which served as internal references, was assessed toward their tolerance against long-term heat stress. After 5 weeks of growth, young tomato plants were exposed to either control (22/18°C) or heat stress (35/25°C) conditions for 2 weeks. Within this period, water consumption, leaf angles and leaf color were determined. Additionally, gas exchange and leaf temperature were investigated. Finally, biomass traits were recorded. The resulting multivariate dataset on phenotypic plasticity was evaluated to test the hypothesis, that more tolerant genotypes have less affected phenotypes upon stress adaptation. For this, a cluster-analysis-based approach was developed that involved a principal component analysis (PCA), dimension reduction and determination of Euclidean distances. These distances served as measure for the phenotypic plasticity upon heat stress. Statistical evaluation allowed the identification and classification of homogeneous groups consisting each of four putative more or less heat stress tolerant genotypes. The resulting classification of the internal references as “tolerant” highlights the applicability of our proposed tolerance assessment model. PCA factor analysis on principal components 1–3 which covered 76.7% of variance within the phenotypic data, suggested that some laborious measure such as the gas exchange might be replaced with the determination of leaf temperature in larger heat stress screenings. Hence, the overall advantage of the presented method is rooted in its suitability of both, planning and executing screenings for abiotic stress tolerance using multivariate phenotypic data to overcome the challenge of identifying abiotic stress tolerant plants from existing germplasms and promote sustainable agriculture for the future.
During evolution, plants adapted to survive in fluctuating environmental conditions. While each climatic region has its own abiotic challenges for plants, adaptation to local environments were observed within populations of different plant ecotypes (North et al., 2009; Verslues and Juenger, 2011; Gehan et al., 2015). These ecotypes or land races, in case of plant species that are also locally cultivated, often are not only well-adapted to their respective habitat but possess also a broad genetic diversity (Tanksley and McCouch, 1997; Gehan et al., 2015; Alonge et al., 2020). Within this genetic diversity there might be traits encoded that confer tolerance or resistance to a certain abiotic or biotic stress that has been lost in modern elite varieties (Harlan, 1975; Tanksley and McCouch, 1997; Fernie and Yan, 2019). Contrary to biotic stress resistance, which often can be evaluated visually by measuring the infected area (Majumdar et al., 2014), tolerance toward abiotic stresses needs a more elaborate read out, since a multitude of physiological processes is perturbed that often cannot be described with a single observation (Mittler, 2006; Quint et al., 2016; Zhu, 2016).
Abiotic stress occurs when an abiotic factor, such as water, light, radiation, temperature, humidity, atmosphere, acidity and soil exceeds or falls below its optimal range, resulting in adversely affected physiological processes and impaired growth (Levitt, 1980; Lichtenthaler, 1998). The optimal range for an abiotic factor can depend on the respective tissues or organ. Increased temperatures for example can promote vegetative growth and development of plants up to a certain level (Heuvelink, 1989), while at the same stress range reproductive organs such as pollen are already impaired or infertile (Ozores-Hampton et al., 2012; Iovane and Aronne, 2021). This observations for example have been considered in speed breeding programs. Consequently, they apply a lower temperature during the period of reproductive growth, while vegetative growth is performed at an increased temperature (Ghosh et al., 2018).
When evaluating abiotic stress adaptation of crops and screening them for tolerance, not only the different response of plant organs but also the concept of different phases of stress response should be recapitulated. Following Lichtenthaler (1998), stresses cause a divergence from the physiological standard of plants, which can end up in acute damage, if a phase of reconstitution cannot be reached. Reconstitution might be followed by a stage of hardening, which can climax to a stage of maximal tolerance for a certain period of time. If the stress remains, chronic damage of tissues might occur. Upon timely removal of the stress however, a new physiological standard might be reached. Therefore, experimental designs should consider the period and intensity of a stress, and differentiate the different phases of stress responses and adaptation (Lichtenthaler, 1998; Miller et al., 2007).
Plenty studies that dealt with the identification of abiotic stress tolerant genotypes utilized yield as indicator. Among the earliest and most prominent yield-based indicators there are the stress susceptibility index (Fischer and Maurer, 1978), the mean productivity (Rosielle and Hamblin, 1981) and the geometric mean productivity (Fernandez, 1992). These indices have been used to identify tolerant genotypes for a variety of abiotic stresses, such as drought, heat and salt stress (Bouslama and Schapaugh, 1984; Dhanda and Munjal, 2006; Morton et al., 2019). To compound the information obtained by single screening indices which proved there usability in the past, toolkits such as iPASTIC or other composite selection index have been developed to enhance the detecting power of yield-based screenings (Pour-Aboughadareh et al., 2019; Sabouri et al., 2022).
Further approaches that aimed to identify stress tolerant genotypes utilized chlorophyll fluorescence parameters as measure of tolerance (Sharma et al., 2015; Poudyal et al., 2018). Additionally the reduction of tetrazolium triphenyl chloride or electrolyte leakage have been used to test cell viability and stress tolerance, respectively (Saadalla et al., 1990; Porter et al., 1995; Dhanda and Munjal, 2006). As reviewed, there is a significant amount of literature that relies on the interpretation of a single traits for abiotic stress classification and the reproductive growth phase, respectively, but the vegetative growth phase seems to be underrepresented. For this reason, the presented study aims to utilize multi-dimensional phenotypic information obtained from heat stressed tomato plants during vegetative growth, to develop an approach that classifies abiotic stress tolerance on the basis of phenotypes variability under stressful conditions.
The expectation of increasingly high temperatures in the future, as one example for an abiotic stress factor that is predicted to increasingly influence crop production in the future (Warszawski et al., 2021), highlights the importance of breeding for tolerance (Fernie and Yan, 2019). Model based simulations have shown that only a slightly increasing average temperature results in a dramatic yield loss of numerous crop plants, such as tomato (Ayankojo and Morgan, 2020). The complexity of effects of heat stress is reviewed by Aleem et al. (2020), which in correspondence with the miscellaneous molecular changes upon heat stress (Mittler et al., 2012; Ding et al., 2020) allows the expectation of diverse optimized coping mechanisms. Therefore, harnessing landraces as genetic resource for yet undiscovered or unutilized stress-tolerance mechanisms, might be a promising advance and support breeding of future crops (Fernie and Yan, 2019; Ruggieri et al., 2019).
While numerous traits can be observed during experiments, and each trait might have relevance on its own, it is challenging to merge all gathered information without introducing a subjective bias to downstream analysis. These biases might derive from attributing different weights to individual traits, leaving out traits that seem to be not relevant in the first place, or losing information about absolute changes when using relative performances for data evaluation. To diminish subjectivity and foster objective evaluation of multivariate datasets principal component analysis (PCA) can be used as a tool to compress observed variability into a few calculated principal components (PC) (Fisher, 1936; Jolliffe, 2002; Bro and Smilde, 2014; Jolliffe and Cadima, 2016). While the number of PCs equals the number of input dimensions and observed traits, respectively, the first PCs usually contain more information on observed variations than one input dimension would explain. This enrichment of information is explained by so called eigenvalues. An eigenvalue bigger than one indicates that the corresponding PC contains more information on variation than one of the input dimensions and vice versa (Kaiser, 1960; Jolliffe and Cadima, 2016). Therefor the Kaiser-Guttmann criterion suggested to only keep PCs with an eigenvalue bigger than one, and thereby reduce dimensionality of the dataset, while retaining the majority of observed variation within the datasets (Kaiser, 1960). Additional to the Kaiser-Guttmann criterion numerous approaches have been developed to reduce dimensionality (Jolliffe, 2002). The dimensionality-reduced data can serve as input for subsequent cluster analysis approaches. Which shall be used to test the hypothesis, that tolerant genotypes have more stable phenotypes. A suitable measure that reflects the sum of observed phenotypic and physiological changes can be the distances between the genotypes and their respective treatment. These distances can be calculated as Euclidean distances which are linear connections between data points (Pandit and Gupta, 2011; Dokmanic et al., 2015). Euclidean distances are frequently applied in supervised and unsupervised machine learning algorithms for data classification (Abdi and Williams, 2010; Dokmanic et al., 2015; Camacho et al., 2018). To expand our adapted tolerance-classification method, two different statistical measures are tested within this study. The developed easy-to-apply computational approach shall be further discussed for its versatile application in both planning and executing screenings of diversity panels for abiotic stress tolerance using multivariate phenotypic datasets.
The experiment conducted for this study was performed in a greenhouse located: 52°20'55.0“N 13°18'38.3”E. Plant cultivation and treatments took place between the 17th of January and the 2nd of March 2021 as described hereafter.
Most tomato seeds of the 14 indeterminate genotypes were provided by VEG-ADAPT (https://www.veg-adapt.unito.it/) partners and were propagated at GAUTIER Semences (Eyragues, France) except genotypes T56 and Tpe (Table 1). T56 was known as tolerant cultivar from previous experiments and was provided by Cluinaris (Rosdorf, Germany) while Tpe was obtained from the Max Planck Institute of Molecular Plant Physiology (Golm, Germany).

Table 1. Investigated tomato genotypes, denotation, and primary source.
Upon germination in the dark on wet filter paper (Carl Roth GmbH+Co. KG, Karlsruhe, Germany) in petri dishes (SARSTEDT AG & Co., Nümbrecht, Germany), seedlings were transplanted into small planting pots (5 cm diameter; volume of 150 mL) filled with coarse sand (grain of 0.5–1 mm, RIGK GmbH, Wiesbaden, Germany). For each treatment and genotype, four biological replicates, defined as distinct plants grown from individual seeds, were grown and investigated. Seedlings were cultivated at 22/18°C day/night, 60/85% relative humidity in a greenhouse. Twenty two days post-sowing, plants were transplanted into bigger planting pots (13 cm diameter, volume of 600 mL) filled with coarse sand. Additional light with a PAR of 140 μmol/(m2*s) at table level, was supplied by Philips IP65 lamps equipped with Master Agro 400 W (Koninklijke Philips N.V., Amsterdam, Netherlands) between 6 a.m. and 6 p.m.
During the first week upon the first transplanting of seedlings, water was used for irrigation. Afterwards, fertigation of the sand cultures was done with an adapted De Kreij nutrient solution (De Kreij et al., 1997), pH = 5.5 and electric conductivity of 1.5 dS*m−1. Briefly, following nutrients were provided: nitrate (10.75 mmol/L), ammonium (1.00 mmol/L), potassium (6.5 mmol/L), phosphate (1.25 mmol/L), magnesium (1 mmol/L), sulfate (1.5 mmol/L), calcium (2.75 mmol/L), iron (15 μmol/L), manganese (10 μmol/L), zinc (4 μmol/L), boron 20 μmol/L), copper (0.75 μmol/L), molybdenum (0.5 μmol/L). The pH was adjusted to 5.6. Fresh nutrient solution was added up to twice a day into the trays of individual plants.
After transplanting of the plants on the 22nd day post-sowing, four plants per genotype were distributed equally on tables among two identical greenhouse cabins in a fully randomized manner as suggested by Poorter et al. (2012a). Hereafter, plants were shuffled twice a week until 4 days before sampling and 49 days after sowing, respectively. Following 1 day of heat adaptation at 29/21°C on the 34th day post-sowing, the day/night temperature was set to 35/25°C for the heat stress treatment on the 35th day post-sowing. The control treatment maintained a temperature regime of 22/18°C. Both treatments were applied over a period of 2 weeks and were terminated on day 49 post-sowing. The mean temperature, photosynthetic active radiation during that period of the stress application are plotted in Supplementary Figures S1, S2.
During cultivation, no leaves or side branches were removed from the plants. No further plant protection procedures were applied.
This section describes the methods that were used to obtain experimental data.
To determine the volume of water or nutrient solution consumed under control and heat stress conditions, all quantities supplied to individual plants were recorded. In preparation for this, potting material was fully soaked before the first fertigation. Three additional pots per cabin were filled with coarse sand as reference for water evaporation. At the end of the measuring period, remaining water was measured. The sum of consumed water was subtracted by the volume of evaporated water and then divided by the number of days observed to obtain a value for the volume of water consumed per day.
To determine the impact of heat stress on leaf color of tomato plants photometric measurements were performed during the late morning hours on day 45 after sowing. Measurements were performed under control and heat stress conditions in the respective greenhouse cabins. To calculate the mean leaf color for single tomato plants, the first three leaflets from the tip of the fifth leaf, counted from top, were analyzed with a portable spectrophotometer CM700-d (Konica Minolta, Inc., Tokyo, Japan) using a 3 mm CM-A181 (Konica Minolta, Inc., Tokyo, Japan) orifice plate. The spectrophotometer was calibrated with the white calibration cap CM-A177 (Konica Minolta, Inc., Tokyo, Japan) as described in the manufacturer's manual. Measurements of colors within a range of 400–700 nm were made using the “Spectral Component Excluded” (SCE) measure mode and 10°/D65 light setting to obtain L*a*b colors that are in accordance with the CIE (International Commission on Illumination) standard. For better comparison of leaf colors, L*a*b values were converted into L*C*h values. While L remains unchanged, Equations (1) and (2) were used for conversion of a* and b* into C* and h°.
The hue value h was used for leaf color comparison, since it has been previously described as a robust measure for leaf color (Mizunuma et al., 2011).
To obtain information on the influence of heat stress on the plant's photosystem, two LI-6800 (LI-COR Biosciences, Lincoln, Nebraska, USA) systems were used to conduct gas exchange measurements on leaflets of the fifth developed leaf counted from top. Both systems were used for simultaneous measurements of heat and control-treated plants in the respective greenhouse cabins. The LI-6800 systems were swapped in the middle of the measurement, to avoid device dependent biases. All plants were measured in a randomized manner within a timeframe of ~2 h after heat stress was established during the late morning hours on day 46 after sowing. The environmental settings for the device's measuring chambers were set as follows: Temperature to either 35°C (heat stress) or 20°C (control), while relative humidity was set to 60%, CO2 concentration to 400 ppm and light intensity to 1,000 μmol/(m2*s) for both treatments. Plants were adapted to the light intensity for 120 s before measurements were recorded. Net assimilation rate (A), stomatal conductance to water vapor (gsw), transpiration (E), intrinsic water use efficiency (WUEg) and the difference between leaf and measuring cuvette temperature (dT) at 1,000 μmol/(m2*s) were further used for analysis.
In order to obtain information on differential epinastic movement of tomato leaves upon heat stress treatment (Van Zanten et al., 2010), digital photographs of whole plants were taken alongside the gas exchange measurements. Photographs were imported into ImageJ (Version 1.53e; National Institute of Health, USA) for determination of leaf angles with the “Angle tool.” Angles were determined between the stem and the adaxial side of the first quarter of the petioli. At least three to five measurements and leaf angles, respectively, were obtained per picture to calculate a mean angle for each investigated plant individually.
At the end of the experiment and 49 days after sowing, respectively, plant growth was determined by the produced fresh biomass. At that time point some genotypes already developed the first truss and entered the principal growth stage five according to BBCH code, while the majority of plants was still in principal growth stage two and continued side branch formation (Feller et al., 1995; Meier, 2018). To do so, shoot and leaves were separated and individually weighed with a laboratory scale (Kern® PCB3500-2, KERN & SOHN GmbH, Balingen, Germany). Hereafter, coarse sand was washed off the roots, residual water was removed, and root fresh weight was determined with a laboratory scale.
Data evaluation was done using R and RStudio [RStudio Team (2021)] as well as Microsoft Excel (Microsoft Corporation, Redmond, WA, USA). The R code used for this study as well as user instructions are stored at GitHub and can be accessed via the following link: https://github.com/BiermannIGZ/AbioticStressToleranceClassification. Briefly, raw data was used as input, while conditional mean imputation was used for missing data (Nelson et al., 1996; Austin et al., 2021). Raw data consisted of data obtained for leaf angles, leaf color (h), stomatal conductance (gsw), transpiration (E), assimilation (A), intrinsic water use efficiency (WUEg), root, shoot and leave total fresh weight, as well as the fertigation and leaf temperature difference (dT) (Supplementary Table S1). For each treatment and genotype, four biological replicates, defined as distinct plants grown from individual seeds, were investigated. With roughly ten-times more samples than input variables, prerequisites for PCA were fulfilled (Shaukat et al., 2016). To suit the developed script, data was sorted by genotype while the treatments were ordered alternating. Hereafter a PCA was performed. Due to the underlying PCA algorithm, coordinates of individuals for the respective PCs were normalized and scaled during the calculations. Upon application of the Kaiser-Guttmann criterion (Kaiser, 1960) only PCs were retained that had an eigenvalue bigger than one. Variable contribution to the observed variance within the dataset was investigated, as well as the quality of variable representation using the squared cosine (Abdi and Williams, 2010). Hereafter, Euclidean distances were calculated between the genotype data points according to the individuals PC coordinates. Mean distance of individual control plant to all individuals of the treated plants were calculated and checked for variance homogeneity with a Levene's test. Subsequently, distances were z-score (z) normalized using formula (3), where x is the value of interest, μ the population mean and σ is the population standard deviation, to obtain standard normal distributed distance measures.
Due to the number of calculated distances and z-scores, normal distribution was check visually with a density and a Q-Q-plot. Since z-scores followed a standard normal distribution, they can be directly interpreted with a p-value that corresponds to the respective sigma and standard deviation around the mean (Marsaglia, 2004). Finally, significance was tested with a Welch's ANOVA and a p-value of 0.05. For the subsequent Bonferroni post-hoc test however, a p-value of 0.15 was allowed for the purpose of screening the small panel of 14 genotypes. More stringent p-values might be applied for bigger screening populations.
By screening the tomato diversity panel, in terms of ease to measure phenotypical and physiological traits, considerable variance could be observed for single traits (Supplementary Table S1). Hence, it is difficult to draw clear conclusions that would allow assessment of tolerance by hand from that kind of datasets, without introducing a subjective bias. Therefore, efforts were taken to develop a computational approach that allows to objectively examining the sum of observed changes. The screen plot of the explained variance by the PCs showed a point of inflection visible at PC3 and a cumulative representation of 76.7% of variance (Figure 1). As with eigenvalues of 5.36, 1.75, and 1.32 (Supplementary Table S2) PC1-3 also fulfilled the Kaiser-Guttmann-criterion and were retained for further analysis, while all remaining PCs were discarded.
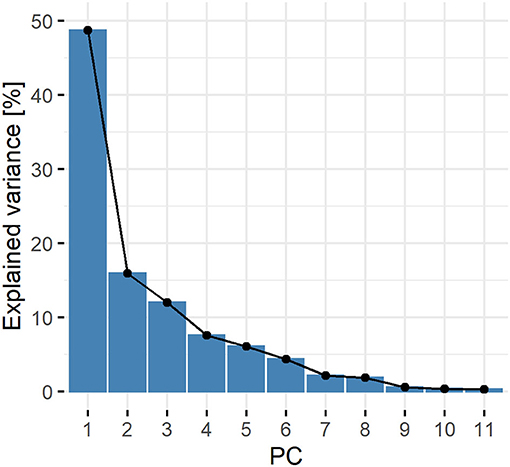
Figure 1. Eigenvalue screen plot. Percentage of explained variance of the dataset covered by the principle components. For each input variable, one PC or dimension, respectively, is calculated. The percentage is derived from the proportion of the respective eigenvalue to the number of input variables (Supplementary Table S2).
To get insight, into the correlation and quality of representation of traits within the PCs, two approaches were used. First, input variables and traits, respectively, were visualized on a factor map using PC1 and PC2 as abscissa and ordinate axis. The distance between the center and the traits indicated the squared cosine and the quality of representation, respectively, which was good for the majority of traits, while assimilation (A), leaf color (h), intrinsic water use efficiency (WUEg) and leaf angles only had mediocre quality of representation (Figure 2). Additionally, the graph suggested that there were mainly four major directions of correlation within the dataset.
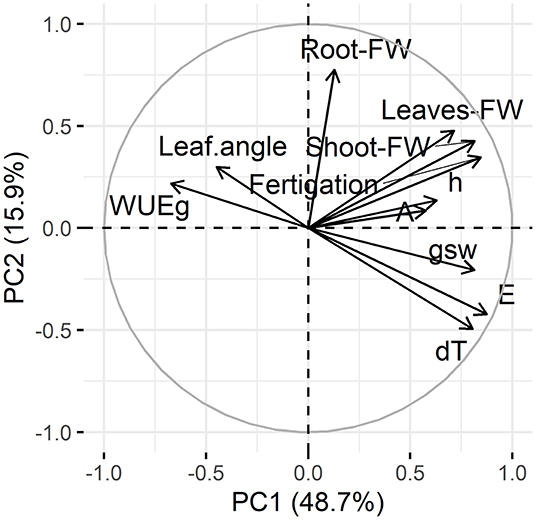
Figure 2. Variable correlation and representation. Projection of input variables on the factor map using PC1 and PC2. Distance from the center of the cycle represents the squared cosine, a measure for variable representation within the first two dimensions. Angle between variable vectors indicates co-correlation. Projected traits are leaf angles, leaf color (h), stomatal conductance (gsw), transpiration (E), assimilation (A), intrinsic water use efficiency (WUEg), total fresh weight (FW) of root, shoot and leave, as well as the fertigation and leaf temperature difference (dT).
Second, a correlation plot was calculated that provided information on the variable contribution to the first three PCs and indicated the proportion of variable contribution to the corresponding PC (Figure 3A). Visual evaluation of this plot showed that PC1, which explained 48.7% of the variance within the dataset, was almost equally determined by all input variables except leaf angle and root fresh weight. Within PC2, explaining 15.9% of variance, an over-proportional part of variance correlated with the root fresh weight. Assimilation rate, stomatal conductance and leaf angles were the major contributing variables within PC3, which covered 12.0% of variance. Overall, almost all traits contributed uniformly to PC1-3, while again leaf color, intrinsic water use efficiency and assimilation rate were represented clearly below average (Figure 3B).
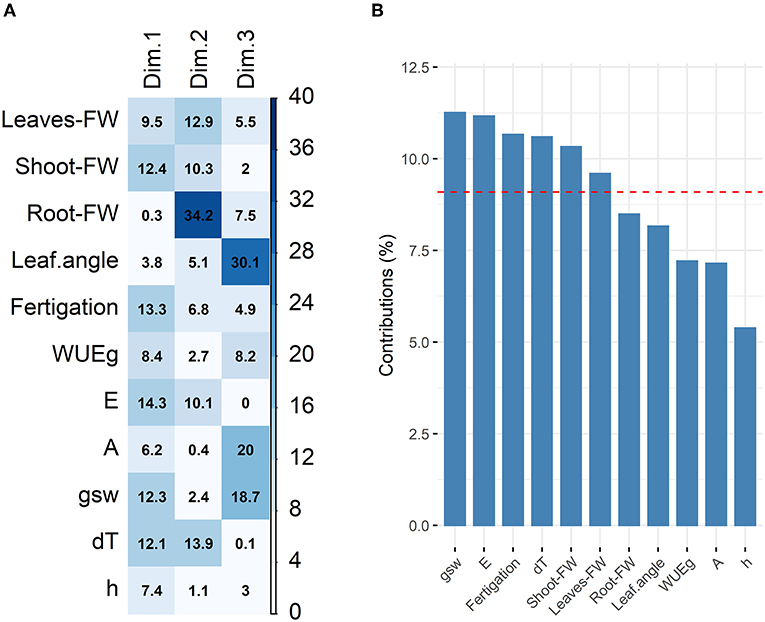
Figure 3. Variable contribution and correlation with PCs. (A) Correlation plot to evaluate variable contribution to single PCs with an eigenvalue bigger than one. Variable contribution to PCs is indicated numerically as percentage and by color for easier pattern recognition. (B) Total contribution of variables to PC1-3. Expected average contribution is indicated by a dashed red line. The depictured traits are leaf angles, leaf color (h), stomatal conductance (gsw), transpiration (E), assimilation (A), intrinsic water use efficiency (WUEg), total fresh weight (FW) of root, shoot and leave, as well as the fertigation and leaf temperature difference (dT).
Plotting of genotypes and treatments using the group centroids of PC1 and PC2 revealed a clear clustering of treatments. Additionally, the separation of genotypes was observed to be in an axis-of-symmetry-like manner (Figure 4). To test the hypothesis, that tolerant genotypes might have a more stable phenotype, and would thereby cluster closer together upon PCA, Euclidean distances were determined. Indeed, the calculated distances showed that the data point of the commercial S. lycopersicum cv. “Moneymaker” (T01) and the wild related species S. pennellii LA0716 (Tpe), followed by T56 and T49 clustered closer together, while landrace genotypes T40, T09, T29, and T25 clustered further apart (Figure 4, Table 2). Upon validation of normal distribution and inspection of variance homogeneity, a Welch's ANOVA (p < 0.05) was performed. The subsequent Bonferroni post-hoc test (p <0.15) resulted in five homogeneous groups (a, ab, abc, bc, and c; Table 2). The afore mentioned genotypes were found to belong to the groups a, ab and bc, c, respectively. As additional evaluation step, distance data was z-score normalized. Standard normal distribution of z-scores was checked visually with a Q-Q-plot and a density plot (Figure 5). As normal distribution was observed, one-sided p-values were calculated for the z-scores. Using a similar cut-off of p <0.15, which was chosen for the screening purpose, a second classification of the diversity panel was obtained (Table 2). According to this threshold, some of the aforementioned genotypes were sorted into groups of more and less tolerant genotypes (Table 2).
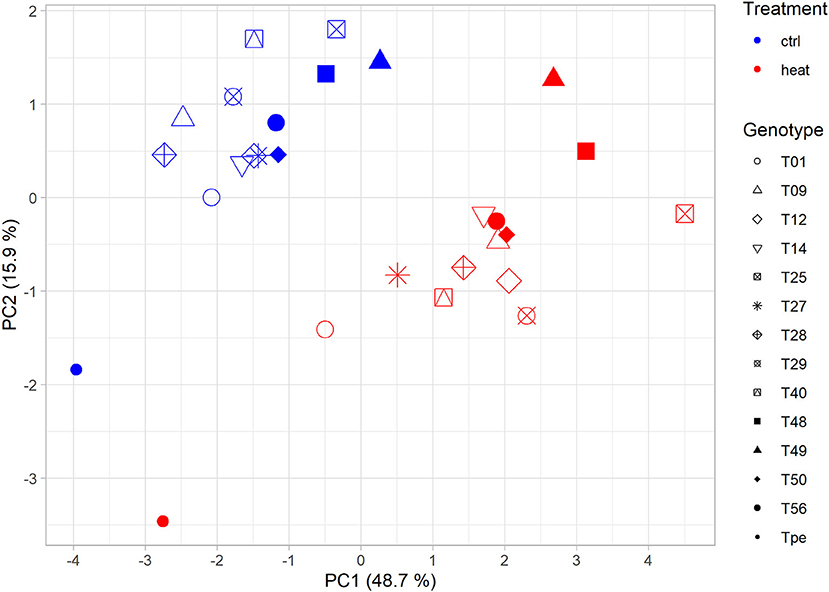
Figure 4. Plotted genotypes form treatment dependent clusters. Group centroids of the genotypes and their respective treatment were used for plotting. Group centroids were calculated from the individual coordinates of each sample within PC1-3 (Supplementary Table S3). Treatment (color) and genotype (shape) were used to visually examine the genotypes.
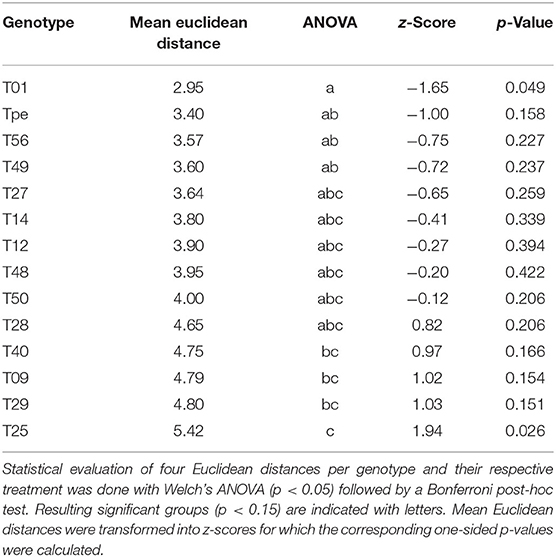
Table 2. Evaluation of distance between the genotypes and the respective treatment.
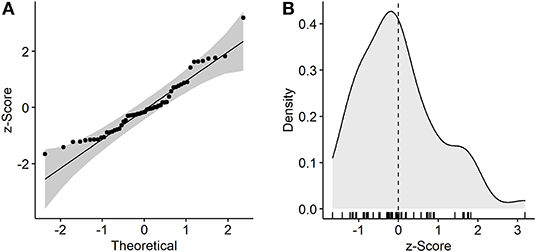
Figure 5. Visual investigation of normal distribution of z-score transformed distances. (A) Observed z-scores were plotted against the theoretical distribution. The theoretical ideal normal distribution is indicated as straight line, while the gray shading indicates a confidence interval. (B) Density plot results in a bell shaped curve, indicating a normal distribution. Z-scores of individual observations are indicated by the rug. The dashed black line shows the mean of all samples.
Among current breeding techniques, the investigation of diverse phenotypic traits of screening populations became important, to identify useful germplasm for breeding. While genome wide association studies (GWAS) help to associate particular traits with the presence or absence of genetic markers (Korte and Farlow, 2013), other techniques such as the discovery of quantitative trait loci (QTL) may also take heritability into account (Stinchcombe and Hoekstra, 2008). Both of these techniques rely on clustering of phenotypic data with the investigated genotypes and can complement each other (Korte and Farlow, 2013). Also, the obtained clusters and subsequent calculations will eventually allow the identification of trait correlations. As heritability remains a major interest in selective trait breeding, techniques such as the determination of best linear unbiased predictions (BLUPs) may accomplish the interpretation of traits of interest to generate selection indices (Robinson, 1991; Arnold et al., 2019). While the above mentioned methods have been shown to be useful techniques for the identification of trait specific markers or germplasm, the approach presented in this study mainly aims to obtain a phenotype derived tolerance trait, which may be used as additional input for the aforementioned methods.
By performing a PCA on the dataset of phenotypic traits, with subsequent dimension reduction, the majority of variance within a given dataset is retained and compressed into a few PCs. In the presented study, the PCs 1–3, which were retained after dimension reduction, accounted for ~76.7% of variation within the datasets, which can be judged as a good representation of total variance (Jolliffe and Cadima, 2016). To evaluate, which input variables were most important for the classification process, it is important to check variable contribution and correlation to the individual PCs, while the number of total explained variation of each PC has to be kept in mind. The percentage of variable contribution to PCs indicated numerically as percentage in Figure 3A combined with the variable correlation plot (Figure 2) can be used to interpret the PCs meaning. Almost each of the given input variables correlated equally well with PC1 (Figure 3A), that covered roughly 48.7% of the variability. The exceptions from this were the root fresh weight and the leaf angle, which were the most correlating variables for PC2 and PC3, respectively. In addition to this PC3 also had a high correlation with the assimilation rate and the stomatal conductance. For interpretation, this means that almost all traits correlated in a linear manner within PC1. The exceptions however, were best represented in a linear manner within PC2 and PC3, highlighting their importance for the observed phenotypes. The nature of correlation, positive or negative, can be judged from the correlation cycle (Figure 2).
To draw additional conclusions from PC evaluation and formulate first advice on the selection of appropriate traits that might be used for similar phenotypic screening experiments, an interpretation of the variable correlation cycle (Figure 2) might be helpful. As distances between the investigated traits visualized as arrows in the correlation cycle contains information on the trait correlation, and only four directions of trait correlation were observed, some labor-intensive measurements might not be necessary to capture the diversity and plasticity of phenotypes properly. While the over proportional contribution of single traits within PC2 and PC3, such as root fresh weight which is indicated by an arrow pointing in a unique direction, a first hint toward their relevance for evaluation of phenotypic plasticity upon heat stress is given. Amongst the other three out of four directions of trait correlation (Figure 2), there are mainly variables that are well-represented in PC1 (Figures 2, 3A). Therefore, it can be considered to discriminate single traits as reasoned in the following section.
While the root fresh weight points in its own direction, leaf and shoot fresh weight were found to intercorrelate well. The production of shoot biomass seems to be slightly supported by the data on assimilation rate, what does not wonder since photosynthesis is the basic driver for growth. Recently, maintenance of high net assimilation rate was observed in heat tolerant tomato (Poudyal et al., 2018), which might explain the intercorrelation between the traits. The low value for the squared cosine might result from the diverse tolerance levels within the screening population (Figure 2, Supplementary Table S1). Since studies on the influence of net assimilation rate and relative growth rate within a temperature range are an input measure for computational models of plant growth (Boote et al., 2012), it might be advisable to accompany direct measures of biomass traits with indirect ones such as the net assimilation rate. The interconnection between biomass allocation, photosynthesis and further traits has been extensively reviewed by Poorter et al. (2012b). While the overall biomass allocations is reported to be dependent on the species and genotype, diverse abiotic stresses can for example either promote (drought) or diminish (water logging) the root biomass allocation within a genotype. These reasons might explain the observed discrepancy between root and shoot biomass correlation. In some cases however, an increased root-to-shoot ratio is an important measure for the development of new breeding lines that should serve as rootstock for grafting or foster stress tolerances (Colla et al., 2017; Singh et al., 2017). Therefore, it might be advisable to investigate the root weight and a biomass parameter for the shoot as minimal input to obtain a sufficient representation of biomass production and basic info on its allocation. Albeit fertigation points in the same direction as the shoot biomass parameters, this trait can be laborious. Thus, it might be applicable to discard this measurement from the experimental design. Yet, the intrinsic water use efficiency could be an important measure to assess the potential water cost for carbon assimilation under a given stress as it points in its own direction, respectively. Since climate change will likely affect the scarcity of fresh water, development and breeding of crop plants with a well-balanced water use efficiency is continuously a focus of research and breeding (Morison et al., 2008; Hatfield and Dold, 2019).
Independent of the gas exchange measurements, leaf color and leaf angle provide additional information that might be suitable to investigate different abiotic stresses (Kläring and Zude, 2009; Junker and Ensminger, 2016; Junker-Frohn et al., 2019). While leaf angle measurements might be the most interesting to determine epinastic movement as response to heat, light or changing levels of phytohormones (Van Zanten et al., 2010), leaf color might be a suitable predictor for nutrient stresses, as these often affect plant secondary and pigment metabolism (Junker and Ensminger, 2016; Junker-Frohn et al., 2019). Both those traits can be investigated posterior to the experiment, provided suitable pictures have been taken. A review on image analysis for high-throughput image based plant phenotyping was published by Li et al. (2014). Of all investigated photosynthetic traits, the variation of assimilation rates was the least important and least best covered (Figures 2, 3), if judged by the squared cosine (Abdi and Williams, 2010). This might be due to the observation that there was no clear tendency of superior genotypes under control conditions, while the assimilation rate under heat stress conditions follows a trend that could be noticed, when the genotypes are sorted by the respectively calculated distances. This seconds the observed variable contribution to PC3 (Figure 3A) and highlight the relevance of screening assimilation rates upon abiotic stress, which is further supported by earlier findings (Poudyal et al., 2018). The other results that were obtained from the gas exchange measurements, as transpiration, stomatal conductance and intrinsic water use efficiency, were well-represented within PC1-2. The correlation between the transpiration rate and the difference between leaf and measure-chamber temperature suggests that the leaf transpiration rate is an indirect measure for the cooling capacity of leaves. In order to alleviate the impact of heat stress, this cooling mechanism is target of some research (Deva et al., 2020). These observations suggest that for heat stress experiment, it might be applicable to replace laborious gas exchange measurements with the simple determination of leaf temperature. To apply this to a scalable phenotyping approach and big screening populations, respectively, infrared pictures might be suitable to gain insight and cope with the workload of a big screening population (Li et al., 2014; Deva et al., 2020). Those kind of measurements are often performed in modern phenotyping platforms, which further can include artificial intelligence for picture analysis and options for automatization (Li et al., 2014). Given that development, it seems to be only a matter of screening, to discover tolerant germplasms.
To summarize the findings on trait correlation, it can be emphasize that careful selection of traits can be reasonable to decrease the workload during the screening and that, in analogy to the search for a maximized genetic diversity for germplasm (van Heerwaarden et al., 2013), a PCA based tool supporting identification of most relevant input might be useful. Regardless the technique for trait selection, smaller trials, such as the presented one with a maximum of around 100 plants, might be suitable to identify a set of relevant traits for a stress of interest. The proposed selection of traits might also be supported by further hierarchical clustering, as used for the construction of crop core collections (Hu et al., 2000).
The obtained scatter plot that depictures the genotypes position in PC1 and PC2 shows the formation of two distinct clusters for each treatment (Figure 4). This indicates that the heat stress treatment indeed affected the measured phenotypic traits within the screening population. Further, the prominent axis-of-symmetry might be an indicator for the different phenotypic characteristics of the investigated diversity panel, that derived from different trait characteristics (Fisher, 1936), which can also be seen by eye from the pictures used for leaf angle determination (Supplementary Figure S3). The z-score normalized distances between the genotypes and the respective treatment followed a standard Gaussian distribution (Figure 5). Since there also was a good correlation between the observed significant groups the ANOVA (Groups a, ab, bc and c; Table 2) and the respective sigma and p-value of mean derived z-scores, we proposed that the z-score can be a first measure for the statistical relevance of observed plasticity and tolerance levels. Thus, mean distances between group centroids might be suitable for evaluation with z-scores too. In order to allow some room for the classification of tolerant and susceptible genotypes in small screening populations, we used a less-stringent p-value of 0.15 as appropriate statistical threshold which is close to the one-sided p-value for observations outside the one sigma area around the mean (z-score >−1 ∨ > 1). However, a more stringent threshold might be chosen to evaluate big diversity panels. Out of the 14 genotypes assessed, eight genotypes were found to be statistically more relevant (Groups a, ab, bc and c; Table 2) and were close to or outside of the one sigma area around the mean. The genotypes T40, T09, T29, and T25 seem to be most influenced by the heat stress treatment and therefore might be classified as the most heat susceptible genotypes of the small diversity panel. The most tolerant genotypes according to this classification were T01 and Tpe out of which Tpe (S. pennellii) served as internal control for tolerant genotypes, as it has often been described as tolerant for diverse abiotic stresses including heat stress (Tal and Shannon, 1983; Bolger et al., 2014; Egea et al., 2018). It is surprising that the formerly in greenhouse production used commercial cultivar Moneymaker (T01) is fairly heat stress tolerant and well-adapted, according to the presented model, since no better genotype could be identified.
Similar to the calculation of BLUPs, which are investigated to assess phenotypic plasticity and screening of single traits (Robinson, 1991; Husby et al., 2010; Arnold et al., 2019), the calculated z-scores derived upon clustering of multivariate datasets might serve as measure for phenotype plasticity and stability under abiotic stress, respectively. In contrast to BLUPs, which can be used to assess individual traits using a random regression mixed model, the presented method aims to identify genotypes that have a stable phenotype upon stress, which might only be observable due to synergistic changes of the phenotype. Since the idea behind this comparative tolerance screening approach is based on the sum of observed changes and aims to identify genotypes that remained unchanged upon changing abiotic factors, it expands the toolset for plant breeding and allows the implementation of modern automated phenotyping methods. Divergent from field trials, green house experiments offer the opportunity to control most abiotic factors, like temperature, humidity, light and fertigation (Poorter et al., 2012a). This allows to test the performance of a screening population under a relative controlled environment that ultimately should mimic stressful field-like conditions. In order to avoid influence of soil microbiota, which have been shown to influence stress tolerance (Ashraf et al., 2004; Mendes et al., 2013; Yuan et al., 2022), and thereby increase reproducibility, the use of a hydroponic systems is recommended. Amongst those, sand cultures as used in this study can find application for relative small plants, such as young tomatoes. The small pot volume allowed efficient usage of green house space, determination of individual water consumption and frequent plant randomization and shuffling (Poorter et al., 2012a). Considering increased root biomass at late developmental stages, other hydroponic systems, such as nutrient film technique based ones, might be advisable.
The charm of the presented method is, that there are no limitations in input variables, plant species and genotypes as well as stresses of interest. The time that is needed for stress acclimatization and establishment of a stress phenotype, however, can be seen as a constraint. Therefore, extreme stresses, which are often used in molecular studies of short term stress response, might not be suitable to be investigated with the presented approach, as the stress intensity might limit the plants ability to develop a stressed phenotype before acute damage is caused by the stress (Lichtenthaler, 1998). Additionally, a direct measure for tolerance classification is provided by the z-scores, allowing a rapid interpretation of the statistical relevance of observations. While other screening methods may rely on big populations or a fixed set of input variables, we developed an evaluation method in which experimental design can be both adapted to the limitations in resources and capacity, as well as to the already known influences of certain abiotic stresses.
The datasets presented in this study can be found in online repositories. The names of the repository/repositories and accession number(s) can be found in the article/Supplementary Material.
Conceptualization: RB, H-PK, and DS. Phenotyping: RB and LB. Visualization and writing—original draft preparation: RB. Formal analysis: RB, LB, and H-PK. Project administration and funding acquisition: DS, SB, and FB. Writing—review and editing: all authors. All authors contributed to the article and approved the submitted version.
The research was conducted in the frame of the VEG-ADAPT project which is supported by the Horizon 2020 initiative PRIMA under the national Grant Number 01DH19019 of the German Federal Ministry of Education and Research (BMBF), respectively.
The authors declare that the research was conducted in the absence of any commercial or financial relationships that could be construed as a potential conflict of interest.
All claims expressed in this article are solely those of the authors and do not necessarily represent those of their affiliated organizations, or those of the publisher, the editors and the reviewers. Any product that may be evaluated in this article, or claim that may be made by its manufacturer, is not guaranteed or endorsed by the publisher.
The authors express their thanks to Gundula Aust and Susanne Trautwein for their valuable help in conducting and analyzing the experiments, and to the research group of Dr. Alisdair Fernie for providing seeds of Solanum pennellii.
The Supplementary Material for this article can be found online at: https://www.frontiersin.org/articles/10.3389/fsufs.2022.878013/full#supplementary-material
Abdi, H., and Williams, L. J. (2010). Principal component analysis. Wiley Interdiscipl. Rev. Comput. Stat. 2, 433–459. doi: 10.1002/wics.101
Aleem, S., Sharif, I., Amin, E., Tahir, M., Parveen, N., Aslam, R., et al. (2020). Heat tolerance in vegetables in the current genomic era: an overview. Plant Growth Regul. 92, 497–516. doi: 10.1007/s10725-020-00658-5
Alonge, M., Wang, X., Benoit, M., Soyk, S., Pereira, L., Zhang, L., et al. (2020). Major impacts of widespread structural variation on gene expression and crop improvement in tomato. Cell 182 145–161. e123. doi: 10.1016/j.cell.2020.05.021
Arnold, P. A., Kruuk, L. E., and Nicotra, A. B. (2019). How to analyse plant phenotypic plasticity in response to a changing climate. New Phytol. 222, 1235–1241. doi: 10.1111/nph.15656
Ashraf, M., Hasnain, S., Berge, O., and Mahmood, T. (2004). Inoculating wheat seedlings with exopolysaccharide-producing bacteria restricts sodium uptake and stimulates plant growth under salt stress. Biol. Fertil. Soils 40, 157–162. doi: 10.1007/s00374-004-0766-y
Austin, P. C., White, I. R., Lee, D. S., and van Buuren, S. (2021). Missing data in clinical research: a tutorial on multiple imputation. Can. J. Cardiol. 37, 1322–1331. doi: 10.1016/j.cjca.2020.11.010
Ayankojo, I. T., and Morgan, K. T. (2020). increasing air temperatures and its effects on growth and productivity of tomato in South Florida. Plants 9, 1245. doi: 10.3390/plants9091245
Bolger, A., Scossa, F., Bolger, M. E., Lanz, C., Maumus, F., Tohge, T., et al. (2014). The genome of the stress-tolerant wild tomato species Solanum pennellii. Nat. Genet. 46, 1034–1038. doi: 10.1038/ng.3046
Boote, K. J., Rybak, M. R., Scholberg, J. M., and Jones, J. W. (2012). Improving the CROPGRO-tomato model for predicting growth and yield response to temperature. Hort Sci. 47, 1038–1049. doi: 10.21273/HORTSCI.47.8.1038
Bouslama, M., and Schapaugh, W. Jr. (1984). Stress tolerance in soybeans. I. Evaluation of three screening techniques for heat and drought tolerance 1. Crop Sci. 24, 933–937. doi: 10.2135/cropsci1984.0011183X002400050026x
Bro, R., and Smilde, A. K. (2014). Principal component analysis. Anal. Methods 6, 2812–2831. doi: 10.1039/C3AY41907J
Camacho, D. M., Collins, K. M., Powers, R. K., Costello, J. C., and Collins, J. J. (2018). Next-generation machine learning for biological networks. Cell 173, 1581–1592. doi: 10.1016/j.cell.2018.05.015
Colla, G., Pérez-Alfocea, F., and Schwarz, D. (2017). Vegetable Grafting: Principles and Practices. Wallingford: CABI. doi: 10.1079/9781780648972.0000
De Kreij, C., Voogt, W., Van den Bos, A., and Baas, R. (1997). Voedingsoplossingen voor de teelt van tomaat in gesloten teeltsystemen. Naaldwijk: PBG.
Deva, C. R., Urban, M. O., Challinor, A. J., Falloon, P., and Svitákova, L. (2020). Enhanced leaf cooling is a pathway to heat tolerance in common bean. Front. Plant Sci. 11, 19. doi: 10.3389/fpls.2020.00019
Dhanda, S., and Munjal, R. (2006). Inheritance of cellular thermotolerance in bread wheat. Plant Breed. 125, 557–564. doi: 10.1111/j.1439-0523.2006.01275.x
Ding, Y., Shi, Y., and Yang, S. (2020). Molecular regulation of plant responses to environmental temperatures. Mol. Plant 13, 544–564. doi: 10.1016/j.molp.2020.02.004
Dokmanic, I., Parhizkar, R., Ranieri, J., and Vetterli, M. (2015). Euclidean distance matrices: essential theory, algorithms, and applications. IEEE Signal Process. Mag. 32, 12–30. doi: 10.1109/MSP.2015.2398954
Egea, I., Albaladejo, I., Meco, V., Morales, B., Sevilla, A., Bolarin, M. C., et al. (2018). The drought-tolerant Solanum pennellii regulates leaf water loss and induces genes involved in amino acid and ethylene/jasmonate metabolism under dehydration. Sci. Rep. 8, 1–14. doi: 10.1038/s41598-018-21187-2
Feller, C., Bleiholder, H., Buhr, L., Hack, H., Hess, M., Klose, R., et al. (1995). Phanologische Entwicklungsstadien von Gemusepflanzen II. Fruchtgemuse und Hulsenfruchte. Nachr. Dtsch. Pflanzenschutzd. 47, 217–232.
Fernandez, G. C. (1992). “Effective selection criteria for assessing plant stress tolerance,” in Proceeding of the International Symposium on Adaptation of Vegetables and other Food Crops in Temperature and Water Stress, Aug. 13-16 (Shanhua: Asian Vegetable Research and Development Centre), 257–270.
Fernie, A. R., and Yan, J. (2019). De novo domestication: an alternative route toward new crops for the future. Mol. Plant 12, 615–631. doi: 10.1016/j.molp.2019.03.016
Fischer, R., and Maurer, R. (1978). Drought resistance in spring wheat cultivars. I. Grain yield responses. Austral. J. Agric. Res. 29, 897–912. doi: 10.1071/AR9780897
Fisher, R. A. (1936). The use of multiple measurements in taxonomic problems. Ann. Eugen. 7, 179–188. doi: 10.1111/j.1469-1809.1936.tb02137.x
Gehan, M. A., Park, S., Gilmour, S. J., An, C., Lee, C. M., and Thomashow, M. F. (2015). Natural variation in the C-repeat binding factor cold response pathway correlates with local adaptation of Arabidopsis ecotypes. Plant J. 84, 682–693. doi: 10.1111/tpj.13027
Ghosh, S., Watson, A., Gonzalez-Navarro, O. E., Ramirez-Gonzalez, R. H., Yanes, L., Mendoza-Suárez, M., et al. (2018). Speed breeding in growth chambers and glasshouses for crop breeding and model plant research. Nat. Protoc. 13, 2944–2963. doi: 10.1038/s41596-018-0072-z
Hatfield, J. L., and Dold, C. (2019). Water-use efficiency: advances and challenges in a changing climate. Front. Plant Sci. 10, 103. doi: 10.3389/fpls.2019.00103
Heuvelink, E. (1989). Influence of day and night temperature on the growth of young tomato plants. Sci. Hortic. 38, 11–22. doi: 10.1016/0304-4238(89)90015-0
Hu, J., Zhu, J., and Xu, H. (2000). Methods of constructing core collections by stepwise clustering with three sampling strategies based on the genotypic values of crops. Theor, Appl. Genet. 101, 264–268. doi: 10.1007/s001220051478
Husby, A., Nussey, D. H., Visser, M. E., Wilson, A. J., Sheldon, B. C., and Kruuk, L. E. (2010). Contrasting patterns of phenotypic plasticity in reproductive traits in two great tit (Parus major) populations. Evol. Int. J. Organic Evol. 64, 2221–2237. doi: 10.1111/j.1558-5646.2010.00991.x
Iovane, M., and Aronne, G. (2021). High temperatures during microsporogenesis fatally shorten pollen lifespan. Plant Reprod. 35, 9–17. doi: 10.1007/s00497-021-00425-0
Jolliffe, I. T. (2002). “Principal components in regression analysis,” in Principal Component Analysis (New York, NY: Springer), 167–198.
Jolliffe, I. T., and Cadima, J. (2016). Principal component analysis: a review and recent developments. Philos. Trans. R. Soc. A Math. Phys. Eng. Sci. 374, 20150202. doi: 10.1098/rsta.2015.0202
Junker, L. V., and Ensminger, I. (2016). Relationship between leaf optical properties, chlorophyll fluorescence and pigment changes in senescing Acer saccharum leaves. Tree Physiol. 36, 694–711. doi: 10.1093/treephys/tpv148
Junker-Frohn, L. V., Lück, M., Schmittgen, S., Wensing, J., Carraresi, L., Thiele, B. R., et al. (2019). Tomato's green gold: bioeconomy potential of residual tomato leaf biomass as a novel source for the secondary metabolite rutin. ACS Omega 4, 19071–19080. doi: 10.1021/acsomega.9b01462
Kaiser, H. F. (1960). The application of electronic computers to factor analysis. Educ. Psychol. Meas. 20, 141–151. doi: 10.1177/001316446002000116
Kläring, H.-P., and Zude, M. (2009). Sensing of tomato plant response to hypoxia in the root environment. Sci. Hortic. 122, 17–25. doi: 10.1016/j.scienta.2009.03.029
Korte, A., and Farlow, A. (2013). The advantages and limitations of trait analysis with GWAS: a review. Plant Methods 9, 1–9. doi: 10.1186/1746-4811-9-29
Levitt, J. (1980). Responses of Plants to Environmental Stresses. Volume II. Water, Radiation, Salt, and Other Stresses. London: Academic Press.
Li, L., Zhang, Q., and Huang, D. (2014). A review of imaging techniques for plant phenotyping. Sensors 14, 20078–20111. doi: 10.3390/s141120078
Lichtenthaler, H. K. (1998). The stress concept in plants: an introduction. Ann. N. Y. Acad. Sci. 851, 187–198. doi: 10.1111/j.1749-6632.1998.tb08993.x
Majumdar, D., Kumar, D., Chakraborty, A., and Dutta, D. (2014). Detection and diagnosis of plant leaf disease using integrated image processing approach. Int. J. Comput. Eng. Applic. VI–III. 6, 10–16.
Marsaglia, G. (2004). Evaluating the normal distribution. J. Stat. Softw. 11, 1–11. doi: 10.18637/jss.v011.i04
Meier, U. (2018). Growth stages of Mono-and Dicotyledonous Plants: BBCH Monograph. Quedlinburg, DE: Julius Kühn-Institut (JKI).
Mendes, R., Garbeva, P., and Raaijmakers, J. M. (2013). The rhizosphere microbiome: significance of plant beneficial, plant pathogenic, and human pathogenic microorganisms. FEMS Microbiol. Rev. 37, 634–663. doi: 10.1111/1574-6976.12028
Miller, G., Suzuki, N., Rizhsky, L., Hegie, A., Koussevitzky, S., and Mittler, R. (2007). Double mutants deficient in cytosolic and thylakoid ascorbate peroxidase reveal a complex mode of interaction between reactive oxygen species, plant development, and response to abiotic stresses. Plant Physiol. 144, 1777–1785. doi: 10.1104/pp.107.101436
Mittler, R. (2006). Abiotic stress, the field environment and stress combination. Trends Plant Sci. 11, 15–19. doi: 10.1016/j.tplants.2005.11.002
Mittler, R., Finka, A., and Goloubinoff, P. (2012). How do plants feel the heat? Trends Biochem. Sci. 37, 118–125. doi: 10.1016/j.tibs.2011.11.007
Mizunuma, T., Koyanagi, T., Mencuccini, M., Nasahara, K. N., Wingate, L., and Grace, J. (2011). The comparison of several colour indices for the photographic recording of canopy phenology of Fagus crenata Blume in eastern Japan. Plant Ecol. Diversity 4, 67–77. doi: 10.1080/17550874.2011.563759
Morison, J., Baker, N., Mullineaux, P., and Davies, W. (2008). Improving water use in crop production. Philos. Trans. R. Soc. B Biol. Sci. 363, 639–658. doi: 10.1098/rstb.2007.2175
Morton, M. J., Awlia, M., Al-Tamimi, N., Saade, S., Pailles, Y., Negrão, S., et al. (2019). Salt stress under the scalpel–dissecting the genetics of salt tolerance. Plant J. 97, 148–163. doi: 10.1111/tpj.14189
Nelson, P. R., Taylor, P. A., and MacGregor, J. F. (1996). Missing data methods in PCA and PLS: score calculations with incomplete observations. Chemometr. Intell. Lab. Syst. 35, 45–65. doi: 10.1016/S0169-7439(96)00007-X
North, K. A., Ehlting, B., Koprivova, A., Rennenberg, H., and Kopriva, S. (2009). Natural variation in Arabidopsis adaptation to growth at low nitrogen conditions. Plant Physiol. Biochem. 47, 912–918. doi: 10.1016/j.plaphy.2009.06.009
Ozores-Hampton, M., Kiran, F., and McAvoy, G. (2012). Blossom drop, reduced fruit set, and post-pollination disorders in tomato. EDIS 2012 1–6.
Pandit, S., and Gupta, S. (2011). A comparative study on distance measuring approaches for clustering. Int. J. Res. Comput. Sci. 2, 29–31. doi: 10.7815/ijorcs.21.2011.011
Poorter, H., Fiorani, F., Stitt, M., Schurr, U., Finck, A., Gibon, Y., et al. (2012a). The art of growing plants for experimental purposes: a practical guide for the plant biologist. Funct. Plant Biol. 39, 821–838. doi: 10.1071/FP12028
Poorter, H., Niklas, K. J., Reich, P. B., Oleksyn, J., Poot, P., and Mommer, L. (2012b). Biomass allocation to leaves, stems and roots: meta-analyses of interspecific variation and environmental control. New Phytol. 193, 30–50. doi: 10.1111/j.1469-8137.2011.03952.x
Porter, D. R., Nguyen, H. T., and Burke, J. J. (1995). Genetic control of acquired high temperature tolerance in winter wheat. Euphytica 83, 153–157. doi: 10.1007/BF01678043
Poudyal, D., Rosenqvist, E., and Ottosen, C.-O. (2018). Phenotyping from lab to field–tomato lines screened for heat stress using Fv/Fm maintain high fruit yield during thermal stress in the field. Funct. Plant Biol. 46, 44–55. doi: 10.1071/FP17317
Pour-Aboughadareh, A., Yousefian, M., Moradkhani, H., Moghaddam Vahed, M., Poczai, P., and Siddique, K. H. (2019). iPASTIC: an online toolkit to estimate plant abiotic stress indices. Appl. Plant Sci. 7, e11278. doi: 10.1002/aps3.11278
Quint, M., Delker, C., Franklin, K. A., Wigge, P. A., Halliday, K. J., and Van Zanten, M. (2016). Molecular and genetic control of plant thermomorphogenesis. Nat. Plants 2, 1–9. doi: 10.1038/nplants.2015.190
Robinson, G. K. (1991). That BLUP is a good thing: the estimation of random effects. Stat. Sci. 15–32. doi: 10.1214/ss/1177011926
Rosielle, A., and Hamblin, J. (1981). Theoretical aspects of selection for yield in stress and non-stress environment 1. Crop Sci. 21, 943–946. doi: 10.2135/cropsci1981.0011183X002100060033x
Ruggieri, V., Calafiore, R., Schettini, C., Rigano, M. M., Olivieri, F., Frusciante, L., et al. (2019). Exploiting genetic and genomic resources to enhance heat-tolerance in tomatoes. Agronomy 9, 22. doi: 10.3390/agronomy9010022
Saadalla, M., Shanahan, J., and Quick, J. (1990). Heat tolerance in winter wheat: I. Hardening and genetic effects on membrane thermostability. Crop Sci. 30, 1243–1247. doi: 10.2135/cropsci1990.0011183X003000060017x
Sabouri, A., Dadras, A. R., Azari, M., Saberi Kouchesfahani, A., Taslimi, M., and Jalalifar, R. (2022). Screening of rice drought-tolerant lines by introducing a new composite selection index and competitive with multivariate methods. Sci. Rep. 12, 1–14. doi: 10.1038/s41598-022-06123-9
Sharma, D. K., Andersen, S. B., Ottosen, C. O., and Rosenqvist, E. (2015). Wheat cultivars selected for high Fv/Fm under heat stress maintain high photosynthesis, total chlorophyll, stomatal conductance, transpiration and dry matter. Physiol. Plant. 153, 284–298. doi: 10.1111/ppl.12245
Shaukat, S. S., Rao, T. A., and Khan, M. A. (2016). Impact of sample size on principal component analysis ordination of an environmental data set: effects on eigenstructure. Ekológia 35, 173. doi: 10.1515/eko-2016-0014
Singh, H., Kumar, P., Chaudhari, S., and Edelstein, M. (2017). Tomato grafting: a global perspective. Hort Sci. 52, 1328–1336. doi: 10.21273/HORTSCI11996-17
Stinchcombe, J. R., and Hoekstra, H. E. (2008). Combining population genomics and quantitative genetics: finding the genes underlying ecologically important traits. Heredity 100, 158–170. doi: 10.1038/sj.hdy.6800937
Tal, M., and Shannon, M. (1983). Salt tolerance in the wild relatives of the cultivated tomato: response of Lycopersicon esculentum, L. cheesmanii, L. peruvianum, Solanum pennellii and F l hybrids to high salinity. Aust. J. Plant Physiol. 10, 109–117. doi: 10.1071/PP9830109
Tanksley, S. D., and McCouch, S. R. (1997). Seed banks and molecular maps: unlocking genetic potential from the wild. Science 277, 1063–1066. doi: 10.1126/science.277.5329.1063
van Heerwaarden, J., Odong, T., and van Eeuwijk, F. (2013). Maximizing genetic differentiation in core collections by PCA-based clustering of molecular marker data. Theor. Appl. Genet. 126, 763–772. doi: 10.1007/s00122-012-2016-2
Van Zanten, M., Pons, T., Janssen, J., Voesenek, L., and Peeters, A. (2010). On the relevance and control of leaf angle. Crit. Rev. Plant Sci. 29, 300–316. doi: 10.1080/07352689.2010.502086
Verslues, P. E., and Juenger, T. E. (2011). Drought, metabolites, and Arabidopsis natural variation: a promising combination for understanding adaptation to water-limited environments. Curr. Opin. Plant Biol. 14, 240–245. doi: 10.1016/j.pbi.2011.04.006
Warszawski, L., Kriegler, E., Lenton, T. M., Gaffney, O., Jacob, D., Klingenfeld, D., et al. (2021). All options, not silver bullets, needed to limit global warming to 1.5° C: a scenario appraisal. Environ. Res. Lett. 16, 064037. doi: 10.1088/1748-9326/abfeec
Yuan, H., Hu, B., Liu, Z., Sun, H., Zhou, M., and Rennenberg, H. (2022). Physiological responses of black locust-rhizobia symbiosis to water stress. Physiol. Plant. 174, e13641. doi: 10.1111/ppl.13641
Keywords: abiotic stress, breeding, heat stress, phenotyping, Solanum lycopersicum, screening, stress tolerance
Citation: Biermann RT, Bach LT, Kläring H-P, Baldermann S, Börnke F and Schwarz D (2022) Discovering Tolerance—A Computational Approach to Assess Abiotic Stress Tolerance in Tomato Under Greenhouse Conditions. Front. Sustain. Food Syst. 6:878013. doi: 10.3389/fsufs.2022.878013
Received: 17 February 2022; Accepted: 10 June 2022;
Published: 04 July 2022.
Edited by:
Maryke T. Labuschagne, University of the Free State, South AfricaReviewed by:
Ajit Singh, University of Nottingham Malaysia Campus, MalaysiaCopyright © 2022 Biermann, Bach, Kläring, Baldermann, Börnke and Schwarz. This is an open-access article distributed under the terms of the Creative Commons Attribution License (CC BY). The use, distribution or reproduction in other forums is permitted, provided the original author(s) and the copyright owner(s) are credited and that the original publication in this journal is cited, in accordance with accepted academic practice. No use, distribution or reproduction is permitted which does not comply with these terms.
*Correspondence: Robin Tim Biermann, Ymllcm1hbm5AaWd6ZXYuZGU=
Disclaimer: All claims expressed in this article are solely those of the authors and do not necessarily represent those of their affiliated organizations, or those of the publisher, the editors and the reviewers. Any product that may be evaluated in this article or claim that may be made by its manufacturer is not guaranteed or endorsed by the publisher.
Research integrity at Frontiers
Learn more about the work of our research integrity team to safeguard the quality of each article we publish.