 Vicente Ortiz-Gómez1
 Alejandro Fernández-Quintero2
 Diego Fernando Roa-Acosta3Jesús Eduardo Bravo-Gómez3
 Jose Fernando Solanilla-Duque3*
- 1GIEPRONAL Research Group, School of Basic Sciences, Technology and Engineering, National University Open and Distance (UNAD), Bogotá, Colombia
- 2Department of Food Engineering, School of Engineering, Universidad del Valle, Ciudad Universitaria Meléndez, Cali, Colombia
- 3Departamento de Agroindustria, Facultad de Ciencias Agrarias, Universidad del Cauca, Popayán, Colombia
In recent years, great interest has been shown in pseudocereals for their high nutritional value. Wet milling has been used to obtain macromolecules such as proteins and starches. However, the co-products obtained from this food industry have been studied little. A factorial design Box-benhken was used to study the effect of surfactant concentration (SDS), sodium hydroxide (NaOH) concentration and maceration temperature on structural and colorimetric properties. Structural properties were evaluated by infrared spectroscopy (FTIR-ATR) and color changes by the CIElab tristimulus method (L*, a*, b*). A decrease in temperature and NaOH causes a decrease in lightness (L*), resulting in lower starch content and higher protein content in the co-product. This behavior was correlated with the infrared spectroscopy (FTIR-ATR) spectra. The spectra show a possible structural change in the amylose/amylopectin ratio of the starch granule at 1,012 cm−1, 1,077 cm−1, and 1,150 cm−1 bands, which are associated with glycosidic bonds, these bonds were sensitive to NaOH concentration. While those bands assigned to Amide II (1,563 cm−1) and Amide I (1,633 cm−1), were sensitive to the effect of NaOH and maceration temperature, evidencing that protein content in the co-products is variable and depends significantly on the extraction conditions. The co-products obtained by wet milling could be used in the development of functional foods, such as bread, snacks, pasta and other products.
Introduction
The consumer is currently looking for new products or compounds with high health benefits, therefore, the food industry market is in line with this consumption trend, generating constant changes in the development of new innovative products that meet these needs. The food industry is constantly looking for physical and chemical properties that contribute to improve the quality of these foods, understanding the changes of these properties but improving the functionality of the food (Schoenlechner, 2016; Feine et al., 2019; Giacomini et al., 2019; García-Parra et al., 2020). Quinoa originated in South America between Colombia and Chile (García-Parra et al., 2021). Evidence has been found that its domestication in Andean peoples dates back to ~3,000–7,000 B.C. (Bazile et al., 2016; Alandia et al., 2021). This pseudocereal is found at different latitudes and its production can occur under drought conditions (Pulvento et al., 2010; Jacobsen et al., 2012), abiotic stresses (Jacobsen et al., 2003), salinity (Hariadi et al., 2011; Adolf et al., 2013; Shabala et al., 2013), frost (Jacobsen et al., 2005) exhibiting a high tolerance to these environments (Ruiz et al., 2014). These qualities are exploited by breeders in the development of high-yielding cultivars in different regions. Quinoa diversity analyses have been developed under controlled or cold climate conditions and lack information related to grain compositional characteristics (García-Parra et al., 2020). Quinoa species show high adaptability to severe edaphoclimatic conditions, mainly related to drastic changes in temperature, salinity stress and lower water and nutrient availability. The high nutritional value of quinoa meets and exceeds that recommended by the World Health Organization (Ruiz et al., 2014). However, its greatest abundance in terms of morphological, ecophysiological, and nutritional diversity occurs in countries such as Ecuador, Bolivia, Peru, and Chile (García-Parra et al., 2020, 2021). Alandia et al. (2020), mentioned that this crop was produced in six countries and became a promising crop in more than 120 countries, of which 110 countries produced quinoa ~30 years ago. He also reported that the Andean region covers 76% of world exports with average yields below 1.1 t ha-1. New competitors in the Andean region cover 16% of global exports (Alandia et al., 2021). There is also a report of production in Ontario, Canada to satisfy the great demand, as well as in different parts of India among other countries (Singh, 2011; Mir et al., 2019). However, 74% of world exports are still supplied by Peru and Bolivia (Alandia et al., 2020).
The quinoa has a great nutritional advantage due to its protein and essential amino acid content, but its excellence and importance is not only in the amount of protein but also in its quality. It has been reported that the protein content of these species is between 10 and 20% (Kozioł, 1992; Abugoch James, 2009; Vega-Gálvez et al., 2010; Nowak et al., 2016; Qin et al., 2018). In recent years, many authors have reported studies related to its techno-functional properties, potential agro-industrial uses and consumption trends (Lamothe et al., 2015; Lopera-Cardona et al., 2016; Guardianelli et al., 2019; Thakur et al., 2019; Nasirpour-Tabrizi et al., 2020). Biological properties have been studied in relation to protein isolate and protein-protein interactions, given the characteristics of quinoa reserve proteins (Haros and Wronkowska, 2016; Gürbüz et al., 2018; Dakhili et al., 2019; Larbi et al., 2019).
Some chronic diseases like hypercholesterolemia, hypertension, diabetes can be prevented with adequate intake of active compounds. These compounds are found in significant amounts in pseudocereals such as quinoa and amaranth. On the other hand, great compositional differences (protein, lipids, fiber, and active compounds) have been reported between quinoa cultivars (Orona-Tamayo and Paredes-López, 2017; García-Parra et al., 2020).
Nowadays, there are around 17 cultivars, however, Chenopodium quinoa cv. Nariño, Chenopodium quinoa cv. Blanca Jericó, Chenopodium quinoa cv. Blanca Soraca. and Chenopodium quinoa cv. Tunkahuan are the species that have created strong (García-Parra et al., 2020) interest as an agricultural crop in recent years in Colombia, considering that they exceed in their proximal composition and attributes of quality to different cereals, with a high nutritional value of seeds and leaves.
Wet milling is the technological process used in the corn industry for the extraction of its chemical components. In recent years, this process has been implemented in quinoa in order to obtain starch and coproducts (Fernández-López et al., 2020). However, there are few studies on the physicochemical and techno-functional properties of the co-products, especially the protein-starch fraction. Therefore, the objective of this study was to determine the relationship between the extraction conditions and the structural properties of the quinoa co-products obtained by wet milling as a function of temperature and variation of surfactant (SDS) and alkali (NaOH) concentration.
Materials and Methods
Quinoa Grain
Quinoa grain was provided by Seguridad Alimentaria de Occidente SEGALCO SAS (Popayán, Colombia) with a moisture content of 10.8% (d.b). They were sieved to remove foreign matter and stored in sealed containers at room temperature prior to use. Analytical grade NaOH from Sigma Chemical Co. (St. Louis, MO, USA) and food grade sodium dodecyl sulfate (SDS) (J.T. Baker Co., Phillipsburg, NJ, USA).
Protein-Starch Fraction by Wet-Milling
The protein and starch fractions of the quinoa grain were extracted by the alkaline method (Xiong et al., 2017; Ballester-Sánchez et al., 2020) quinoa grains (100 g) were soaked in 300 mL of soaking solution with alkali concentration (0.1, 1.6, and 3.0% w/v NaOH) and surfactant concentration (0.1, 0.5, and 0.9% w/v SDS), during 24 h at temperatures 24, 37, and 51°C. Soaked, and drained grains were milled in a planetary mixer of 1 HP (Luna 20 WSM7L, Waring Commercial, USA) at full speed for 2 min. The homogenate was mixed with 200 mL of alkaline/surfactant solution. Then, 50 mL of the mixture was centrifuged in a centrifuge [high-Speed Universal Refrigerated Centrifuge, Hermle Benchmar (Z32HK), Germany] at 15,000 rpm for 15 min. The supernatant (soluble solids) and the mucilaginous layer (protein-starch fraction) were separated and neutralized. The protein-starch fractions were dried in a forced-air oven at 40°C for 48 h and stored in sealed containers until use. The co-product of the wet-milling process was screening in Tyler Ro-Tap test sieve shaker (Combustion Engineering, Inc., W. S. Tyler, Inc., Mentor, Ohio), to obtain a particle size of 150 μm.
Colorimetry of the Co-product of the Quinoa Grain
Colorimetric properties were determined using a Chroma Meter CM-5 Minolta (Konica Minolta, Inc., Japan). Lightness (L*) and red (+a*) and yellow (+b*) color indices were measured spectrophotometrically according to the CIELAB color system (CIE, 1986), with a D65 illuminant and an observation angle of 5°, for 15 treatments. The samples were placed in Petri dishes in a uniform manner, ensuring that the beam of light from the equipment only hit the sample of interest, performing the measurements at different points on the surface of the sample (Homez et al., 2018).
Attenuated Total Reflectance-Fourier Transform-Infrared Spectroscopy
Spectra were obtained on an FT-IR spectrometer model IRAFFINITY-1S (Shimadzu, Inc., Shelton CT, Japan) with a MIRacle 10 attenuated total reflectance (ATR) accessory (Shimadzu, Inc., Shelton CT, Japan) with a single reflection diamond crystal at an incidence angle of 45°. Measurements were obtained by taking the average of 45 scans with a resolution of 4 cm−1 at 25°C. Happ-Genzel apodization was used, with a magnitude phase correction. A flat tip was used to obtain an intimate contact between sample and crystal, without pressure control. A background spectrum was recorded in air (without sample) prior to each measurement. Spectra were acquired between 500 and 4,000 cm−1 and the mean of the replicates for each sample was reported. Spectral analysis was performed using OriginPro version 2016. Spectra were both baselines corrected and normalized (between 0 and 1). Software was employed to generate a second derivative and Fourier-transform self-deconvolution of the 700 and 2,000 cm−1 region. Deconvolved spectra were used to calculate peak intensity. The Gaussian function was applied to fit the deconvolved spectra. The relative area was calculated in each spectrum peak and area ratios of the bands at 1,032 and 1,005 cm−1 was used as convenient indexes of short-range starch conformation. As well as, to determine changes in the secondary structure of the proteins, between the bands at 1,600 to 1,700 cm−1 (Roa Acosta et al., 2020).
Statistical Analysis
To analyze the effect of the process variables on the structural and colorimetric properties, a Box-Behnken design was used (Table 1), applying the response surface method (RSM), this design was modeled by means of a second order polynomial equation to obtain response surfaces (Equation 1). A quadratic model with interactions was chosen according to the methodology described by Ballester-Sánchez et al. (2020) with some modifications (Roa-Acosta et al., 2020). In the response surface methodology (RSM), the studied responses (YK, K = 1, ... p) are fitted to the code factors (xi, i = 1, ... n) by the following polynomial model associated to the experimental design:
Where the coefficients a0, ai, and aii represent the constant, linear, and quadratic effects, respectively, and aij represents the interaction effect of coded factors xi and xj. The performance of models was evaluated by the adjusted coefficient of determination () (Equation 2) and mean square error (MSE) (Equation 3).
Where, Ec is the standard deviation associated with the sample; Eex is the standard deviation associated with the model estimations; yex represents the experimental values; yc represents the estimated values, and n is the number of experimental data points used for the model training and validation. The Statgraphics software package (Statistical Graphics Corporation, Virginia, Washington, DC, USA) was used for statistical analysis of the experimental design results. The significance of the effect of the wet-milling treatment on physical-chemical properties of protein-starch fraction was evaluated by two-way ANOVA. For all statistical analyses, a significance level of p <0.05 was adopted using Prism 6 (GraphPad Software Inc., San Diego, CA, USA).

Table 1. Box-Behnken experimental design for the study of wet milling, real, and coded variables.
Results and Discussion
In this research, the concentrations of sodium dodecyl sulfate (SDS), sodium hydroxide (NaOH) and temperature were controlled (Table 1). The process conditions were established in order to obtain different yields of the co-products, and possibly modify the physical and structural properties of the starches and proteins present. Color is an important physical property in the perception of food by consumers.
Colorimetry of the Co-product of the Quinoa Grain
The CIElab space was used for color measurement. The lightness (L*), red (+a*) and yellow (+b*) indices were determined spectrophotometrically allowing the color of different products and compounds to be established quantitatively (Kowalski et al., 2016). The color change in the fractions obtained under different extraction conditions by wet milling was determined. Figure 1A shows that the Lightness (L*) has high values, when simultaneously decreasing the temperature and sodium hydroxide (NaOH), indicating higher amount of starch and lower amount of protein in the co-product showing brown colorations in the co-product, i.e., when using high temperatures and high concentrations of sodium hydroxide (NaOH) in the wet milling process, the separation of the protein from the starch fraction is efficient.
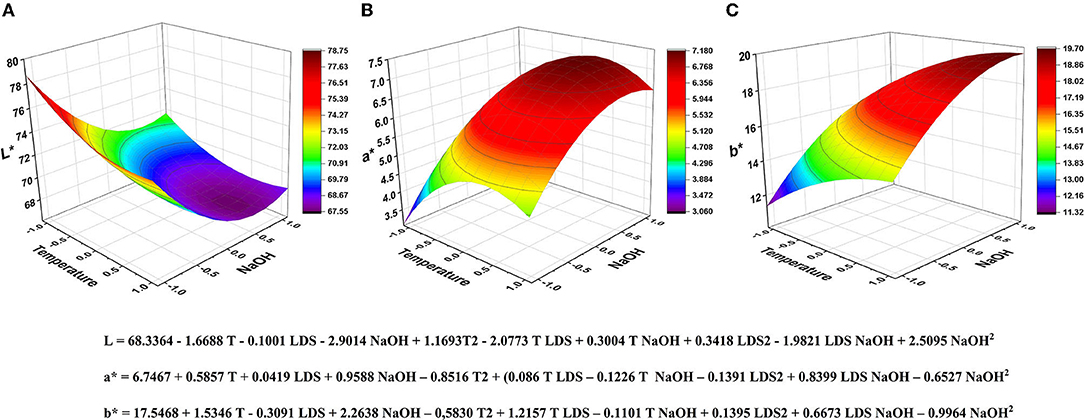
Figure 1. Estimated of L*, a*, b* coordinates by response surface modeling. Correlation of brightness values (L*) as a function of temperature and sodium hydroxide (NaOH) concentration, in the separation of proteins from the starch fraction in the co-product.
It was evidenced that the a*, b* coordinates were affected by the increase of NaOH concentration and maceration temperature, showing that at low process conditions, the values of both coordinates decrease, being inversely proportional to the behavior of the Lightness (L*). A second-degree polynomial equation was used to determine the response surface to estimate the Lightness . The a* (Figure 1B) coordinate has values between 3.0 and 7.1, suggesting that the analyzed samples tend to have light red colors, while the b* (Figure 1C) coordinate presents values between 11.08 and 19.80, showing a light yellow. Some authors such as Oli et al. (2016) have reported that the values of L*, a*, and b* in rice samples change according to their shape (husk, brown or milled) and variety, in their study, they also stated that the lightness increases and the values of a* and b* decrease when removing the husk and the bran layer of the rice, where the highest amount of protein is found. Quispe Ramirez (2017), also evaluated the effect of corn starch concentration in cheese, on colorimetric characteristics (L*, a*, b*) finding that as the concentration of starch in the product increases, the L* value increases, presenting a lighter color in the samples studied (Brend et al., 2012; Ballester-Sánchez et al., 2020). With the colorimetric analysis it is possible to determine the effect of the process conditions on the color of the co-products. In this study, the Lightness data (L*) agree with the data obtained through the structural analysis performed by FTIR-ATR, where it is observed that the higher the intensity of the protein bands of Amide I and Amide II, the lower the Lightness values, indicating a lower passage of light through the analyzed sample, which could be due to a higher protein content in the co-product.
FTIR-ATR Spectral Analysis of the Flours
Roa-Acosta et al. (2020) have reported that there is a correlation between the contents (starch, protein and lipids) and the intensities of the bands (1,150 cm−1; 1,648 cm−1; 2,925 cm−1), respectively (Figure 2). These authors observed an appropriate fit of these bands with the contents of protein (5−47%), starch (73–99%), lipids (2–23%), and that this relationship is independent of the sample, whether whole flour, endosperm flour, defatted flour and protein concentrates isolated by milling (Figure 3A). Proteins and peptides have three main absorption bands in the mid-infrared (MIR): amide I band, amide II band and amide III band region. According to Zhu et al. (2011), the bands between 1,200 and 1,700 cm−1 are the spectral range that are mainly assigned to the protein structure (e.g., amide I and amide II) and some specific amino acids (e.g., glutaminic acid). The N-H stretching bond (3,400–3,200 cm−1) is a characteristic band related to the vibrations of the amide groups in the polymers that allows the identification of the physical structure of the polymers (Schmidt et al., 2005). The most sensitive spectral region of secondary structural components of proteins corresponds to the amide I band (1,700–1,600 cm−1) that comes from the stretching vibration of the C=O double bond carbonyl groups of peptide bonds (80% C-C=O stretch, 10% C–N stretch) (Kong and Yu, 2007; Bock et al., 2013; Sivam et al., 2013). This spectral region is useful for the analysis of the specific secondary structural composition and its conformational changes of the protein according to studies performed by other authors (Kong and Yu, 2007; Liu et al., 2009; Shen et al., 2014; Luo et al., 2016): β-sheet (1,612–1,625 cm−1, 1,625–1,640 cm−1), α-helix (1,650–1,660 cm−1), β-turn (1,667–1,678 cm−1, 1,660–1,668 cm−1), and random coil (1,637–1,645 cm−1) (Siwatch et al., 2017). However, this absorption is ~1,660 cm−1 and is masked by the water signal from ~1,560 to 1,715 cm−1. This region is considered a vulnerable zone for secondary structure changes compared to the amide-II band. The amide-II band (1,580–1,480 cm−1) is mainly due to a bending of the N-H bond and stretching of the C-N (60%N–H bend, 30% C–N stretch, and 10% C–C stretch) bond vibrations (Güler et al., 2011; Bock et al., 2013; Sivam et al., 2013). The band at 1,652 cm−1 corresponding to the stretching of the carbonyl C=O bond and the band at 1,545 cm−1, to the effect of N-H bending and C-N stretching. Consequently, these two bands are the most common for the study of proteins and are known as amide I and amide II vibrations (Cremer and Kaletunç, 2003). The exact vibrational frequencies of the amide I and amide II bands depend on the nitrogen in the N-H bond/bond and carbon in the C=O bond/bond that is used or not used in protein and peptide bonding/binding (Poulsen et al., 2016). Similarly, the amide III band, ranging from 1,400 to 1,200 cm−1, is associated with C-N stretching and N-H bond flexion.
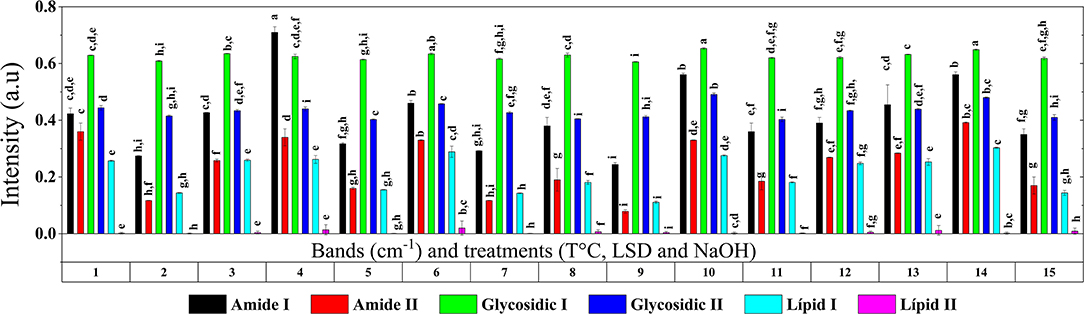
Figure 2. Intensity of the bands referring to proteins, carbohydrates and lipids at different treatments. Values represent the mean and deviation of duplicates. The different letters (a-i) show the significant difference between the treatments (p < 0.05), evaluating parametric and non-parametric behaviors to carry out a deeper analysis. Central design treatments (*1, *6, *12).
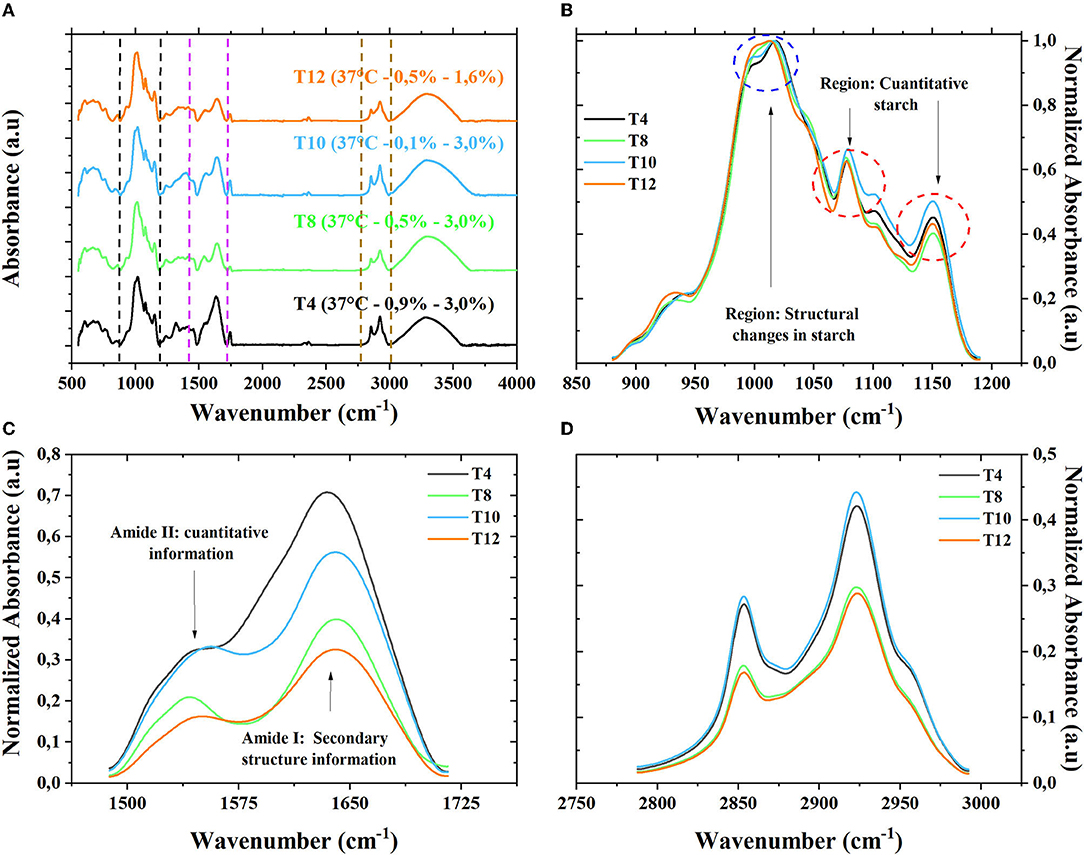
Figure 3. Normalized spectra of four treatments (A), Normalized spectra of the starches (B), Normalized spectra of the proteins (C), Normalized spectra of the lipids (D).
In this work, the structural composition of quinoa flour was analyzed by FT-IR analytical technique. For this purpose, the different flour treatments produced changes in the intensities of the characteristic regions of the lipid-related regions around 3,010–2,800 cm−1 and 1,770–1,710 cm−1 (Muik et al., 2007), the protein-related regions of amide I around 1,580–1,700 cm−1 and amide II around 1,580–1,480 cm−1 (Shotts et al., 2018) and the saccharide region around 942–1,184 cm−1 (Bock et al., 2013; Sivam et al., 2013) becoming reliable spectral regions for the differentiation of flour. Figure 2 shows the intensities of the bands at 1,633 cm−1 (amide I) and 1,563 cm−1 (amide II), which were associated with the protein content in the co-products. It is observed that the intensity of amide I is greater than amide II. It is important to note that the 1,563 cm−1 band was more sensitive to changes in protein content than the 1,633 cm−1 band, which makes it more suitable for monitoring the extraction process of quinoa protein. For example, the intensity (sample-T9) was lower than observed in sample (T14), this means an increase of the vibrations (functional group-NH2) in sample T14, and therefore, higher protein content (Figure 2).
The glycosidic bands at 1,077 and 1,150 cm−1 were associated with amylaceous content by the C-O-C vibrations functional group (Roa Acosta et al., 2020). For example, the intensity (sample-T9) was lower than observed in sample (T10), this means an increase of the vibrations (functional group-C-O-C) in sample T10, and therefore, higher starch content. Figure 2 shows the intensities between 2,800 and 3,000 cm−1, which are characteristic of lipids (Valenzuela et al., 2013; Siwatch et al., 2017; García-Salcedo et al., 2018). It has been reported that the bands at 2,922 and 2,854 cm−1 (corresponding to the symmetric and asymmetric stretching of the CH2 aliphatic groups, respectively) and that at 1,745 cm−1 (attributed to the stretching of the ester carbonyl group) are associated with lipids (Cueto et al., 2018; Cervantes-Ramírez et al., 2020; Rolandelli et al., 2021). The lipid peaks (Figure 3D) are found at an approximate wavenumber of 2,854 cm−1 corresponding to symmetric stretching vibrations and 2,924 cm−1 corresponding to asymmetric stretching vibrations (in both cases of the CH2 acyl groups) (Herrero et al., 2017). It can also be observed the change in the intensities of each of the spectra, which is generally attributed to changes in the conformational order of the lipid acyl chains and an increase in their dynamics (Valenzuela et al., 2013; Herrero et al., 2017; Bet et al., 2018). The absorptions at 2,922 and 2,854 cm−1, attributed to the asymmetric and symmetric stretching vibration of aliphatic CH2 groups, increased after roasting due to oxidation reactions (Abbas Ali et al., 2017; Jogihalli et al., 2017). Consequently, the variations in lipid contents after maceration processes in this work are in agreement with what was observed in FT-MIR spectra. Rolandelli et al. (2020, 2021) and other authors (Mir et al., 2017; Cueto et al., 2018) have reported that the formation of amylose-lipid complexes during extrusion can explain these modifications in that region of the spectrum of flours. At the end of the maceration process (time > 24 h), the intensity of the amide I and amide II bands starts to decrease in the co-productos. This is because it increases protein in the leaching water. Due to the significant differences (p <0.05) in the protein, starch, and lipid contents present in the co-products, the need arises to study the effects of the extraction conditions on this fraction.
Effect of the Maceration Conditions on the Co-product
Figure 3B shows a spectral region between bands (1,005 and 1,050 cm−1) to study the internal structure of the starch granule (García-Salcedo et al., 2018; Roa-Acosta et al., 2020). Variations in the intensities corresponding to the polysaccharide region can be attributed to the different content and type of starch and other types of polysaccharides present in the flour. These variations are in agreement with what has been observed by other authors (942–1,184 cm−1) (Warren et al., 2016b; Velásquez-Barreto et al., 2021), evidencing a significant effect of the maceration process on the structure of starch granules. These could be related to the mashing treatment to the change in starch structure. The literature reports, that the absorbances 1,047 and 1,022 cm−1 are related to short-range molecularly ordered chain clusters of starch or crystalline structures and amorphous regions, respectively (van Soest et al., 1995; Smits et al., 1998; Warren et al., 2016a; Nhouchi and Karoui, 2018). Therefore, it is to be expected that the maceration treatment influences the disorganization of the ordered starch chains in the granules, as observed in the different treatments.
In the Figure 3C some spectrals variations were observed, this could be due to the effect of maceration conditions (temperature, NaOH, SDS). These changes affect the 1,633 cm−1 band, which is related with the secondary structure of the protein present in the quinoa flours (Roa Acosta et al., 2020; Roa-Acosta et al., 2020). The observed signal for amide I and II is possible due to β-sheet, α-helix, random coil conformations (Kotsiou et al., 2021, 2022). Consequently, the maceration temperature could give rise to α-helix structures corresponding to intermediate stages of α-helix folding/unfolding and less stretched structures (Kong and Yu, 2007). These variations could indicate a partial unfolding of the protein due to the maceration temperature applied to the flour, an effect that produces conformational changes in the proteins. These changes are more evident when increases in β-Sheet and β-turn structures are evidenced, and consequently a decrease in α-helix type structures. The above references explain the change in the shape of the spectra.
Figure 4 shows a positive effect (yellow color) on amide I (1,633 cm−1), glycosidic II (1,077 cm−1), and lipid I (2,852 cm−1) bands. This means that, by increasing the hydroxide concentration, the extraction process is favored in the range of concentrations studied. This effect is since sodium ions attack the interaction between the starch granule and protein, therefore, by increasing the concentration of these ions it will cause a leaching effect of the proteins. Likewise, the positive effect of temperature on protein extraction is mainly due to the fact that an increase in the temperature, produces an increase in the kinetic constants of hydration, therefore, it facilitates the entry of the reagent on protein / starch interaction (Mistry and Eckhoff, 1992; Lai, 2001; BeMiller, 2018).
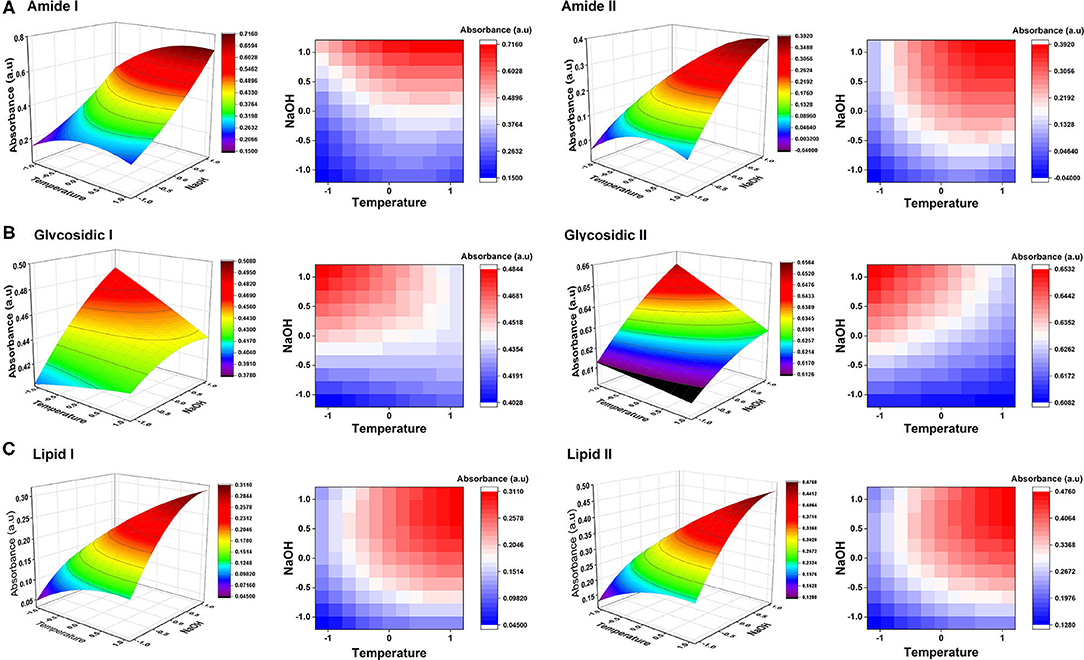
Figure 4. Standardized pareto diagram (left) and main effect (right) of the maceration on the structure of lipids (A), proteins (amide I y amide II) (B), and starch (glycosidic I and II) presents in the co-product (C).
A quadratic effect of temperature is observed on the amide II band, this means that there is a critical temperature from which the effect of temperature on protein extraction changes direction. If the critical temperature is exceeded, then the extraction yield is decreased, therefore, it would be highly likely that this protein would be lost in the process water (Beck et al., 2017a,b). Figure 4 shows better the effects of operating conditions on the intensity of the amides, for example, low concentrations of NaOH (−1) and low temperatures (−1), the intensity of the amides is low, that is that the concentration of protein in the mixture decreases, however, as these variables increase, the intensity of the NH2 group increases (Vera et al., 2019). The decrease in protein content may be due to the increase in the diffusion coefficients, which are affected by the increase in temperature. This phenomenon increases the soluble solids in the maceration waters. The concentration of SDS had a negative effect on the extraction efficiency of starch and lipids, this is due to the surfactant effect of SDS, which adheres to lipid molecules and allows them to be easily leached by water. Figure 5 shows the different response surfaces, which were modeled by a second-order polynomial equation. Figure 5 shows the behavior of starches, proteins, and lipids when they are subjected to different extraction conditions. The statistical significance test for each effect consists of comparing its mean square against an estimate of the experimental error. In this case, 3 effects have a P <0.05, indicating that they are significantly different from zero with a confidence level of 95.0%.
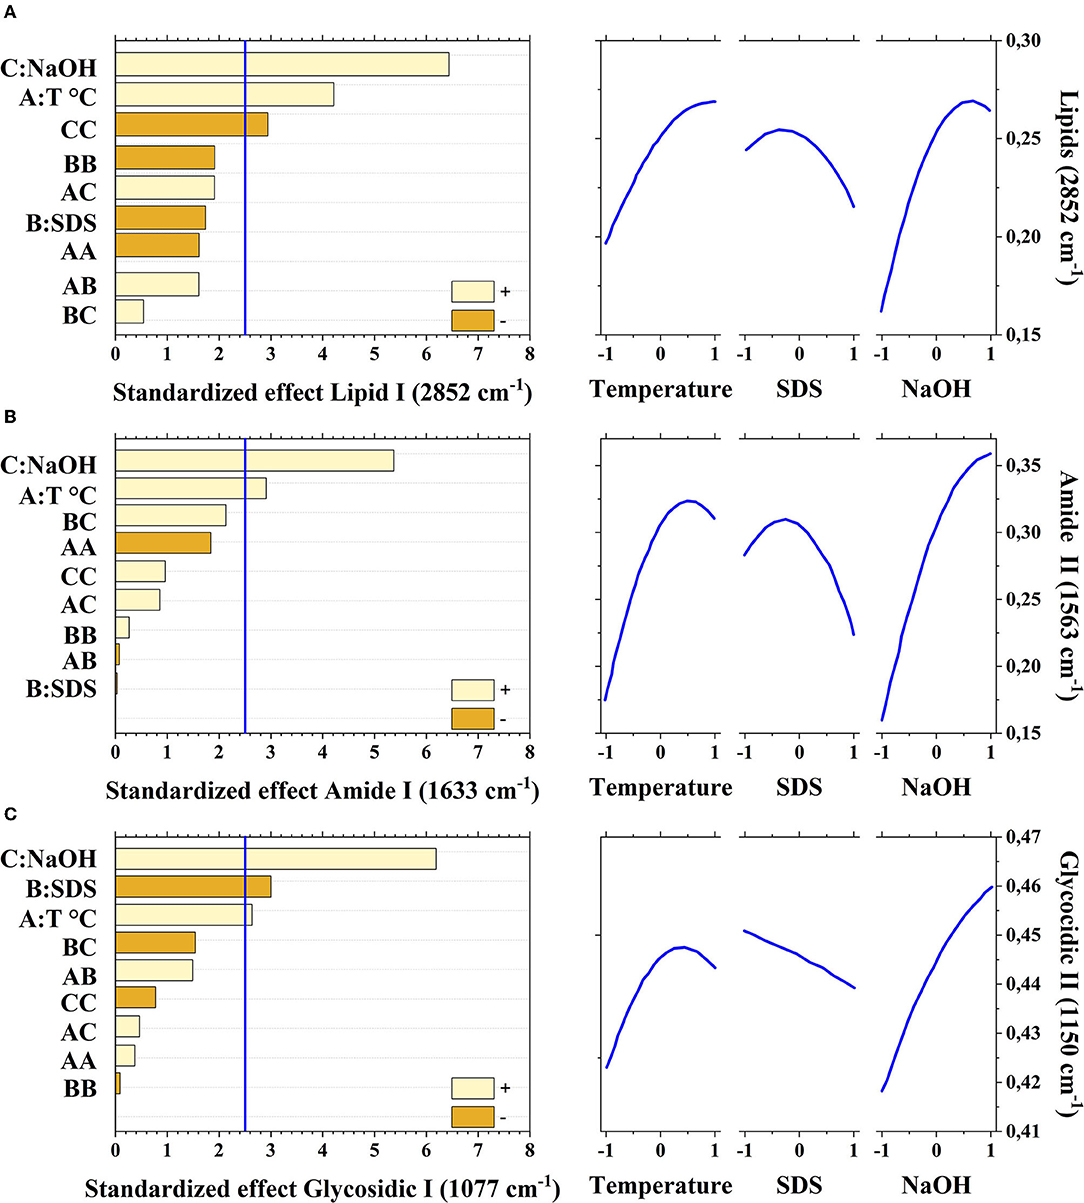
Figure 5. Estimated of lipids (2,852 and 2,921 cm−1) band absorbance (A), amide I and II (1,633 and 1,563 cm−1) band absorbance (B), glycosidic (1,077 and 1,150 cm−1) bond absorbance (C) by response surface modeling.
Dakhili et al. (2019) found that protein configurations are affected by heat treatments, generating conformational and aggregation changes, causing the albumin and globulin denaturation present in the quinoa grain; The heating in the wet milling could cause a splitting of the secondary structures, which caused the dissociation and/or aggregation at the level of the quaternary structure of the proteins, which affected the solubility and modified the extraction of these in the wet milling (Loubes and Tolaba, 2014). On the other hand, in a study by Radosavljevic et al. (1998), it was shown that high concentrations of sodium hydroxide improves the starch extraction process, that is, it facilitates a better separation with the protein, in said study two concentrations of sodium hydroxide were used, 0.25% was used in the first solution, obtaining a recovery of 72.4% ± 5.4 of starch with a protein content (impurity) of 0.40% ± 0.12 , while with the 1% NaOH solution 79.4% ± 1.1 of starch was obtained with a protein content of 0.08 ± 0.001. The present work shows the same behavior, since as shown in the Figure 2, treatments (T4, T8, T10, and T14) with 3%w/v of NaOH, obtained higher intensities in the protein region compared to other treatments of lower concentration as treatment T11 which worked at 0.20%w/v of NaOH. It can be said that high starch yield and low protein content in the starch granules are indicators of a good wet milling process (Myers and Fox, 1994; Ballester-Sánchez et al., 2019, 2020). On the other hand, the higher protein yield in the co-product is also since albumins are the main protein fraction in the Quinoa grain, which is from 42 to 46% of the total proteins, which are highly soluble in alkaline solutions (Roa et al., 2015; Orona-Tamayo and Paredes-López, 2017; Roa-Acosta et al., 2020).
Conclusion
It was evidenced that the color of the starch-protein fractions was affected by the maceration conditions used in the wet milling process. In this color change, it was observed that the Lightness (L*) agrees with that observed in the structural analysis by FTIR, concluding that the higher the intensity of the protein bands of Amide I and Amide II, the lower the Lightness values, indicating a lower passage of light through the analyzed sample, evidencing a higher protein content in the co-product. In this structural analysis, it was observed that in the maceration process the intensity of the bands of amide I and amide II decreases, due to the increase of the protein content in the leaching water, and in part also, to the protein, starch, and lipid contents in the co-products. In addition, the combined effect of temperature and sodium hydroxide modified the internal structure of the starch granule and the tertiary structure of the protein. Consequently, the effect the protein content in the co-products. Therefore, the need arises to study the effects of the extraction conditions on these fractions and their technical-functional properties for the development of new functional foods, and also serves as a basis for optimizing the maceration stage in wet milling for the utilization of co-products from quinoa grain. Although these results are promising for the development of new products, it is necessary to quantify the components present in the process water, as well as the formulation of products based on the by-product and to carry out the respective shelf-life study under refrigeration and ambient temperature conditions. on the other hand, it is necessary to establish the rheological behaviors, thermal properties and the structure of the gels formed to obtain and analyze the changes of the by-product when subjected to gelatinization.
Data Availability Statement
The original contributions presented in the study are included in the article/supplementary material, further inquiries can be directed to the corresponding author/s.
Author Contributions
VO-G, JS-D, and DR-A: methodology, formal analysis, and investigation. AF-Q and JB-G: conceptualization, investigation, supervisión, content, and data curation. JS-D: writing. VO-G and DR-A: writing original draft. All authors contributed to the article and approved the submitted version.
Conflict of Interest
The authors declare that the research was conducted in the absence of any commercial or financial relationships that could be construed as a potential conflict of interest.
Publisher's Note
All claims expressed in this article are solely those of the authors and do not necessarily represent those of their affiliated organizations, or those of the publisher, the editors and the reviewers. Any product that may be evaluated in this article, or claim that may be made by its manufacturer, is not guaranteed or endorsed by the publisher.
Acknowledgments
The authors acknowledge support from Project Quinoa (SGR) BPIN 2020000100052 and ID code 5637, Universidad del Cauca, Universidad del Valle for technical support, and National University Open and Distance (UNAD) for technical support.
References
Abbas Ali, M., Anowarul Islam, M., Othman, N. H., and Noor, A. M. (2017). Effect of heating on oxidation stability and fatty acid composition of microwave roasted groundnut seed oil. J. Food Sci. Technol. 54, 4335–4343. doi: 10.1007/s13197-017-2904-1
Abugoch James, L. E.. (2009). “Quinoa (Chenopodium quinoa Willd.): composition, chemistry, nutritional, and functiona properties,” in Advances in Food and Nutrition Research, 1st Edn, ed. Taylor, S. L. Vol. 58 (Boston, MA: Elsevier Inc), p. 1–31. doi: 10.1016/S1043-4526(09)58001-1
Adolf, V. I., Jacobsen, S.-E., and Shabala, S. (2013). Salt tolerance mechanisms in quinoa (Chenopodium quinoa Willd.). Environ. Exp. Botany 92, 43–54. doi: 10.1016/j.envexpbot.2012.07.004
Alandia, G., Odone, A., Rodriguez, J. P., Bazile, D., and Condori, B. (2021). “Quinoa—evolution and future perspectives,” in The Quinoa Genome: Compendium of Plant Genomes, ed S. M. Schmöckel (Cham: Springer), 179–195.
Alandia, G., Rodriguez, J. P., Jacobsen, S.-E., Bazile, D., and Condori, B. (2020). Global expansion of quinoa and challenges for the Andean region. Global Food Security 26, 100429. doi: 10.1016/j.gfs.2020.100429
Ballester-Sánchez, J., Fernández-Espinar, M. T., and Haros, C. M. (2020). Isolation of red quinoa fibre by wet and dry milling and application as a potential functional bakery ingredient. Food Hydrocolloids 101. doi: 10.1016/j.foodhyd.2019.105513
Ballester-Sánchez, J., Gil, J. V., Fernández-Espinar, M. T., and Haros, C. M. (2019). Quinoa wet-milling: effect of steeping conditions on starch recovery and quality. Food Hydrocolloids 89, 837–843. doi: 10.1016/j.foodhyd.2018.11.053
Bazile, D., Jacobsen, S.-E., and Verniau, A. (2016). The global expansion of quinoa: trends and limits. Front. Plant Sci. 7, 622. doi: 10.3389/fpls.2016.00622
Beck, S. M., Knoerzer, K., and Arcot, J. (2017a). Effect of low moisture extrusion on a pea protein isolate's expansion, solubility, molecular weight distribution and secondary structure as determined by Fourier Transform Infrared Spectroscopy (FTIR). J. Food Eng. 214, 166–174. doi: 10.1016/j.jfoodeng.2017.06.037
Beck, S. M., Knoerzer, K., Sellahewa, J., Emin, M. A., and Arcot, J. (2017b). Effect of different heat-treatment times and applied shear on secondary structure, molecular weight distribution, solubility and rheological properties of pea protein isolate as investigated by capillary rheometry. J. Food Eng. 208, 66–76. doi: 10.1016/j.jfoodeng.2017.03.016
BeMiller, J. N.. (2018). “Physical modification of starch,” in Starch in Food: Structure, Function and Applications: Second Edition, eds M. SjööM, L. Nilsson (Boston, MA: Elsevier Inc.), 223–253. doi: 10.1016/B978-0-08-100868-3.00005-6
Bet, C. D., de Oliveira, C. S., Colman, T. A. D., Marinho, M. T., Lacerda, L. G., Ramos, A. P., et al. (2018). Organic amaranth starch: a study of its technological properties after heat-moisture treatment. Food Chem. 264, 435–442. doi: 10.1016/j.foodchem.2018.05.021
Bock, J. E., Connelly, R. K., and Damodaran, S. (2013). Impact of bran addition on water properties and gluten secondary structure in wheat flour doughs studied by attenuated total reflectance fourier transform infrared spectroscopy. Cereal Chem. J. 90, 377–386. doi: 10.1094/CCHEM-01-13-0008-FI
Brend, Y., Galili, L., Badani, H., Hovav, R., and Galili, S. (2012). Total phenolic content and antioxidant activity of red and yellow quinoa (Chenopodium quinoa Willd.) seeds as affected by baking and cooking conditions. Food Nutr. Sci. 3, 1150–1155. doi: 10.4236/fns.2012.38151
Cervantes-Ramírez, J. E., Cabrera-Ramirez, A. H., Morales-Sánchez, E., Rodriguez-García, M. E., de la Luz Reyes-Vega, M., Ramírez-Jiménez, A. K., et al. (2020). Amylose-lipid complex formation from extruded maize starch mixed with fatty acids. Carbohydrate Polymers 246, 116555. doi: 10.1016/j.carbpol.2020.116555
CIE P. Colorimetry. 2nd ed. Publ. CIE No. 15.2. Wien Austria. Austria: Central Bureau of the Comission Internationale de L'Eclairage Viena. (1986). p. 15–22.
Cremer, D. R., and Kaletunç, G. (2003). Fourier transform infrared microspectroscopic study of the chemical microstructure of corn and oat flour-based extrudates. Carbohydrate Polymers 52, 53–65. doi: 10.1016/S0144-8617(02)00266-7
Cueto, M., Farroni, A., Rodríguez, S. D., Schoenlechner, R., Schleining, G., and del Pilar Buera, M. (2018). Assessing changes in enriched maize flour formulations after extrusion by means of FTIR, XRD, and chemometric analysis. Food Bioprocess Technol. 11, 1586–1595. doi: 10.1007/s11947-018-2113-6
Dakhili, S., Abdolalizadeh, L., Hosseini, S. M., Shojaee-Aliabadi, S., and Mirmoghtadaie, L. (2019). Quinoa protein: Composition, structure and functional properties. Food Chem. 299:125161. doi: 10.1016/j.foodchem.2019.125161
Fernández-López, J., Lucas-González, R., Viuda-Martos, M., Sayas-Barberá, E., Ballester-Sánchez, J., Haros, C. M., et al. (2020). Chemical and technological properties of bologna-type sausages with added black quinoa wet-milling coproducts as binder replacer. Food Chem. 310, 125936. doi: 10.1016/j.foodchem.2019.125936
Feine LB, Harwood RR, Kauffman CS. (2019). “Amaranth,” in New Agric Crop.1st Edition., ed. G. A. Ritchie (New York, NY: CRC Press), p. 41–63.
García-Parra, M., Roa-Acosta, D., García-Londoño, V., Moreno-Medina, B., and Bravo-Gomez, J. (2021). Structural characterization and antioxidant capacity of quinoa cultivars using techniques of FT-MIR and UHPLC/ESI-Orbitrap MS spectroscopy. Plants 10, 2159. doi: 10.3390/plants10102159
García-Parra, M., Zurita-Silva, A., Stechauner-Rohringer, R., Roa-Acosta, D., and Jacobsen, S.-E. (2020). Quinoa (Chenopodium quinoa Willd.) and its relationship with agroclimatic characteristics: a Colombian perspective. Chilean J. Agric. Res. 80, 290–302. doi: 10.4067/S0718-58392020000200290
García-Salcedo, Á. J., Torres-Vargas, O. L., and Ariza-Calderón, H. (2018). Physical-chemical characterization of quinoa (Chenopodium quinoa Willd.), amaranth (Amaranthus caudatus L.), and chia (Salvia hispanica L.) flours and seeds. Scielo.Org.Co 67, 215–222. doi: 10.15446/acag.v67n2.63666
Giacomini, D. A., Westra, P., and Ward, S. M. (2019). Variable inheritance of amplified EPSPS gene copies in glyphosate-resistant palmer amaranth (Amaranthus palmeri). Weed Sci. 67, 176–182. doi: 10.1017/wsc.2018.65
Guardianelli, L. M., Salinas, M. V., and Puppo, M. C. (2019). Hydration and rheological properties of amaranth-wheat flour dough: influence of germination of amaranth seeds. Food Hydrocolloids 97:105242. doi: 10.1016/j.foodhyd.2019.105242
Güler, G., DŽafić, E., Vorob'ev, M. M., Vogel, V., and Mäntele, W. (2011). Real time observation of proteolysis with Fourier transform infrared (FT-IR) and UV-circular dichroism spectroscopy: watching a protease eat a protein. Spectrochim. Acta Part A Mol. Biomol. Spectroscopy 79, 104–111. doi: 10.1016/j.saa.2011.01.055
Gürbüz, G., Kauntola, V., Ramos Diaz, J. M., Jouppila, K., and Heinonen, M. (2018). Oxidative and physical stability of oil-in-water emulsions prepared with quinoa and amaranth proteins. Euro. Food Res. Technol. 244, 469–479. doi: 10.1007/s00217-017-2973-4
Hariadi, Y., Marandon, K., Tian, Y., Jacobsen, S.-E., and Shabala, S. (2011). Ionic and osmotic relations in quinoa (Chenopodium quinoa Willd.) plants grown at various salinity levels. J. Exp. Bot. 62, 185–193. doi: 10.1093/jxb/erq257
Haros, C. M., and Wronkowska, M. (2016). “Pseudocereal dry and wet milling: processes, products and applications,” in Pseudocereals: Chemistry and Technology, eds C. M. Haros, R. Schonlechner (Chichester: John Wiley & Sons, Ltd), p. 140–162. doi: 10.1002/9781118938256.ch7
Herrero, A. M., Ruiz-Capillas, C., Pintado, T., Carmona, P., and Jimenez-Colmenero, F. (2017). Infrared spectroscopy used to determine effects of chia and olive oil incorporation strategies on lipid structure of reduced-fat frankfurters. Food Chem. 221, 1333–1339. doi: 10.1016/j.foodchem.2016.11.022
Homez, A. K., Daza, L. D., Solanilla, J. F., and Váquiro, H. A. (2018). “Effect of temperature, starch and plasticizer concentrations on color parameters of ulluco (Ullucus tuberosus Caldas) edible films,” in IOP Conference Series: Materials Science and Engineering, 437. doi: 10.1088/1757-899X/437/1/012003
Jacobsen, S.-E., Jensen, C. R., and Liu, F. (2012). Improving crop production in the arid Mediterranean climate. Field Crops Res. 128, 34–47. doi: 10.1016/j.fcr.2011.12.001
Jacobsen, S.-E., Monteros, C., Christiansen, J. L., Bravo, L. A., Corcuera, L. J., and Mujica, A. (2005). Plant responses of quinoa (Chenopodium quinoa Willd.) to frost at various phenological stages. Euro. J. Agronomy 22, 131–139. doi: 10.1016/j.eja.2004.01.003
Jacobsen, S.-E., Mujica, A., and Jensen, C. R. (2003). The resistance of quinoa (Chenopodium quinoa Willd.) to adverse abiotic factors. Food Rev. Int. 19, 99–109. doi: 10.1081/FRI-120018872
Jogihalli, P., Singh, L., Kumar, K., and Sharanagat, V. S. (2017). Novel continuous roasting of chickpea (Cicer arietinum): study on physico-functional, antioxidant and roasting characteristics. LWT 86, 456–464. doi: 10.1016/j.lwt.2017.08.029
Kong, J., and Yu, S. (2007). Fourier transform infrared spectroscopic analysis of protein secondary structures. Acta Biochim. Biophys. Sin. 39, 549–559. doi: 10.1111/j.1745-7270.2007.00320.x
Kotsiou, K., Sacharidis, D.-D., Matsakidou, A., Biliaderis, C. G., and Lazaridou, A. (2021). Impact of roasted yellow split pea flour on dough rheology and quality of fortified wheat breads. Foods 10, 1832. doi: 10.3390/foods10081832
Kotsiou, K., Sacharidis, D.-D., Matsakidou, A., Biliaderis, C. G., and Lazaridou, A. (2022). Physicochemical and functional aspects of composite wheat-roasted chickpea flours in relation to dough rheology, bread quality and staling phenomena. Food Hydrocolloids 124, 107322. doi: 10.1016/j.foodhyd.2021.107322
Kowalski, R. J., Medina-Meza, I. G., Thapa, B. B., Murphy, K. M., and Ganjyal, G. M. (2016). Extrusion processing characteristics of quinoa (Chenopodium quinoa Willd.) var. Cherry Vanilla. J. Cereal Sci. 70, 91–98. doi: 10.1016/j.jcs.2016.05.024
Kozioł, M. J.. (1992). Chemical composition and nutritional evaluation of quinoa (Chenopodium quinoa Willd.). J. Food Composition Anal. 5, 35–68. doi: 10.1016/0889-1575(92)90006-6
Lai, H. M.. (2001). Effects of hydrothermal treatment on the physicochemical properties of pregelatinized rice flour. Food Chem. 72, 455–463. doi: 10.1016/S0308-8146(00)00261-2
Lamothe, L. M., Srichuwong, S., Reuhs, B. L., and Hamaker, B. R. (2015). Quinoa (Chenopodium quinoa W.) and amaranth (Amaranthus caudatus L.) provide dietary fibres high in pectic substances and xyloglucans. Food Chem. 167, 490–496. doi: 10.1016/j.foodchem.2014.07.022
Larbi, A. A., Loumani, A., Mediani, A., Bennaceur, S., and Tigani, C. (2019). Experimental measurement of moisture sorption isotherms and isosteric heat of palm hearts (Jomare) harvested in the algerian sahara. Instrumentation Mesure Métrologie 18, 297–304. doi: 10.18280/i2m.180310
Liu, G., Li, J., Shi, K., Wang, S., Chen, J., Liu, Y., et al. (2009). Composition, secondary structure, and self-assembly of oat protein isolate. J. Agric. Food Chem. 57, 4552–4558. doi: 10.1021/jf900135e
Lopera-Cardona, S., Gallardo, C., Umaña-Gallego, J., and Gil, L. M. (2016). Comparative study of the physicochemical, compositional and functional properties of eight flours obtained from different plant materials found in Colombia. Food Sci. Technol. Int. 22, 699–707. doi: 10.1177/1082013216642611
Loubes, M. A., and Tolaba, M. P. (2014). Thermo-mechanical rice flour modification by planetary ball milling. LWT Food Sci. Technol. 57, 320–328. doi: 10.1016/j.lwt.2013.12.048
Luo, Y., Li, M., Zhu, K.-X., Guo, X.-N., Peng, W., and Zhou, H.-M. (2016). Heat-induced interaction between egg white protein and wheat gluten. Food Chem. 197, 699–708. doi: 10.1016/j.foodchem.2015.09.088
Mir, N., Riar, C., and Singh, S. (2019). Structural modification of quinoa seed protein isolates (QPIs) by variable time sonification for improving its physicochemical and functional characteristics. Ultrasonics Sonochem. 58, 104700. doi: 10.1016/j.ultsonch.2019.104700
Mir, S. A., Bosco, S. J. D., Bashir, M., Shah, M. A., and Mir, M. M. (2017). Physicochemical and structural properties of starches isolated from corn cultivars grown in Indian temperate climate. Int. J. Food Properties 20, 821–832. doi: 10.1080/10942912.2016.1184274
Mistry, A. H., and Eckhoff, S. R. (1992). Characteristics of alkali-extracted starch obtained from corn flour. Cereal Chem. 69, 296–303.
Muik, B., Lendl, B., Molina-Diaz, A., Valcarcel, M., and Ayora-Cañada, M. J. (2007). Two-dimensional correlation spectroscopy and multivariate curve resolution for the study of lipid oxidation in edible oils monitored by FTIR and FT-Raman spectroscopy. Anal. Chim. Acta 593, 54–67. doi: 10.1016/j.aca.2007.04.050
Myers, D. J., and Fox, S. R. (1994). Alkali wet-milling characteristics of pearled and unpearled amaranth seed. Cereal Chem. 71, 96–99.
Nasirpour-Tabrizi, P., Azadmard-Damirchi, S., Hesari, J., and Piravi-Vanak, Z. (2020). “Amaranth seed oil composition,” in Nutritional Value of Amaranth [Working Title], 1st Edn, ed. V. Y. Waisundara (London: IntechOpen). doi: 10.5772/intechopen.91381
Nhouchi, Z., and Karoui, R. (2018). Application of Fourier-transform mid infrared spectroscopy for the monitoring of pound cakes quality during storage. Food Chem. 252, 327–334. doi: 10.1016/j.foodchem.2018.01.122
Nowak, V., Du, J., and Charrondière, U. R. (2016). Assessment of the nutritional composition of quinoa (Chenopodium quinoa Willd.). Food Chem. 193, 47–54. doi: 10.1016/j.foodchem.2015.02.111
Oli P Ward R, Adhikari B. Colour change in rice during hydration: Effect of hull and bran layers. J Food Eng. (2016) 173:49–58. doi: 10.1016/j.jfoodeng.2015.10.036.
Orona-Tamayo, D., and Paredes-López, O. (2017). “Amaranth part 1—Sustainable crop for the 21st century,” In: Nadathur SR, Wanasundara JPD, Scanlin L, editors. Sustain Protein Sources. Boston, MA: Elsevier (2017). p. 239–256. doi: 10.1016/B978-0-12-802778-3.00015-9
Poulsen, N. A., Eskildsen, C. E., Akkerman, M., Johansen, L. B., Hansen, M. S., Hansen, P. W., et al. (2016). Predicting hydrolysis of whey protein by mid-infrared spectroscopy. Int. Dairy J. 61, 44–50. doi: 10.1016/j.idairyj.2016.04.002
Pulvento, C., Riccardi, M., Lavini, A., D'Andria, R., Iafelice, G., and Marconi, E. (2010). Field trial evaluation of two Chenopodium quinoa genotypes grown under rain-fed conditions in a typical mediterranean environment in South Italy. J. Agronomy Crop Sci. 196, 407–411. doi: 10.1111/j.1439-037X.2010.00431.x
Qin, X. S., Luo, Z. G., and Peng, X. C. (2018). Fabrication and characterization of quinoa protein nanoparticle-stabilized food-grade pickering emulsions with ultrasound treatment: interfacial adsorption/arrangement properties. J. Agric. Food Chem. 66, 4449–4457. doi: 10.1021/acs.jafc.8b00225
Quispe Ramirez, S. K.. (2017). Effect of the Starch Concentration of Adulted Commercial Mantecoso Cheese on the Colorimetric Characteristics by Computer Vision. Universidad Nacional De Trujillo Facultad De Ciencias Agropecuarias. Available online at: http://dspace.unitru.edu.pe/handle/UNITRU/10058
Radosavljevic, M., Jane, J., and Johnson, L. A. (1998). Isolation of amaranth starch by diluted alkaline-protease treatment. Cereal Chem. J. 75, 212–216. doi: 10.1094/CCHEM.1998.75.2.212
Roa Acosta, D. F., Solanilla Duque, J. F., Agudelo Laverde, L. M., Villada Castillo, H. S., and Tolaba, M. P. (2020). Structural and thermal properties of the amaranth starch granule obtained by high-impact wet milling. Int. J. Food Eng. 16:20200024. doi: 10.1515/ijfe-2020-0024
Roa, D. F., Baeza, R. I., and Tolaba, M. P. (2015). Effect of ball milling energy on rheological and thermal properties of amaranth flour. J. Food Sci. Technol. 52, 8389–8394. doi: 10.1007/s13197-015-1976-z
Roa-Acosta, D. F., Bravo-Gómez, J. E., García-Parra, M. A., Rodríguez-Herrera, R., and Solanilla-Duque, J. F. (2020). Hyper-protein quinoa flour (Chenopodium quinoa Wild): monitoring and study of structural and rheological properties. LWT 121, 108952. doi: 10.1016/j.lwt.2019.108952
Rolandelli, G., Gallardo-Navarro, Y. T., García Pinilla, S., Farroni, A. E., Gutiérrez-López, G. F., Buera, M., et al. (2021). Components interactions and changes at molecular level in maize flour-based blends as affected by the extrusion process. A multi-analytical approach. J. Cereal Sci. 99, 103186. doi: 10.1016/j.jcs.2021.103186
Rolandelli, G., García-Navarro, Y. T., García-Pinilla, S., Farroni, A. E., Gutiérrez-López, G. F., Buera, M., et al. (2020). Microstructural characteristics and physical properties of corn-based extrudates affected by the addition of millet, sorghum, quinoa and canary seed flour. Food Struct. 25, 100140. doi: 10.1016/j.foostr.2020.100140
Ruiz, K. B., Biondi, S., Oses, R., Acuña-Rodríguez, I. S., Antognoni, F., Martinez-Mosqueira, E. A., et al. (2014). Quinoa biodiversity and sustainability for food security under climate change. A review. Agronomy Sustain. Dev. 34. doi: 10.1007/s13593-013-0195-0
Schmidt, P., Dybal, J., Rodriguez-Cabello, J. C., and Reboto, V. (2005). Role of water in structural changes of poly(AVGVP) and poly(GVGVP) studied by FTIR and Raman spectroscopy and ab initio calculations. Biomacromolecules 6, 697–706. doi: 10.1021/bm049461t
Schoenlechner, R.. (2016). “Pseudocereals in gluten-free products,” in Pseudocereals: Chemistry and Technology 193−216. doi: 10.1002/9781118938256.ch9
Shabala, S., Hariadi, Y., and Jacobsen, S.-E. (2013). Genotypic difference in salinity tolerance in quinoa is determined by differential control of xylem Na+ loading and stomatal density. J. Plant Physiol. 170, 906–914. doi: 10.1016/j.jplph.2013.01.014
Shen, F., Niu, F., Li, J., Su, Y., Liu, Y., and Yang, Y. (2014). Interactions between tea polyphenol and two kinds of typical egg white proteins—ovalbumin and lysozyme: effect on the gastrointestinal digestion of both proteins in vitro. Food Res. Int. 59, 100–107. doi: 10.1016/j.foodres.2014.01.070
Shotts, M.-L., Plans Pujolras, M., Rossell, C., and Rodriguez-Saona, L. (2018). Authentication of indigenous flours (Quinoa, Amaranth and kañiwa) from the Andean region using a portable ATR-Infrared device in combination with pattern recognition analysis. J. Cereal Sci. 82, 65–72. doi: 10.1016/j.jcs.2018.04.005
Singh, N. (2011). “Functional and physicochemical properties of pulse starch,” in Pulse Foods, 1st Edn., eds B. Tiwari, Gowen, A., and B. McKenna (Boston, MA: Elsevier), 91–119.
Sivam, A. S., Sun-Waterhouse, D., Perera, C. O., and Waterhouse, G. I. N. (2013). Application of FT-IR and Raman spectroscopy for the study of biopolymers in breads fortified with fibre and polyphenols. Food Res. Int. 50, 574–585. doi: 10.1016/j.foodres.2011.03.039
Siwatch, M., Yadav, R. B., and Yadav, B. S. (2017). X-ray diffraction, rheological and FT-IR spectra studies of processed amaranth (Amaranthus hypochondriacus). J. Food Measure. Character. 11, 1717–1724. doi: 10.1007/s11694-017-9552-z
Smits, A. L. M., Ruhnau, F. C., Vliegenthart, J. F. G., and Van Soest, J. J. G. (1998). Ageing of starch based systems as observed with FT-IR and solid state NMR spectroscopy. Starch 50, 478–483. doi: 10.1002/(SICI)1521-379X(199812)50:11/12<478::AID-STAR478>3.0.CO;2-P
Thakur, R., Pristijono, P., Bowyer, M., Singh, S. P., Scarlett, C. J., Stathopoulos, C. E., et al. (2019). A starch edible surface coating delays banana fruit ripening. LWT 100, 341–347. doi: 10.1016/j.lwt.2018.10.055
Valenzuela, C., Abugoch, L., Tapia, C., and Gamboa, A. (2013). Effect of alkaline extraction on the structure of the protein of quinoa (Chenopodium quinoa Willd.) and its influence on film formation. Int. J. Food Sci. Technol. 48, 843–849. doi: 10.1111/ijfs.12035
van Soest, J. J. G., Tournois, H., de Wit, D., and Vliegenthart, J. F. G. (1995). Short-range structure in (partially) crystalline potato starch determined with attenuated total reflectance Fourier-transform IR spectroscopy. Carbohydrate Res. 279, 201–214. doi: 10.1016/0008-6215(95)00270-7
Vega-Gálvez, A., Miranda, M., Vergara, J., Uribe, E., Puente, L., and Martínez, E. A. (2010). Nutrition facts and functional potential of quinoa (Chenopodium quinoa willd.), an ancient Andean grain: a review. J. Sci. Food Agric. 90, 2541–2547. doi: 10.1002/jsfa.4158
Velásquez-Barreto, F. F., Miñano, H. A., Alvarez-Ramirez, J., and Bello-Pérez, L. A. (2021). Structural, functional, and chemical properties of small starch granules: Andean quinoa and kiwicha. Food Hydrocolloids 120, 106883. doi: 10.1016/j.foodhyd.2021.106883
Vera, A., Valenzuela, M. A., Yazdani-Pedram, M., Tapia, C., and Abugoch, L. (2019). Conformational and physicochemical properties of quinoa proteins affected by different conditions of high-intensity ultrasound treatments. Ultrasonics Sonochem. 51, 186–196. doi: 10.1016/j.ultsonch.2018.10.026
Warren, F. J., Gidley, M. J., and Flanagan, B. M. (2016a). Infrared spectroscopy as a tool to characterise starch ordered structure-a joint FTIR-ATR, NMR, XRD and DSC study. Carbohydrate Polymers 139, 35–42. doi: 10.1016/j.carbpol.2015.11.066
Warren, F. J., Gidley, M. J., and Flanagan, B. M. (2016b). Infrared spectroscopy as a tool to characterise starch ordered structure - a joint FTIR-ATR, NMR, XRD and DSC study. Carbohydrate Polymers 139, 35–42.
Xiong, J., Li, Q., Shi, Z., and Ye, J. (2017). Interactions between wheat starch and cellulose derivatives in short-term retrogradation: rheology and FTIR study. Food Res. Int. 100, 858–863. doi: 10.1016/j.foodres.2017.07.061
Keywords: SDS, NaOH, maceration temperature, FTIR-ATR, starch, protein
Citation: Ortiz-Gómez V, Fernández-Quintero A, Roa-Acosta DF, Bravo-Gómez JE and Solanilla-Duque JF (2022) Physicochemical Characterization of Quinoa (Chenopodium quinoa cv. Nariño) Co-products Obtained by Wet Milling. Front. Sustain. Food Syst. 6:851433. doi: 10.3389/fsufs.2022.851433
Received: 09 January 2022; Accepted: 02 February 2022;
Published: 09 March 2022.
Edited by:
Leonardo Sepúlveda, Autonomous University of Coahuila, MexicoReviewed by:
Miguel A. Medina-Morales, Universidad Autónoma de Coahuila, MexicoDidier Bazile, Centre de Coopération Internationale en Recherche Agronomique pour le Développement (CIRAD), France
Copyright © 2022 Ortiz-Gómez, Fernández-Quintero, Roa-Acosta, Bravo-Gómez and Solanilla-Duque. This is an open-access article distributed under the terms of the Creative Commons Attribution License (CC BY). The use, distribution or reproduction in other forums is permitted, provided the original author(s) and the copyright owner(s) are credited and that the original publication in this journal is cited, in accordance with accepted academic practice. No use, distribution or reproduction is permitted which does not comply with these terms.
*Correspondence: Jose Fernando Solanilla-Duque, anNvbGFuaWxsYUB1bmljYXVjYS5lZHUuY28=