- 1Sustainable Seed Systems Lab, Department of Crop and Soil Sciences, Washington State University, Pullman, WA, United States
- 2QuinoaHub Ltd., Musanze, Rwanda
- 3Department of Anthropology, University of California, San Diego, San Diego, CA, United States
Quinoa (Chenopodium quinoa Willd.) and millet species (including Eleusine coracana, Panicum miliaceum, and Setaria italica) are nutritionally valuable seed crops with versatile applications in food production and consumption. Both quinoa and millet have the potential to provide drought-tolerant, nutritious complementary crops to maize that is predominantly cultivated in Rwanda. This study evaluated quinoa and millet genotypes and assessed their agronomic performance in two agroecological zones of Rwanda. Twenty quinoa and fourteen millet cultivars were evaluated for grain yield, emergence, days to heading, flowering, and maturity, and plant height in 2016 and 2017 in Musanze, a highland region (2,254 m above sea level), and Kirehe, in the Eastern lowlands of Rwanda (1,478 m above sea level). Quinoa yield ranged from 189 to 1,855 kg/ha in Musanze and from 140 to 1,259 kg/ha in Kirehe. Millet yield ranged from 16 to 1,536 kg/ha in Musanze and from 21 to 159 kg/ha in Kirehe. Mean cultivar plant height was shorter in Kirehe (μ = 73 and 58 cm for quinoa and millets, respectively), than Musanze (μ = 93 and 76 cm for quinoa and millets, respectively). There was a genotype × environment interaction for maturity in quinoa and millet in both years. Across locations, “Titicaca” and “Earlybird” (Panicum miliaceum) were the earliest maturing quinoa and millet varieties, respectively, both with an average of 91 days to maturity. The results suggest that quinoa and millet have potential as regional crops for inclusion in the traditional dryland cropping rotations in Rwanda, thereby contributing to increased cropping system diversity and food security.
Introduction
Agriculture provides the primary economic activity in Rwanda, employing 70% of the total population, and ~72% of the working population (RDB-Rwanda Development Board, 2015; FAO, 2019). Tea and coffee are the principal exports, while plantains, cassava, potatoes, sweet potatoes, maize, and beans are the most commonly grown staple food crops (FAO, 2019). There has been a strong decline in poverty in Rwanda over the past decade; however, 63% of the population still live in extreme poverty, defined by the World Bank as < $1.25 a day, and are food and nutritionally insecure (NISR, 2012; World Bank, 2013). Thus, increasing agricultural productivity and diversity are key to the success of Rwanda's economy and the wellbeing of its population (FAO, 2015).
There are ample opportunities to increase agricultural productivity in Rwanda (Cantore, 2011). For one, the yield gap (defined as the difference between attainable and actual yields) is very high (70%) for most cereal and legume crops, and still considerable for the root and tuber crops (Niyitanga et al., 2015). While there are theoretically many opportunities to improve farm productivity and income of smallholder households, making those opportunities manifest is fraught with difficulties. Most agricultural land in Rwanda is on hillsides and is therefore susceptible to nutrient deficiency and soil erosion (Clay et al., 1998; FAO, 2019). Moreover, all agriculture in Rwanda is rainfed and subject to the caprice of meteorological patterns (SEI-Stockholm Environment Institute, 2009; Cantore, 2011; Rwanyiziri and Rugema, 2013). Climate change and concomitant increases in climate variability, make agricultural production unpredictable from one season to another (SEI-Stockholm Environment Institute, 2009; FAO, 2019). Droughts and extreme temperatures plague the Eastern province of Rwanda, whereas in the Northern province, floods are commonplace (SEI-Stockholm Environment Institute, 2009). As such, these regions are afflicted with food shortages whenever dramatic changes in climate occur (MINITERE, 2006; SEI-Stockholm Environment Institute, 2009; Muhire et al., 2015). Given that future climates are likely to be more variable, and that climatic events will become more extreme, the vulnerability of agriculture to such fluctuations is likely to increase in kind. Farmers rely on the application of commercial fertilizers which in most cases is outside of their means to purchase. It is imperative, therefore, that Rwanda increase its capacity to cope with extreme adverse climatic events by promoting crops with high biodiversity and adaptability that do not heavily rely on external inputs (SEI-Stockholm Environment Institute, 2009; FAO, 2019).
The practice of increasing crop diversity via sustainable crop intensification can aid in producing more food, more efficiently, while protecting the environment and promoting positive social and economic outcomes (Caron et al., 2009; Prasad et al., 2016; USAID, 2016). Sustainable crop intensification and increased cropping system diversity will contribute to food security and a range of developmental goals such as eradicating extreme poverty, hunger, and malnutrition (FNSMS, 2013; McMahon and Flowers, 2016). Crop diversity is among the key tenets of sustainable agriculture (McMahon and Flowers, 2016). Utilizing multiple crops that fill distinct niches in an agroecosystem improves farmers' ability to manage weeds, diseases, and insect pests as well as potentially improving the environmental performance of the cropping system (Lin, 2011; McMahon and Flowers, 2016). Promoting value chains of neglected and underutilized species and establishing their research needs is critical for biodiversity conservation and to increase food security and alleviate poverty among the rural and urban poor (Will, 2008). Neglected and underutilized species were reported to be a good source of nutrients, household incomes, and substantially contribute to poverty reduction (Padulosi et al., 2013; Raneri et al., 2019). Fundamental agronomic research can help overcome production and market obstacles by mitigating the uncertainty of growing novel crops, which ultimately, can also enhance food and nutrition security.
The Rwandan diet is highly diverse in plant foods but consists primarily of plantains, cassava, beans, potatoes, and sweet potatoes (FAO, 2015; USAID, 2016). Protein consumption is insufficient for about a quarter of the population (FNSMS, 2013; FAO, 2015). Micronutrient deficiency—known as “hidden hunger”—is also prevalent for iron, calcium, and vitamin B12, which may lead to blindness, stunting, impaired cognitive development in children, increased susceptibility to infectious diseases, and even premature death (FNSMS, 2013; USAID, 2016). In Rwanda, of the 1.74 million individuals under age five, 38% are stunted, and 9% are underweight (USAID, 2016). The most pronounced micronutrient deficiencies are for calcium, vitamin A, vitamin B12, vitamin D, selenium, vitamin E, Fe, Zn, and Ca (FNSMS, 2013; Prasad et al., 2016; USAID, 2016, 2021). The primary dietary source of calcium in Rwanda are beans, milk, cassava, and sweet potatoes; and the primary source of vitamin A comes from plantains, vegetables, palm oil, offal, and sweet potatoes (Prasad et al., 2016).
An increase in grain and cereal production is necessary to improve and sustain nutritional security (FNSMS, 2013). Native varieties of millet—finger millet (Eleusine coracana) have been used in Rwanda and in this study, we evaluated the adaptability of other millet species and quinoa in Rwanda. Introducing quinoa and further incorporating diverse millet species in the existing diet and cropping system could assuage issues of nutritional insecurity and the ability to cope with extreme climatic events, especially drought (Ruiz et al., 2014; Habiyaremye et al., 2017b). Quinoa and millets are nutritious grains that may be consumed by humans and have unique agronomic virtues such as drought and heat tolerance (Jacobsen, 2003; Devi et al., 2014; Wu, 2015; Habiyaremye et al., 2017a; Nithiyanantham et al., 2019).
Quinoa (Chenopodium quinoa Willd.) is a pseudocereal which was domesticated in the Peruvian and Bolivian Andes (Murphy and Matanguihan, 2012; Adolf et al., 2013; Bazile et al., 2015). Quinoa is a broadly adapted crop with exceptional resilience to many adverse environmental and climatic conditions including nutrient-poor and saline soils, and drought-stressed marginal ecosystems (Vacher, 1998; Aguilar and Jacobsen, 2003; Jacobsen et al., 2003; Fuentes and Bhargava, 2011; Murphy and Matanguihan, 2012; Bazile et al., 2015; Hinojosa et al., 2018, 2019a). Quinoa has excellent drought and salinity tolerance and thrives across a wide range of soil pH (Wilson et al., 2002; Koyro and Eisa, 2008; Adolf et al., 2013; Peterson and Murphy, 2015; Hinojosa et al., 2018, 2019b). In South America, quinoa grows over a broad range of latitudes (spanning nearly 4,828 km from equatorial Columbia to temperate southern Chile), a wide range of altitudes, from sea level at the coast to 4,000 m above sea level (m.a.s.l.), and a diverse set of rainfall zones (Galwey et al., 1989; Jacobsen et al., 2003). In Malawi quinoa has shown the potential to grow well under varying agro-ecological zones, from warmer to cooler areas (Maliro et al., 2017, 2021; Gardner et al., 2019).
In the last 30 years, quinoa has garnered considerable attention worldwide due to its nutritional and health benefits, as well as its flavorful and high-quality seeds (Wu et al., 2016, 2017; Aluwi et al., 2017; Noratto et al., 2019). Quinoa possesses a well-balanced complement of amino acids and high mineral concentration of iron, calcium, and phosphorus (Wu, 2015; Navruz-Varli and Sanlier, 2016; Wu et al., 2016; Craine and Murphy, 2020). In 2013, quinoa was lauded by the FAO as a food with high nutritive value, impressive biodiversity, and a singular role to play in the achievement of food security worldwide (FAO, 2013; Bazile et al., 2015). Quinoa has been deemed one of humanity's most promising crops for reliably providing nutritionally dense food (Jayne et al., 2003; Rojas, 2003; Rojas et al., 2011; UN, 2012; De Ron et al., 2017). Quinoa has potential to contribute to food security in multitudes of regions worldwide, especially in countries where people have limited access to protein sources or where production conditions are limited by low humidity, reduced availability of inputs, or aridity (Jacobsen, 2003; Rojas, 2003; Wu et al., 2016; De Ron et al., 2017).
A number of different species of millet were domesticated in East Asia, South Asia and Africa in the past (Fuller, 2006; Weber and Fuller, 2008) and still form important components of the diet in these regions today. The most commonly cultivated millet species are proso millet (Panicum miliaceum L.), pearl millet (Pennisetum glaucum L.R. Br.), finger millet (Eleusine coracana), kodo millet (Paspalum setaceum), foxtail millet (Setaria italica L. Beauv.), little millet (Panicum sumatrense), and barnyard millet (Echinochloa utilis) (Rachie, 1975; Bouis, 2000; Wen et al., 2014). Millet crops are a major source of energy and protein for millions of people worldwide, especially those who live in exceptionally hot, dry environments (Rachie, 1975; Fuller, 2006; Amadou et al., 2013; Nithiyanantham et al., 2019). According to Nithiyanantham et al. (2019), millet-based foods are considered potential prebiotics and probiotics with prospective health benefits. Grains of millet species are widely consumed for traditional medicinal purposes and holistic health remedies. Millets are unique among the cereals because of their high calcium, iron, potassium, magnesium, phosphorous, zinc, dietary fiber, polyphenols, and protein content (Hulse et al., 1980; Devi et al., 2014; Gupta et al., 2014; Habiyaremye et al., 2017b). Millets are extremely tolerant of arid conditions and can grow with in areas where average rainfall is often <500 mm and soils are sandy and slightly acidic (Amadou et al., 2013; Changmei and Dorothy, 2014). Millets have been adapted to local climatic conditions by African farmers over millennia. Millets species, such as Digitaria exilis, Digitaria iburua, Eleusine coaracana, Eragrostis tef, Pennisetum glaucum, Setaria sphaceleata were domesticated in Africa (Fuller, 2006). However, knowledge of these landraces is being lost as they are being replaced by commodity crops like wheat, sugar cane and maize (Fuller, 2006; Amadou et al., 2013).
Considering the nutritional promise of quinoa and millets, their propensity for agronomic adaptability, and resilience to weather variability, we conducted this research to generate data to aid in Rwanda's sustainable crop intensification and diversification efforts. The objective of this study was to evaluate the adaptability and agronomic qualities of quinoa (newly introduced crop) and three millet species including Eleusine coracana (domesticated in the East African highlands), Panicum miliaceum (domesticated in East Asia and newly introduced to Rwanda), and Setaria italica (domesticated in East Asia) in two contrasting Rwandan environments: Musanze (highland) and Kirehe (lowland). We aimed to identify quinoa and millet varieties with high yields and valuable agronomic characteristics in each location and gather information on the adaptability and genotype × environment (G × E) interactions of publicly available varieties.
Materials and Methods
Location
A 2-year study (2016 and 2017) was conducted in two different agroclimatic zones of Rwanda: the Eastern lowland region, Gahara Sector, Kirehe District, Eastern Province in a farm situated at 1,478 m.a.s.l.; and the highlands region, Muhoza Sector, Musanze District, Northern Province, situated at 2,254 m.a.s.l. The Eastern lowlands are 1,000–1,500 m.a.s.l., receive 740–1,000 mm annual rainfall, and mean annual temperatures range between 19 and 22°C. The highlands—which include the Congo-Nile Ridge and volcanic chains of Birunga—are 2,000–4,500 m.a.s.l., receive 1,300–1,550 mm annual rainfall, and mean annual temperature range between 10 and 14°C (Gotanegre et al., 1974; Ilunga et al., 2004; Ilunga and Muhire, 2010; David et al., 2011; Muhire et al., 2015; REMA-Rwanda Environment Management Authority, 2015) (Figures 1, 2).
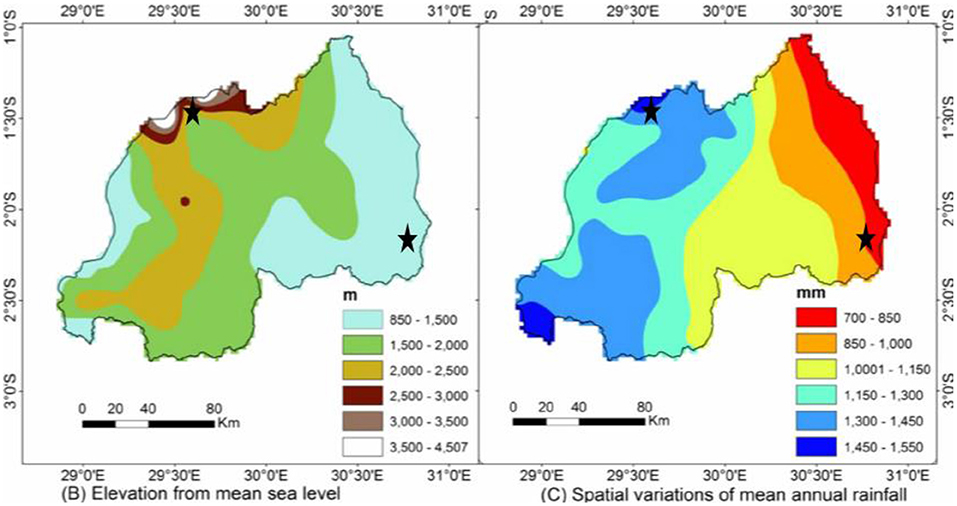
Figure 1. Elevation from mean sea level and spatial variations of mean annual rainfall of locations where quinoa and millet trials were conducted in Rwanda (marked by black stars). Source (Muhire et al., 2015).
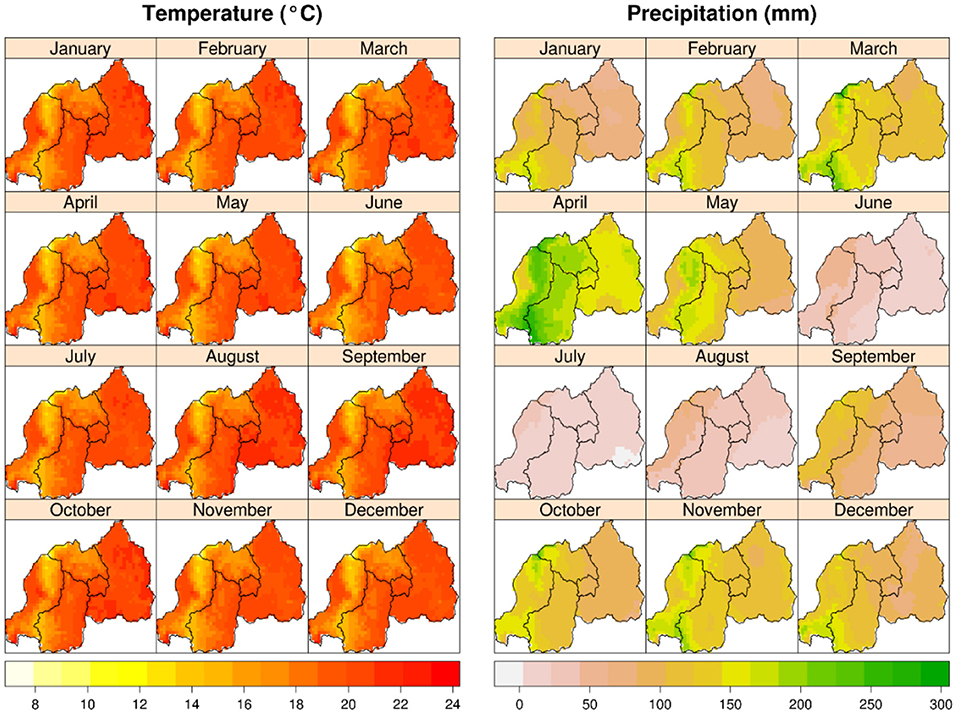
Figure 2. Mean monthly temperature (°C); and total monthly precipitation (mm) (average for 1950–2000) in Rwanda. Monthly temperature does not change much over the year, but monthly precipitation follows seasonal pattern with two distinct dry seasons. Source: www.worldclim.org.
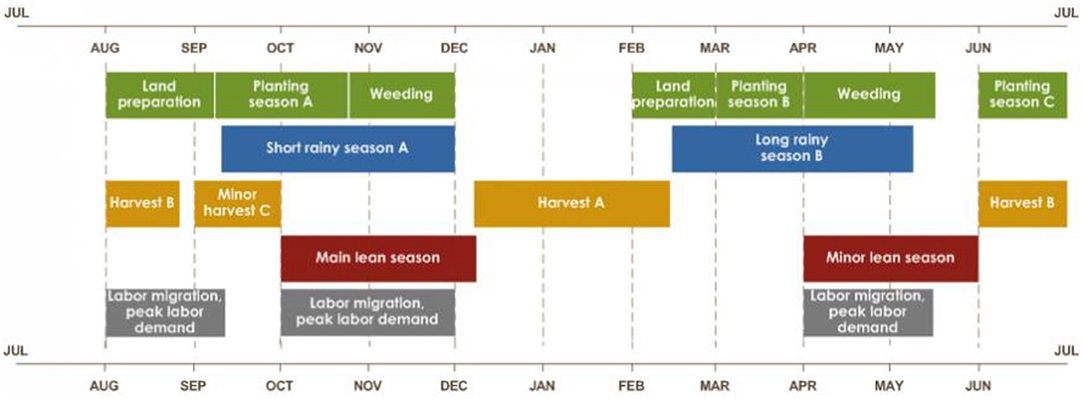
Rwanda has four climatic seasons: the long rainy season (late February-late May) and the short rainy season (end September-early December) are interspersed between the long dry (June–September) and short dry (mid-December–mid-February) seasons (Kizza et al., 2009; Muhire et al., 2015). The two rainy seasons correspond with crop production seasons—season B, and season A, respectively—the latter marking the beginning of the agricultural year (FAO, 2018). Our field trials were conducted in season A (Figure 3).
These seasons are dictated mainly by regional atmospheric circulation (Gotanegre et al., 1974; Ilunga et al., 2004; Kizza et al., 2009), i.e., the position and intensity of anticyclones (a weather system with high atmospheric pressure at its center, around which air slowly circulates in a clockwise (northern hemisphere) or counterclockwise (southern hemisphere) direction), namely: Mascarene, Saint Helena, Azores and Siberian (Ilunga et al., 2004; Anyah and Semazzi, 2007; Kizza et al., 2009). The soil in Musanze is developed from volcanic parent materials and is therefore comparatively richer in soil organic matter than that of Kirehe (Nzeyimana et al., 2014; Uwitonze et al., 2016) (Figure 4).
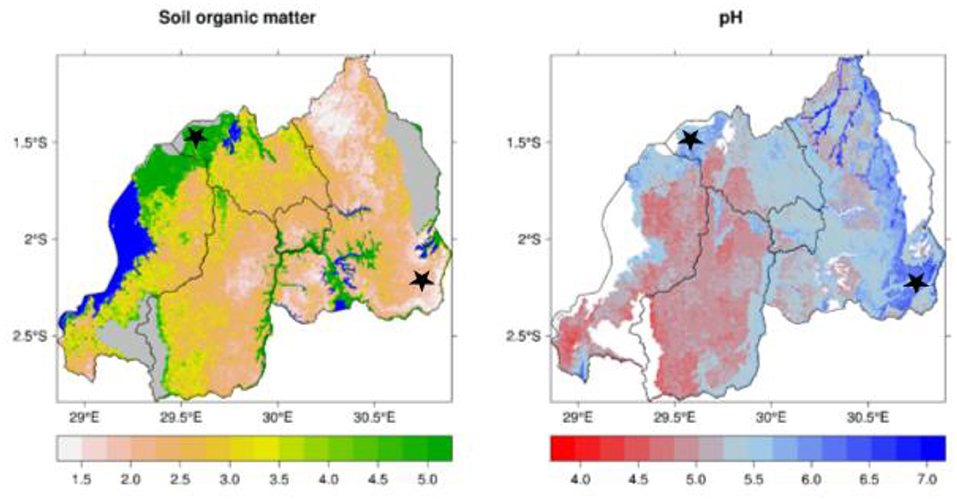
Figure 4. Soil organic matter (%) and soil pH of locations where quinoa and millet trials were conducted in Rwanda (marked by black stars). Source: www.worldclim.org.
Experimental Design and Data Collection
Quinoa Variety Trials
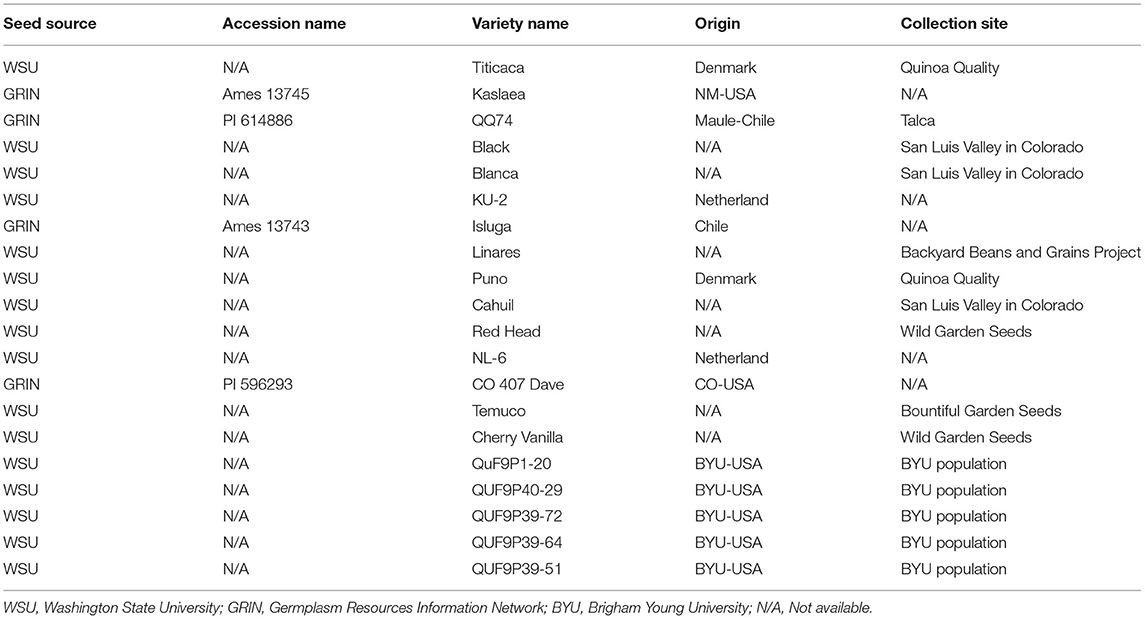
Fifteen quinoa varieties and five breeding lines were grown in a randomized complete block design (RCBD) with four replicates (Table 1). The treatments were genotypes and locations—highlands and lowlands. Varieties were control treatments to compare with breeding lines. Quinoa varieties were obtained from the Sustainable Seed Systems Lab at Washington State University (Pullman, Washington, U.S.) and the USDA- Germplasm Resources Information Network (Table 1) and chosen based on their diversity in morphological and agronomic traits and their potential for adaptation to the climate of Rwanda. Each plot was hand planted into two rows, in 4 × 1.2 m plots, using 5 g seed per plot. The phenotypic data were recorded according to Sosa-Zuniga et al. (2017) and Stanschewski et al. (2021); percent emergence was recorded on a scale of 1–5 with 1 (0% emergence) and 5 (100% emergence). Days to flowering was recorded as the number of days from when 50% of leaves surrounding the inflorescence separated, leaving the inflorescence visible from above. Days to maturity was recorded as the number of days from sowing to the time when 50% of the head had senesced. Plant height was measured from the soil surface to the tip of the panicle at maturity using three randomly selected plants per plot. Grain yield was measured as the weight of the grain harvested from the whole plot. The plots were harvested individually using sickles to cut stems of the plants. All plants were bundled, and hand threshed. The seeds were processed by winnowing, using the wind to separate smaller particles and immature seeds from the mature seeds and for final removal of any foreign plant material.
Millet Variety Trials
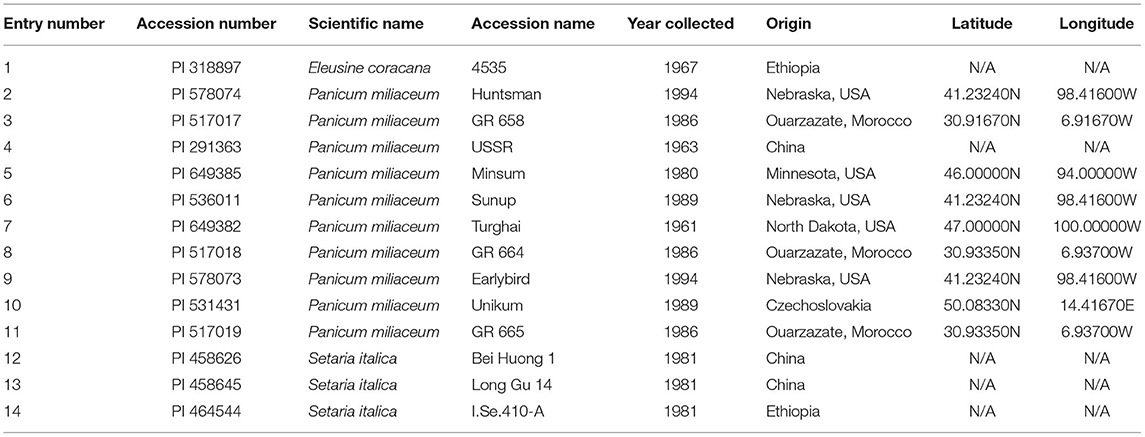
Fourteen millet varieties were grown in a RCBD with four replicates (Table 2). The 14 millet varieties tested were classified into three species: Eleusine coracana, Panicum miliaceum, and Setaria italica (Table 2). The treatments were species and locations—highlands and lowlands. Eleusine coracana and Setaria italica species were the control treatment to compare with Panicum miliaceum. The millet seeds were obtained from USDA-ARS, Plant Genetic Resources Conservation Unit (Griffin, GA, USA) and National Resource Program, Iowa State University Regional Plant Introduction Station (Ames, IA, USA) (Table 2). Percent emergence was recorded as an observation on a scale of 1 to 5 with 1 denoting 0% emergence and 5, 100% emergence. Days to heading was recorded as the number of days from sowing to the time when in 50% of the ear had emerged from the flag leaf sheath. Days to maturity was measured as the number of days from sowing to the time when 50% of the ear had ripened (stage 11.4 on the Feekes scale), according to Wise et al. (2011) and Miller (1992). Plant height was also measured at stage 11.4 on the Feekes scale using three randomly selected plants per plot. GY was measured as the weight of the grain harvested from the whole plot. Millet was planted, harvested, threshed, and cleaned similarly to quinoa.
Statistical Analyses
Statistical analysis was performed using the statistical software SAS 9.4 SAS University Edition (SAS Institute IN., Cary, NC, USA). The data were analyzed using the mixed-effect methodology. Analysis of variance, correlation, and regression analysis was conducted, and ANOVA was performed with all factors using a mixed model with PROC GLIMIX. Due to yearly discrepancies (a heavy rain that occurred in Musanze in 2017 that caused flooding which resulted in the replanting of the trial) analyses were performed for each year, respectively. Fisher's LSD test was used to compare means. Pearson correlation analysis was used to assess the relationship between the agronomic traits including percent emergence, days to flowering (quinoa), day to heading (millet), days to maturity, plant height, and grain yield across all 2 years. The statistical significance level was set at α = 0.05.
Results
Quinoa Variety Trials
Gain Yield
A significant G × E interaction for grain yield was observed in 2016 (p < 0.0001) (Table 3). When comparing responses of varieties across locations, all the varieties were affected by location for grain yield except for Cahuil, Linares, Temuko, and QuF9P39-72 (p > 0.05) (Table 4). In Musanze and Kirehe, the mean quinoa yield was 812 and 422 kg/ha, respectively (Table 4). QQ74 was the highest yielding variety in Musanze and Kirehe with 1,580 and 832 kg/ha, respectively (Table 4).

Table 3. Analysis of variance with F-value for percent emergence (PE), days to flowering (DF), days to maturity (DM), plant height (PH), and grain yield GY for quinoa varieties grown in Musanze and Kirehe over two crop years.
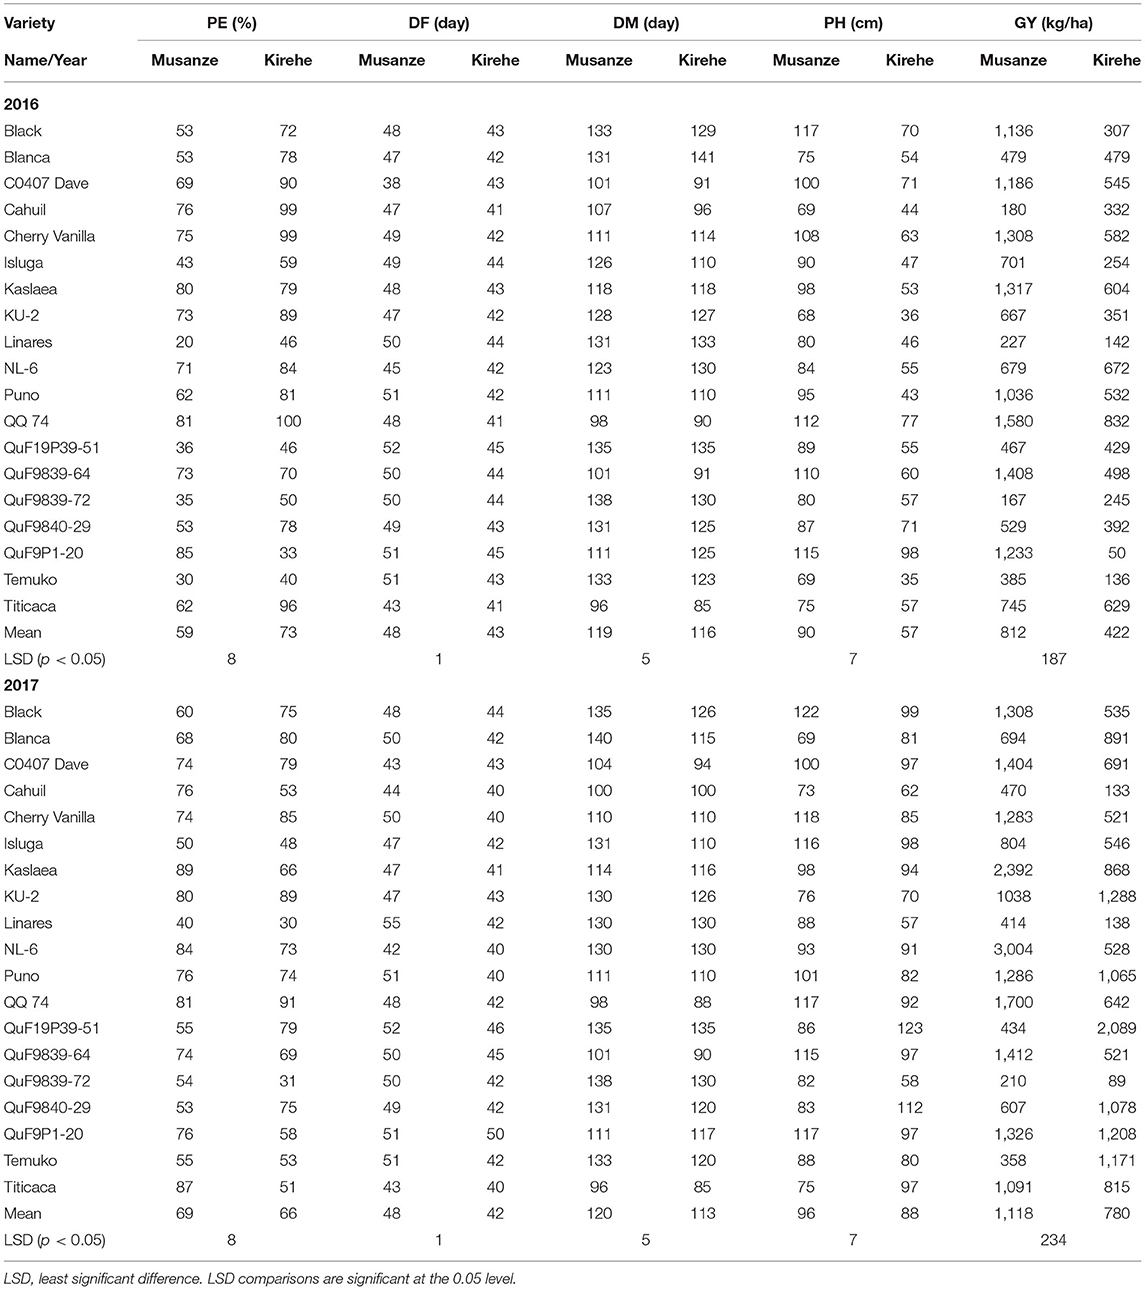
Table 4. Mean data of quinoa varieties across the years 2016 and 2017 for percent emergence (PE); days to flowering (DF); days to maturity (DM); plant height (PH); and grain yield (GY) in Musanze and Kirehe.
In 2017, grain yield was affected by location (p < 0.0001), and there was a significant G × E interaction (p < 0.0001) (Table 3). When comparing responses of varieties across locations, all varieties were affected by location for grain yield except for Cahuil, Linares, and QuF9P39-72 (Table 4). The mean yield in Musanze and Kirehe was 1,118 and 780 kg/ha, respectively (Table 4). NL-6 (3,004 kg/ha), and QuF19P39-51 (2,089 kg/ha) were the highest yielding varieties in Musanze and Kirehe, respectively (Table 4).
Emergence
In 2016, location affected percent plant emergence (p = 0.002) (Tables 3, 4). Mean emergence rates were 59% in Musanze and 73% in Kirehe (Table 4). There was a significant G × E interaction for plant emergence (p < 0.0001) (Table 3). Location significantly affected the emergence rates of all varieties (Table 4). The varieties with the highest plant emergence in Musanze were QuF9P1-20, QQ74 and Kaslaea, with 85, 81, and 80% emergence, respectively, whereas QQ74, Cahuil, Cherry Vanilla, and Titicaca had 100, 99, 99, and 96% emergence, respectively, in Kirehe (Table 4).
In 2017 location affected plant emergence (p < 0.0001) (Table 3). Mean emergence rates were 69% in Musanze, and 66% in Kirehe; the differences were not significant (Table 4). There was a significant G × E interaction for plant emergence (p < 0.0001) (Table 3). Location significantly affected the emergence rates of all varieties (Table 4). The varieties with the highest plant emergence in Musanze were Kaslaea, Titicaca, and NL-6 with 89, 87, and 84% emergence, respectively, whereas QQ74, KU-2, and Cherry Vanilla had 91, 89, and 85% emergence, respectively, in Kirehe (Table 4).
Days to Flowering
In 2016, location affected days to flowering (0.0001), and G × E interaction was significant (p < 0.0001) (Table 3). Days to flowering differed between locations; days to flowering were 48 and 43 days in Musanze and Kirehe, respectively (Table 4). Location significantly affected the days to flowering of all varieties (p < 0.0001) (Table 4). CO407 Dave, Titicaca, and NL-6 had the earliest flowering dates in Musanze with 38 days, 43 days, and 45 days; Titicaca, Cahuil, and QQ 74 had the earliest flowering dates in Kirehe with 41 days each (Table 4).
In 2017, location had an effect on days to flowering (p < 0.0001), and there was a significant G × E interaction (p < 0.0001) (Table 3). Days to flowering differed between locations: Musanze was 48 days and Kirehe 41 days to flowering (Table 4). Location significantly affected the days to flowering of all varieties (p < 0.0001) (Table 4). NL-6, Titicaca, and CO407 Dave flowered earliest at 42, 43, and 43 days, in Musanze; in Kirehe, NL-6, Titicaca, and Cahuil were the earliest to flower at 40 days each (Table 4).
Days to Maturity
Analysis of variance showed a significant G × E interaction for days to maturity in 2016 (Table 3). Location significantly affected the days to maturity of all varieties (p < 0.0001) (Table 4). The early maturing varieties in Musanze included Titicaca, QQ 74, and CO407 Dave with 96, 98, and 110 days respectively, while Black, QuF19P39-51, and QuF9P39-72 were late-maturing with 133, 135, and 138 days to maturity respectively. In Kirehe, Titicaca, QQ 74, and CO407 Dave were there earliest maturing varieties with 85, 90, and 91 days to maturity, respectively, while Linares, QuF19P39-51, and Blanca were the latest maturing varieties at 133, 135, and 141 days to maturity, respectively (Table 4).
In 2017, there was a significant G × E interaction for days to maturity (Table 3). Location significantly affected the days to maturity of all varieties (p < 0.0001) (Table 4). Titicaca, QQ 74, and Cahuil were the earliest maturing varieties in Musanze with 96, 98, and 100 days to maturity respectively while Black, QuF9P39-72, and Blanca were the latest maturing varieties with 135, 138, and 140 days to maturity, respectively. In Kirehe, Titicaca, QQ 74, and QuF9839-64 were the earliest maturing varieties with 85, 88, 90 days to maturity, respectively, while Linares, QuF9P39-72, and QuF19P39-51 were late-maturing with 130, 130, and 135 days to maturity, respectively (Table 4).
Plant Height
There was a significant G × E interaction for plant height in both 2016 and 2017 (Table 3). Location significantly affected the plant height of all varieties (p < 0.0001) (Table 4). In 2016, KU-2, Cahuil, and Temuko were the shortest varieties; in Musanze with 68, 69, and 69 cm respectively while QQ 74, QuF9P1-20, and Black were the tallest varieties with 112, 115, and 117 cm respectively (Table 4). In Kirehe, Temuko, KU-2, and Puno were the shortest varieties at 35, 36, and 43 cm, respectively, while QuF9840-29, QQ 74, and QuF9P1-20 were the tallest varieties at 71.77, and 98 cm tall (Table 4).
In 2017, Blanca, Cahuil, and Titicaca were the shortest in Musanze at 69, 73, and 75 cm, respectively, while Black, Cherry Vanilla, QQ 74, QuF9P1-20 were the tallest at 122, 118, 117, and 117 cm, respectively. In Kirehe, Linares, QuF9P39-72, and Cahuil were the shortest at 58, 58, and 62 cm, respectively, while QuF19P39-51, QuF9840-29, and Black were the tallest at 123, 112, and 99 cm, respectively (Table 4).
Correlations
In 2016 and 2017, grain yield was strongly correlated with percent emergence (r = 0.71; p = 0.001) and moderately correlated to plant height (r = 0.56; p = 0.007) but showed no relationship with other traits (Table 5). In both Musanze and Kirehe, percent emergence was negatively correlated with days to flowering (r = −0.58; p = 0.009) and days to maturity (r = −0.57; p = 0.01), but was not related to plant height (Table 5). Days to flowering was moderately correlated with days to maturity (r = 0.46, p = 0.04) (Table 5).
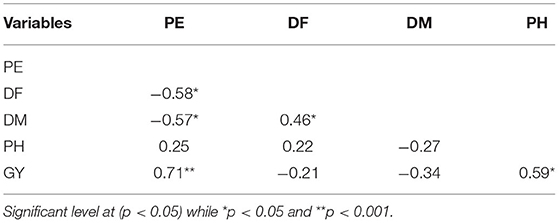
Table 5. Pearson correlation for percent emergence (PE), days to flowering (DH), days to maturity (DM), plant height (PH), grain yield (GY) of quinoa in both Musanze and Kirehe.
Millet Variety Trials
Grain Yield
In both 2016 and 2017, there was a significant G × E interaction for grain yield (p < 0.05) (Table 6). When comparing responses of varieties across location, results indicated that in both 2016 and 2017, all the varieties' grain yield were affected by environment except variety USSR, in 2017 (Table 7). In 2016 Musanze and Kirehe yielded an average of 699 kg/ha and 23 kg/ha, respectively (Table 7). Variety GR 664 was the highest yielding variety in Musanze at 1,748 kg/ha, and variety 4,535, the highest yielding variety in Kirehe, at 127 kg/ha (Table 7).

Table 6. Analysis of variance with F-value for percent emergence (PE), days to heading (DH), days to maturity (DM), plant height (PH), and grain yield (GY) for millet varieties grown in Musanze and Kirehe over two crop years 2016 and 2017.
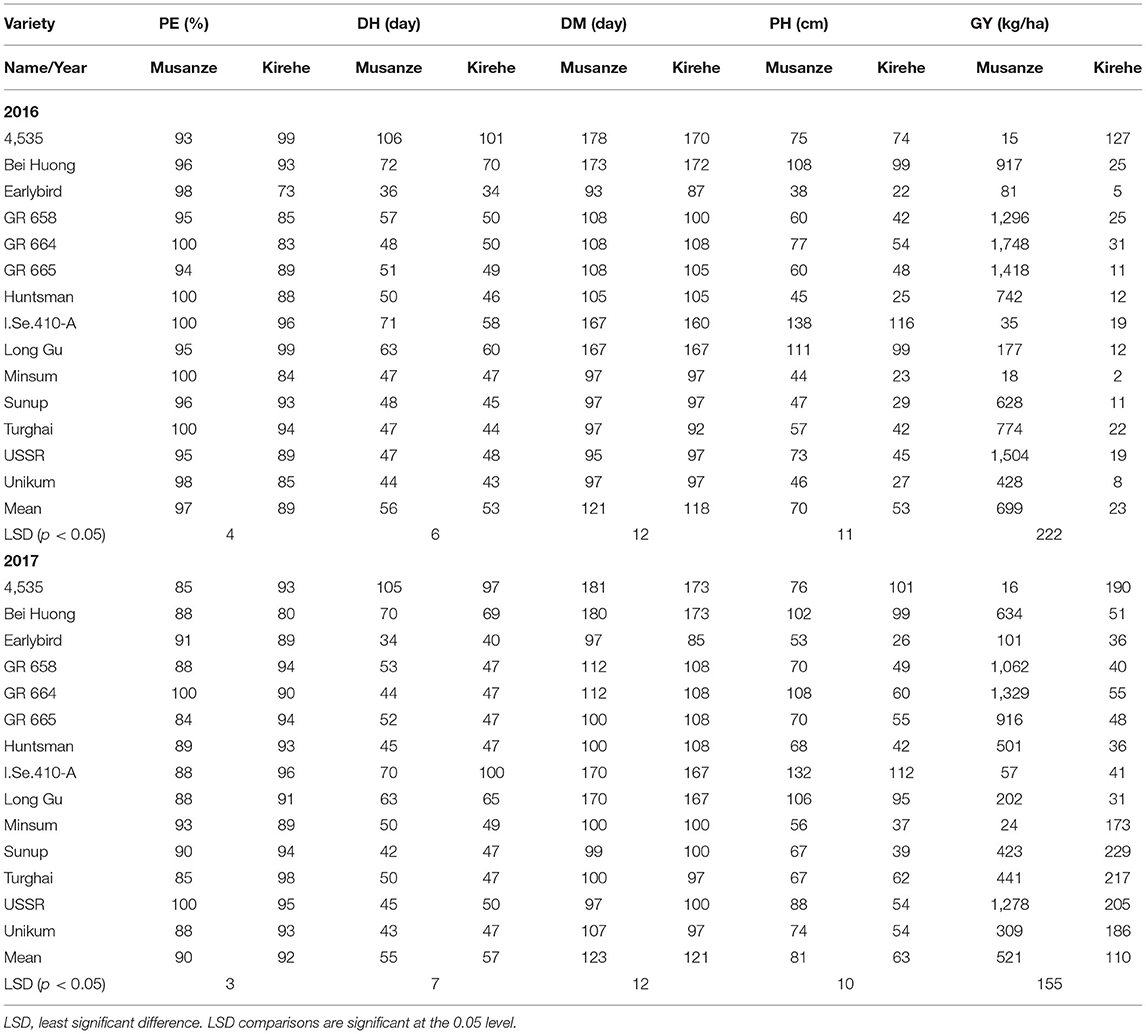
Table 7. Mean data of millet varieties across the years 2016 and 2017 for percent emergence (PE); days to heading (DH); days to maturity (DM); plant height (PH); grain yield (GY) in Musanze and Kirehe.
In 2017, the millet in Musanze and Kirehe yielded an average of 521 kg/ha and 110 kg/ha, respectively (Table 7). Variety GR 664 was the highest yielding variety in Musanze at 1,329 kg/ha, and variety Sunup was the highest yielding variety in Kirehe at 229 kg/ha (Table 7).
When comparing the yield of millet species across locations in both 2016 and 2017, proso millet species yielded 410 kg/ha on average, followed by foxtail millet at 184 kg/ha, and finger millet at 87 kg/ha (Table 8).

Table 8. Mean data comparison of millet species across the years 2016 and 2017, and locations, Musanze and Kirehe for each trait percent emergence (PE), days to heading (DH), days to maturity (DM), plant height (PH) and grain yield (GY).
Emergence
In 2016, environment had a significant interaction with plant emergence (p = 0.002) (Table 6). Mean emergence rates were 97% in Musanze and 89% in Kirehe (Table 7). There was a highly significant G × E interaction for plant emergence (p = 0.001) (Table 6). The environment significantly affected the emergence rates of all varieties except 4535, I.Se.410-A, and Long Gu (Table 7). The varieties with the highest plant emergence in Musanze were GR 664, Huntsman, Minsum, and Turghai with 100% emergence rate each, whereas 4,535 and Long Gu demonstrated the greatest percent emergence at 99%, in Kirehe (Table 7).
In 2017 location did not have an impact on plant emergence (Table 6). The mean emergence rates were 90% in Musanze, and 92% in Kirehe and the differences were not significant (Table 7). There was no G × E interaction for plant emergence (Table 6). The varieties with the highest plant emergence in Musanze were GR 664 and USSR with 100% emergence rate each, whereas Turghai had a higher emergence rate in Kirehe of 98% (Table 7).
Days to Heading
In both 2016 and 2017, location did not affect days to heading. However, there was a significant G × E interaction (p < 0.0001) (Table 6). In 2016, mean days to heading were 56 in Musanze and 53 in Kirehe; differences were not significant (Table 7). Environment significantly affected the days to heading of all varieties except I.Se.410-A and Long Gu (Table 7). Earlybird was earliest to heading in both Musanze and Kirehe at 36 and 34 days to heading, respectively (Table 7).
In 2017, the mean days to heading were 123 in Musanze and 121 in Kirehe; the differences were not significant (Table 7). Environment did not affect days to heading of the varieties GR 658, GR 664, GR 665, Huntsman, Minsum, Turghai, or USSR (Table 7). Earlybird was earliest to head in both Musanze and Kirehe at 34 and 40 days to heading, respectively (Table 7).
Days to Maturity
There was a significant G × E interaction for days to maturity in both 2016 and 2017 (p < 0.0001) (Table 6). The environment significantly affected the days to maturity of all varieties (p < 0.05) (Table 7). In 2016, mean days to maturity was 121 in Musanze and 118 in Kirehe; the differences were not significant (Table 7). Earlybird was the earliest maturing in both Musanze and Kirehe at 93 and 87 days to maturity, respectively (Table 7). In 2017, varieties averaged 123 and 121 days to maturity in Musanze and Kirehe, respectively; differences were not significant (Table 7). Earlybird was the earliest maturing in both Musanze and Kirehe at 93 and 87 days to maturity, respectively (Table 7).
Plant Height
Across all 2 years, there was a significant G × E interaction for plant height (p < 0.05) (Table 6). Both genotype and environment effects were significantly different (P < 0.0001). In 2016, varieties in Musanze and Kirehe were on average 70, and 53 cm tall, respectively; these differences were significant (Table 7). Earlybird was the shortest variety in both Musanze and Kirehe at 38 cm and 22 cm tall, respectively (Table 7). In 2017, the environment affected the plant height of all varieties except 4,535, Bei Huong, and Long Gu (Table 7). Plant height differed between Musanze and Kirehe; varieties in Musanze and Kirehe were, on average, 81 cm and was 63 cm tall, respectively (Table 7). Earlybird was the shortest variety in both Musanze and Kirehe at 53 and 26 cm tall, respectively (Table 7).
Correlations
Across years and locations, grain yield and percent emergence were not correlated with any other traits (Table 9). However, plant height was strongly correlated with both days to heading (r = 0.69, p = 0.007) and to maturity (r = 0.88, p = 0.0001) (Table 9). There was also a strong positive correlation between days to heading and days to maturity (r = 0.88, p = 0.0001).
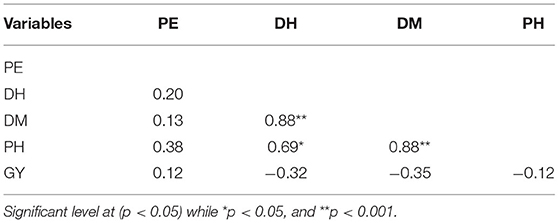
Table 9. Pearson correlation for percent emergence (PE), days to heading (DH), days to maturity (DM), plant height (PH), grain yield (GY) of millet in both Musanze and Kirehe.
Discussion
Grain Yield
Across both years, higher yields for quinoa and millet were obtained in Musanze than in Kirehe. Quinoa yield in Musanze ranged between 189 and 1,855 kg/ha, with Kaslaea yielding the highest, whereas in Kirehe, yield ranged between 140 and 1,259 kg/ ha, with the breeding line QuF19P39-51 exhibiting the highest yield. However, in 2017, some quinoa plots were damaged by goats in Musanze, resulting in lower average grain yield of varieties Ku-2, Temuko, and breeding lines QuF19P39-51, and QuF9840-29 (Table 4). Millet yield in Musanze ranged between 16 and 1,536 kg/ha, with G664 yielding the highest, while in Kirehe, yield ranged between 21 and 159 kg/ha, with 4,535 yielding the highest. Grain yield among millet species revealed that proso millet species are higher yielding compared to other millet species with an average of 409 kg/ha (proso millet), 122 kg/ha (finger millet), and 184 kg/ha (foxtail millet) (Table 8).
The higher yields in Musanze are likely the result of the greater moisture in Musanze compared to Kirehe during the time of the experiments. Musanze receives, on average, 550 mm more precipitation per year than Kirehe (Ilunga et al., 2004; REMA-Rwanda Environment Management Authority, 2015) (Figures 1, 2). Musanze is also known for its rich volcanic soil (Figure 3). Umar (2006) and Schwabe et al. (2013) reported that abiotic stressors such as extreme temperature and low water availability are often the most important restricting factors in the growth and productivity of major crop species. Drought reduces leaf size, stem extension, and root proliferation, which causes disruption of photosynthetic pigments and reduced gas exchange, ultimately leading to a reduction in plant growth and productivity (Richards et al., 2002; Anjum et al., 2011). This study's results are consistent with previous reports, which reported lower grain yield of quinoa in greater moisture areas than in the dryland of Malawi (Maliro et al., 2017; Gardner et al., 2019). The study's results are also consistent with previous reports, which stated that water stress in millet reduces seed yield (Mahalakshmi and Bidinger, 1985). In addition, millet in Kirehe experienced more bird and rat damage compared to Musanze during the time of the experiments. We would be remiss to not also mention severe yield loss about 75%, primarily in proso millet and finger millet species, inflicted by birds.
Quinoa and millet have potential in both the highland and lowland regions of Rwanda. In the highland regions of Rwanda, wheat is the fourth most important cereal crop grown. It is cultivated in the highland regions in the Congo-Nile crest, and the Buberuka highlands, characterized by volcanic soils, which include Burera, Musanze, Nyabihu, Rulindo, Gakenke, Gicumbi, Karongi, Ngororero, Rutsiro, Nyamagabe and Nyaruguru districts (Miklyaev et al., 2021; FAOSTAT, 2022). Approximately 40% of children 5 years old and under suffer from stunting in this region due to a lack of dietary diversity [USAID, 2016, 2021; National Institute of Statistics of Rwanda (NISR) et al., 2020]. In the Northern Province specifically, including where Musanze is located, climbing beans, cassava, and maize are the dominant crops while also being the primary area in the country for growing wheat. In the Western Province, the main crops are climbing beans, cassava, and maize, with relatively small amounts of land used for growing rice, soybean, and wheat [National Institute of Statistics of Rwanda (NISR), 2020; Miklyaev et al., 2021]. The Eastern Province of Rwanda, including where Kirehe is located, is dominated by the cultivation of bush beans, cassava, and maize. It is also one of the three provinces that produces rice and soybean. The production system in Eastern Province lacks diversity of cereals [National Institute of Statistics of Rwanda (NISR), 2020; Miklyaev et al., 2021; FAOSTAT, 2022]. Adding quinoa and millet into the cropping systems of these regions should play a vital role in fostering sustainable crop intensification and diversification efforts fostering socio economic growth and food and nutrition security.
Emergence and Plant Height
Both quinoa and millet varieties' height were affected by location (p < 0.0001) (Tables 3, 7). Plants were significantly shorter in Kirehe, with an average height of 73 cm compared to 93 cm in Musanze for quinoa, and an average height of 76 cm and 58 cm in Musanze and Kirehe, respectively, for millet. Emergence rate was 5.5% higher in Musanze than in Kirehe for quinoa, and 3% for millet. Less moisture in Kirehe was likely responsible for the shorter plant height and low percent emergence. Water deficit is known to cause impaired germination and poor crop emergence (Harris et al., 2002). Kaya (2009) reported that water deficit in sunflower severely reduced germination and seedling stand, and delayed germination by 1–2 days. Drought stress and water scarcity have been reported to reduce plant height in switchgrass (Panicum virgatum), channel millet (Echinochloa turneriana), barnyard millet, and pearl millet (Conover and Sovonick-Dunford, 1989; Madakadze et al., 1999). Adams et al. (2001) reported that drought stress and water scarcity slow enzymatic activity, and by extension, plant growth. Nonami (1998) also reported that cell elongation of higher plants could be inhibited by interruption of water flow from xylem to surrounding elongating cells under water deficit conditions. Plant height among millet species revealed that proso millet species are shorter compared to other millet species with an average of 53 cm (proso millet), 82 cm (finger millet), and 110 cm (foxtail millet) (Table 8).
Days to Flowering and Maturity
The most significant factors for heat stress-related yield loss in cereals include high-temperature-induced shortening of development of vegetative phases, reduced light perception over the shortened life cycle, and perturbation of the processes associated with carbon assimilation (transpiration, photosynthesis, and respiration) (Stone, 2001). The process of grain filling—the accumulation of reserve nutrients in the developing and maturing grain—is also sensitive to environmental conditions, and thus, strongly affect yield (Yang and Zhang, 2006). When comparing the effect of location on maturity across all varieties, plants in Kirehe were 2 days earlier to maturation for quinoa, and 2 days earlier for millet, than in Musanze. Days to maturity for quinoa in Musanze ranged between 96 and 138 days, while in Kirehe days to maturity ranged between 85 and 135 days, with Titicaca being the earliest maturing variety in both locations. Across all millet varieties, days to maturity in Musanze ranged between 95 and 180 days, while in Kirehe days to maturity ranged between 86 and 173 days, with ‘Earlybird' being the earliest maturing variety in both locations. The difference between millet species in heading and maturity were pronounced; days to heading for proso millet ranged between 36 and 52 days, followed by finger millet at 102 days, and foxtail millet at 63–75 days. Similarly, days to maturity for proso millet species were the most expedient at 91–109 days, followed by foxtail millet at 166–175 days, and finger millet at 172 days. These results are in agreement with those reported by Baltensperger (2002) and Williams et al. (2007) that showed that proso millet was the earliest maturing of all millet species.
Conclusion
These experiments have demonstrated that quinoa and millet can grow well in a variety of agroecological zones in Rwanda, from highland to lowlands. Yield data indicates that for both quinoa and millet, Musanze-like environments promote greater yield than Kirehe-like environments. The results of this study also underscore the need to continue evaluating quinoa and millet cultivars to identify genotypes adapted to specific agro-ecological zones and growing seasons in Rwanda. The variation in yield data in this study merit more research, regional variety trials, and establishment of quinoa and millet breeding programs in Rwanda, to effectively optimize seed yield in target environments across the country. Efforts like these will further elucidate the potential for quinoa and millet inclusion in the traditional dryland cropping rotations in Rwanda.
Data Availability Statement
The original contributions presented in the study are included in the article/supplementary material, further inquiries can be directed to the corresponding author/s.
Author Contributions
CH and KM conceived the research. CH and ON conducted the research. CH wrote the manuscript. JD'A and KM edited and provided additional information for the manuscript. All authors read and approved the final manuscript.
Conflict of Interest
CH and ON were employed by QuinoaHub Ltd.
The remaining authors declare that the research was conducted in the absence of any commercial or financial relationships that could be construed as a potential conflict of interest.
Publisher's Note
All claims expressed in this article are solely those of the authors and do not necessarily represent those of their affiliated organizations, or those of the publisher, the editors and the reviewers. Any product that may be evaluated in this article, or claim that may be made by its manufacturer, is not guaranteed or endorsed by the publisher.
Acknowledgments
We thank the Borlaug Leadership Enhancement in Agriculture Program (Borlaug LEAP) for funding this research through a grant to the University of California-Davis by the USAID (United States Agency for International Development) Feed the Future Program. We are also thankful to Dr. Eliud Birachi and his team at International Center for Tropical Agriculture (CIAT-Rwanda) for allowing us to use their office during the initial implementation of the project.
References
Adams, S. R., Cockshull, K. E., and Cave, C. R. J. (2001). Effect of temperature on the growth and development of tomato fruits. Ann. Bot. 88, 869–877. doi: 10.1006/anbo.2001.1524
Adolf, V. I., Jacobsen, S. E., and Shabala, S. (2013). Salt tolerance mechanisms in quinoa (Chenopodium quinoa Willd.). Environ. Exp. Bot. 92, 43–54. doi: 10.1016/j.envexpbot.2012.07.004
Aguilar, P. C., and Jacobsen, S. E. (2003). Cultivation of quinoa on the Peruvian Altiplano. Food Rev. Int. 19, 31–41. doi: 10.1081/FRI-120018866
Aluwi, N. A., Murphy, K. M., and Ganjyal, G. M. (2017). Physicochemical characterization of different varieties of quinoa. Cereal Chem. 94, 847–856. doi: 10.1094/CCHEM-10-16-0251-R
Amadou, I., Gounga, M. E., and Le, G. W. (2013). Millets: Nutritional composition, some health benefits, and processing-A review. Emirates J. Food Agri. 2013, 501–508. doi: 10.9755/ejfa.v25i7.12045
Anjum, S. A., Xie, X. Y., Wang, L. C., Saleem, M. F., Man, C., and Lei, W. (2011). Morphological, physiological, and biochemical responses of plants to drought stress. Afr. J. Agric. Res. 6, 2026–2032. doi: 10.5897/AJAR10.027
Anyah, R. O., and Semazzi, F. H. (2007). Variability of East African rainfall based on multiyear RegCM3 simulations. Int. J. Climatol. 27, 357–371. doi: 10.1002/joc.1401
Baltensperger, D. D. (2002). “Progress with proso, pearl, and other millets,” in Trends in New Crops and New Uses, eds J. Janick and A. Whipkey (Alexandria: ASHS Press), 100–103.
Bazile, D., Bertero, H. D., and Nieto, C. (2015). State of the Art Report on Quinoa Around the World in 2013. Santiago du Chili: FAO; CIRAD.
Bouis, H. E. (2000). Enrichment of food staples through plant breeding: a new strategy for fighting micronutrient malnutrition. Nutrition 16, 701–704. doi: 10.1016/S0899-9007(00)00266-5
Cantore, N. (2011). The Crop Intensification Program in Rwanda: A Sustainability Analysis. Available online at: http://www.odi.org/sites/odi.org.uk/files/odi-assets/publications-opinion-files/7094.pdf
Caron, P., Craufurd, P., Martin, A., Mc Donald, A., Abedini, W., Afiff, S., et al. (2009). “Impacts of AKST on development and sustainability goals,” in Agriculture at a Crossroads. International Assessment of Agricultural Knowledge, Science and Technology for Development (IAASTD): Global Report, eds D. McIntyre Beverly, R. Herren Hans, J. Wakhungu, and T. Watson Robert (Washington, DC: Island Press).
Changmei, S., and Dorothy, J. (2014). Millet-the frugal grain. Int. J. Sci. Res. Rev. 3, 75–90. Available online at: https://www.semanticscholar.org/paper/ Millet-the-Frugal-Grain-Shadang-Changmei-and-Dorothy/c7ed6ee065b150f0e de47944f0dfc8308efc0306
Clay, D., Reardon, T., and Kangasniemi, J. (1998). Sustainable intensification in the highland tropics: Rwandan farmers' investments in land conservation and soil fertility. Econ. Dev. Cult. Change 46, 351–377.
Conover, D. G., and Sovonick-Dunford, S. A. (1989). Influence of water deficits on the water relations and growth of Echinochloa turneriana, Echinochloa crus-galli, and Pennisetum americanum. Funct. Plant Biol. 16, 291–304. doi: 10.1071/PP9890291
Craine, E. B., and Murphy, K. M. (2020). Seed composition and amino acid profiles for quinoa grown in Washington State. Front. Nutr. 7, 126. doi: 10.3389/fnut.2020.00126
David, K., Megan, C., Christian, C., Jillian, D., Ryan, H., Robert, M., et al. (2011). Green Growth and Climate Resilience National Strategy for Climate Change and Low Carbon Development. Republic of Rwanda, Kigali.
De Ron, A. M., Sparvoli, F., Pueyo, J. J., and Bazile, D. (2017). The Challenge of Protein Crops as a Sustainable Source of Food and Feed for the Future. Lausane: Frontiers Media SA.
Devi, P. B., Vijayabharathi, R., Sathyabama, S., Malleshi, N. G., and Priyadarisini, V. B. (2014). Health benefits of finger millet (Eleusine coracana L.) polyphenols and dietary fiber: a review. J. Food Sci. Technol. 51, 1021–1040. doi: 10.1007/s13197-011-0584-9
FAO (2013). International Year of Quinoa 2013. Available online at: http://www.fao.org/quinoa-2013/press-room/news/detail/en/
FAO (2018). GIEWS - Global Information and Early Warning System. Available online at: http://www.fao.org/giews/countrybrief/country.jsp?code=RWA
FAO (2019). Rwanda at a Glance. Available online at: http://www.fao.org/rwanda/fao-in-rwanda/rwanda-at-a-glance/en/
FAOSTAT (2022). Crops and Livestock Prudcts-Area Harvested-rwanda. Available online at: https://www.fao.org/faostat/en/#data/QCL
FNSMS (2013). Rwanda Food and Nutrition Security Monitoring System. FNSMS Round 6. Available online at: https://documents.wfp.org/stellent/groups/public/documents/ena/wfp257936.pdf
Fuentes, F., and Bhargava, A. (2011). Morphological analysis of quinoa germplasm grown under lowland desert conditions. J. Agronomy Crop Sci. 197, 124–134. doi: 10.1111/j.1439-037X.2010.00445.x
Fuller, D. Q. (2006). A Millet Atlas: Some Identification Guidance. London: University College London.
Galwey, N. W., Leakey, C. L. A., Price, K. R., and Fenwick, G. R. (1989). Chemical composition and nutritional characteristics of quinoa (Chenopodium quinoa Willd.). Food Sci. Nutr. 42, 245–261. doi: 10.1080/09543465.1989.11904148
Gardner, M., Maliro, M. F. A., Goldberger, J. R., and Murphy, K. (2019). Assessing the potential adoption of quinoa for human consumption in central Malawi. Front. Sustain. Food Syst. 3, 52. doi: 10.3389/fsufs.2019.00052
Gotanegre, J. F., Prioul, C., and Sirven, P. (1974). Géographie du Rwanda, A. de Boeck-Bruxelles. Retrieved from https://lib.ugent.be/catalog/rug01:001342372
Gupta, S., Shrivastava, S. K., and Shrivastava, M. (2014). Proximate composition of seeds of hybrid varieties of minor millets. Int. J. Res. Eng. Technol. 3, 687–693. doi: 10.15623/ijret.2014.0302122
Habiyaremye, C., Highet, K., Barth, V., Coffey, T., and Murphy, K. M. (2017a). Phenotypic responses of twenty diverse proso millet (Panicum miliaceum L) accessions to irrigation. Sustainability 9, 389. doi: 10.3390/su9030389
Habiyaremye, C., Matanguihan, J. B., d'Alpoim Guedes, J., Ganjyal, G. M., Whiteman, M. R., Kidwell, K. K., et al. (2017b). Proso millet (Panicum miliaceum L.) and its potential for cultivation in the Pacific Northwest, US: a review. Front. Plant Sci. 7, 1961. doi: 10.3389/fpls.2016.01961
Harris, D., Tripathi, R. S., and Joshi, A. (2002). On-farm seed priming to improve crop establishment and yield in dry direct-seeded rice. Direct seeding: Research strategies and opportunities. Int. Res. Institute Manila Philippines. 2002, 231–240. Available online at: https://books.google.com/books?hl=en&lr=&id=ifL_OxhxB5oC&oi=fnd&pg=PA231&dq=On-Farm+Seed+Priming+to+Improve+Crop+Establishment+and+Yield+in+Dry+Direct-Seeded+Rice.+&ots=GmPWKEaUkf&sig=zU5-T6ctap_PJw4ATv_v9mMnw10#v=onepage&q=On-Farm%20Seed%20Priming%20to%20Improve%20Crop%20Establishment%20and%20Yield%20in%20Dry%20Direct-Seeded%20Rice.&f=false
Hinojosa, L., Gonzalez, J. A., Barrios-Masias, F. H., Fuentes, F., and Murphy, K. (2018). Quinoa abiotic stress responses: A review. Plants 7, 106. doi: 10.3390/plants7040106
Hinojosa, L., Kumar, N., Gill, K. S, and Murphy, K. M. (2019b). Spectral reflectance indices and physiological parameters in quinoa under contrasting irrigation regimes. Crop Sci. 59, 1927–1944. doi: 10.2135/cropsci2018.11.0711
Hinojosa, L., Matanguihan, J., and Murphy, K. (2019a). Effect of high temperature on pollen morphology, plant growth and seed yield in quinoa. J. Agronomy Crop Sci. 205, 33–45. doi: 10.1111/jac.12302
Hulse, J. H., Laing, E. M., and Pearson, O. E. (1980). Sorghum and the Millets: Their Composition and Nutritive Value., str. 187-193. Izdavač: Academic Press.
Ilunga, L., Mbaragijimana, C., and Muhire, I. (2004). Pluviometric seasons and rainfall origin in Rwanda. Geo-Eco-Trop. 28, 61–68.
Ilunga, L., and Muhire, I. (2010). Comparison of the Rwandan annual mean rainfall fluctuations with the El Nino/La Nina events and sunspots. Geo-Eco-Trop. 34, 75–86. Available online at: https://geoecotrop.be/uploads/publications/pub_341_05.pdf
Jacobsen, S. E. (2003). The worldwide potential for quinoa (Chenopodium quinoa Willd.). Food Rev. Int. 19, 167–177. doi: 10.1081/FRI-120018883
Jacobsen, S. E., Mujica, A., and Jensen, C. R. (2003). The resistance of quinoa (Chenopodium quinoa Willd.) to adverse abiotic factors. Food Rev. Int. 19, 99–109. doi: 10.1081/FRI-120018872
Jayne, T. S., Yamano, T., Weber, M. T., Tschirley, D., Benfica, R., Chapoto, A., et al. (2003). Smallholder income and land distribution in Africa: implications for poverty reduction strategies. Food Policy 28, 253–275. doi: 10.1016/S0306-9192(03)00046-0
Kaya, M. D. (2009). The role of hull in germination and salinity tolerance in some sunflower (Helianthus annuus L.) cultivars. Afr. J. Biotechnol. 8, 597–600. Available online at: https://www.ajol.info/index.php/ajb/article/view/59882
Kizza, M., Rodhe, A., Xu, C. Y., Ntale, H. K., and Halldin, S. (2009). Temporal rainfall variability in the Lake Victoria basin in East Africa during the twentieth century. Theoret. Appl. Climatol. 98, 119–135. doi: 10.1007/s00704-008-0093-6
Koyro, H. W., and Eisa, S. S. (2008). Effect of salinity on composition, viability, and germination of seeds of Chenopodium quinoa Willd. Plant Soil 302, 79–90. doi: 10.1007/s11104-007-9457-4
Lin, B. B. (2011). Resilience in agriculture through crop diversification: adaptive management for environmental change. Bioscience 61, 183–193. doi: 10.1525/bio.2011.61.3.4
Madakadze, I. C., Stewart, K., Peterson, P. R., Coulman, B. E., and Smith, D. L. (1999). Switchgrass biomass and chemical composition for biofuel in eastern Canada. Agron. J. 97, 696–701. doi: 10.2134/agronj1999.914696x
Mahalakshmi, V., and Bidinger, F. R. (1985). Flowering response of pearl millet to water stress during panicle development. Ann. Appl. Biol. 106, 571–578. doi: 10.1111/j.1744-7348.1985.tb03148.x
Maliro, M. F. A., Abang, M. M., Mukankusi, C., Lung'aho, M., and Fenta, B. (2021). Prospects for Quinoa Adaptation and Utilization in Eastern and Southern Africa: Technological, Institutional and Policy Considerations. Addis Ababa: FAO.
Maliro, M. F. A., Guwela, V. F., Nyaika, J., and Murphy, K. (2017). Preliminary studies of the performance of quinoa (Chenopodium quinoa Willd.) genotypes under irrigated and rainfed conditions of central Malawi. Front. Plant Sci. 8, 227. doi: 10.3389/fpls.2017.00227
McMahon, K., and Flowers, K. (2016). Herding Livestock Programs Toward Nutrition. A Critical Analysis With a Focus on Rwanda's Feed the Future Dairy Program. Available online at: https://csis-prod.s3.amazonaws.com/s3fs-public/publication/161122_McMahon_HerdingLivestock_Web.pdf
Miklyaev, M., Jenkins, G., and Shobowale, D. (2021). Sustainability of agricultural crop policies in rwanda: an integrated cost–benefit analysis. Sustainability 13, 48. doi: 10.3390/su13010048
Miller, D. T. (1992). Growth stages of wheat: Identification and understanding improve crop management. Potash Phosphate Institute 76, 1–4.
MINITERE (2006). National Adaptation Programs of Action (NAPA) to Climate Change. Ministry of Lands, Environment, Forestry, Water, and Mines (MINITERE), Kigali.
Muhire, I., Ahmed, F., and Abd Elbasit, A. E. (2015). Spatio-temporal variations of rainfall erosivity in Rwanda. J. Soil Sci. Environ. Manage. 6, 72–83. doi: 10.5897/JSSEM14.0452
Murphy, K., and Matanguihan, J. (2012). Quinoa: Improvement and Sustainable Production. Hoboken, NJ: Wiley-Blackwell.
National Institute of Statistics of Rwanda (NISR) (2020). Upgraded Seasonal Agricultural Survey (Annual Report – December 2020). Available online at: https://www.statistics.gov.rw/publication/upgraded-seasonal-agricultural-survey-annual-report-2020
National Institute of Statistics of Rwanda (NISR) Rwanda Ministry of Health (MOH), and ICF International. (2020). Rwanda Demographic and Health Survey 2019-20: Key Indicators Report. Rockville, MD: NISR, MOH, and ICF International.
Navruz-Varli, S., and Sanlier, N. (2016). Nutritional and health benefits of quinoa (Chenopodium quinoa Willd.). J. Cereal Sci. 69, 371–376. doi: 10.1016/j.jcs.2016.05.004
NISR (2012). Population and housing census. National Institute of Statistics of Rwanda. The Republic of Rwanda.
Nithiyanantham, S., Kalaiselvi, P., Mahomoodally, M. F., Zengin, G., Abirami, A., and Srinivasan, G. (2019). Nutritional and functional roles of millets—A review. J. Food Biochem. 2019, e12859. doi: 10.1111/jfbc.12859
Niyitanga, F., Kabayiza, A., and Niyonzima, J. P. (2015). Assessment of yield gaps in main staple crops in Rwanda. Int. J. Agri. Innovat. Res. 3, 1267–1271. Available online at: https://ijair.org/administrator/components/com_jresearch/files/publications/IJAIR-1241_Final.pdf
Nonami, H. (1998). Plant water relations and control of cell elongation at low water potentials. J. Plant Res. 111, 373–382. doi: 10.1007/BF02507801
Noratto, G. D., Murphy, K., and Chew, B. P. (2019). Quinoa intake reduces plasma and liver cholesterol, lessens obesity-associated inflammation, and helps to prevent hepatic steatosis in obese db/db mouse. Food Chem. 287, 107–114. doi: 10.1016/j.foodchem.2019.02.061
Nzeyimana, I., Hartemink, A. E., and Geissen, V. (2014). GIS-based multi-criteria analysis for Arabica coffee expansion in Rwanda. PLoS ONE 9, e107449. doi: 10.1371/journal.pone.0107449
Padulosi, S., Thompson, J., and Rudebjer, P. G. (2013). Fighting Poverty, Hunger and Malnutrition With Neglected and Underutilized Species: Needs, Challenges and the Way Forward. Bioversity International.
Peterson, A., and Murphy, K. (2015). Tolerance of lowland quinoa cultivars to sodium chloride and sodium sulfate salinity. Crop Sci. 55, 331–338. doi: 10.2135/cropsci2014.04.0271
Prasad, P. V., Hijmans, R. J., Pierzynski, G. M., and Middendorf, B. J. (2016). Climate Smart Agriculture and Sustainable Intensification: Assessment and Priority Setting for Rwanda. Available online at: https://cgspace.cgiar.org/bitstream/handle/10568/87987/Rwanda-CSA-SI-Report-Final-March-2016.pdf?sequence=1
Rachie, K. O. (1975). The Millets: Importance, Utilization, and Outlook. Hyderabad: International Crops Research Institute for the Semi-Arid Tropics (ICRISAT).
Raneri, J. E., Padulosi, S., Meldrum, G., and King, O. I. (2019). Promoting Neglected and Underutilized Species to Boost Nutrition in LMICs. UNSCN Nutrition. Available online at: https://cgspace.cgiar.org/bitstream/handle/10568/103413/Raneri_2019_PromotingNUS.pdf?sequence=1
RDB-Rwanda Development Board (2015). Available online at: http://www.rdb.rw/departments/agriculture.html
REMA-Rwanda Environment Management Authority (2015). Rwanda State of Environment and Outlook Report.Kigali.
Richards, R. A., Rebetzke, G. J., Condon, A. G., and Van Herwaarden, A. F. (2002). Breeding opportunities for increasing the efficiency of water use and crop yield in temperate cereals. Crop Sci. 42, 111–121. doi: 10.2135/cropsci2002.1110
Rojas, W. (2003). Multivariate analysis of genetic diversity of Bolivian quinoa germplasm. Food Rev. Inter. 19, 9–23. doi: 10.1081/FRI-120018864
Rojas, W., Alandia, G., Irigoyen, J., Blajos, J., and Santivañez, T. (2011). Quinoa, an Ancient Crop to Contribute to World Food Security. Santiago, Chile: FAO, Oficina Regional para America Latina y el Caribe.
Ruiz, K. B., Biondi, S., Oses, R., Acuña-Rodríguez, I. S., Antognoni, F., Martinez-Mosqueira, E. A., et al. (2014). Quinoa biodiversity and sustainability for food security under climate change. A review. Agronomy Sustain. Dev. 34, 349–359. doi: 10.1007/s13593-013-0195-0
Rwanyiziri, G., and Rugema, J. (2013). Climate change effects on food security in Rwanda: Case study of wetland rice production in Bugesera District. Rwanda J. 1, 35–51. Available online at: https://www.ajol.info/index.php/rj/article/view/98944
Schwabe, K., Albiac, J., Connor, J. D., Hassan, R. M., and González, L. M. (Eds.). (2013). Drought in arid and semi-arid regions: A multi-disciplinary and cross-country perspective (Springer Science & Business Media), 1–21. doi: 10.1007/978-94-007-6636-5_20
SEI-Stockholm Environment Institute (2009). Economics of Climate Change in Rwanda. Available online at: https://www.weadapt.org/sites/weadapt.org/files/legacy-new/knowledge-base/files/4e2571828dac3Final_Report.pdf
Sosa-Zuniga, V., Brito, V., Fuentes, F., and Steinfort, U. (2017). Phenological growth stages of quinoa (Chenopodium quinoa) based on the BBCH scale. Ann. Appl. Biol. 171, 117–124. doi: 10.1111/aab.12358
Stanschewski, C. S., Rey, E., and Fiene, G. (2021). Quinoa phenotyping methodologies: An international consensus. Plants 10, 54. doi: 10.3390/plants10091759
Stone, P. (2001). “The effects of heat stress on cereal yield and quality,” in Crop Responses and Adaptations to Temperature Stress, ed A. S. Basra (Binghamton, NY: Food Products Press).
Umar, S. (2006). Alleviating adverse effects of water stress on yield of sorghum, mustard, and groundnut by potassium application. Pakistan J. Botany 38, 1373–1380. Available online at: https://www.researchgate.net/profile/S-Umar/publication/228743743_Alleviating_adverse_effects_of_water_stress_on_yield_of_sorghum_mustar_and_groundnut_by_potassium_application/links/02e7e5227ff362229a000000/Alleviating-adverse-effects-of-water-stress-on-yield-of-sorghum-mustard-and-groundnut-by-potassium-application.pdf
USAID (2016). Rwanda: Nutrition Profile. Available online at: https://www.usaid.gov/what-we-do/global-health/nutrition/countries/rwanda-nutrition-profile
USAID (2021). Rwanda: Nutrition Profile. Available online at: https://www.usaid.gov/sites/default/files/documents/1864/Rwanda-Nutrition-Profile-Mar2018-508.pdf
Uwitonze, P., Msanya, B. M., Mtakwa, P. W., Uwingabire, S., and Sirikare, S. (2016). Pedological characterization of soils developed from volcanic parent materials of Northern Province of Rwanda. Agri. Forestry Fish. 5, 225–236. doi: 10.11648/j.aff.20160506.13
Vacher, J. J. (1998). Responses of two main Andean crops, quinoa (Chenopodium quinoa Willd) and papa amarga (Solanum juzepczukii Buk.) to drought on the Bolivian Altiplano: Significance of local adaptation. Agric. Ecosyst. Environ. 68, 99–108. doi: 10.1016/S0167-8809(97)00140-0
Weber, S. A., and Fuller, D. Q. (2008). Millets and their role in early agriculture. Pragdhara 18, e90. Available online at: http://www.homepages.ucl.ac.uk/~tcrndfu/articles/WeberFuller%20preprint.pdf
Wen, Y., Liu, J., Meng, X., Zhang, D., and Zhao, G. (2014). Characterization of proso millet starches from different geographical origins of China. Food Sci. Biotechnol. 23, 1371–1377. doi: 10.1007/s10068-014-0188-z
Will, M. (2008). Promoting Value Chains of Neglected and Underutilized Species for Pro-poor Growth and Biodiversity Conservation: Guidelines and Good Practices. Available online at: https://cgspace.cgiar.org/bitstream/handle/10568/104850/Promoting_value_chains_of_neglected_and_underutilized_species_for_pro-poor_growth_and_biodiversity_conservation_1294.pdf?sequence=3
Williams, M. M., Boydston, R. A., and Davis, A. S. (2007). Wild proso millet (Panicum miliaceum) suppressive ability among three sweet corn hybrids. Weed Sci. 55, 245–251. doi: 10.1614/WS-06-123.1
Wilson, C., Read, J. J., and Abo-Kassem, E. (2002). Effect of mixed-salt salinity on growth and ion relations of a quinoa and a wheat variety. J. Plant Nutr. 25, 2689–2704. doi: 10.1081/PLN-120015532
Wise, K., Johnson, B., Mansfield, C., and Krupke, C. (2011). Managing Wheat by growth stage; Purdue Ext. ID-422. West Lafayette, IN: Purdue University.
World Bank (2013). Agricultural Development in Rwanda. Available online at: http://www.worldbank.org/en/results/2013/01/23/agricultural-development-in-rwanda
Wu, G. (2015). Nutritional properties of quinoa. Quinoa 2015, 193–210. doi: 10.1002/9781118628041.ch11
Wu, G., Peterson, A. J., Morris, C. F., and Murphy, K. M. (2016). Quinoa seed quality response to sodium chloride and sodium sulfate salinity. Front. Plant Sci. 7, 790. doi: 10.3389/fpls.2016.00790
Wu, G., Ross, C. F., Morris, C. F., and Murphy, K. M. (2017). Lexicon development, consumer acceptance, and drivers of liking of quinoa varieties. J. Food Sci. 82, 993–1005. doi: 10.1111/1750-3841.13677
Keywords: Chenopodium quinoa, quinoa in Rwanda, millet production, food security, quinoa adaptation, quinoa and millet, agro-climatic zones
Citation: Habiyaremye C, Ndayiramije O, D'Alpoim Guedes J and Murphy KM (2022) Assessing the Adaptability of Quinoa and Millet in Two Agroecological Zones of Rwanda. Front. Sustain. Food Syst. 6:850280. doi: 10.3389/fsufs.2022.850280
Received: 07 January 2022; Accepted: 08 March 2022;
Published: 06 April 2022.
Edited by:
Nitya Sharma, Indian Institute of Technology Delhi, IndiaReviewed by:
Didier Bazile, Centre de Coopération Internationale en Recherche Agronomique pour le Développement (CIRAD), FranceJyoti Kumari, National Bureau of Plant Genetic Resources (ICAR), India
Copyright © 2022 Habiyaremye, Ndayiramije, D'Alpoim Guedes and Murphy. This is an open-access article distributed under the terms of the Creative Commons Attribution License (CC BY). The use, distribution or reproduction in other forums is permitted, provided the original author(s) and the copyright owner(s) are credited and that the original publication in this journal is cited, in accordance with accepted academic practice. No use, distribution or reproduction is permitted which does not comply with these terms.
*Correspondence: Kevin M. Murphy, a211cnBoeTJAd3N1LmVkdQ==
 Cedric Habiyaremye
 Olivier Ndayiramije2
 Kevin M. Murphy