 Gustavo Arciniegas1*
 Dirk Wascher1
 Poppy Eyre1
 Marta Sylla2
 José Luis Vicente-Vicente3
 Małgorzata Świa̧der2Tina Unger4Adam A. Prag5Marin Lysák5
 Luke J. Schafer5Edith Welker6Esther Sanz Sanz7
 Christian B. Henriksen5
- 1Susmetro - Sustainable Design for Metropolitan Landscapes, Tilburg, Netherlands
- 2Institute of Spatial Management, Wroclaw University of Environmental and Life Sciences, Wrocław, Poland
- 3Leibniz Center for Agricultural Landscape Research (ZALF), Müncheberg, Germany
- 4Sct. Hans Have, Roskilde, Denmark
- 5Department of Plant and Environmental Sciences, University of Copenhagen, Copenhagen, Denmark
- 6Changing Food, Copenhagen, Denmark
- 7Institut National de Recherche pour l'agriculture, l'alimentation et l'environnement (INRAE), Paris, France
The ongoing COVID-19 pandemic has exposed the fragility of current food systems to feed populations around the world. Particularly in urban centers, consumers have been confronted with this vulnerability, highlighting reliance on just-in-time logistics, imports and distant primary production. Urban food demand, regional food supply, land use change, and transport strategies are considered key factors for reestablishing resilient landscapes as part of a sustainable food system. Improving the sustainability of food systems in such circumstances entails working on the interrelations between food supply and demand, rural and urban food commodity production sites, and groups of involved actors and consumers. Of special significance is the agricultural land in close proximity to urban centers. Calling for more holistic approaches in the sense of inclusiveness, food security, citizen involvement and ecological principles, this article describes the use of a new decision support tool, the Metropolitan Foodscape Planner (MFP). The MFP features up-to-date European datasets to assess the potential of current agricultural land use to provide food resources (with special attention to both plant- and animal-based products) and meet the demand of city dwellers, and help to empower citizens, innovators, companies, public authorities and other stakeholders of regional food systems to build a more regionalized food supply network. The tool was tested in the context of the food system of the Copenhagen City Region in two collaborative workshops, namely one workshop with stakeholders of the Copenhagen City Region representing food consultancies, local planning authorities and researchers, and one in-person workshop masterclass with MSc students from the University of Copenhagen. Workshop participants used the tool to learn about the impacts of the current food system at the regional and international level with regard to the demand-supply paradigm of city-regions. The ultimate goal was to develop a participatory mapping exercise and test three food system scenarios for a more regionalized and sustainable food system and, therefore, with increased resilience to crises. Results from this implementation also demonstrated the potential of the tool to identify food production sites at local level that are potentially able to feed the city region in a more sustainable, nutritious and way.
Context: COVID-19 and the crisis of food systems
The globalized, industrial agri-food system has unveiled major inherent shortcomings with regard to sustainability and resilience (IPCC, 2019), being responsible for one third of the global anthropogenic GHG emissions (Crippa et al., 2021) and the main driver of biodiversity loss (Benton et al., 2021). Paradoxically, at the same time the trend in increasing the logistical complexity and globalization of the food system increases its vulnerability to negative environmental feedback effects, such as shock propagation, spillovers and simultaneous shock events (Davis et al., 2020). During the COVID-19 crisis this vulnerability was drastically exposed, highlighting the dependency of numerous countries on complex and vulnerable international supply chains (Bailey and Wellesley, 2017; Puma, 2019), with insufficient capacity in domestic food supply (Garnett et al., 2020). Furthermore, there have been several reports of countries having difficulties in acquiring migrant labor for domestic agriculture, exacerbating challenges in local food production. In Europe alone, it is estimated that this shortage accounts for 1 million workers (FAO, 2020).
Recently, some authors assessed the impact of the COVID-19 on the food systems resilience for specific groups of countries or from a specific viewpoint (e.g., soil management). For example, Béné (2020) developed a review on food security in local food systems and their resilience under the COVID-19 crisis in low- and middle-income countries. Nordhagen et al. (2021) assessed the impact on small farmers in these countries and implications for longer-term food system resilience. Other examples of food system assessment across the world include: Farrell et al. (2020), who assessed the food systems resilience under the COVID-19 crisis in Pacific Island Countries and Territories, Orden (2020) who assessed the resilience and vulnerability of the North American food system during the pandemic. In Asian countries, we have the study of Fan et al. (2021), who assessed the case of Asian countries with a special focus on a post-pandemic world and the possibility of future international shocks and disruptions, or Woertz (2020), who related the food self-sufficiency in Arab Gulf Countries with the inequalities in food availability, especially visible in the COVID-19 crisis. In the context of European territories, the perspective paper by Vittuari et al. (2021) reviewed the trends in production and consumption in several European cities during the first wave of COVID-19 and identified challenges and future strategies for research and innovation toward the creation of resilient and sustainable city-region food systems (CRFSs). Along similar lines, a study by Meuwissen et al. (2021) assessed the impact of the COVID-19 in 11 farming systems in Europe, observing that even though they managed to cope with the special situation, transformative measures in the face of future pandemics are needed.
At the city-region level (i.e., city-region food systems, CRFSs, or local food systems, LFSs), Blay-Palmer et al. (2021) assessed how to increase the resilience of the food systems by building CRFS and how we can learn from the pandemic to foster them. Indeed, resilience is not a given and needs to be purposely nurtured in order to facilitate the creation of distributive food systems. In particular, these food systems must be based on local needs and capacities that assure a fair redistribution of value, knowledge and power across actors and territories to deliver sustainable food for all (Moragues-Faus, 2020). Furthermore, authors like Vaarst et al. (2017) propose to apply the agroecology framework in order to achieve resilience at the agroecosystem scale in the city-region context. Other examples include the assessment of whether urban agriculture (UA) can offer a robust solution for feeding city populations. UA has gained traction in recent years and has also been proposed by diverse governments and institutions as a tool for improving food security (Badami and Ramankutty, 2015). In some cases, scenario analyses have been conducted for particular cities to establish whether UA can make a significant contribution to the local food supply, for example in Chicago, as conducted by Costello et al. (2021). Other authors consider LFSs as socio-ecological systems (SESs), since they are held by common culture and identities, in order to create adaptive governance to facilitate action in LFSs (Skog et al., 2018). In this of thought, there is a call to also integrate the social reproduction when designing new sustainable and resilient food systems (Picchioni et al., 2021).
These examples above show opportunities for alternative approaches to the industrial, globalized agri-food system. Indeed, they point at the need to better understand and foster the connections between people, places and the environment. The approaches contrast the often “blanket” procedures applied in global food systems which have led to severe externalities and vulnerabilities in the food system. The EU's goals are to reduce the environmental and climate footprint of the EU food system, strengthen its resilience, ensure food security in the face of climate change and biodiversity loss, and to lead a global transition toward competitive sustainability from farm to fork by tapping into new opportunities. This is reflected by the HLPE (the High Level Panel of Experts on Food Security and Nutrition of the Committee on World Food Security) reports on sustainable agriculture (HLPE, 2016) and forests (HLPE, 2017a), which call for more diverse and integrated production systems at different scales, from farm, community, landscape and even broader levels, in order to strengthen food system resilience to external shocks (including climate variability, natural disasters or economic shocks) and contribute to dietary quality and diversity through a more diverse food supply. In other words, there is a need for a radical transformation of the food systems. The participation of different stakeholders in transdisciplinary partnerships can play a key role in this transition, for instance in the regional co-creation of solutions delivering rapid transformational changes (Augustin et al., 2021). In response to the COVID-19 crisis, the EU's Farm to Fork Strategy stresses the need for a “just transition” in which environmental, health and social benefits of a more sustainable food system become accessible for all parts of society, but especially those being severely affected by the pandemic crisis, and more recently, the cost of living crisis. Quoting from the strategy, “ensuring a sustainable livelihood for primary producers, who still lag behind in terms of income, is essential for the success of the recovery and the transition” (European Commission, 2020a). This article describes the use of a new decision support tool, the Metropolitan Foodscape Planner, which features up-to-date European datasets to (1) assess the potential of current agricultural land use to provide food resources with special attention to the share of both plant- vs. animal-based products, and meet the demand of city dwellers, and (2) enable stakeholders to geographically allocate land use change decisions concerning desirable food groups to move toward a sustainable city-region food system.
The next Section Theoretical framework: The sustainability of food systems and the resilience of food supply presents the theoretical background to this article. First, it provides a definition of sustainable food systems through the lens of food supply resilience and a description of their main elements, then it goes on to discuss current approaches to assess the environmental, social and economic impacts of food systems, and the role played by spatial decision support tools in these assessments. Section Materials and methods presents the tool we used (MFP) and the methodology used, with a particular focus on components, GIS software, hardware and processware, and the assessments undertaken. Section MFP implementation describes the application of the methodology to the Copenhagen city region food system and Section Collaborative FAL Copenhagen workshops presents the results of the use of the tool in two collaborative workshops. Section Discussion discusses the results in the context of food systems sustainability and resilience. Finally, conclusions are provided in Section Conclusions.
Theoretical framework: The sustainability of food systems and the resilience of food supply
Food systems
The HLPE on Food Security and Nutrition (HLPE, 2017b) defines food systems as “gathering all the elements (environment, people, inputs, processes, infrastructures, and institutions) and activities that relate to the production, processing, distribution, preparation and consumption of food, and the output of these activities, including socio-economic and environmental outcomes.” The concept of food system is gaining more attention amongst the scientific community and policymakers (Béné et al., 2019) due to its increasing impacts on sustainability, namely the three dimensions of environment, society and economy (FAO, 2018). Therefore, it requires comprehensive assessments to ensure informed decision-making for a responsible and sustainable development (Lal et al., 2020).
Food systems constitute a complex, multi-actor system in which drivers influence their components and outcomes (Brouwer et al., 2020). Drivers represent external trends such as urbanization, climate change, energy prices and technology development. The constituent elements of a food system, according to the framework proposed by the High-Level Panel of Experts on Food Security and Nutrition of the Committee on World Food Security, include (1) food supply chains, (2) food environments, (3) individual factors, and (4) consumer behavior, and (5) diets (HLPE, 2017b). Food supply chains can be divided into stages starting from production, through storage and distribution, processing and packaging up to retail and markets. Food environments focus on food availability and physical access, affordability, promotion and information, as well as food quality and safety. Individual factors include economic, cognitive, aspirational and situational conditions. Consumer behavior influences both food supply chains and food environments and therefore is crucial to understand in relation to health.
The sustainability of food systems through the lens of food supply resilience
The sustainability of the current food systems is questioned as they do not provide food security and nutrition to everybody without undermining the provision to future generations (FAO, 2018). Modern food systems, compared to the traditional ones as described in Ericksen (2008), are more susceptible to system disruptions, due to their long supply chains, international pricing and trade problems, increasing amounts of processed food and animal products, increased packaging and retail (Maxwell and Slater, 2003). On the other hand, territorial markets and short supply chains are often a key component of agro-ecological systems, and can enhance access to fresh food, ensure greater value goes to the farmer, and reduce vulnerability to disruptions on international markets (IPES-Food, 2020). Therefore, supporting local short food supply chains, as well as strengthening participatory approaches in creating healthy food environments are key challenges in future-oriented food systems, especially in the context of global crises such as COVID-19.
One of the major barriers to the assessment of the current state of regional food production capacity, food flows, and regional food stocks is the fragmentation of landscape issues, which according to Lal et al. (2020) can be categorized into three types of fragmentation: (i) multiscale fragmentation of land policies, (ii) separate management of land for environmental and agricultural issues, and (iii) incomplete and fragmented geospatial knowledge about land and soil processes and properties. It is in this context spatial decision support tools can be of great value for assessing food systems and supporting decision making aimed at the development of place-based strategies for the implementation of resilient food systems that are tailored to the region in question. Spatial assessments can facilitate the quantification of environmental state, efficient resource management (water, soil, land), or improvement of environmental quality as a base for formulation of planning and policy recommendations (González et al., 2013). Decision makers require effective management tools for policy making that provide cognitive results in consideration of dynamic changes in underlying assumptions (Kersten et al., 1999). These capabilities are provided by decision support systems (Yang et al., 2010). Lal et al. (2020) highlights the linkages between soil management and the COVID-19 crisis, as well as the importance of geospatial decision support systems for land use planning and management.
Decision support systems for assessing food systems sustainability
Decision support systems (DSSs) process the data describing our surroundings into information and knowledge necessary for more suitable decision-making. DSSs have been used since the 1960s and were first described in the 1970s by Morton (Kazak and van Hoof, 2018). “DSSs are computer-based systems designed for managers to help them to choose one of several options, by analyzing large amounts of data in a relatively short period of time” (Kazak and van Hoof, 2018). Therefore, the DSSs are seen as multicriteria analyses. It guarantees the prediction of potential effects of planned development strategies, as well as creation of alternative scenarios to avoid negative impact of intended actions of decision makers (Kazak and van Hoof, 2018). DSSs are user-friendly solutions, which improve communication between decision makers, boost their satisfaction, increase organizational control, and as a result enhance effectiveness of decision-making (Alshibly, 2015).
DSSs can combine non-spatial (statistical) data and/or spatial data together with indexes, factors, algorithms, and assumptions necessary to assess the potential of the area or the impact of the implementation of the proposed strategy (Kersten et al., 1999). Therefore, one of the advantages of DSSs is perceived in this ability to combine multiple variables within a single system without having to perform calculations in external software (Kazak and Szewrański, 2013; Alshibly, 2015). The relevance of DSSs allows one to optimize the decision-making process by taking into account various factors, weight these criteria, express them in one denominator and thereby reduce potential failures (Kazak and Szewrański, 2013; Kazak and van Hoof, 2018). Despite the adequacy of DSSs, there is still a need for critical validation of obtained results, as well as integration into participatory processes. DSSs allow processing the data and provide output information. However, it is the decision-maker who is responsible for obtaining this information, understanding the results (knowledge) and making the final decision (wisdom) (Kazak and van Hoof, 2018).
We can distinguish spatial decision support systems (SDSSs) referring to geospatial futures (Kazak and van Hoof, 2018) or even Web-based spatial decision support systems (Web-based SDSSs) based on cyber-infrastructure platforms (Yang et al., 2010). These SDSSs allow us to describe potential future developments according to scenario analysis. Scenario methods belong to the strategic management concept and are a part of so-called macro-analysis groups. Scenario analyses consider the object and purpose of the scenario, its spatio-temporal scale, the type of indicators used to evaluate it (Kazak, 2018), as well as different spatial data as land use or soil (Terribile et al., 2015). The SDSSs could be implemented for validation of different spatial issues starting with adaptation to climate change (Kazak et al., 2018) through land development (Stula and Kazak, 2019; Broza et al., 2020) to food system assessments (Heinemann et al., 2010).
The application of DSS for food and agriculture have been introduced in many journals and books presenting various applications from crop production, through water management, ending with machinery management (Heinemann et al., 2010). The DSSs allow for evaluation of suitability of land to produce quantity and/or quality of any commodity. The implementation of land suitability assessment using DSSs allows to maximize obtaining food, feed, fiber or energy on one hand, and safeguard the sustainable production on the other. Moreover, it supports the use of land according to its functions and provided services, as well as within the carrying capacity of the land (Wijffels et al., 2010). A recent example addressed Danish agricultural land use and associated GHG emissions from a more international perspective (Prag and Henriksen, 2020). In this study, the effects of a global adoption of the EAT-Lancet Planetary Health Diet on Danish agricultural GHG emissions were estimated through a calculation of the potential changes in land use in Denmark associated with a reduced animal production. It was evident that these changes enabled an increased local production of protein crops for animal feed to replace imported soy, restoration of drained wetlands as well as afforestation, all of which contribute to lowering agricultural GHG emissions (Prag and Henriksen, 2020).
Notably, one of the main approaches currently applied for such purposes are quantitative foodshed assessments. According to Schreiber et al. (2021), they can be classified in three types: (a) agricultural production capacity, (b) food flow and (c) hybrid analyses. The majority of the assessments are based on assessing the potential agricultural production capacity in order to feed the specific population of the city-region (i.e., foodshed) (Joseph et al., 2019; Zasada et al., 2019; Kurtz et al., 2020; Vicente-Vicente et al., 2021b); or to assess more specific issues as part of sustainability impact and ecosystem services assessments of regional food systems and land uses (Swiader et al., 2018; Tavakoli-Hashjini et al., 2020). The food flow assessments map consumers and producers, being thus useful when studying distribution networks (Karg et al., 2016; Wegerif and Wiskerke, 2017; Moschitz and Frick, 2020). Finally, hybrid foodshed analyses combine agricultural capacity and current food flow analyses (Porter et al., 2014; Mouléry, Sanz Sanz, Debolini, Napoleone, Josselin, Mabire et al., 2021; Vicente-Vicente et al., 2021a) and, therefore, are able to assess the dependencies on foreign food sources, vulnerabilities of the food system, and the environmental impacts of the food system re-localization (Schreiber et al., 2021).
In this context, a spatial-functional assessment tool “Metropolitan Foodscape Planner” (MFP) at the level of metropolitan regions was developed as part of the EU project FoodMetres (2012–2015). Drawing largely on European data sets, MFP allows the identification of the land footprint in the form of “local hectares” of agricultural productive land needed to feed urban populations according to the typical diets that are recognized for specific countries or regions. The assessment results in a spatial allocation model of food landscapes, differentiating between (1) an urban core, (2) a recreational-natural buffer zone around this core, (3) a plant-based food production zone including vegetables, fruit, cereals etc. for human consumption, and (4) a meat-based food production zone mainly covering fodder and grounds for livestock rearing. MFP can be operated on a digital MapTable allowing for participatory processes involving stakeholders to make concrete propositions for land use change in order to decrease the land footprint by increasing plant-based food production (Wascher et al., 2015). Figure 1 illustrates the model of Von Thünen (1826) which dictates the development of MFP2.0, and is based on distance from the city, preservation of food and amount of space. The main principle is that agricultural products that have intensive land use, have high transportation costs and are in great demand, would be located closer to urban markets.
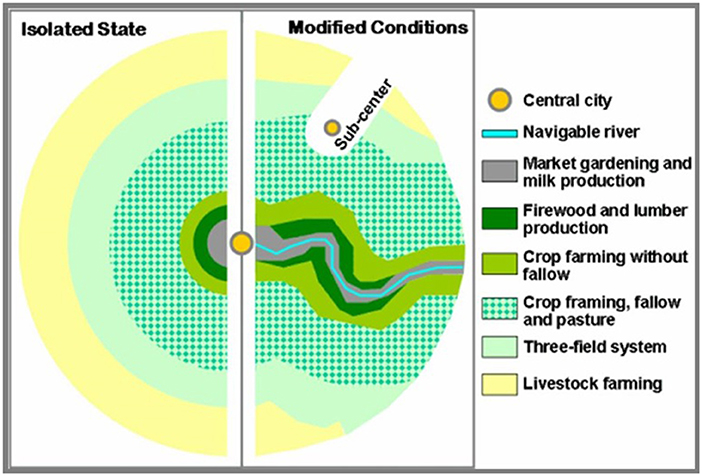
Figure 1. Concentric rings model for locational theory of Von Thünen (1826).
Materials and methods
The method on which MFP is based includes a number of interconnected components, namely a dynamic Geographic Information System (GIS) and its map/data library, an interactive platform for stakeholder interaction: a touch-enabled screen (the MapTable) for face-to-face workshops, or a digital platform for online workshop interaction, and a series of interconnected workshops. In a nutshell: during a collaborative workshop, stakeholders use MFP to get informed about the status quo of the city region's food system as well as potential food system scenarios, discuss these scenarios, and utilize this information to propose changes in the foodscape on the MapTable that will improve the status quo of the food system. Section Collaborative FAL Copenhagen workshops describes such a workshop in the context of the food system in the Copenhagen city region.
Dynamic GIS with map library
The GIS included in the MFP (Figure 2) is an interactive layered digital map that (1) stores and communicates the map layers used in the assessments, (2) enables stakeholders to propose changes in the spatial patterns of the foodscape around the city region, and (3) provides real-time feedback on the impacts of these changes via dynamic charts. As soon as new food classes are assigned on the MapTable, the system recalculates food commodity shares and the supply/demand effects of the new spatial foodscape configuration (see Figure 3C).
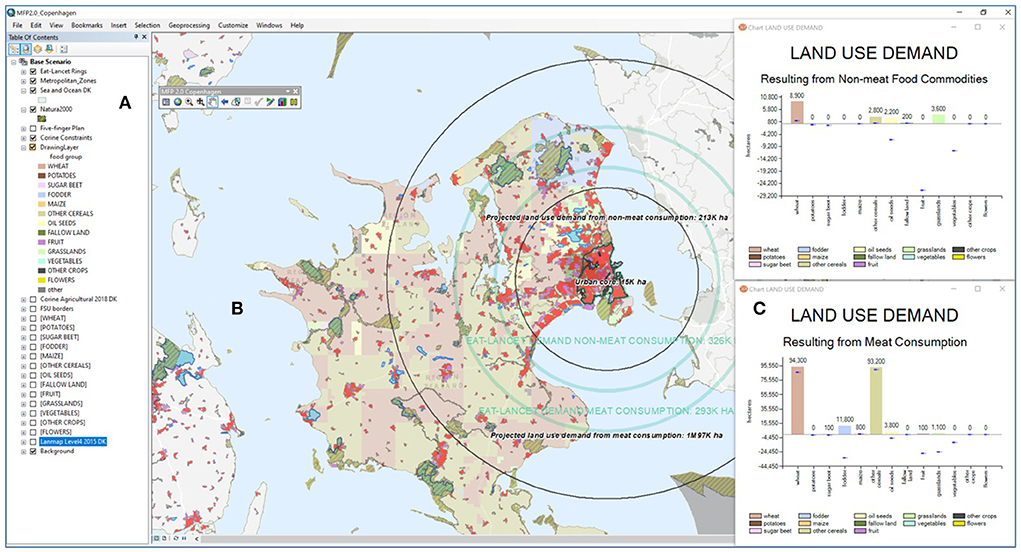
Figure 2. Main interface of the MFP Tool featured by a dynamic GIS, which contains three main frames: (A) the map library, (B) the interactive map area, and (C) two dynamic charts showing supply and demand figures for the food system of the Copenhagen city region.
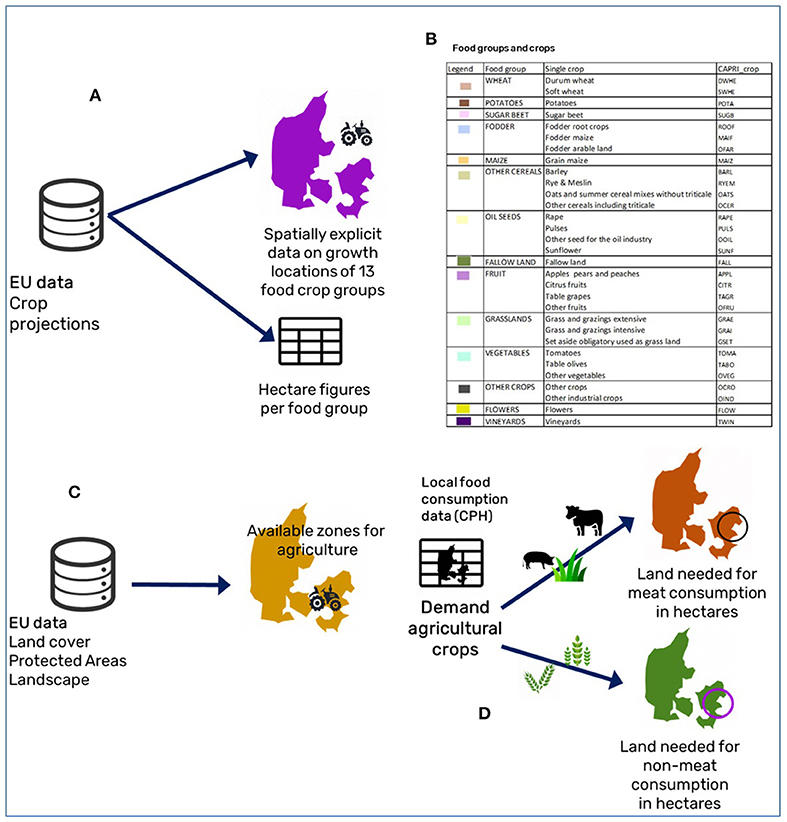
Figure 3. Determining the footprint of urban food consumption. (A) Steps to generate a map of growth locations for 13 food crop groups. (B) A food group is an aggregation of specific crops based on the table of food groups and crops. (C) Steps to generate a map of available zones for agriculture. (D) Determining the amount of land needed for animal- and plant-based food production.
Map library and available datasets
The dynamic GIS of the MFP2.0 is built within the environment of the software combination Esri® ArcMap 10.6 and CommunityViz Scenario 360™ 5.2. ArcMap provides the layered mapping environment while Scenario 360, acting as an extension to ArcMap, provides the interactive foodscape allocator and the dynamic charts that react to foodscape changes made by stakeholders. The “table of contents” frame contains the map layers available in the MFP tool. Table 1 shows both the map layers and datasets included in the tool.
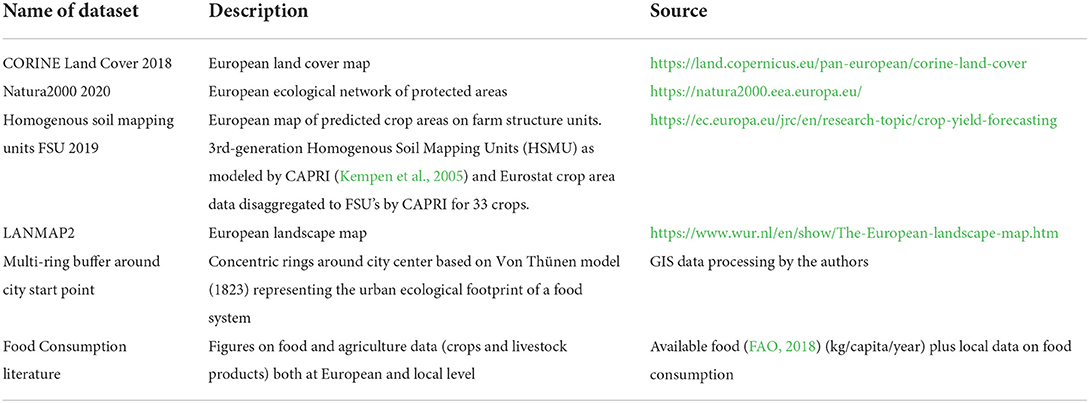
Table 1. Datasets utilized in MFP.
Determining the land footprint of an urban food system
Figure 3 shows a scheme illustrating the four steps within MFP to determine the land footprint (i.e., resulting area demand from a consumption pattern) of a metropolitan area. The first step to estimate the land footprint of human food consumption using the aforementioned datasets is to map food crop patterns and to estimate aggregated food supply figures. European FSU datasets are used for this purpose.
The FSU datasets contain growth projections for 33 CAPRI crops at the European level (Figure 3A), mapped on top of HSMU units (European Commission, 2020b). Out of this dataset it is possible to generate a map of dominant crops, which in turn can be aggregated into a European map of food groups. MFP utilizes the aggregation crop scheme shown in the table of step b in Figure 3B. For example, crop group “Oil seeds” consists of crops rape, pulses, other seeds for the oil industry, and sunflowers. Out of this European crop map, country-specific crop maps are cropped out (see Figure 4 for a Danish food group map). A cropped country-specific map of crop projections is used to determine aggregate supply food group values. Food demand values are calculated using available country-specific FAO food data (kg/capita/year) (Figure 3D). If local datasets for a particular city region are available, FAO food figures can be disaggregated, and then converted into required hectares per capita. The next step is to determine the zones suitable for agriculture, which form the input for determining the amount of land required to feed an urban population, i.e., the land footprint.
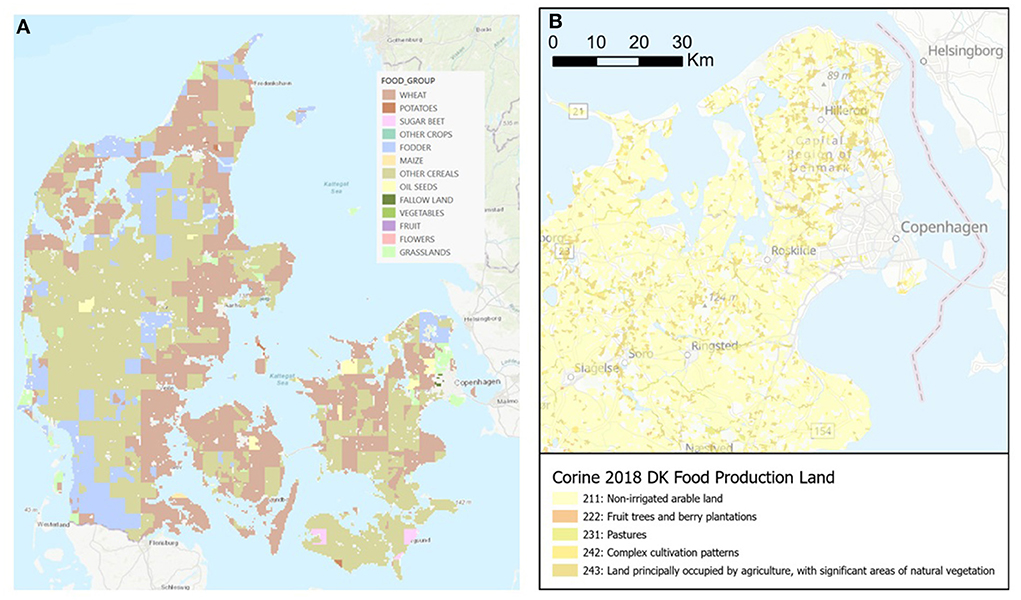
Figure 4. Map of Danish food group production for 2019 as extracted from FSU data, at a 1-km resolution (A) and agricultural zones around Copenhagen as extracted from CORINE (B).
Within this implementation of the MFP tool, we chose the principle of the “local footprint” as the amount of land required to grow the food consumed by the population of a city differentiating between the land needed for animal-based food consumption and the land needed for non-animal (plant-based) consumption. Thus, for the remainder of this paper and for the sake of simplicity, animal-based food production will denote cow, chicken and pig meat production, excluding eggs and dairy products; while plant-based will cover plants for human consumption. In this MFP version, animal-based food production is represented by food groups Fodder and Grasslands, while plant-based is represented by the remaining food groups: Wheat, Potatoes, Sugar beet, Maize, Other cereals, Oil seeds, Fallow land, Fruits, Vegetables, Other crops, Flowers. Section Assessing the land footprint of food consumption in Copenhagen explains how this was done for the Copenhagen case. Building upon von Thünen's economic theory, the resulting zonation of an inner plant-based supply ring and an adjacently located external animal-based supply ring is mainly meant as input to the policy debate on the principle impact of meat consumption on regional food supply patterns. Determining a map of available zones for agriculture requires a map overlay process involving several spatial datasets (Figure 3C). The European CORINE land cover map is used to extract areas suitable for agriculture production (areas allocated land cover classes: “Non-irrigated arable land,” “Fruit trees and berry plantations,” “Pastures,” “Complex cultivation patterns,” and “Land principally occupied by agriculture, with significant areas of natural vegetation,”) and to filter out unsuitable areas (urban areas, water areas, forest). Protected habitat areas are also filtered out using the European Natura2000 map. The LANMAP2 map is also used to include landscape-related suitable areas for agriculture and to exclude unsuitable landscapes. This overlay process produces a European map of available zones for agriculture, out of which country-specific maps can be generated (see Figure 4B). City-specific food demand values are used to determine the total amount of hectares required for meat and non-meat consumption.
The next step is to generate two concentric rings around the urban core, namely the plant-based ring and animal-based ring. The width of each ring depends on the available productive agricultural land in hectares and is estimated via an iterative spatial analysis process in which one ring buffer is first drawn around the city and then overlaid on with the available agriculture zones. The width of the buffer is then incrementally adjusted until the total demand food value in hectares matches the total area of agriculture zones fitted inside the ring. For plant-based diets, the total demand relates to all crops used for human consumption, whereas for animal-based diets the total demand relates to those crops used for animal feed, and thereby cow, pig and chicken meat production, hence excluding dairy and egg production. The result is two concentric rings, whose area sizes portray the amount of land factually required to feed a city on a plant-based consumption diet, and an animal-based food consumption diet, assuming that all available productive land would be used for covering the current food consumption of the urban core.
MFP implementation
This section describes the implementation of the MFP method using datasets from Denmark, and the Copenhagen city region. First, it describes the steps to determine the land footprint of Copenhagen in the context of the 13 food groups. Second, it shows how to map the aggregated land footprints for both the status quo and a projected diet consumption scenario. Third, it compares both footprint maps.
Assessing the land footprint of food consumption in Copenhagen
The method illustrated by Figure 3 was applied to assess the land footprint of (1) the current consumption situation (status quo) of the Copenhagen City Region Food System, and (2) a food system scenario based on the EAT-Lancet dietary advice. This dietary advice is available in The EAT-Lancet Commission Summary Report (EAT-Lancet Commission, 2019) and proposes a varied plant-rich diet that encourages an increased consumption of vegetables, fruits, whole grain foods, vegetable oils, legumes, as well as low-fat dairy products, fish and a decreased consumption of meat. Figure 4 shows the map of the 13 aggregated food groups for Denmark and the available zones for agricultural production as extracted from public European datasets (based on Figures 3A,B).
The assessment of crop-based food consumption in Copenhagen was based on food supply data (annual consumption per capita) for Denmark (FAOSTAT, 2021), using 2018 as reference year (Figures 3C,D). This data was adjusted with a factor accounting for variation in consumption patterns between the country as a whole and the Copenhagen city region, based on a study of Danish dietary habits (Pedersen et al., 2015). The resulting estimate of food supply per capita in Copenhagen was translated into land footprint (or area demand) using yield data from Statistics Denmark, averaged over 5 years (Danmarks Statistik, 2021d). An exception includes nuts, of which the Danish production is so small that it is not tracked in the national statistics. Data on nut yield was obtained from FAO, where data for 3 years was available (FAO crops). Area demand for animal-based foods was estimated directly through national statistics on fodder use, combined with yield averages (Danmarks Statistik, 2021b,c). Because Denmark has a significant net export of pork and dairy (~85 and 10% of production is exported, respectively), and a small net import of beef, poultry and eggs, the resulting area was subsequently adjusted to represent only area demand related to national consumption. This was done using a factor derived from data on production, export and import of relevant product groups (FAOSTAT, n.d.) and an estimate for how the use of different general groups of fodder is distributed among individual animal species in Denmark (Hermansen et al., 2017). Finally, national area demand per capita was calculated and adjusted with the factor accounting for variations in dietary habits between Copenhagen and Denmark. Table 2 compiles the resulting values for food supply and demand for both plant- and animal-based status quo production in Copenhagen.
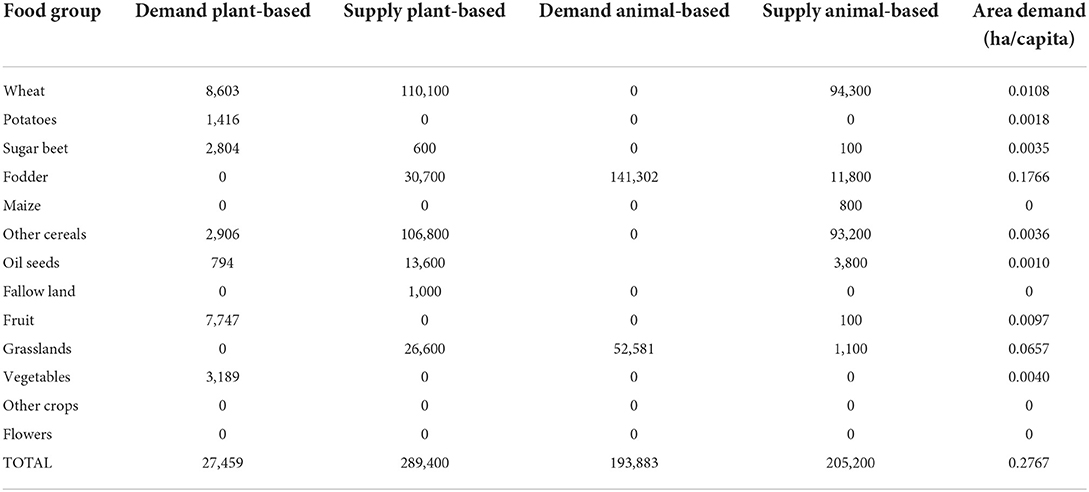
Table 2. Food demand and supply for Copenhagen: status quo (in hectares).
Land footprint—Status quo in Copenhagen
Following the same method of Figure 3, we determined the land footprint of food consumption in Copenhagen for 2018. Maps in Figures 5A,C show two concentric rings, whose sizes were calculated by matching food supply and demand on top of the available agricultural land. Figure 5B compares the total footprint values of animal- and plant-based food consumption. Figure 5D shows aggregated food group supply values in hectares within each ring.
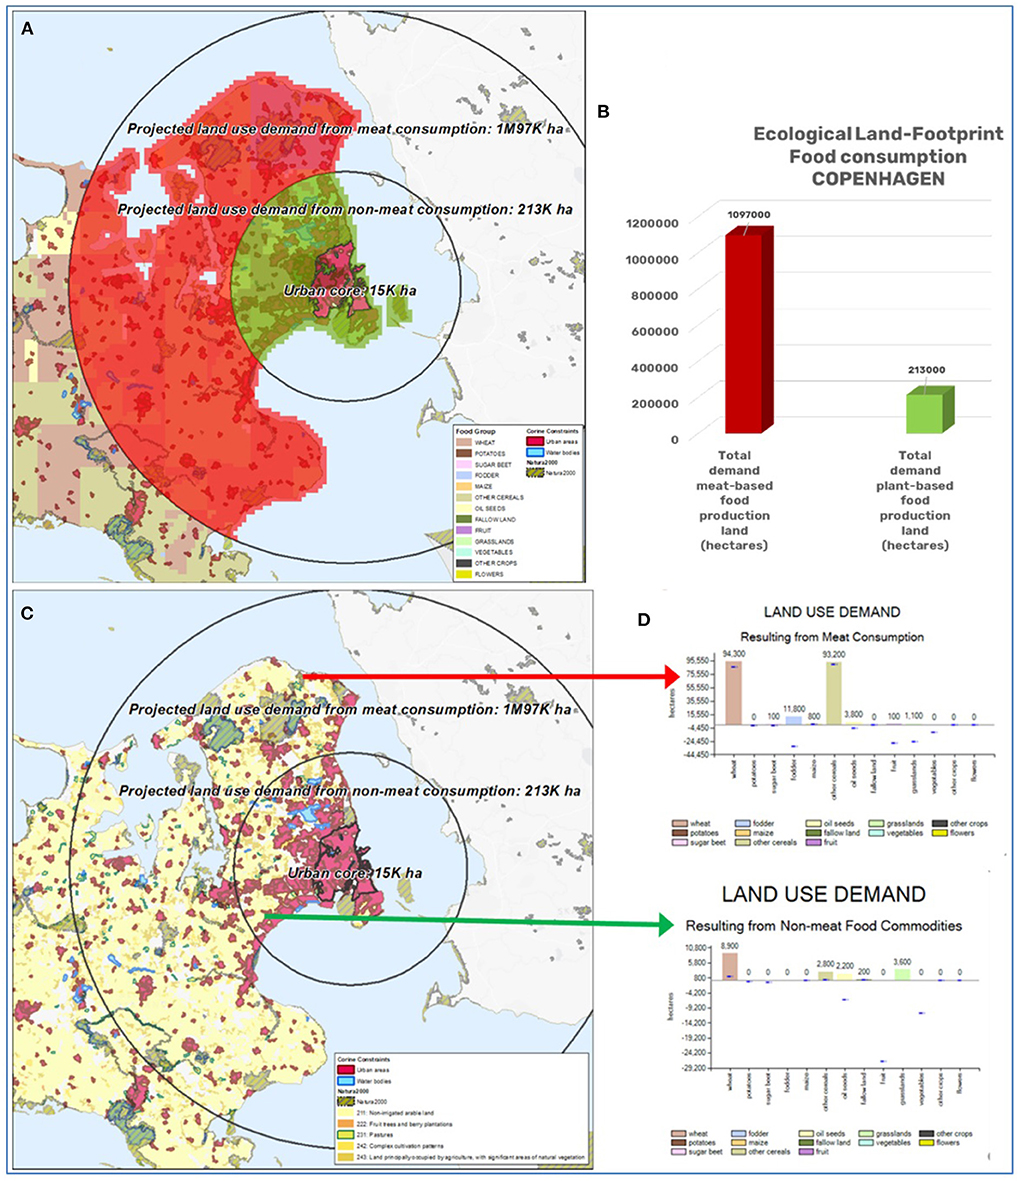
Figure 5. Land footprint food consumption in Copenhagen: (A) overlaid with map of food groups, and (B) as aggregated total food demand values in hectares. (C) Overlaid with a map of agriculture production zones. (D) Chart showing aggregated food group supply values in hectares within each ring.
Projected EAT-Lancet diet consumption scenario
Food consumption in the EAT-Lancet scenario was based on a dietary scenario calculated by Lassen et al. (2020) in the development process for the new Danish dietary guidelines, based on the EAT-Lancet Planetary Health Diet. This diet differs slightly from the global diet developed by the EAT-Lancet Commission (Willett et al., 2019), because it was adapted to match Danish commodities. As the recommended amounts in the diet are only valid for adult consumption (Lassen et al., 2020), the diet was adjusted with the assumption that children (aged 0–14) consume on average 86.5% of the calories consumed by adults, based on a study of Danish consumption patterns (Pedersen et al., 2015), and data on the current age demographics showing that at present 16.2% of the Danish population are in the relevant age bracket (Danmarks Statistik, 2021a). Subsequently, the average per capita consumption was adjusted with an estimate for food waste, to be comparable with the baseline consumption data, representing food supply. The estimate used is that on a European level approximately 20% of food is wasted, most of it at the household, food service and retail stages (Stenmarck et al., 2016). Calculations of area demand for plant-based products were done according to the same method applied in the assessment of area demand of the current food consumption. For animal-based products, area demand results from the baseline assessment were adjusted using the relationship between the supply of animal foods needed for the Danish EAT-Lancet diet and the current supply, again using estimates from Hermansen et al. (2017) to allocate production of feed crops to individual animal species. The resulting values for food supply and demand for both plant- and animal-based food production for the EAT-Lancet scenario in Copenhagen are found in Table 3.
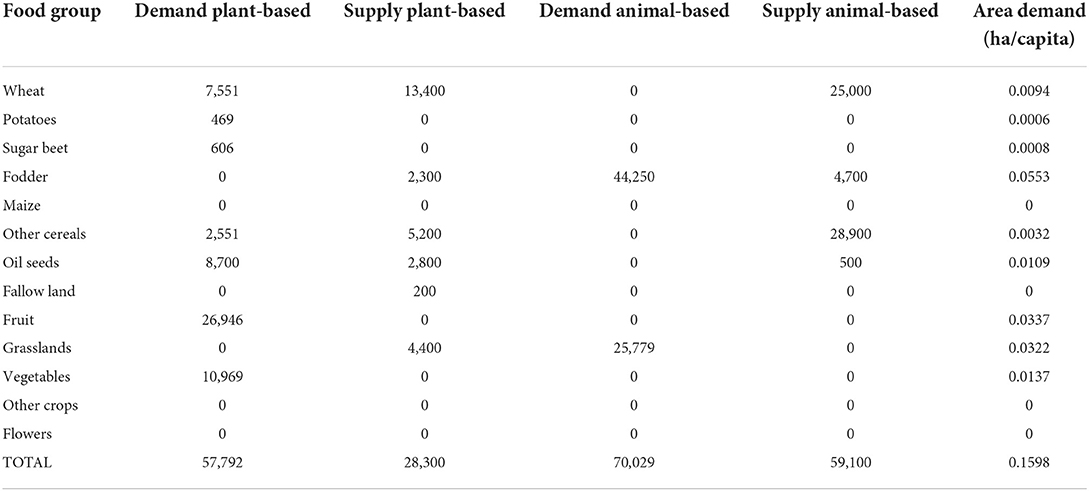
Table 3. Food demand and supply for Copenhagen: EAT-Lancet scenario (in hectares).
Figure 6 shows a map of the food groups (1-km resolution) overlaid with the resulting two concentric rings for the EAT-Lance diet scenario, whose sizes were calculated in a similar manner as done for the status quo: by matching food supply and demand on top of the available agricultural land.
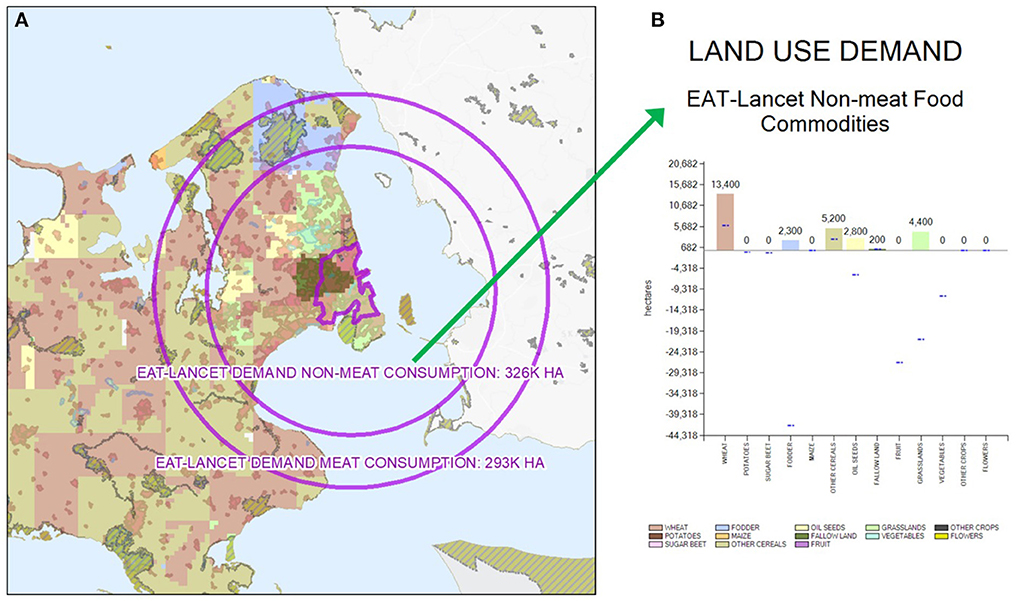
Figure 6. Land footprint EAT-Lancet food consumption in Copenhagen: (A) overlaid with map of food groups. (B) Chart showing the aggregated food group supply values in hectares within each ring for this scenario.
Comparing land footprints of status quo and EAT-Lancet diet
Figure 7 shows the land footprint of the status quo overlaid with that of the EAT-Lancet scenario. By visual inspection, we see that the EAT-Lancet diet scenario requires a lot less land for meat production, while it does require more land for plant-based consumption.
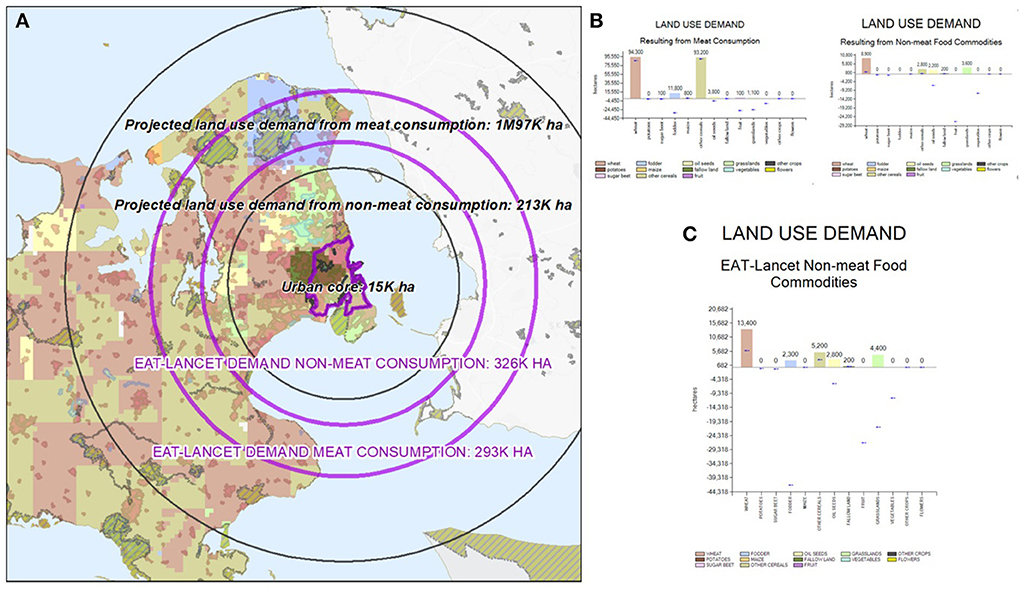
Figure 7. Land footprints of status quo and EAT-Lancet diet scenario: (A) overlaid with map of food groups. (B) Charts showing aggregated food group supply values in hectares within each ring for the status quo. (C) Chart showing aggregated food group supply values in hectares within the plant-based ring for the EAT-Lancet scenario.
This section presented the MFP implementation with Danish datasets. Next section presents the interactive part of this study, which deals with the co-creation of food system scenarios for the Copenhagen city region in a collaborative workshop setting as part of an ongoing H2020 EU-funded research project called FoodSHIFT2030. FoodSHIFT2030 aims to launch an ambitious citizen-driven transition of the European food system toward a low carbon circular future, including a shift to less meat and more plant-based diets. FoodSHIFT2030 establishes FoodSHIFT Accelerator Labs for maturing, combining, upscaling and multiplying existing food system innovations across nine city regions, of which Copenhagen is one of the pilot cities.
Collaborative FAL Copenhagen workshops
We tested the MFP tool in the context of the food system of the Copenhagen City Region. Two interconnected collaborative workshops were held with participating members of the FoodSHIFT Accelerator Lab of the Copenhagen City Region representing food consultancies, local authorities, MSc students, and researchers. The first exploratory workshop was held digitally using the Zoom® online meeting platform. The second workshop was held in person as a workshop masterclass with MSc students from the University of Copenhagen. The format of the workshops follow the structure proposed in the MapTable-based methodology by Arciniegas and Janssen (2012), which features and tests collaborative SDSSs.
Workshop 1. Status quo of the CPH food system
The first digital collaborative workshop was held with members of the FoodSHIFT Accelerator Lab of the Copenhagen City Region representing food consultancies, local planning authorities, and researchers. The main purposes of the workshop were:
• Get a better understanding of current agricultural land use of the wider Copenhagen city region in the light of food demand vs. supply
• Highlight the impact of meat-based food consumption on land demand
• Discuss potential scenarios food system around Copenhagen that are more regionalized and sustainable
• Contrast the impact of current food demand with (future) alternative diets.
Workshop participants used the tool in “online mode” via the online platform Zoom to learn about the status quo of over-usage of resources in the city region, and to brainstorm and propose visions for food system scenarios for a more regionalized food system with increased resilience and less vulnerability to crises. The workshop was facilitated by the hosts, who acted as “chauffeurs” of the tool, and asked the participants to indicate orally or via the chat function which map layers to be turned on or off, where to zoom in or out, and on particular sports of interest in the study area. The workshop agenda included the following parts: (1) Introduction to workshop and project, (2) Introduction to the MFP tool and its map layers/data, (3) Current land footprint of CPH and food landscape, (4) Comparison with EAT-Lancet diet, (5) Discussion on scenarios, (6) Recap and prospects/Post-workshop survey.
Despite the limitations of holding a tool-centered workshop over Zoom (e.g., limited facilitation, lack of hands-on experience, less dynamic discussion), the workshop was considered to be a success. All nine participants found the MFP to be a useful addition to the strategic planning inventory when considering a city region's food system. The workshop was held in collaboration with the Copenhagen FoodSHIFT Accelerator Lab (FAL) and aligned with the FAL's innovation focus of reconnecting the city with its hinterlands. The workshop was attended by nine people representing the Lejre Municipality, local food consultancy firms, the University of Copenhagen and SUSMETRO. The workshop allowed for direct feedback from a diverse group on potential use cases for the tool and certain needs of stakeholders that would be required. As such, the workshop served as a practical application to co-develop the tool with key stakeholders, and to brainstorm on potential pathways for new foodscape strategies in Copenhagen.
As the main outcome of this workshop, three food system visions were discussed and proposed for further analysis in the MFP tool, based on the presented analysis rings, namely (1) a plant-based food & recreation vision (in the plant-based ring), (2) a meat-based food and nature vision (in the animal-based ring), and (3) agroparks as islands of plant-based food production (across both rings and the urban core). These three visions were discussed in the following face-to-face masterclass workshop held with students at the University of Copenhagen.
Workshop 2. Masterclass at the University of Copenhagen
The second MFP workshop was held as a masterclass called 'Future Foodscapes in the Copenhagen Region—New tools for political decision-making processes—The Metropolitan Foodscape Planner MFP Copenhagen'. The workshop lecture was attended by 20 students from University of Copenhagen MSc programs in Agriculture, Animal Science, Agricultural Economics and Climate Change. While the majority of the participants were physically present, a couple of students also joined the workshop via the Zoom online platform. The students used the MapTable-MFP combination to co-develop, draw, and discuss the impacts of the three diet scenarios which were proposed in the previous online workshop. The 2-h masterclass contained the following agenda points: (1) Welcome, (2) Introduction to the MFP tool: status quo in Copenhagen, (3) Results of the EAT-Lancet Scenario,(4) Work sessions, (5) Presentation and application to the MapTable, and (6) Discussion.
The workshop started with an intro lecture to the tool and its underlying models and philosophy, followed by a description of the status quo in Copenhagen, resulting in concentric rings that portray the land footprint. Next, the 20 class attendees were divided into three groups. Each group worked on a specific food strategy vision and was asked to draw their food strategy scenario proposals on A4-format paper maps (see Figures 8A, 9).
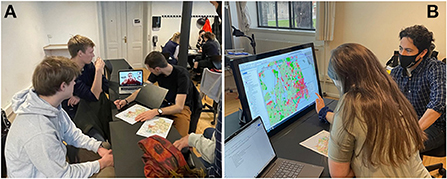
Figure 8. (A) Participants of one group propose scenarios on printed maps as an online participant co-discusses this scenario, and (B) participant applies the proposed scenario on the MapTable.
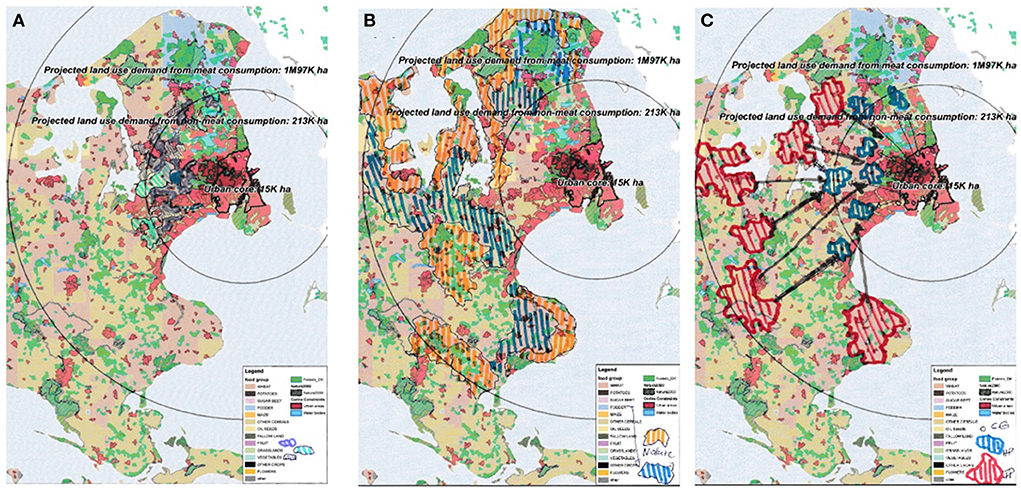
Figure 9. Scenarios sketched on paper by the three groups. (A) Plant-based food and recreation (inner ring), (B) Meat-based food and nature (outer ring), and (C) Agroparks as islands of plant-based food (across all rings).
The three food strategy visions were: (1) Strengthening plant-based food and recreational qualities (inner ring), (2) Allocating land reserved for meat-based food and nature (outer ring), and (3) Agroparks as islands of plant-based food (across all rings). Figure 9 shows the three scenarios sketched on paper by the students. Once each group had drawn out their proposals onto paper, they were then asked to digitize their scenario by relocating food group classes of a reference situation on the MapTable by allocating new food groups to 1-km cells on the map (Figure 8B). Figure 10 shows these new digital food strategies as proposed by the groups, next to the reference situation for comparison purposes.
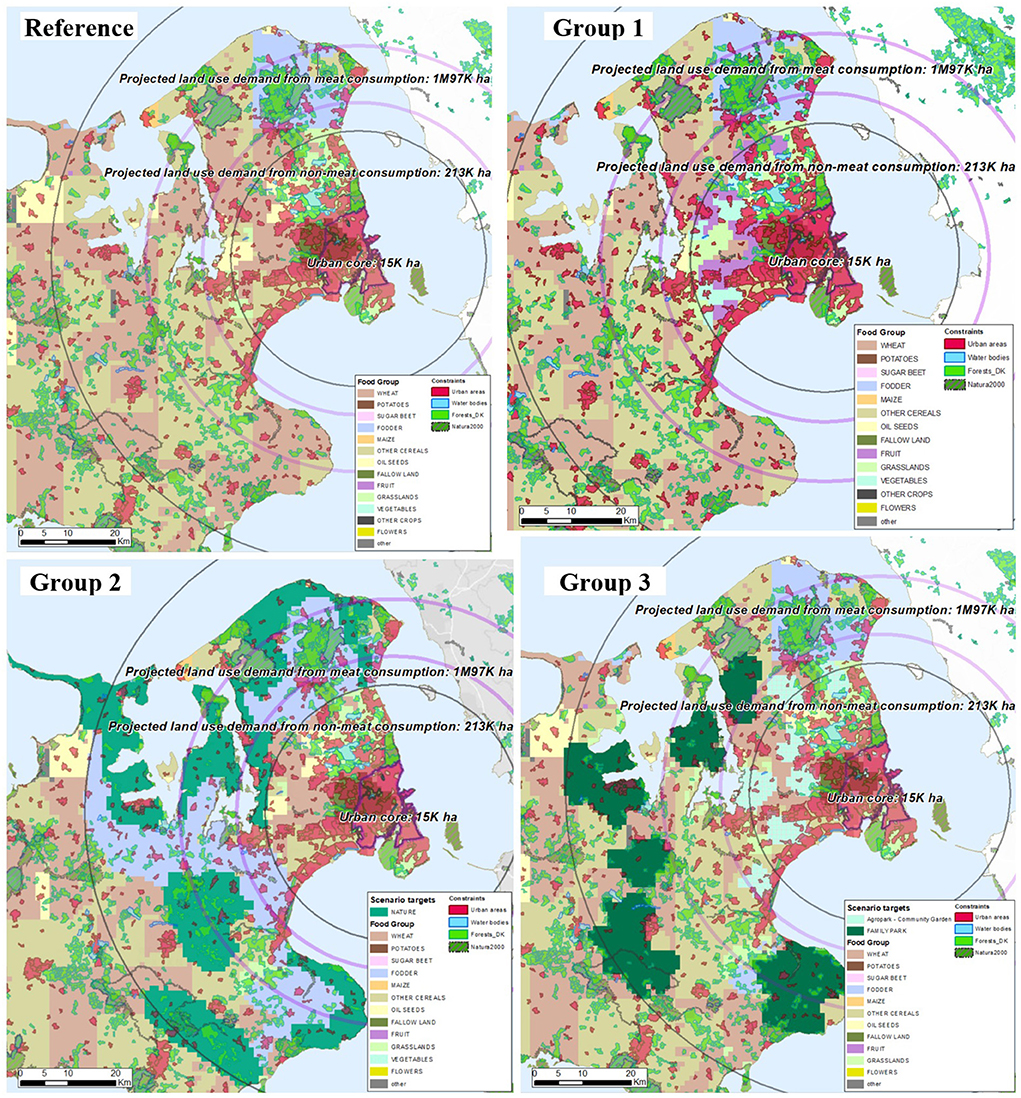
Figure 10. Reference situation and results from three groups as applied to Copenhagen on the MapTable. Black circles represent the land footprint of current consumption (outer: animal-based, inner: plant-based), while the purple circles represent the land footprint of the EAT-Lancet scenario.
Results group 1: Plant-based food and recreation
Participants of this group proposed to allocate three food groups within the plant-based ring, namely Fruits, Grasslands, and Vegetables in order to increase plant-based food and recreation (see Figure 10, top-right map). The recreational dimension of these land use types will require adequate planning to allow easy access, education values and space for experiencing the new foodscapes. Figure 11 shows the impact of the scenario proposed by group 1 relative to the reference situation (status quo, Figure 11A) for both plant- and animal-based production. Within the animal-production ring (the outer ring) the situation did not change as no classes were allocated within it. Within the inner plant-based ring, there is a visible increase in the number of hectares for food groups Fruit and Grasslands, and a decrease in food groups Wheat and Other cereals, which aligns with the recommendation of the EAT-Lancet dietary. Consequently, the position of the blue lines on these bars in the chart got closer to zero (for Wheat it decreased by around 700 ha, for Other cereals by 700 ha), which means the supply for these food groups were farther from meeting the demand. For Fruits, however, the supply-demand difference got closer to zero by adding around 2,000 hectares, yet still lacked a substantial number of hectares needed to balance supply and demand.
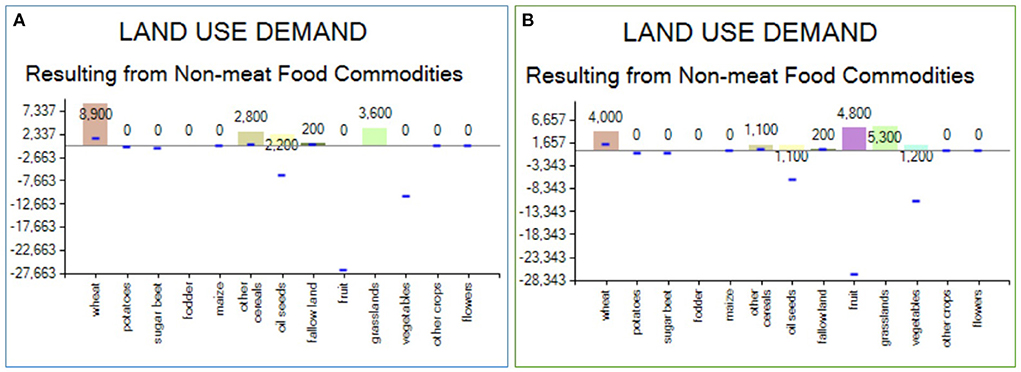
Figure 11. Assessment of scenario proposed by Group 1. (A) Reference, (B) Group 1's scenario. Charts show the supply-demand values for each food group within a particular ring. Bar charts show total supply hectares for each food group. Blue lines on bars portray the supply-demand difference, i.e., how much the supply is meeting the demand. Demand is met when the blue line is at ZERO point.
Results group 2: Meat-based food and nature
Participants of group 2 proposed to allocate three food group classes within the outer animal-based ring, namely Fodder, Nature, and Grassland in order to represent food and nature areas in the outskirts of Copenhagen (see Figure 9B bottom-left map). Figure 12 shows the impact of this scenario relative to the reference situation (Figure 10) for both plant- and animal-based food production. Within the animal-based ring, there is a visible increase in the number of hectares for food groups Fodder and Grasslands and class Nature, which were mostly allocated to areas where food groups Wheat, Other cereals and Oil seeds were present. Concerning supply-demand, the position of the blue line for Fodder got farther from zero by some 10,000 ha, which implies that fodder supply got farther from meeting the demand. This results from a substantial increase in Nature areas, which does not have an effect on supply-demand difference, but does reduce the amount of animal-based food producing land, again in alignment with the EAT-Lancet diet, which feature less meat-demand and consumption, and thereby more non-agricultural lands. Within the plant-based food production ring (the outer ring) the situation did not change significantly.
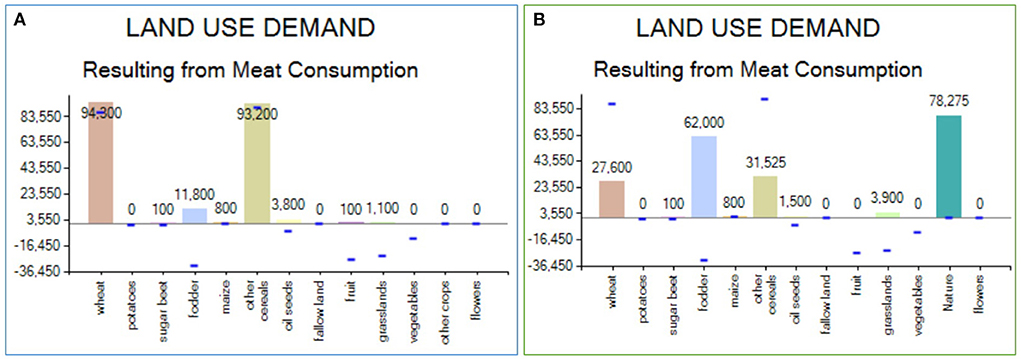
Figure 12. Assessment of scenario proposed by Group 2. (A) Reference, (B) Group 2's scenario.
Results group 3: Agroparks as islands of planted-based food
Participants of group 3 proposed to allocate Agroparks, Community gardens, and Family Parks across all rings in the Copenhagen city region (see Figure 9C bottom-right map). Family parks were drawn mostly near the edges of the outer animal-ring far from the city center. Agroparks were allocated for the most part within the plant-based ring in areas where Wheat and Other Cereals were present. Community gardens were drawn in open green areas inside the Copenhagen urban core and their areas are much smaller in comparison to Agroparks and Family parks. Figure 13 shows the impact of this scenario relative to the reference situation (Figure 10) for both plant- and animal-based food production. Changes can be seen across both rings. Within the animal-based ring, there is a visible increase in the number of hectares for Family parks and a slight increase in Agroparks. Most allocations were made at the cost of food groups Wheat, Other cereals and Oil seeds. Within the plant-based ring, an increase can be seen in Community gardens (CG), which is portrayed by class Agroparks - CG. Regarding supply-demand, the position of the blue line for Wheat and Other cereals got closer to zero by some 10,000 hectares. For class Agroparks (which is equivalent to Vegetables in the reference situation) there was also an increase in the supply-demand difference by a couple thousand hectares, which implies the new supply for vegetables in this ring is getting close to meeting the demand.
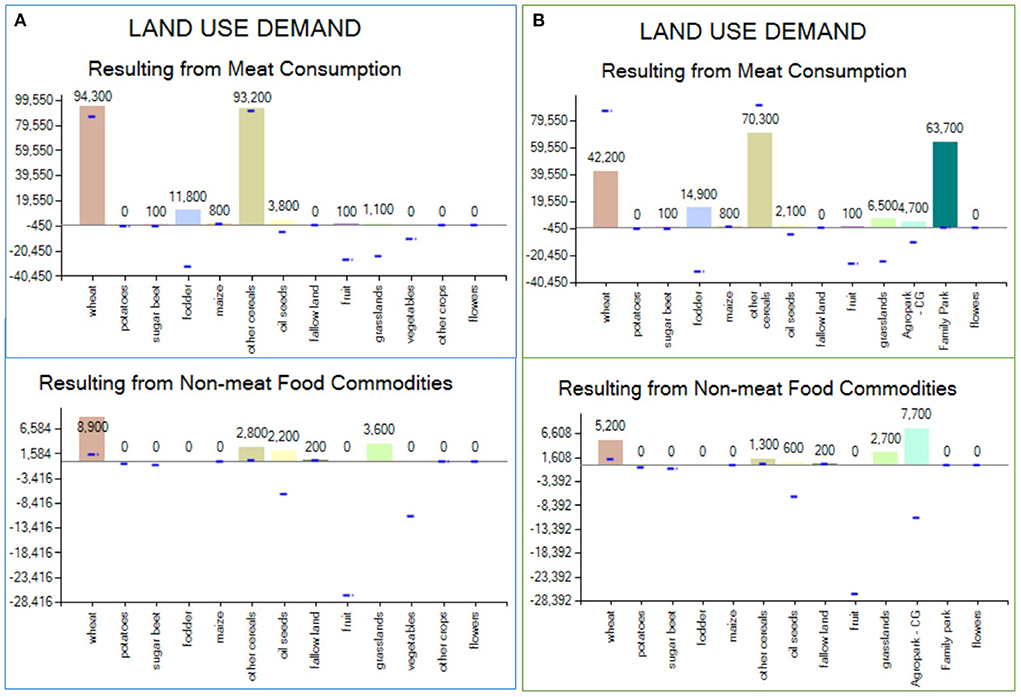
Figure 13. Assessment of scenario proposed by Group 3. (A) Reference, (B) Group 3's scenario.
Workshop evaluation
After the workshops, a survey was distributed. This survey was completed by the workshop participants, whose backgrounds and expertise include Sustainability consulting, Agronomist and Program manager, Scientific Project Manager, Innovation Support Officer for FoodSHIFT2030, background in sustainable agri-food systems, PhD Agroecology/geography, Sustainability Consultant at City of Aarhus (Mayors dept.), Director, FOOD, Food Policy Director, Research Assistant, University of Copenhagen Postdoc. The post-workshop surveys contained questions on their experience and specific aspects of workshop effectiveness. Participants were also asked to rate the MFP tool on the basis of several features. Tables 4, 5 summarize these responses. This table reveals that participants rated the interactive maps, the assessment module, and the portrayal of the status quo with the highest scores, whereas the portrayal of the EAT-Lancet diet was rated with the lowest scores.
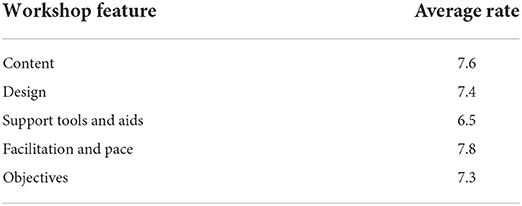
Table 4. MFP workshop ratings: 1 denotes low and 10 high.
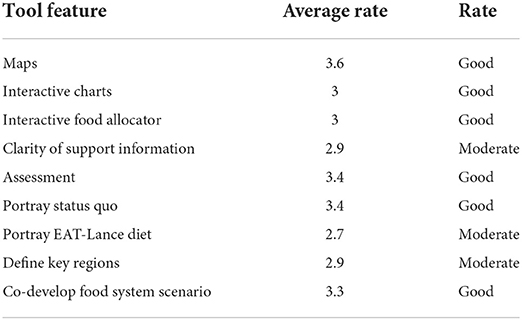
Table 5. MFP tool ratings: 1 denotes poor and 5 excellent.
Finally, participants were also asked about the workshop experience. Sixty-seven percentage of all participants indicated that the workshop fulfilled their expectations. Particularly, 89% of all participants considered the workshop to make a crucial contribution for developing a food system scenario for Copenhagen. When asked about the effectiveness of delivering a food strategy, 56% of all participants thought the workshop might do this to a marginal extent, while 34% to some extent. Regarding their opinion on Copenhagen's food system situation, 11% of all participants thought the workshop changed their opinion to a great extent, while 56% to a marginal extent, and 22% to some extent. Eleven percentage of all participants considered MFP a tool to support to a great extent the process of achieving consensus regarding possible locations of food strategies in Copenhagen, while 56% to some extent and 22% to a marginal extent.
Discussion
The impact of humans on the environment has been researched for years (Collins et al., 2020). As early as 1969, during a session of the General Assembly, a report by U Thant discussing problems of the human environment was presented, pointing out the need to reverse unsustainable socio-economic trends affecting the environment. More than 50 years after that report, we are still consuming more resources and generating more pollution than the environment can withstand and regenerate. We are living in a time when humans are called the planet's largest ecological footprint, and the level of environmental and planetary overshoot is alarming (Swiader et al., 2020). Achieving cross-cutting goals, such as sustainable development, and addressing large-scale global challenges, such as climate change, should be served by evidence-based policy as an instrument for rationalizing the policy-making process (Weiland, 2016). MFP can become such a tool for knowledge-based decision-making by tool providing land footprint maps and data on food demand vs. supply for developing sustainable foodscapes in metropolitan regions.
Reducing land footprint by shifting diets in the CPH city-region
Previous research focused on using MFP to quantitatively determine the land footprint of human food consumption in metropolitan areas. Wascher and Jeurissen (2017) utilized an earlier version of MFP to determine the land footprint of the Antwerp-Rotterdam-Düsseldorf region, demonstrating that regional food supply does not depend on existing agricultural land use. Wascher et al. (2015) compared the land footprints of Berlin, London, Milano and Rotterdam by means of a demand-supply analysis. Both studies showed meat-based land footprints larger than plant-based. Table 2 shows that the land footprint for animal-based food production is larger than that of plant-based production for the status quo, whereas the EAT-Lancet scenario shows a larger plant-based land footprint (see Table 3, Figure 7). The obtained MFP results for the Copenhagen case showed that the current state of food habits requires ensuring 0.2767 ha per capita. However, the change into EAT-Lancet diet will connect with a land footprint of 0.1598 ha per capita (decrease of 42% in comparison to status quo). Results obtained for status quo are higher than those for cities such as Rotterdam (1.2 million inhabitants)−0.21 hectares per capita or Milano (1.2 million inhabitants)−0.20 hectares per capita (Wascher and Jeurissen, 2015). The results obtained based on EAT-Lancet scenario are close to data quantified for: Berlin (3.5 million inhabitants)−0.18 ha per capita or Antwerp (1.4 million inhabitants)−0.134 ha per capita (Wascher and Jeurissen, 2017). Such a high footprint obtained for the status quo can be associated with the significantly high human development in Copenhagen and Denmark overall (Human Development Index of 0.948 in 2021; United Nations Development Programme, 2022). As research shows, most countries with high HDI (above 0.7) have high land footprint and exceed biocapacity (Hickel, 2020).
MFP guarantees a few possibilities: (a) it allows the assessment of the current state; (b) it allows the creation of alternative scenarios based on certain assumptions from reports or studies—such as the scenario based on the EAT-Lancet diet for Copenhagen; and (c) it allows the creation of hypothetical scenarios based on changes to population or food consumption (Kazak and Szewrański, 2014). Therefore, the hypothetical scenarios are created on a “what if” basis (Pettit et al., 2015), i.e., verifying what the impact on the environment (in this case, the land footprint) will be, e.g., changing meat consumption by 30% vs. increasing potato consumption by 25%. Such assumptions can be created on the fly, e.g., during workshops, and thanks to pre-prepared calculation functions—automatically calculated. Moreover, the MFP does not represent a finite solution. It could be adapted to emerging new data and the assumptions chosen by the stakeholders for whom research is conducted. Therefore, in other cases, new assumptions could be made regarding the assignment of the land footprint differentiated between meat and livestock products. This assumption can be made based on research conducted, i.e., by Poore and Nemecek (2018), which indicates the land footprint per kg of product including such division, i.e., land footprint of beef: beef herd (369.81 m2 per kg) vs. dairy herd (43.24 m2 per kg). We plan to explore such assumptions in future studies.
MFP as a pedagogical tool for academic programs in the world
The University students found the MFP tool easy to use and using the MapTable allowed for learning by doing. This is backed by the high ratings on the tool given by the students in the post-workshop survey. After a lecture and short demonstrations, the students were able to perform the foodscape allocation tasks with further support. The awareness of the current young generation is significant enough to introduce this kind of cognitive workshop in various types of classes ranging from geography and spatial management to social economics. Classes using such methods and tools as MFP can be conducted equally well in universities and high schools. In particular, it was representatives from these schools who launched the climate strikes (e.g., Fridays for Future, Extinction Rebellion). Therefore, there could be no better time to push socio-economic and cultural change toward more sustainable development.
Land use conflicts with projected sustainable food landscapes
There are a number of conflicts connected to power, legal, and real estate speculation issues The role of private sector is crucial in projected sustainable food landscapes, along with the reality of power relations, such as in land use, finance, expertise, political lobbies. Participatory processes should pay attention to giving a voice to both private and public stakeholders, in order to have a good picture of the dynamics and power relations shaping regional food system to emerge. Methodologies like that of MFP provide platforms for bottom-up collaboration where the focus is on informed decision making by means of a transparent communication of impacts of human actions, which in turn inform the planning of interventions.
Conclusions
This article described the use of a spatial decision support tool in two workshops as part of the living lab activities aimed at improving the sustainability of the food system in the Copenhagen city region.
MFP to improve food system sustainability
MFP is a spatial decision support system, designed to be used in a workshop setting using a MapTable as the main interface between spatial and food-related datasets, scenarios, and users. This article investigated the applicability of such a system to assess the footprint of food consumption and to allow for the co-development of food system scenarios that reduce this footprint and might address resilience in times of food-related crisis. Recent work on assessing resilience considers diet regionalization and crop diversification as factors that positively influence the resilience of a food system (Vicente-Vicente et al., 2021a). Results from this study indicate that there is potential for MFP to support decision-making processes that aim to design more regionalized food systems. MFP proved effective to communicate the impacts of human food consumption by means of combining geographical layers on land use, agricultural production, and spatial constraints and presenting them on the MapTable. MFP can seemingly make a good fit for gathering input and/or ideation, especially at the beginning of such decision-making processes, where visions are developed and discussed. As reported in the post-workshop surveys, city officials, planners, and the students gave positive feedback on the tool. MFP can be particularly relevant to scenario co-development methodologies, which makes MFP useful as a tool of persuasion and opportunities for change. As it is based on public European datasets, MFP can be applied in other city regions in a relatively straightforward process. The tool is flexible enough to consider other diet scenarios depending on cultural and/or local factors if EAT-Lancet is not applicable. The exchange of scenarios and lessons learned from different city regions could offer a wealth of inspiration and knowledge across Europe in these times of crisis. It can be argued that the use of MFP can contribute to fostering the regionalization of the food system, which in turn can contribute to the sustainability and potentially the resilience of the food system amidst the effects of COVID-19 restrictions. For example, despite restrictions, the tool can be implemented online without losing the participatory element. As previously noted, participatory processes are essential for informed decision-making, for which hybrid tools are key in providing flexible options for continued progress, despite external circumstances such as COVID-19. The methodology could be helpful for assessing other CRFS and to meet goals, such as, e.g., Farm to Fork strategy, net-zero CO2 emissions by 2050. New versions of the tool might include new indicators that take the assessment beyond land footprint measurement, which can engage more stakeholders. Indicators, such as reduction of GHG emissions for livestock as a result of the implementation of new plant-based diets, food waste reduction or a quantification of the regionalization of food systems by means of measuring spatial patterns (e.g., clustering) of new foodscapes, and overlaying these results with transportation infrastructure datasets can constitute compelling additions for future MFP implementations.
Collaborative workshops
Similar workshop approaches have been effective in supporting collaborative land use relocation processes (Arciniegas and Janssen, 2012). Workshop participants found the MFP-MapTable approach innovative and potentially useful; particularly, its capability to visually inform about the land footprint impacts of current food consumption, and how new, healthier and sustainable diets can diminish this impact while meeting the food demand. Participants indicated that the approach offers concrete opportunity and objectives for stakeholder cooperation, and a good starting point for opening discussions. The tool played a central role in facilitating two crucial tasks for improving the resilience of the food system of the Copenhagen city region, namely (1) the co-development of three vision pathways with concrete spatial scopes that relate to respectively animal-based and plant-based food production (and their combination), and (2) the co-development of three new food system scenarios that took this vision as the departure point. Results showed that the interactive element was well received and could open doors for much more participatory-oriented strategy development, which could be part of a wider participatory trajectory on a city-region basis. Workshop participants indicated that the MFP results contributed marginally to delivering a food system scenario. Future studies could expand the methodology to include recommended follow-up steps for a more detailed food system scenario, addressing the question of how to use the MFP results to help forming a concrete scenario.
Lessons and limitations
The MFP-MapTable approach has several limitations connected to its scope. Firstly, the ongoing COVID-19 global pandemic hindered the organization of face-to-face workshops. Consequently, the first workshop was held online via Zoom, and the second workshop was held using a combination of in-person (keeping a 1.5-m distance) and online, i.e., a hybrid workshop. Organizing such a hybrid policy workshop requires more effort than organizing a face-to-face workshop, and this also plays a role in reducing the proven capabilities of the MapTable to support communication and interaction between workshop participants, and the information provided by the tool. It is recommended to expand workshop-based methodologies for foodscape planning to include online methodologies, and to combine online and in-person. Secondly, the MFP only considers animal- and plant-based food production on land and in the city region, ignoring other sources, such as seafood and food imports, and excluding other food products such as dairy and chicken eggs. Future studies can address these weaknesses by means of targeted data measurement and collection. Thirdly, administrative boundaries were used to define the CRFS boundaries (e.g., Swedish administrative areas are not part of the study), which is also connected to the issue of overlapping analysis rings from other city regions. The case of Copenhagen is quite particular, as the city is located near the coast and close to the Swedish border, which would imply that its analysis rings might cover areas in Sweden. However, eventual food supply from Sweden was not considered. Fourthly, distinct production systems are not considered (e.g., conventional vs. organic), and the footprint assessment did not include transportation and logistics impacts. Fifthly, MFP allows for the allocation of food groups to cells of 1-km resolution. This resolution can be quite suitable for an entire city region around a city the size of Copenhagen or larger, but perhaps less suitable for smaller city regions or urban areas, such as neighborhoods. For example, allocating large-scale Agroparks proved straightforward to do in this configuration, but allocating small-scale scenario targets, such as community gardens within the urban core of Copenhagen proved challenging due to the size of the potential target areas. It is recommended to investigate the optimal ratio between city size, population, and scenario targets. Finally, the European datasets used in the tool allows the creation of food group maps for any city in Europe. However, local data on food supply (i.e., existing crops) as well as demand and consumption is needed for more accurate and realistic assessments, reliable enough to be used in food policy workshops.
Data availability statement
The original contributions presented in the study are included in the article, further inquiries can be directed to the corresponding author.
Author contributions
GA led the manuscript writing process, tool development and workshop implementation, and the research involved. DW developed the initial versions of the tool, was involved in the research and organization of all workshops, and contributed to all sections in the paper. PE contributed to literature review, workshop organization, conclusions section, and proofreading. MS and MŚ contributed to literature review on food systems and SDSS. JV-V contributed to literature review on food systems and SDSS, conclusions section, and proofreading. TU contributed to workshops organization and hosting, and to the case study description. AP contributed to data collection, methods section, and participated in workshops. ML contributed to workshop organization and data collection. EW contributed to data collection and participated in the workshops. LS contributed to workshop organization, conclusions, and manuscript proofreading. ES contributed to literature review and manuscript proofreading. CH contributed to workshop masterclass hosting and preparation, and manuscript proofreading. All authors contributed to the article and approved the submitted version.
Funding
This research was conducted as part of the FoodSHIFT2030 project, which has received funding from the European Union's Horizon 2020 research and innovation program under Grant Agreement No. 862716.
Acknowledgments
We want to thank all the members of the FoodSHIFT Accelerator Lab for the Copenhagen city region for their contributions to the practical part of this article, as well as all workshop participants, including the University of Copenhagen's students.
Conflict of interest
Authors GA, DW, and PE were employed by Susmetro - Sustainable Design for Metropolitan Landscapes. Author TU is the director of Sct. Hans Have.
The remaining authors declare that the research was conducted in the absence of any commercial or financial relationships that could be construed as a potential conflict of interest.
Publisher's note
All claims expressed in this article are solely those of the authors and do not necessarily represent those of their affiliated organizations, or those of the publisher, the editors and the reviewers. Any product that may be evaluated in this article, or claim that may be made by its manufacturer, is not guaranteed or endorsed by the publisher.
References
Alshibly, H. H. (2015). Investigating decision support system (DSS) success: a partial least squares structural equation modeling approach. J. Bus. Stud. Q. 6, 56.
Arciniegas, G. A., and Janssen, R. (2012). Spatial decision support for collaborative land use planning Workshops. Landsc. Urban Plan. 107, 332–342. doi: 10.1016/j.landurbplan.2012.06.004
Augustin, M., Cole, M., Ferguson, D., Hazell, N., and Morle, P. (2021). Perspective article: towards a new venture science model for transforming food systems. Global Food Security 28, 100481. doi: 10.1016/j.gfs.2020.100481
Badami, M. G., and Ramankutty, N. (2015). Urban agriculture and food security: a critique based on an assessment of urban land constraints. Global Food Security 4, 8–15. doi: 10.1016/j.gfs.2014.10.003
Bailey, R., and Wellesley, L. (2017). Chokepoints and Vulnerabilities in Global Food Trade. Wellesley Institute. Available online at: https://www.chathamhouse.org/sites/default/files/publications/research/2017-06-27-chokepoints-vulnerabilities-global-food-trade-bailey-wellesley-final.pdf (accessed August, 2022).
Béné, C. (2020). Resilience of local food systems and links to food security – a review of some important concepts in the context of COVID-19 and other shocks. Food Security 12, 805–822. doi: 10.1007/s12571-020-01076-1
Béné, C., Oosterveer, P., Lamotte, L., Brouwer, I. D., de Haan, S., Prager, S. D., et al. (2019). When food systems meet sustainability – current narratives and implications for actions. World Dev. 113, 116–130. doi: 10.1016/j.worlddev.2018.08.011
Benton, T. G., Carling, B., Harwatt, H., Pudasaini, R., and Wellesley, L. (2021). Food system impacts on biodiversity loss - three levers for food system transformation in support of nature. Chatham House. Available online at: https://www.chathamhouse.org/sites/default/files/2021-02/2021-02-03-food-system-biodiversity-loss-benton-et-al_0.pdf (accessed August, 2022).
Blay-Palmer, A., Santini, G., Halliday, J., Malec, R., Carey, J., Keller, L., et al. (2021). City region food systems: building resilience to COVID-19 and other shocks. Sustainability 13, 1325. doi: 10.3390/su13031325
Brouwer, I. D., McDermott, J., and Ruben, R. (2020). Food systems everywhere: improving relevance in practice. Global Food Security 26, 100398. doi: 10.1016/j.gfs.2020.100398
Broza, N., Birnbaum, K., Garcia Castro, D., and Kazak, J. K. (2020). Spatial absorbency assessment for sustainable land development. Geomatics Environ. Eng. 14, 5–18. doi: 10.7494/geom.2020.14.2.5
Collins, A., Galli, A., Hipwood, T., and Murthy, A. (2020). Living within a One Planet reality: the contribution of personal Footprint calculators. Environ. Res. Lett. 15, 025008. doi: 10.1088/1748-9326/ab5f96
Costello, C., Oveysi, Z., Dundar, B., and McGarvey, R. (2021). Assessment of the effect of urban agriculture on achieving a localized food system centered on Chicago, IL using robust optimization. Environ. Sci. Technol. 55, 2684–2694. doi: 10.1021/acs.est.0c04118
Crippa, M., Solazzo, E., Guizzardi, D., Monforti-Ferrario, F., Tubiello, F. N., and Leip, A. (2021). Food systems are responsible for a third of global anthropogenic GHG emissions. Nature Food 2, 198–209. doi: 10.1038/s43016-021-00225-9
Danmarks Statistik (2021a). Danmarks Statistik: FOLK2A. Available online at: https://www.statistikbanken.dk/statbank5a/selectTable/search.asp?Planguage=0&searchtext=folk2a (accessed August, 2022) (Age demographics).
Danmarks Statistik (2021b). Statistikbanken: HST77: Høstresultat efter område, afgrøde og enhed. Available online at: https://statistikbanken.dk/hst77 (Yield Averages) (accessed October 12, 2021).
Danmarks Statistik (2021c). Statistikbanken: Foder1. Available online at: https://statistikbanken.dk/foder1 (Fodder Usage) (accessed October 12, 2021).
Danmarks Statistik (2021d). Statistikbanken: GARTN1: Produktion af frugt og grønt efter område, enhed og afgrøde. Available online at: https://statistikbanken.dk/gartn1 (Fruit & vegetable production) (accessed October 12, 2021).
Davis, K. F., Downs, S., and Gephart, J. A. (2020). Towards food supply chain resilience to environmental shocks. Nat. Food 2, 54–65. doi: 10.1038/s43016-020-00196-3
EAT-Lancet Commission (2019). Summary Report of the EAT-Lancet Commission. Healthy Diets From Sustainable Food Systems: Food, Planet, Health. Available online at: https://eatforum.org/content/uploads/2019/07/EAT-Lancet_Commission_Summary_Report.pdf (accessed August, 2022).
Ericksen, P. J. (2008). Conceptualizing food systems for global environmental change research. Global Environ. Change 18, 234–245. doi: 10.1016/j.gloenvcha.2007.09.002
European Commission. (2020a). A Farm to Fork Strategy for a Fair, Healthy and Environmentally-Friendly Food System. Brussels: European Commission.
European Commission. (2020b). EU Science Hub. Crop yield forecasting. European Commission.Available online at: https://joint-research-centre.ec.europa.eu/scientific-activities-z/crop-yield-forecasting_en
Fan, S., Teng, P., Chew, P., Smith, G., and Copeland, L. (2021). Food system resilience and COVID-19 – Lessons from the Asian experience. Global Food Security 28, 100501. doi: 10.1016/j.gfs.2021.100501
FAO. (2018). Sustainable Food Systems - Concept and Framework. Available online at: https://www.fao.org/3/ca2079en/CA2079EN.pdf (accessed August, 2022).
FAOSTAT (2021). Food Balances (2014-). Available online at: https://www.fao.org/faostat/en/#data/FBS (accessed August, 2022).
FAOSTAT (n.d.). FAOSTAT. Available online at: https://www.fao.org/faostat/en/#data/TP (accessed October 12, 2021)..,
Farrell, P., Thow, A. M., Wate, J. T., Nonga, N., Vatucawaqa, P., Brewer, T., et al. (2020). COVID-19 and Pacific food system resilience: opportunities to build a robust response. Food Security 12, 783–791. doi: 10.1007/s12571-020-01087-y
Garnett, P., Doherty, B., and Heron, T. (2020). Vulnerability of the United Kingdom's food supply chains exposed by COVID-19. Nat. Food 1, 315–318. doi: 10.1038/s43016-020-0097-7
González, A., Donnelly, A., Jones, M., Chrysoulakis, N., and Lopes, M. (2013). A decision-support system for sustainable urban metabolism in Europe. Environ. Impact Assess. Rev. 38, 109–119. doi: 10.1016/j.eiar.2012.06.007
Heinemann, P. H., Lysenko, G., Squires, V., and Verheye, W. H. (2010). Decision Support Systems for Food and Agriculture [in:] Interactions: Food, Agriculture and Environment (Decision support systems for food and agriculture ed.), 164–167. Available online at: https://books.google.nl/books?id=26qgCwAAQBAJ&lpg=PA164&ots=2dfb-UD1vv&dq=Heinemann%2C%20P.%20H.%20(2010).%20Decision%20support%20systems%20for%20food%20and%20agriculture.&lr&pg=PA164#v=onepage&q=Heinemann,%20P.%20H.%20(2010).%20Decision%20support%20systems%20for%20food%20and%20agriculture.&f=false (accessed August, 2022).
Hermansen, J. E., Mogensen, L., Trydeman Knudsen, M., Kristensen, T., Gylling, M., and Institut for Agroøkologi - Jordbrugssystemer og Bæredygtighed DCA - Nationalt Center for Fødevarer og Jordbrug. (2017). Kortlægning af proteinværdikæder (Mapping of Protein Value Chains). DCA - Nationalt Center for Fødevarer og Jordbrug.
Hickel, J. (2020). The sustainable development index: Measuring the ecological efficiency of human development in the anthropocene. Ecol. Econ. 167, 106331. doi: 10.1016/j.ecolecon.2019.05.011
HLPE (2016). Sustainable Agricultural Development for Food Security and Nutrition: What Roles for Livestock? (No. 10). FAO (High Level Panel of Experts on Food Security and Nutrition of the Committee on World Food Security, Rome). Available online at: https://www.fao.org/fileadmin/user_upload/hlpe/hlpe_documents/HLPE_Reports/HLPE-Report-10_EN.pdf (accessed August, 2022).
HLPE (2017a). Sustainable Forestry for Food Security and Nutrition. (No. 11). FAO (High Level Panel of Experts on Food Security and Nutrition of the Committee on World Food Security, Rome.). Available online at: https://www.fao.org/3/i7395e/i7395e.pdf (accessed August, 2022).
HLPE (2017b). Nutrition and food systems (No. 12). FAO (High Level Panel of Experts on Food Security and Nutrition of the Committee on World Food Security). Available online at: https://www.fao.org/3/i7846e/i7846e.pdf (accessed August, 2022).
IPCC (2019). Climate Change and Land: an IPCC Special Report on Climate Change, Desertification, Land Degradation, Sustainable Land Management, Food Security, and Greenhouse Gas Fluxes in Terrestrial Ecosystems [P.R. Shukla, J. Skea, E. Calvo Buendia, V. Masson-Delmotte, H.-O. Pörtner, D. C. Roberts, P. Zhai, R. Slade, S. Connors, R. van Diemen, M. Ferrat, E. Haughey, S. Luz, S. Neogi, M. Pathak, J. Petzold, J. Portugal Pereira, P. Vyas, E. Huntley, K. Kissick, M. Belkacemi, J. Malley, (eds.)]. In press. Available online at: https://www.ipcc.ch/srccl/ (accessed August, 2022).
IPES-Food (2020). COVID-19 and the Crisis in Food Systems: Symptoms, Causes, and Potential Solutions. Available online at: https://www.ipes-food.org/_img/upload/files/COVID-19_CommuniqueEN(3).pdf (accessed August, 2022).
Joseph, S., Peters, I., and Friedrich, H. (2019). Can regional organic agriculture feed the regional community? A case study for Hamburg and North Germany. Ecol. Econ. 164, 106342. doi: 10.1016/j.ecolecon.2019.05.022
Karg, H., Drechsel, P., Akoto-Danso, E., Glaser, R., Nyarko, G., and Buerkert, A. (2016). Foodsheds and city region food systems in two West African cities. Sustainability 8, 1175. doi: 10.3390/su8121175
Kazak, J. (2018). The use of a decision support system for sustainable urbanization and thermal comfort in adaptation to climate change actions—the case of the Wrocław Larger Urban Zone (Poland). Sustainability 10, 1083. doi: 10.3390/su10041083
Kazak, J., Chruściński, J., and Szewrański, S. (2018). The development of a novel decision support system for the location of green infrastructure for stormwater management. Sustainability 10, 4388. doi: 10.3390/su10124388
Kazak, J., and Szewrański, S. (2013). Indicator-Based Environmental Assessment of Spatial Planning With the Use of Communityviz. Geoinformatics for City Transformation; Technical University of Ostrava: Ostrava, Czech Republic.
Kazak, J., and Szewrański, S. (2014). The use of geoinformation in land acquisition for road developments. Real Estate Manage. Valuation 22, 32–38. doi: 10.2478/remav-2014-0004
Kazak, J. K., and van Hoof, J. (2018). Decision support systems for a sustainable management of the indoor and built environment. Indoor Built Environ. 27, 1303–1306. doi: 10.1177/1420326X18799812
Kempen, M., Heckelei, T., Britz, W., Leip, A., and Koeble, R. (2005). A Statistical Approach for Spatial Disaggregation of Crop Production in the EU. Available online at: http://www.ilr.uni-bonn.de/agpo/publ/workpap/kempen_disagr_final.pdf
Kersten, G. E., Mikolajuk, Z., and Yeh, G. A. (1999). Decision Support Systems for Sustainable Development: A Resource Book of Methods and Applications, 2000th Edn. Boston, MA; Dordrecht; London: Kluwer Academic Publishers.
Kurtz, J. E., Woodbury, P. B., Ahmed, Z. U., and Peters, C. J. (2020). Mapping U.S. food system localization potential: the impact of diet on foodsheds. Environ. Sci. Technol. 54, 12434–12446. doi: 10.1021/acs.est.9b07582
Lal, R., Brevik, E. C., Dawson, L., Field, D., Glaser, B., Hartemink, A. E., et al. (2020). Managing soils for recovering from the COVID-19 pandemic. Soil Syst. 4, 46. doi: 10.3390/soilsystems4030046
Lassen, A. D., Christensen, L. M., Fagt, S., and Trolle, E. (2020). Råd om bæredygtig sund kost - Fagligt grundlag for et supplement til De officielle Kostråd. DTU Fødevareinstituttet. Available online at: https://orbit.dtu.dk/en/publications/r%C3%A5d-om-b%C3%A6redygtig-sund-kost-fagligt-grundlag-for-et-supplement-ti (accessed August, 2022).
Maxwell, S., and Slater, R. (2003). Food policy old and new. Dev. Policy Rev. 21, 531–553. doi: 10.1111/j.1467-8659.2003.00222.x
Meuwissen, M., Feindt, P., Slijper, T., Spiegel, A., Finger, R., de Mey, Y., et al. (2021). Impact of Covid-19 on farming systems in Europe through the lens of resilience thinking. Agric. Syst. 191, 103152. doi: 10.1016/j.agsy.2021.103152
Moragues-Faus, A. (2020). Distributive food systems to build just and liveable futures. Agric. Human Values 37, 583–584. doi: 10.1007/s10460-020-10087-9
Moschitz, H., and Frick, R. (2020). City food flow analysis. A new method to study local consumption. Renewable Agriculture Food Syst. 36, 150–162. doi: 10.1017/S1742170520000150
Mouléry, M., Sanz Sanz, E., Debolini, M., Napoleone, C., Josselin, D., Mabire, L., et al. (2021). Self-Sufficiency Assessment: Defining the Foodshed Spatial Signature of Short Beef Supply Chains. Preprints.
Nordhagen, S., Igbeka, U., Rowlands, H., Shine, R. S., Heneghan, E., and Tench, J. (2021). COVID-19 and small enterprises in the food supply chain: early impacts and implications for longer-term food system resilience in low- and middle-income countries. World Dev. 141, 105405. doi: 10.1016/j.worlddev.2021.105405
Orden, D. (2020). Resilience and vulnerabilities of the North American food system during the Covid-19 pandemic. EuroChoices 19, 13–19. doi: 10.1111/1746-692X.12273
Pedersen, A. N., Christensen, T., Matthiessen, J., Knudsen, V. K., Rosenlund-Sørensen, M., Biltoft-Jensen, A., et al. (2015). Danskernes kostvaner, 2011–2013. Søborg: DTU Fødevareinstituttet.
Pettit, C. J., Klosterman, R. E., Delaney, P., Whitehead, A. L., Kujala, H., Bromage, A., et al. (2015). The online what if? Planning support system: a land suitability application in Western Australia. Appl. Spatial Anal. Policy 8, 93–112. doi: 10.1007/s12061-015-9133-7
Picchioni, F., Po, J. Y. T., and Forsythe, L. (2021). Strengthening resilience in response to COVID-19: a call to integrate social reproduction in sustainable food systems. Canad. J. Develop. Stud. 42, 28–36. doi: 10.1080/02255189.2020.1858761
Poore, J., and Nemecek, T. (2018). Reducing food's environmental impacts through producers and consumers. Science 360, 987–992. doi: 10.1126/science.aaq0216
Porter, J. R., Dyball, R., Dumaresq, D., Deutsch, L., and Matsuda, H. (2014). Feeding capitals: urban food security and self-provisioning in Canberra, Copenhagen and Tokyo. Global Food Security 3, 1–7. doi: 10.1016/j.gfs.2013.09.001
Prag, A., and Henriksen, C. (2020). Transition from animal-based to plant-based food production to reduce greenhouse gas emissions from agriculture—the case of Denmark. Sustainability 12, 8228. doi: 10.3390/su12198228
Puma, M. J. (2019). Resilience of the global food system. Nat. Sustain. 2, 260–261. doi: 10.1038/s41893-019-0274-6
Schreiber, K., Hickey, G. M., Metson, G. S., Robinson, B. E., and MacDonald, G. K. (2021). Quantifying the foodshed: a systematic review of urban food flow and local food self-sufficiency research. Environ. Res. Lett. 16, 023003. doi: 10.1088/1748-9326/abad59
Skog, K., Eriksen, S., Brekken, C., and Francis, C. (2018). Building resilience in social-ecological food systems in Vermont. Sustainability 10, 4813. doi: 10.3390/su10124813
Stenmarck, Å., Jensen, C., Quested, T., Moates, G., Buksti, M., Cseh, B., et al. (2016). Estimates of European Food Waste Levels. Stockholm: IVL Swedish Environmental Research Institute/FUSIONS.
Stula, T., and Kazak, J. (2019). Spatial absorbency concept as a decision support system for sustainable local development. IOP Conf. Series Mater. Sci. Eng. 471, 112009. doi: 10.1088/1757-899X/471/11/112009
Swiader, M., Lin, D., Szewrański, S., Kazak, J. K., Iha, K., van Hoof, J., et al. (2020). The application of ecological footprint and biocapacity for environmental carrying capacity assessment: a new approach for European cities. Environ. Sci. Policy 105, 56–74. doi: 10.1016/j.envsci.2019.12.010
Swiader, M., Szewrański, S., and Kazak, J. (2018). Foodshed as an example of preliminary research for conducting environmental carrying capacity analysis. Sustainability 10, 882. doi: 10.3390/su10030882
Tavakoli-Hashjini, E., Piorr, A., Müller, K., and Vicente-Vicente, J. L. (2020). Potential bioenergy production from Miscanthus × giganteus in Brandenburg: producing bioenergy and fostering other ecosystem services while ensuring food self-sufficiency in the Berlin-Brandenburg Region. Sustainability 12, 7731. doi: 10.3390/su12187731
Terribile, F., Agrillo, A., Bonfante, A., Buscemi, G., Colandrea, M., D'Antonio, A., et al. (2015). A web-based spatial decision supporting system for land management and soil conservation. Solid Earth 6, 903–928. doi: 10.5194/se-6-903-2015
United Nations Development Programme (2022). Human Development Inex (HDI). Available online at: https://hdr.undp.org/data-center/human-development-index#/indicies/HDI (accessed August, 2022).
Vaarst, M., Escudero, A. G., Chappell, M. J., Brinkley, C., Nijbroek, R., Arraes, N. A., et al. (2017). Exploring the concept of agroecological food systems in a city-region context. Agroecol. Sustain. Food Syst. 42, 686–711. doi: 10.1080/21683565.2017.1365321
Vicente-Vicente, J. L., Doernberg, A., Zasada, I., Ludlow, D., Staszek, D., Bushell, J., et al. (2021a). Exploring alternative pathways toward more sustainable regional food systems by foodshed assessment – City region examples from Vienna and Bristol. Environ. Sci. Policy 124, 401–412. doi: 10.1016/j.envsci.2021.07.013
Vicente-Vicente, J. L., Sanz-Sanz, E., Napoléone, C., Moulery, M., and Piorr, A. (2021b). Foodshed, agricultural diversification and self-sufficiency assessment: beyond the isotropic circle foodshed—a case study from Avignon (France). Agriculture 11, 143. doi: 10.3390/agriculture11020143
Vittuari, M., Bazzocchi, G., Blasioli, S., Cirone, F., Maggio, A., Orsini, F., et al. (2021). Envisioning the future of European food systems: approaches and research priorities after COVID-19. Front. Sustain. Food Syst. 5, 642787. doi: 10.3389/fsufs.2021.642787
Von Thünen, H. (1826). Der isolierte Staat. An English Edition by Hall, P. (1966). Von Thunen's Isolated State. Pergamon, Oxford.
Wascher, D., and Jeurissen, L. (2015). “Metropolitan footprint tools for spatial planning. At the example of food safety and security in the Rotterdam Region. Localizing urban food strategies. Farming cities and performing rurality,” in 7th International Aesop Sustainable Food Planning Conference, Proceedings, Torino. Available online at: http://www.aesoptorino2015.it/content/download/413/2252/version/1/file/13_T1D_776_wascher_imp_A.pdf (accessed August, 2022).
Wascher, D., Zasada, I., and Sali, G. (2015). “Tools for metropolitan food planning - a new view on the food security of cities,” in The Governance of City Food Systems, eds M. Deakin, D. Diamantini, and N. Borrelli (Fondazione Giangiacomo Feltrinelli), 68–97.
Wascher, D. M., and Jeurissen, L. (2017). Urban food security at the crossroads between metropolitan food planning and global trade: the case of the Antwerp–Rotterdam–Düsseldorf region. Agroecol. Sustain. Food Syst. 41, 944–964. doi: 10.1080/21683565.2017.1325432
Wegerif, M. C. A., and Wiskerke, J. S. C. (2017). Exploring the staple foodscape of Dar es Salaam. Sustainability 9, 1081. doi: 10.3390/su9061081
Weiland, S. (2016). On the role of evidence and knowledge in sustainability governance–towards a reflexive approach to political decision-making? Revue de metaphysique et de morale 2016, 39–54. doi: 10.3917/rmm.161.0039
Wijffels, A., van Orshoven, J., Muys, B., and Cattrysse, D. (2010). “GITechnology: Adaptive generator of spatio-temporal decision support systems for land use planning,” in Decision Support Systems in Agriculture, Food and the Environment: Trends, Applications and Advances, ed B. Manos (IGi Global), 118–137. doi: 10.4018/978-1-61520-881-4.ch006
Willett, W., Rockström, J., Loken, B., Springmann, M., Lang, T., Vermeulen, S., et al. (2019). Food in the Anthropocene: the EAT–Lancet Commission on healthy diets from sustainable food systems. Lancet 393, 447–492. doi: 10.1016/S0140-6736(18)31788-4
Woertz, E. (2020). Wither the self-sufficiency illusion? Food security in Arab Gulf States and the impact of COVID-19. Food Security 12, 757–760. doi: 10.1007/s12571-020-01081-4
Yang, C., Raskin, R., Goodchild, M., and Gahegan, M. (2010). Geospatial cyberinfrastructure: past, present and future. Comput. Environ. Urban Syst. 34, 264–277. doi: 10.1016/j.compenvurbsys.2010.04.001
Keywords: food systems, Metropolitan Foodscape Planner, Copenhagen, spatial decision support, food supply and demand, collaborative workshops, living lab approach
Citation: Arciniegas G, Wascher D, Eyre P, Sylla M, Vicente-Vicente JL, Świa̧der M, Unger T, Prag AA, Lysák M, Schafer LJ, Welker E, Sanz ES and Henriksen CB (2022) A participatory tool for assessing land footprint in city-region food systems—A case study from Metropolitan Copenhagen. Front. Sustain. Food Syst. 6:846869. doi: 10.3389/fsufs.2022.846869
Received: 31 December 2021; Accepted: 13 October 2022;
Published: 08 November 2022.
Edited by:
Johann G. Zaller, University of Natural Resources and Life Sciences Vienna, AustriaReviewed by:
Marta Astier, National Autonomous University of Mexico, MexicoMario Chong, University of the Pacific, Peru
Copyright © 2022 Arciniegas, Wascher, Eyre, Sylla, Vicente-Vicente, Świa̧der, Unger, Prag, Lysák, Schafer, Welker, Sanz and Henriksen. This is an open-access article distributed under the terms of the Creative Commons Attribution License (CC BY). The use, distribution or reproduction in other forums is permitted, provided the original author(s) and the copyright owner(s) are credited and that the original publication in this journal is cited, in accordance with accepted academic practice. No use, distribution or reproduction is permitted which does not comply with these terms.
*Correspondence: Gustavo Arciniegas, Z3VzdGF2b0BzdXNtZXRyby5ldQ==