 Ravi Nandi
 Swamikannu Nedumaran
95% of researchers rate our articles as excellent or good
Learn more about the work of our research integrity team to safeguard the quality of each article we publish.
Find out more
ORIGINAL RESEARCH article
Front. Sustain. Food Syst. , 14 June 2022
Sec. Nutrition and Sustainable Diets
Volume 6 - 2022 | https://doi.org/10.3389/fsufs.2022.843697
This article is part of the Research Topic Dietary Change Strategies for Sustainable Diets and their Impact on Human Health - Volume 1 View all 44 articles
Majority of undernourished people live in rural Asia and Africa, and many of them are smallholder farmers and consume a significant amount of what they produce. This is specifically true in India. However, in the context of increasing commercial production systems, it is not well-known how much food is consumed from a particular food group that was purchased, what proportion of food is from the production of farm households, and how their diets change seasonally. Furthermore, whether the rural market food diversity complements or substitutes farm production diversity in household's diets is unknown. We employed a mixed-methods research design to answer these questions. The research was conducted in three villages in Telengana State. The results reveal that crop diversity has significantly declined from a highly-diverse production system to a less diverse one. The Food Consumption Score results show that on average own-farm production contributes 23% of food (mainly starchy staples), while market purchases contribute 77% of calories consumed (from more diverse and nutritious foods). Therefore, in the study, villages' market food diversity is more important, and it is complementary to own-farm production. However, our study shows that mere market access (the most widely used proxy indicator in the literature) does not guarantee the availability of diverse nutritious foods to households who use that specific market. This is because market food diversity varies from market to market and across seasons. Therefore, we proposed that in commercial production systems improving crop diversity, and strengthening rural markets, are needed. Moreover, incentivizing retail business and subsidizing nutritious and/or biofortified food in rural areas must be part of strategies to improve nutrition in rural India.
The rural poor are the most vulnerable, food insecure, and malnourished people in the world, and a significant population of them lives in rural Asia and Africa, and many of them are smallholder farm households that largely depend on agriculture for their livelihoods (Pinstrup-Andersen, 2007; Muller, 2009; Qaim et al., 2016; Gupta et al., 2020). Generally, smallholder farmers consume a significant amount of what they produce; therefore, increasing on-farm crops diversity and livestock species is frequently seen as a promising way to improve household dietary diversity (Fanzo et al., 2013; Jones et al., 2014; Powell et al., 2015; Jones, 2016; Sekabira and Nalunga, 2020). Moreover, dietary diversity is often used as a proxy to indicate an individual's broader nutritional status because diverse foods facilitate the balanced intake of all essential nutrients (Webb, 2014). Besides, the corpus of empirical studies acknowledged that increased farm production diversity had a positive influence on dietary diversity; however, it lacks discussion of scale and environmental aspects (Fanzo et al., 2013; Jones et al., 2014; Pellegrini and Tasciotti, 2014; Dillon et al., 2015; Powell et al., 2015; Sibhatu et al., 2015; Snapp and Fisher, 2015; Hirvonen and Hoddinott, 2017; Koppmair et al., 2017; Sibhatu and Qaim, 2018; Zanello et al., 2019). Nonetheless, for smallholders in developing countries like India, where the average landholding is 1.09 ha with varied weather conditions, encouraging smallholders to increase crop diversification may have adverse effects, mainly when crop diversity is already high. It may expose smallholders to the risk of losing benefits from specialized and economically viable crops and gaining a competitive advantage (Sibhatu and Qaim, 2018). In addition, in developing countries, smallholders have limited access to technologies, prevailing diverse agro-climatic and soil biophysical conditions, and scattered markets across the geographical area hinder households from diversifying farm production (Hirvonen and Hoddinott, 2017).
Conversely, recent empirical studies have highlighted the relative importance of markets for farm household dietary diversity and reported that markets access is more critical for farm household's dietary diversity than subsistence production (Luckett et al., 2015; Sibhatu et al., 2015; Jones, 2016; Lenjiso et al., 2016; Qaim et al., 2016; Koppmair et al., 2017; Ludwig, 2018; Sibhatu and Qaim, 2018; Mulenga et al., 2021). Further, A recent systematic literature review on the interplay between food market access and farm household dietary diversity in low and middle-income countries by Nandi et al. (2021), after screening 786 articles, revealed that the majority of the studies highlighted that market access improves dietary diversity. However, none of the studies reviewed have addressed how diverse foods are sourced from markets and on-farms contributing to farm household diet. Besides, most studies considered distance the major proxy indicator (e.g., self-reported travel time, distance to the nearest market, time taken, and cost to reach the nearest market). This proxy indicator may not accurately measure the construct of market access and may not necessarily equate to market participation and food diversity. Besides, distance to the market does not change with the season, while the availability of food changes on-farm and on the market. Therefore, we argue that mere market access does not guarantee the diverse food available to purchase because the type of market (input, output, or consumer market) individual accessing and market food diversity in specific markets play an important role in impacting farm households' diet. Similarly, Mulenga et al. (2021) suggested that future studies be conducted to understand how much food consumed from a particular food group was purchased and what proportion was from the household's production contributing to household dietary diversity to understand the relative importance of on-farm production and market purchases in a given context. Therefore, based on the research gaps identified in the previous literature, we analyzed the relative importance of farm production diversity and market access on farm household dietary diversity by estimating how much food consumed from a particular food group was purchased and what proportion was from own production in the context intensive farming system.
Given the scant evidence on this topic and the growing cognizance that dependency on markets satisfy the demand for nutritious non-staple foods even by very poor and remote rural households warrants a detailed understanding of rural markets. Our research questions mainly ask how the rural markets vary in their food diversity, frequency, how rural markets are associated with diets, and their relative importance in household diet and the local production system.
With this backdrop, the present study aims to examine the
1. Relative importance of rural markets food diversity and farm production diversity in contributing to farm household's diet by estimating how much food consumed from a particular food group was purchased and what proportion was from own production.
2. Whether the rural market food diversity is complementary or substitute to on-farm production diversity in contributing “household's” diet.
3. To examine farm production patterns, the rural market food diversity, and seasonality of foods available in the market potentially affect the rural “household's” diet.
To the best of our knowledge, this article is the first to address above mentioned questions, specifically in the Indian context. We employed a novel but highly replicable community and market survey using the mixed method in conjunction with key informant interviews to explore the characteristics of rural markets and their contribution to the household's diet. The results will help policymakers and development practitioners to design successful policies and programs.
“The soul of India lives in its villages”—Mahatma Gandhi.
India is a land of villages; nearly 68% of the population lives in 640,867 villages (Census, 2011). There are 47,000 periodic markets in India, which will play a significant role in the future as 58% of the rural consumers prefer to buy from periodic markets despite the product being available in the neighborhood stores in the villages (Kashyap, 2016; Velayudhan, 2016). A periodic market is an informal marketplace in the village, and such markets in various towns are as old as the settlement (Satyam, 2018). Some of the markets are located in the center of the community, in prominent places, and in nearby villages. The role of rural markets is very significant for the economic activities among rural dwellers, and largely rural people depend upon periodic markets for the sale and purchase of agricultural commodities. Rural markets play a vital role in supplying diverse diets to farm households, particularly smallholder farmers, due to stronger market linkage (Gupta et al., 2020). Various studies highlighted that rural market linkages enable farmers to consume a diverse diet through demand and supply. On the supply side, markets can make diverse and nutritious foods available to rural households across the seasons (Snapp and Fisher, 2015; Nandi et al., 2021). While on the demand side, increased income through commercial production of a few crops and by selling surplus commodities in the market may raise their income and demand for more diverse foods (Koppmair et al., 2017).
The rest of the article is organized as follows. First, the methods, including study setting, study design, sampling strategy, data collection, analysis, and measurements of different indicators, are presented in Section Methodology. Then, Section Results and Discussion presents and discusses the analysis results, while Section 4 provides the conclusions and implications for policy, followed by study limitations and future research.
This study is “part of a larger interdisciplinary research project, ’Transforming India's Green Revolution by Research and Empowerment for Sustainable Food Supplies (TIGR2ESS),” conducted in multiple locations across different states in India. It is conducted at the research site representing semi-arid agro-ecology from the south Indian state of Telangana, which has 46,531 irrigation tanks out of a total of 556,000 tanks in India (Kumar et al., 2016). A paddy is being cultivated in 44 million hectares in India, resulting in overexploitation of groundwater resources, particularly in the northwest and some parts of South India. Besides, crop diversity in these regions has significantly declined due to an intensive production system where paddy or wheat is being grown intensively in large areas. Our research site represents three villages, namely Katakshapur, House Buzurg, and Neerukulla, under Atmakur Mandal1 of Warangal Rural district in the Telangana state of India. These villages were randomly selected. These are the village's representative of larger regions with a market-oriented production system where a paddy is being grown intensively in large areas using tank irrigation. Due to decreased on-farm crop diversity in the selected villages, farm households depend on the local village markets for their diverse food needs. The selected villages are around 30 km away from the city of Warangal and are characterized by local periodical markets and Kirana stores. The Telangana state was a part of Andhra Pradesh state until it was separated in 2014, and Hyderabad City is the capital of Telangana state. The Warangal district is located 150 km from the metropolitan city of Hyderabad. More than 93% of the population live in rural areas in the district, agriculture is the main source of livelihood, and the literacy rate is 62.39–65.97% among males and 41.69–46.2% among females (Census, 2011). Map showing the research site as shown in Figure 1.
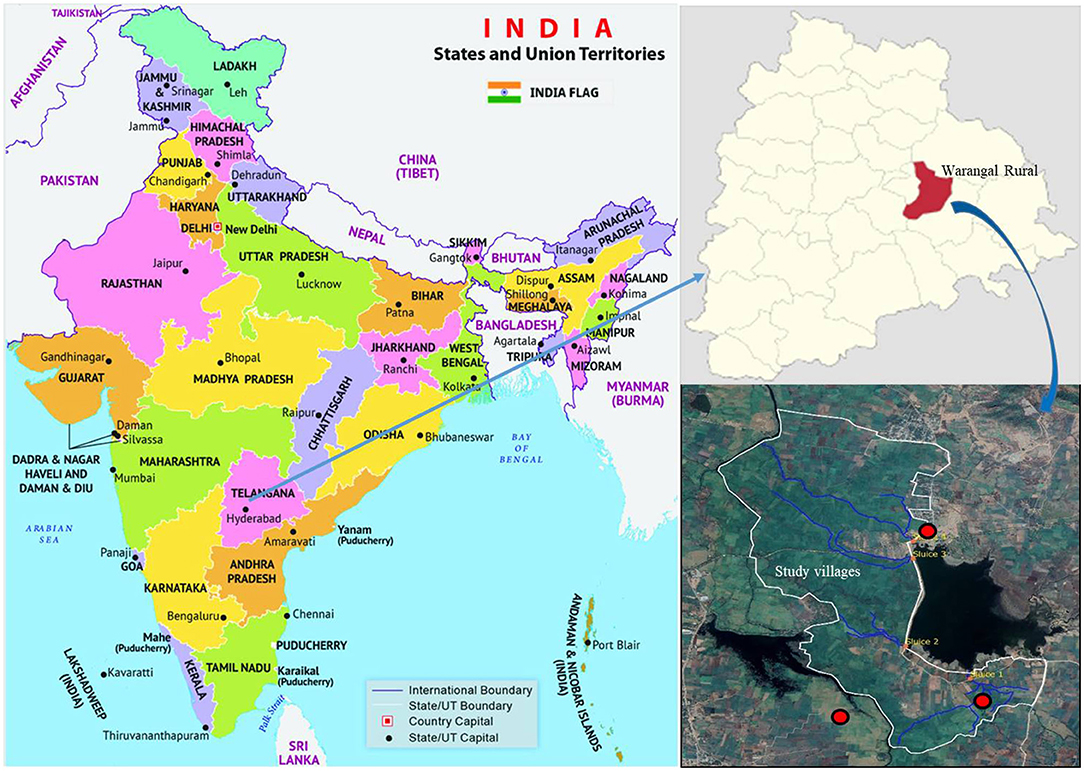
Figure 1. Map showing the research site (map not to scale), red dots in the google map are villages in the Warangal (R) district of Telangana state. Source: Adapted from: mapsofindia.com.
The characteristics of the study villages are mentioned in Table 1.
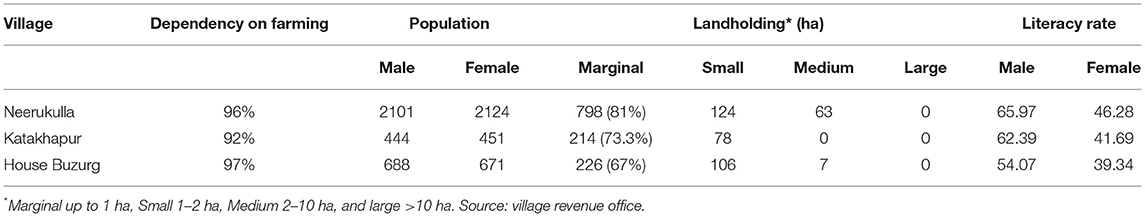
Table 1. Characteristics of study villages.
The villages in Warangal rural district are undergoing rapid transformation from subsistence farming to commercial farming systems due to improved access to water for irrigation, improved agricultural markets, and food processing units in the vicinity that create demand for agricultural outputs such as paddy and maize from the local farmers. Similarly, crop diversity has declined over time from multiple diverse subsistence cropping systems to more market-oriented commercial crops such as paddy, cotton, maize, chili, and turmeric in the district. The nearest city is Warangal, where major agricultural markets (output, input, and consumer), including government's Agricultural Produce Marketing Committee (APMC) and National Electronic Market (eNAM) are situated. The villages have relatively better connectivity with Warangal near the city, and the roads are good. The majority of the farmers sell their farm outputs, mainly paddy, cotton, maize, turmeric, and chili in the Warangal APMC market. Farmers have to collectively depend on their own transport or rent a truck to transport their commodities to the market during harvest season. While farmers have to depend on local markets to buy daily food needs, however market day happens only once a week, accessing the urban daily market is a challenge due to the distance factor.
The study adopted a mixed method of research approach. The mixed-method is an emerging methodology in social sciences that sees through multiple lenses to understand the complex research questions in the field. The mixed research method integrates quantitative and qualitative data within single research, permitting a synergistic use of data than using separate quantitative and qualitative data use and analysis (Creswell, 1999; Johnson and Onwuegbuzie, 2004; Brannen et al., 2005; Morse, 2016). To understand the changing cropping pattern, crop diversity, and crop area in the study region, we employed the quantitative data at the district level from 1966 to 2015 which is collected from ICRISAT District Level Database (ICRISAT - DLD, 2020). In addition, data about household food consumption, health, and nutrition-related information is collected from district-level offices. The qualitative household and community level information is collected through the Focus Group Discussions (FGDs). Besides, information about market food diversity and the seasonality of food available in the markets are collected from traders, agents, and farmers through Key Informant Interviews (KII). In addition, physical visits to the markets were made (Ambikapathi et al., 2019), to understand the market food diversity seasonality of food availability in specific village markets. We hoped that both quantitative and qualitative findings could be used to interpret, analyze, suggest, and guide appropriate interventions at the community and next level of the study sites.
The field enumerators are recruited to collect the qualitative data, and trained on research protocol to ensure their understanding of the broader objectives of the study. The recruited field enumerators were familiar with Telugu local language to conduct the FGDs and KIIs in the local language. The respondents were carefully selected by following stratified purposive random sampling from the list of households obtained from each village revenue office. The FGDs were held separately with male and female groups. While doing so, care was taken to ensure the fair representation of households covering all caste and classes existing in the village. Each FGD group ranged from 8 to 10 respondents. To achieve saturation of information on a specific theme, we continued conducting the FGDs until we reached a point where we had a range of opinions and no new information was collected. In addition, KIIs are conducted by visiting respective “villages” periodical markets. After Focus Group Discussions (FGDs), the individual participants also answered the survey questions related to household consumption patterns. The details about the sample and source of information are mentioned in Table 2.
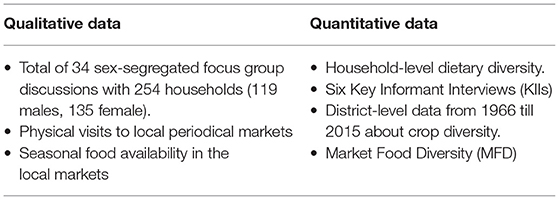
Table 2. Sources of data.
This qualitative research is grounded in interpretative approaches, and each theme-based analysis was inductively and deductively identified from the qualitative data. Inducting coding was made based on the grounded theory technique, including line-to-line analysis and the comparative method. All the transcripts were coded independently by the lead author and co-lead. Further, the discussion was held with other team members to interpret the results. The data analysis from the FGDs and KIIs with respondents and videos and audios were zed using content analysis and the software RQDA for Qualitative Data Analysis, mainly used to systematically structure large text information (Chandra and Liang, 2016). For all the qualitative data from the project involving responses to different research questions, RQDA was used to systematically cluster responses to open and to probe questions into meaningful categories. We used only relevant qualitative information specific to this study from the entire qualitative data. Besides, quantitative data is analyzed using MS excel to arrive at the participants' Food Consumption Score (FCS), Household Dietary Diversity Score (HDDS), and socioeconomic profile.
We employed the FCS and HDDS, which are important qualitative measures of household food consumption and are cost-effective and less time-consuming compared to quantitative dietary intake methods (Kennedy et al., 2010). These are the proxy measures of household dietary intake. The Food and Agriculture Organization (FAO) and the World Food Program (WFP) use information about dietary diversity as one element to inform food security studies. Albeit, the FAO uses a 1-day HDDS based on the Food and Nutrition Technical Assistance Project guidelines, whereas the WFP uses an FCS (Swindale and Bilinsky, 2006). Both HDDS and FCS have been validated in different countries as a proxy measure of caloric intake (Wiesmann et al., 2009; Kennedy et al., 2010; Hussein et al., 2018). The validation studies have shown that FCS and HDDS are both related to caloric intake and each other. The data gathered using either measure are most useful for application within a given agro-ecological zone or country (Kennedy et al., 2010).
Food Consumption Score is an index developed by WFP in 1996, and it is a proxy indicator of household caloric availability. The FCS aggregates household-level information on the diversity and frequency of food groups consumed during the previous seven days, which is then weighted according to the relative nutritional value of the consumed groups (World Food Program, 2008). FCS consider eight food groups and each food group consumed receives a weight from 0.5 to 4 (cereals, tubers, and root crops = 2; meat and fish = 4; milk = 4; oil/fats = 0.5; fruit = 1; vegetable = 1, pulses = 3, sugar = 0.5) and condiments are not counted in FCS (Kennedy et al., 2010). The typical cut-off scores were ≤ 21 (poor), borderline (21.5–35), and acceptable (>35).
To construct the FCS, we used information on the household's food consumption and the frequency of specific food groups/items during the previous 7 days. The food items were then grouped into eight specific food groups. Any frequency values over seven are capped at seven. Finally, each food group was multiplied by a food group weight, and the sum of the weighted food group score is calculated to arrive at Food Consumption Score (FCS).
Household Dietary Diversity Scores are calculated by summing the number of food groups consumed in the household or by the individual respondent over the 24-h recall period. More diversified households' diet is correlated with protein and caloric adequacy (Swindale and Bilinsky, 2006). We use a number of food groups consumed by the farm households over the last 24 h to create HDDS as a proxy for household diet quality, and it is validated as a measure of nutrient adequacy and food security using 24-h recall periods for women and children (Verger et al., 2019; Nandi et al., 2021). To measure HDD, we categorized reported food items into food groups to align as closely as possible with the FAO guidelines (Kennedy et al., 2011). The 12 food groups included are namely cereals; white tubers and roots; legumes, nuts, and seeds; vegetables; fruits; meat; eggs; fish and fish products; milk and milk products; sweets and sugars; oils and fats; and spices, condiments, and beverages are used to calculate the HDDS indicator. Each food group is assigned a score of 1 if consumed or 0 if not consumed. The household score ranges from 0-to 12, and it is equal to the total number of food groups consumed by the household. The aggregated food consumption index measures the sum of groups of foods consumed within a household, and it reflects the dietary quality of foods available to households and is used as a household nutrition security indicator (Swindale and Bilinsky, 2006). HDDS ≤ 3 is considered a low dietary diversity group, with between four to six as medium and ≥ 7 as high diversity score category. We have considered ≤ 3 as a low dietary score because, as a general rule, consuming four food groups over 24 h is considered good dietary diversity (Kennedy et al., 2011). However, there is no international consensus on which cut-off values to use (Vanessa Cordero-Ahiman et al., 2017).
The average household dietary diversity score for the target population can be calculated as follows:
Crop diversity refers to growing several crops in a year in the given landholding. There are different methods to measure crop diversification, and the important one is Herfindahl-Hirschman Index (HHI). HHI is calculated by taking the sum of squares of acreage proportion of each to the total cropped area (Sharma, 2017).
Where,
N = The total number of crops.
Pi = is the proportion of area under ith i = 1 i = 1 crop to total cropped and Ai = is the actual under ith crop.
The index is defined as a sum of squares of all “n” proportions and is a measure of concentration.
The value of HHI ranges between 0 and 1, where zero indicates perfect diversification and one indicates perfect specialization. The value of HHI approaches zero as “N” becomes large and takes value one when only one crop is cultivated (Sharma, 2017). The HHI is categorized into three levels: HHI Below 0.1 is less diversified, 0.1–0.18 is moderately diversified, and HHI above 0.18 is highly diversified.
The most commonly used variables for market access indicator in the literature is self-reported to nearest markets, the existence of a market in the village, roads, and ownership of vehicles (Sibhatu et al., 2015; Snapp and Fisher, 2015; Nandi et al., 2021), the share of farm produce sold to proxy for market access at household level (Jones, 2016). In our study, we use a similar measure to access the market, but it is market food diversity to measure the diversity of food available in the specific market across the season, and on the consumption side, the share of purchased foods from the local markets in household diet during the last seven days.
Market Food Diversity (MFD) is defined as the availability of foods and food groups across the seasons in a given market. MFD is a new definition that was recently used by Ambikapathi et al. (2019), and a similar definition of market food availability by Zanello et al. (2019). The MFD information can be collected using the information gathered from traders (from their book transactions), shopkeepers, other key informants, and visiting the target markets. Conversely, in the previous literature, mainly market access is used as an indicator to study the role of markets in household diet quality. But mere access to the market cannot guarantee the availability of diverse foods (Nandi et al., 2021). It is reported from several studies that food crop and livestock diversities have a positive relation with dietary diversity. In our study, we collected MFD information by interviewing regular vendors and traders in the market and also by visiting village markets. There are two key informants for each village. The information collected is about availability of different food items belonging to different food categories, price, abundancy of food available, frequency of market and seasonal variability of specific foods in the village market. Based on the availability of 32 foods, 7–10 food groups are created to form monthly market food diversity for individual village. The 32 foods are as mentioned in Figure 4.
In India, there are three cropping seasons, namely Kharif (June-November), Rabi (October-March), and Zaid (between Kharif and Rabi). Generally, the production of the major staple come from the Kharif season, whereas pulses and oilseeds are from the Rabi season, including wheat. But due to diverse climatic conditions across the geographical area, there is significant variability in seasonal agricultural patterns in India. As a result of seasonal variability, the availability of foods in the local markets varies. Understanding such variability in a specific geographical area is important due to its potential impact on the diet quality of the population who depend on such a market for their daily consumption. Therefore, there is a need to understand local food availability in the local markets and its impact on the 'household's diet, as such information is missing in the literature in low and middle-income countries. This article advances the literature on the importance of seasonality on market food availability and diversity that potentially affect household dietary diversity. Besides, we assess the role of rural markets' food diversity than the previous literature.
Ethical approval was obtained from the Institute Review Board (IRB) for the ethics of ICRISAT (Reference number IEC-ICRISAT/20190818/01).
The sociodemographic characteristics of the respondents are shown in Table 3. Of the 254 total respondents who participated in the FGDs, 47% were males with an average age of 47 years, whereas 53% of the respondents were females with an average age of 41 years. The majority (53%) of the households belong to Backward Class (BC), and 20% are Scheduled Caste (SC), 17% Other Caste (OC), and 9% belong to Scheduled Tribe (ST). Thirty-eight percent of the respondents were illiterate without any formal education, and only 15% had formal education, graduated and, pursued higher studies. The remaining 40% studied middle school to higher secondary. The majority (89%) of the households are landed, involved in farming, and mainly belong to OC and BC caste, 11% were landless and mainly belong to SC and BC caste, and the majority of them are farm laborers. The health and nutritional data of study villages are not part of our survey. However, to provide an overview of the district's health and nutritional status, district-level information is provided in Annexure 1.
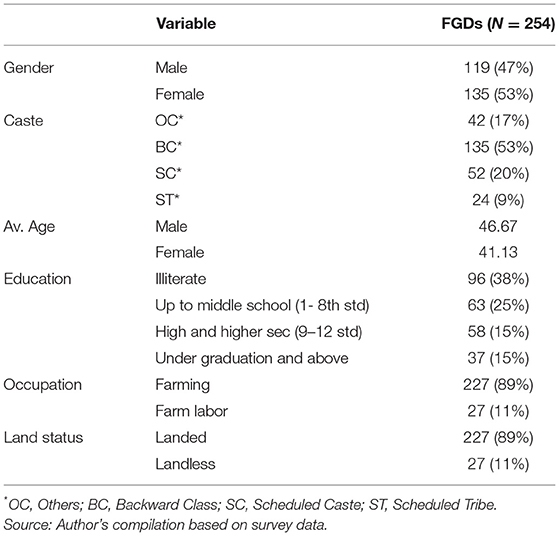
Table 3. Sociodemographic characteristics of the survey respondents.
More than 94% of the population depends on agriculture for their livelihood in the study villages. Paddy occupies the 'lion's share in the cultivable area, and it is the main crop during Kharif season, followed by cotton, maize, groundnut, chilies, and other few crops in less area. Maize is not consumed locally, and it is grown for commercial purposes (processing and poultry feed). Due to the well-established government-supported Agricultural Produce Market Committee (APMC), rice mills, and other private buyers within the village vicinity and farmers generally “don't face any problem selling their produce.” Farmers often have prior contact with potential buyers through their inputs and credit transactions. The free electricity, access to tank irrigation, MSP, and subsidized inputs are major push factors for farmers bringing more area under paddy. In particular, for paddy, access to water from the local village tanks helps farmers to grow two paddy crops in a year (both in Rabi and Kharif). Besides, enabling environmental factors such as local markets (APMC), village-level procurement ers (under MSP), rice mills, poultry feed factories, and local production ecosystems are favorable for farmers to grow paddy and maize. Besides, access to high yielding varieties (HYVs) and improved inputs such as seeds, fertilizers, and plant protection chemicals helped increase the production and productivity of paddy and maize crops in the region over the period (Figure 2).

Figure 2. Yield of paddy, maize, and other major crops over time in the study region.
The cropping system in the study region has shifted from subsistence farming to a commercial and market-oriented production system, mainly due to easy access to irrigation water and a better market for agricultural commodities. We analyzed crop diversification from 1966 to 2015 using longitudinal data about crops in the Warangal rural district of Telangana state using Hirscman - Herfindahl Index (HHI) method to measure the crop diversity. The results revealed that the crop diversity had declined significantly from a highly diverse (HHI >0.18) cropping system to a very less diversified (HHI < 0.1) cropping system between 1966 to 2015 (Annexure 2). From 1966 to 1975, the 10 “years” average HHI was 0.20, which is a highly diverse cropping system, and it continued till the year 1984 with HHI ranging from 0.20 to 0.18. After the year 1985 onwards till the year 2010, the HHI was moderate, with the HHI values ranging from 0.16 to 0.11. However, HHI values declined below 0.10 from 2011 until 2015, indicating that crop diversity has significantly declined in the district during recent years. This clearly shows a rapid decline in the district's crop diversity, which severely impacts natural resources, ecology, household health, and nutrition. The impact of farm production diversity on-farm household's nutritional outcomes is well-established in the literature (Pellegrini and Tasciotti, 2014; Powell et al., 2015; Sibhatu et al., 2015; Snapp and Fisher, 2015; Hirvonen and Hoddinott, 2017; Koppmair et al., 2017; Sibhatu and Qaim, 2018; Zanello et al., 2019) highlighting decreasing farm production diversity directly impact household nutrition in the absence of access to the market. The rapid decline in crop diversity in the region is due to the increased number of farmers shifting from diverse cropping patterns to more commercial crops such as paddy, cotton, maize, etc. It is observed from the detailed analysis that some of the crops, particularly wheat, sorghum, pearl millet, finger millet, minor pulses, and oilseeds, have lost their place in the total crop area, and the area is being replaced with cash crops, mainly cotton (Annexure 3). The cereal crops occupied the lion's share in the total cropped area in the district (Annexure 4).
Focus Group Discussions also revealed similar results at the village level in the study area. Some of the FGDs participant's responses related to changing crop diversification in the study area are mentioned below,
“We used to grow variety of crops including fruits, vegetables, millets etc. 20–40 years back. The majority in our villages grow paddy, cotton, and maize crops due to access to water from tanks, better price, assured markets, and easy to cultivate, particularly paddy” (Male, Landed, FGDs, House Buzurg).
Another FGD participant reported,
“[…] In our village majority grow paddy with tank water, we also grow watermelon, cucumber etc. in a small patch of our land along with paddy crop, but monkeys and wild boar menace is severe that destroy fruits and vegetable crops, we must monitor day and night if we plant such crops. Therefore, we don't prefer to grow other than paddy, maize, and cotton” (Female, landed, FGD, Neerukulla).
Key informant interviews also revealed similar views on changing crop diversity. One key respondent said:
“[…] During our childhood days, my parents used to grow different pulses, millets, vegetables, fruit crops along with paddy crops or during the rabi season, but nowdays [sic], we can see only two to three crops in surrounding villages” (Male, KII, Katakshapur, Age 56 years).
Another key informant mentioned,
“During 15–20 years before, the study villages were growing diversified crops such as paddy, wheat, sorghum, pearl millets, finger millets, minor pulses, oilseeds, fruits, vegetables, chili, and other crops. In addition, the majority of the households in the villages had at least 2–4 milk animals, and every household used to sell surplus milk to the city. Then, however, the majority of the crops disappeared, and paddy became a major food crop. As a result, the majority of the households buy milk packets from outside” (Male, KII, landed, Sarpanch, Age 52, Neerukulla).
Due to increased market-oriented commercial production of crops, mainly paddy, maize, and cotton in the study region, farmers' income has improved over time. This is due to increased production, productivity, and assured government's Minimum Support Price (MSP) for the crops mentioned. As a result, the farmers in the study villages received an average Rs. 1,800/quintal of paddy, Rs. 5,800/quintal for cotton, and Rs. 1,400 for maize under MSP during 2020.
Similar to the majority of the Indian villages, in our study village markets (consumer market) takes place once a week (periodical markets), and rural communities rely on these periodical markets to buy their household food needs (vegetables, fruits, groceries, meat, etc.), which are not grown in their farm. Therefore, we exclusively assessed the relative importance of on-farm production and purchases from consumer markets in contributing to farm 'household's dietary diversity. Based on the household-level food consumption, we estimated both Food Consumption Score (FCS) and Household Dietary Diversity Score (HDDS) to differentiate the relative importance of on-farm production and market purchases. Besides, gendered and inter-village differences in food consumption from different sources is analyzed. Furthermore, we estimated how many food groups were consumed from their own production and what proportion was purchased (Table 4).
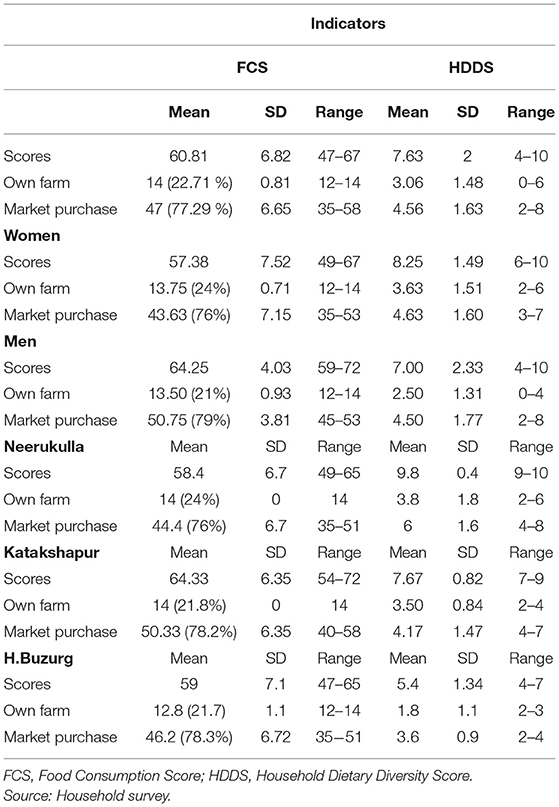
Table 4. Descriptive statistics for FCS and HDDS in rural Warangal district.
From Table 4, the mean FCS of the farm households in the study villages is 60.81, which indicates the households are food secure (FCS > 35). The contribution from own production to the total FCS is 22.71%, whereas market purchases contribute 77.29%. Similarly, the mean HDDS is 7.63, which means farm households consume diverse foods representing an average of 7.63 food groups (≥7 as high diversity score category) out of 12 food groups considered. The contribution from own production to the total HDDS is 3.06 (≤ 3 is considered low dietary diversity), whereas market purchases contributed an average of 4.56 food groups. The detailed analysis of FCS and HDDS (Supplementary Material 1) revealed that the farms mainly supplied cereals with an average FCS of 13.63. The average frequency of consumption of cereals per week is 6.81. Whereas market purchases supply pulses, fruits, vegetables, meat, fish, milk, sugar, and cooking oil. The individual FC scores ranged from 0.38 (fruits) to 24.50 (milk), and the weekly average frequency of consumption of individual food groups ranged from 0.40 (fruits) to 6.13 (milk). Though the frequency and FCS of milk is higher, the quantity of milk consumed is meager (only for mixing with tea and preparing curd to eat along with rice). This is one of the limitations of FCS calculation as it considers only the frequency of consumption of a specific food group and does not consider the quantity of food intake. The quantity of milk products consumed may not be adequate to supply the required nutrition to individuals. Further, there is gendered differences observed in FCS and HDDS, with “women's” mean FCS and HDDS being 57.38 and 8.25, respectively. Whereas “men's” FCS and HDDS is 64.25 and 7.0, respectively. The results clearly show there is gendered differences in dietary diversity. The gendered differences may be linked to sociocultural aspects of individuals. Similarly, inter-village differences with FC and HHD scores range from 47 to 67 with a standard deviation of 6.82 for FCS, and 4–10 food groups with a standard deviation of 2 for HDDS are observed. The wide variation is mainly attributed to the level of diverse foods and food groups available in the specific market from which specific village purchases. From Figure 3, it is clear that village market 3 has low diversity of foods available as compared to village markets 1 and 2, and from Table 4, it is evident that House Buzurg village, which buys foods from the village market 3 has food groups available ranging from 2 to 7, as compared to the other two villages with food groups ranging from 7 to 10. Conversely, the FC scores of House Buzurg village are distant with the other two villages. This is mainly because of the type of food it often purchases (milk, meat, and fish) from village market 3. Further, the detailed analysis of the determining factors for gendered differences in dietary diversity in food sources is scope for future study. Overall, the market purchases significantly contribute to the farm household dietary diversity than on-farm production. The literature confirms the results (Luckett et al., 2015; Qaim et al., 2016; Ludwig, 2018; Mulenga et al., 2021). Further, specific food groups consumed at farm households are assessed to understand the share of own farm and market sources in each food group. The results revealed that 93.75% of the cereals consumed at households are from their own production, whereas 93.75% of oils/fats and spices, and condiments are from local markets. Similarly, the contribution from each source contributing to the farm households' dietary diversity is shown in Figure 2. This clearly shows that currently, the market plays a vital role in the food security of households, as it supplies majority of food groups.
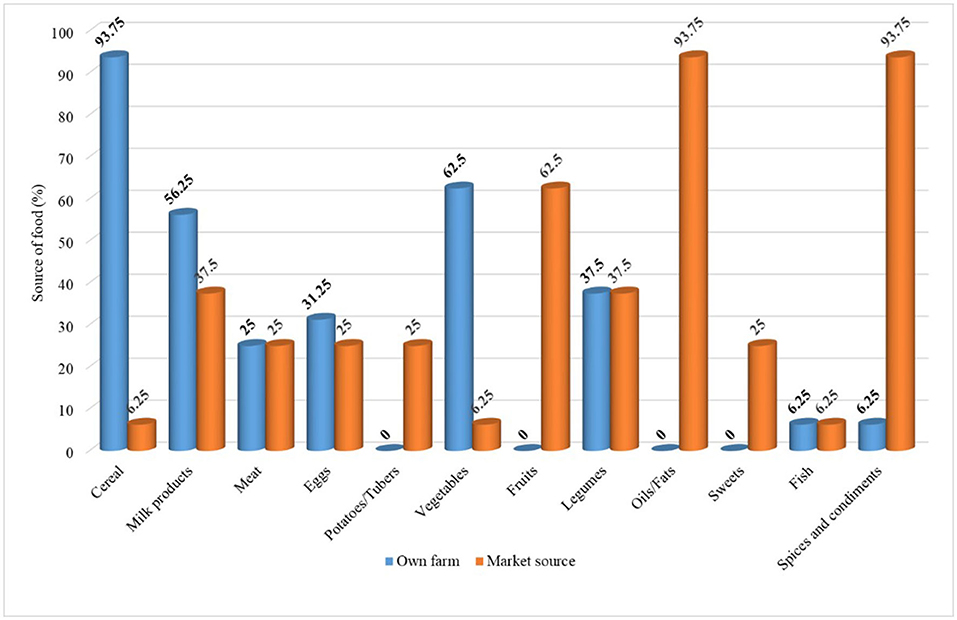
Figure 3. Consumption of each food group sourced from own farms and or local markets among farm households.
We used a new definition of Market Food Diversity (MFD) to characterize rural markets, which was recently used by Ambikapathi et al. (2019), to analyze the access of diverse foods to the farm households. In the literature, the most common indicator that is used for market access is distance to market, however, distance to market cannot guarantee the availability of diverse food in the market. This is a significant point, as it is plausible that the diversity of food available in the markets is a vital source for a diverse diet for households (in a similar way to the influence that farm production diversity has on dietary diversity). In our study villages, MFD from 7 to 10 food groups comprises 62–65 crop species during June–July 2020. This contrasts with average crop diversity (number of species) in the study villages which was only 10.50, and livestock diversity (species) which was 4.93. It is very clear that the diversity of food available in the market was much higher than own farm production. However, the limitation of the rural markets in the study villages is that the market takes place once a week and households therefore can source their food only once a week. This situation affects the purchase pattern of perishable foods as the majority of the farm households don't have refrigerators. Even the few farmers who have their own refrigerators are not able to use them due to frequent power supply interruptions and even during the summer season, the power supply is restricted to a few hours during the daytime. In conclusion, farm production contributes mainly to caloric intake by supplying mainly cereals (from paddy production), whereas local markets, including the village Kirana shops, supply diverse nutritious foods to the farm households (Supplementary Material 1).
Agricultural production, market access, availability of food, and consumption are all potentially highly amenable to seasonal influences, specifically in developing countries (Zanello et al., 2019). From Table 4, it is clear that a significant share of food is sourced from local markets by farm households during the time of our field survey. The diversity of food available in the local village markets was collected simultaneously as the household surveys in June and July, allowing seasonal comparison of the availability of diverse food in the local markets. From Figure 4, it is evident that local markets are variable in availability, diversity, and abundance of foods belonging to different food groups available in the local markets differ across the seasons, and it potentially affects the farm household's dietary diversity in the absence of own farm production. Further, of the three study villages' local markets surveyed, market 1 is the most diverse, and the village Neerukulla has access to it, while market 2 has intermediate diversity, seasonal fluctuations, and the village Katakshapur has access to it. Conversely, village market 3 (Figure 4) has low diversity and seasonal fluctuation, the House Buzurg village has access to it. The village markets 2 and 3 have intermediate to low diversity and seasonal fluctuations, and these two markets fail to supply a wide range of foods during the lean season, particularly pulses, dark green leafy vegetables, fruits, organ meat, flesh meat, fish, and fish milk products. Since the local crop production is significantly skewed toward staple (Rice, Maize) crops, there is no demand for such products in the local markets, and therefore, such products are not abundantly available in the markets. Our results are consistent with the literature, where we observed that seasonality and agro-ecological zone play a role in market food diversity in Ethiopia (Ambikapathi et al., 2019) and the importance of markets to dietary diversity in Afghanistan (Zanello et al., 2019). Similarly, in their study in Ethiopia, Sibhatu and Qaim (2017) observed that food sourced from markets has a larger contribution to farm households' dietary diversity than own production across the seasons.
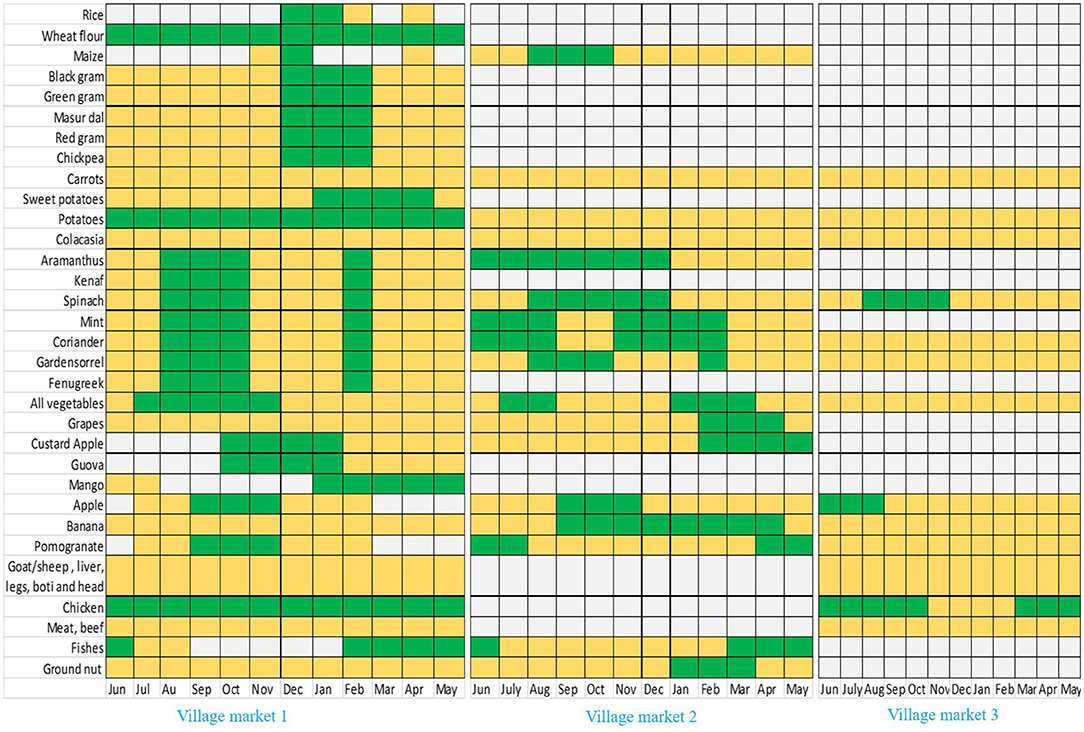
Figure 4. Seasonal food availability in the local village markets (three study villages). Green color indicates abundant availability of selected foods, yellow color indicates moderate availability, and blanks represents no availability in the specific market during specific months.
Figure 4 illustrates the availability of each of the 32 foods at the markets found in each village market across 12 months. Overall, Figure 3 shows poor access to pulses, fruits, vegetables, eggs, and meat in the local markets. Foods like dark leafy vegetables, potatoes, grapes, custard apple, meat, and fish show strong seasonality. The promotion of such products might improve consumption at farm household's level.
In addition to the seasonal availability of diverse foods, the frequency of market day occurrence in the study villages potentially affect the farm 'household's diet, as most of the local village markets happen once a week and buying and storing perishables such as fruits, vegetables, and milk products are difficult as most of the households lack storage facilities such a refrigerator.
Majority of the undernourished people live in rural Asia and Africa, and many of them are smallholder farm households that largely depend on agriculture for their livelihoods. A poor-quality diet is one of the vital contributing factors to undernutrition. This is particularly true in India. The rapid transformation of agricultural production systems from subsistence to commercial and market-oriented production augmented the effect due to declining farm production diversities. Generally, smallholder farmers consume a significant share of what they produce; increasing market-oriented production systems resulting in a decline in crop and livestock diversities, ultimately impacting household dietary diversity. Several recent studies consistently highlighted that farm production diversity directly influences the dietary diversity of farm households. Due to decreased on-farm production diversities, farm households rely on local markets (if accessible) to buy diverse food items from the increased income from the sale of crops produced through specialization. Our study intends to answer the relative importance of rural markets access (MFD) and farm production diversity in contributing to farm households' diet by estimating how much food consumed from a particular food group was purchased and what proportion was from own production in the context of a market-oriented production system. To uncover, whether the rural market food diversity and farm production diversity are complement or substitutes each other in contributing a farm household's dietary diversity. Besides, to examine the seasonality of foods available in the market that potentially affects the rural “household's” diet, if the foods availability varies with seasons.
The time-series data from 1966 to 2015 about crop diversity measured using Hirscman - Herfindahl Index (HHI) method indicates that the cropping system has significantly transformed from a subsistence to a market-oriented commercial production system. This transformation has brought a significant area under commercial and market-oriented production where only a few staple crops (paddy, maize) and commercial crops (Cotton and turmeric) are being grown compared to diverse cropping systems before. It is observed from the detailed analysis that some of the crops, particularly wheat, sorghum, pearl millet, finger millet, minor pulses, and oilseeds, have lost their place in the total crop area, and the area is being replaced with cash crops. As a result, the crop diversity has declined significantly from a highly diverse (HHI > 0.18) cropping system to a very less diversified (HHI < 0.1) cropping system over the years. The prevailing cropping system is supplying only starchy staples to the household diet. However, increased income from commercial crop production enabled households to buy diverse foods from the local markets which are not grown in their own farm. Foods purchased from markets representing diverse food groups and are supplementary to the foods produced on-farm. The increase in food group consumption from the local village markets compensates for the decline in food group consumption from own production. This clearly shows that the market currently plays a vital role in the households' food security, as it supplies a majority of food groups. The contribution from own production to the total FCS is nearly 23%, whereas market purchases contribute around 77%. The frequency of local village markets is an important constraint for regular access to diverse foods from the market as these village markets are periodical in nature and happen only once a week. Besides, the absence of storage (refrigerators) at farm households makes perishable food unavailable for consumption regularly. The food diversity and abundance of availability vary across the market and seasons in the study villages, potentially impacting the household's diet. The majority of the previous studies used market access as a proxy by actual reliance on markets for consumption at the village level. Our study shows that mere market access does not guarantee the availability of nutritious food in the specific market as market food diversity varies from market to market and season.
Here, our argument is not for or against the increase in on-farm diversity or market access (market food diversities), which directly influences household nutrition as both have pros and cons of their own (Nandi et al., 2021). However, how to improve dietary quality while maintaining crop diversity, increase in income through commercial crops, and access to diverse foods from local markets by bringing synergy through optimizing benefits from each to address the nutritional issues in a specific context. The effects of changes in on-farm production diversity and market access (market food diversity) differ for different food groups as each food group has its unique potential to contribute to diet quality. The effect of on-farm production may be more critical for some food groups, and market access may be for other food groups.
Based on our results, the following policy suggestions target farm households to improve nutrition in rural areas, specifically in the highly market-oriented/commercial production system.
• Particularly in the context where crop production is less diversified (HHI2 < 0.1), encouraging diverse crop production will help in better diet quality, manage price risk, and also help in harnessing the multi-functional nature of diversification. However, increasing crop diversification is easier said than done in the commercial production system where profit is at the center, but nuanced policies, including crop diversification compensation/incentive package for identified regions, might be necessary to support these multiple objectives.
• Local markets play a vital role in supplying diverse foods to the people. Therefore, there is a need for strengthening rural markets through developing infrastructure facilities (Ex. cold storage) to make it accessible for rural households to purchase diverse food across the seasons. It is to mention here that the promotion of local markets is not against the on-farm production diversity it is complementary to on-farm production diversity in improving the quality of farm household diets.
• Considering the unorganized retail sector and with the advent of new farm policies in India, the government may also think about incentives to retailers to set up retail outlets in the suburbs (mandals), connecting rural areas with mini supermarkets (like the hub and spoke model) and also subsidizing nutritious and/or biofortified foods in rural areas based on the context.
• In addition to the specific policy suggestions proposed based on the field study, a few additional policies are promising that are drawn based on the KII, context, and broader policies in the country. Many public, private, international developmental organizations, and civil societies working in agriculture, marketing, extension, nutrition, health, water, sanitation, and education are working independently without functional coordination among themselves at field level. Therefore, synergy is needed at different levels (policy, planning, and execution).
This study has a few limitations. First, the survey was not designed to understand the individual dietary habit but to look primarily at the household level, and foods share from both on-farm and market purchases at households. This makes the information less than ideal for analyzing the diet intake at an individual level. Furthermore, this is not ideal for assessing the consumption information, as there is one respondent in a household and is unlikely to recall all the household members during the last seven days. This may pose a problem if the respondent overstates or understates consumption for some family members.
Nevertheless, they have helpful information about the overall pattern of food consumption (food groups). Secondly, the use of FCS and HDDS to measure household nutrition is not without their limitations as neither of these indicators has been validated as a proxy for micronutrient adequacy. Thirdly, our results on on-farm diversity, market food diversity, and associated effects on a household's diet need to be considered cautiously as they are context-specific while generalizing the results.
The study identified research gaps for future research. First, further research exploring the preferences of households about what to produce on-farm desired purchases, and sell in a different context is needed as an entry point for improving household food choices among farm households. Second, results highlight that market purchases contribute more to household diet than own farm production. However, the literature is meager about how safe and hygienic foods are sourced from markets compared to their “farms” food. Also, buying foods from markets may be associated with unhealthy diets such as higher fat, additives/preservatives, more sugar, chemical residues etc. Therefore, health impact studies comparing subsistence and market-oriented farm households are warranted. Lastly, considering the remote setting of villages, how can private retail food companies be best incentivized to ensure diverse foods accessible in rural areas, as against prevailing only periodical markets and grocery shops in the villages.
The original contributions presented in the study are included in the article/Supplementary Materials, further inquiries can be directed to the corresponding author.
RN: conceptualization, methodology, validation, transcription, coding, formal analysis, investigation, data curation, and writing—original draft. SN: conceptualization, methodology, writing—review and editing, supervision, project administration, and funding acquisition. Both authors contributed to the article and approved the submitted version.
This work was undertaken as part of the CGIAR Research Program on Water, Land and Ecosystems (WLE) led by the International Water Management Institute (IWMI) and Grain Legumes and Dryland Cereals (GLDC) led by the International Crops Research Institute for the Semi-Arid Tropics (ICRISAT). Funding support for this study was provided by Global Challenge Research Fund (GCRF) under Funding Body Grant Ref: BB/P027970/1, Lead Party Ref: RG88282 as part of the Transforming India's Green Revolution by Research and Empowerment for Sustainable food Supplies (TIGR2ESS) project under Flagship 1 Sustainable and Transformative Agrarian and Rural Trajectories (START; https://tigr2ess.globalfood.cam.ac.uk/fps/FP1).
The authors declare that the research was conducted in the absence of any commercial or financial relationships that could be construed as a potential conflict of interest.
All claims expressed in this article are solely those of the authors and do not necessarily represent those of their affiliated organizations, or those of the publisher, the editors and the reviewers. Any product that may be evaluated in this article, or claim that may be made by its manufacturer, is not guaranteed or endorsed by the publisher.
The Supplementary Material for this article can be found online at: https://www.frontiersin.org/articles/10.3389/fsufs.2022.843697/full#supplementary-material
1. ^Manda is administrative unit, which is formed with group of villages.
2. ^The HHI is categorized into three-level, HHI Below.1 is less diversified, 1–0.18 is moderately diversified while HHI above 0.18 is highly diversified.
Ambikapathi, R., Gunaratna, N. S., Madzorera, I., Passarelli, S., Canavan, C. R., Noor, R. A., et al. (2019). Market food diversity mitigates the effect of environment on 'women's dietary diversity in the Agriculture to Nutrition (ATONU) study, Ethiopia. Public Health Nutr. 22, 2110–2119. doi: 10.1017/S136898001900051X
Brannen, J., Brannen, J., and Brannen, J. (2005). Mixed methods research: A discussion paper. University of London, London, United Kingdom.
Census (2011). Census. Available online at: http://agcensus.dacnet.nic.in/MessagePage.htm?aspxerrorpath=/DL/districtT1table1.aspx (accessed March 6, 2019).
Creswell, J. W. (1999). “Mixed-method research,” in Handbook of Educational Policy, ed G. J. Cizek (Amsterdam: Elsevier), 455–472. doi: 10.1016/B978-012174698-8/50045-X
Dillon, A., McGee, K., and Oseni, G. (2015). Agricultural production, dietary diversity and climate variability. J. Dev. Stud. 51, 976–995. doi: 10.1080/00220388.2015.1018902
Fanzo, J., Hunter, D., Borelli, T., and Mattei, F. (2013). Diversifying Food and Diets: Using Agricultural Biodiversity to Improve Nutrition and Health. London: Routledge. doi: 10.4324/9780203127261
Gupta, S., Sunder, N., and Pingali, P. L. (2020). Market access, production diversity, and diet diversity: evidence from India. Food Nutr. Bullet. 41, 167–185. doi: 10.1177/0379572120920061
Hirvonen, K., and Hoddinott, J. (2017). Agricultural production and 'children's diets: evidence from rural Ethiopia. Agri. Econ. 48, 469–480. doi: 10.1111/agec.12348
Hussein, F. M., Ahmed, A. Y., and Muhammed, O. S. (2018). Household food insecurity access scale and dietary diversity score as a proxy indicator of nutritional status among people living with HIV/AIDS, Bahir Dar, Ethiopia, 2017. PLoS ONE 13:e0199511. doi: 10.1371/journal.pone.0199511
Johnson, R. B., and Onwuegbuzie, A. J. (2004). Mixed methods research: a research paradigm whose time has come. Educ. Res. 33, 14–26. doi: 10.3102/0013189X033007014
Jones, A. D. (2016). On-farm crop species richness is associated with household diet diversity and quality in subsistence-and market-oriented farming households in Malawi. J. Nutr. 147, 86–96. doi: 10.3945/jn.116.235879
Jones, A. D., Shrinivas, A., and Bezner-Kerr, R. (2014). Farm production diversity is associated with greater household dietary diversity in Malawi: findings from nationally representative data. Food Pol. 46, 1–12. doi: 10.1016/j.foodpol.2014.02.001
Kennedy, G., Ballard, T., and Dop, M. C. (2011). Guidelines for Measuring Household and Individual Dietary Diversity. Rome: Food and Agriculture Organization of the United Nations.
Kennedy, G., Berardo, A., Papavero, C., Horjus, P., Ballard, T., Dop, M., et al. (2010). Proxy measures of household food consumption for food security assessment and surveillance: comparison of the household dietary diversity and food consumption scores. Public Health Nutr. 13, 2010–2018. doi: 10.1017/S136898001000145X
Koppmair, S., Kassie, M., and Qaim, M. (2017). Farm production, market access and dietary diversity in Malawi. Public Health Nutr. 20, 325–335. doi: 10.1017/S1368980016002135
Kumar, D., Bassi, N., and Ganguly, A. (2016 August 20). Rejuvenating Tanks in Telangana. Economic and Political Weekly. p. 30–34.
Lenjiso, B. M., Smits, J. P. J. M., and Ruben, R. (2016). Smallholder Milk Market Participation, Dietary Diversity and Nutritional Status Among Young Children in Ethiopia, 147. Available online at: https://repository.ubn.ru.nl/handle/2066/157095 (accessed November 23, 2021).
Luckett, B. G., DeClerck, F. A., Fanzo, J., Mundorf, A. R., and Rose, D. (2015). Application of the nutrition functional diversity indicator to assess food system contributions to dietary diversity and sustainable diets of Malawian households. Public Health Nutr. 18, 2479–2487. doi: 10.1017/S136898001500169X
Ludwig, T. (2018). An Egg for an Egg and a Bean for a Bean? How Production Diversity Determines Dietary Diversity of Smallholder Farmers in Rural India. How Production Diversity Determines Dietary Diversity of Smallholder Farmers in Rural India (January 4, 2018). ZEF-Discussion Papers on Development Policy, 247. doi: 10.2139/ssrn.3098283
Morse, J. M. (2016). Mixed Method Design: Principles and Procedures—Janice M Morse—Google Books. London: Routledge. doi: 10.4324/9781315424538
Mulenga, B. P., Ngoma, H., and Nkonde, C. (2021). Produce to eat or sell: panel data structural equation modeling of market participation and food dietary diversity in Zambia. Food Policy 2021:102035. doi: 10.1016/j.foodpol.2021.102035
Muller, C. (2009). Do agricultural outputs of partly autarkic peasants affect their health and nutrition? Evidence from Rwanda. Food Pol. 34, 166–175. doi: 10.1016/j.foodpol.2008.10.010
Nandi, R., Nedumaran, S., and Ravula, P. (2021). The interplay between food market access and farm household dietary diversity in low and middle income countries: a systematic review of literature. Glob. Food Secur. 28:100484. doi: 10.1016/j.gfs.2020.100484
Pellegrini, L., and Tasciotti, L. (2014). Crop diversification, dietary diversity and agricultural income: empirical evidence from eight developing countries. Can. J. Dev. Stud. 35, 211–227. doi: 10.1080/02255189.2014.898580
Pinstrup-Andersen, P. (2007). Agricultural research and policy for better health and nutrition in developing countries: a food systems approach. Agri. Econ. 37, 187–198. doi: 10.1111/j.1574-0862.2007.00244.x
Powell, B., Thilsted, S. H., Ickowitz, A., Termote, C., Sunderland, T., and Herforth, A. (2015). Improving diets with wild and cultivated biodiversity from across the landscape. Food Secur. 7, 535–554. doi: 10.1007/s12571-015-0466-5
Qaim, M., Kibrom, T., and Krishna, V. V. (2016). Market access and farm household dietary diversity. Rural. 21, 12–14. Available online at: https://www.rural21.com/fileadmin/downloads/2016/en-01/rural2016_01-S12-14.pdf
Satyam, A. R. (2018), “Reflections from a periodic market in rural india,” in Bottom of the Pyramid Marketing: Making, Shaping and Developing BoP Markets, ed R. Singh (Bingley: Emerald Publishing Limited), 135–147.
Sekabira, H., and Nalunga, S. (2020). Farm production diversity: is it important for dietary diversity? Panel data evidence from Uganda. Sustainability 12:31028. doi: 10.3390/su12031028
Sharma, P. K. (2017). Pattern of crop concentration and crop diversification-an economic analysis. Maharashtra. J. Agril. Econom. 20, 128–132.
Sibhatu, K. T., Krishna, V. V., and Qaim, M. (2015). Production diversity and dietary diversity in smallholder farm households. Proc. Natl. Acad. Sci. U. S. A. 112, 10657–10662. doi: 10.1073/pnas.1510982112
Sibhatu, K. T., and Qaim, M. (2017). Rural food security, subsistence agriculture, and seasonality. PLoS ONE 12:e0186406. doi: 10.1371/journal.pone.0186406
Sibhatu, K. T., and Qaim, M. (2018). Review: meta-analysis of the association between production diversity, diets, and nutrition in smallholder farm households. Food Policy 77, 1–18. doi: 10.1016/j.foodpol.2018.04.013
Snapp, S. S., and Fisher, M. (2015). “Filling the maize basket” supports crop diversity and quality of household diet in Malawi. Food Secur. 7, 83–96. doi: 10.1007/s12571-014-0410-0
Swindale, A., and Bilinsky, P. (2006). Household Dietary Diversity Score (HDDS) for Measurement of Household Food Access: Indicator Guide (Version 2).
Vanessa Cordero-Ahiman, O., Santellano-Estrada, E., and Garrido, A. (2017). Dietary diversity in rural households: the case of indigenous communities in Sierra Tarahumara, Mexico. J. Food Nutr. Res. 5, 86–94. doi: 10.12691/jfnr-5-2-3
Velayudhan, S. K. (2016). Relevance of Rural Periodic Markets: A Review (No. 199; Working Papers). Indian Institute of Management Kozhikode. Available online at: https://ideas.repec.org/p/iik/wpaper/199.html (accessed November 23, 2021).
Verger, E. O., Ballard, T. J., Dop, M. C., and Martin-Prevel, Y. (2019). Systematic review of use and interpretation of dietary diversity indicators in nutrition-sensitive agriculture literature. Glob. Food Secur. 20, 156–169. doi: 10.1016/j.gfs.2019.02.004
Webb, P. (2014). Nutrition and the Post-2015 Sustainable Development Goals: A Technical Note. United Nations Systems, Bonn, Germany.
Wiesmann, D., Bassett, L., Benson, T., and Hoddinott, J. (2009). Validation of the World Food 'Programme's Food Consumption Score and Alternative Indicators of Household Food Security. Washington, DC: International Food Policy Research Institute (No. 00870).
World Food Program. (2008). Technical Guidance Sheet. Food Consumption Analysis. Calculation and Use of the Food Consumption Score in Food Consumption and Food Security Analysis. Rome: FAO.
Keywords: market food diversity, dietary diversity, India, seasonality, food systems
Citation: Nandi R and Nedumaran S (2022) Rural Market Food Diversity and Farm Production Diversity: Do They Complement or Substitute Each Other in Contributing to a Farm Household's Dietary Diversity? Front. Sustain. Food Syst. 6:843697. doi: 10.3389/fsufs.2022.843697
Received: 26 December 2021; Accepted: 22 April 2022;
Published: 14 June 2022.
Edited by:
Alexandru Rusu, Biozoon Food Innovations GmbH, GermanyReviewed by:
Margaret Pasquini, Colombian Corporation for Agricultural Research (AGROSAVIA), ColombiaCopyright © 2022 Nandi and Nedumaran. This is an open-access article distributed under the terms of the Creative Commons Attribution License (CC BY). The use, distribution or reproduction in other forums is permitted, provided the original author(s) and the copyright owner(s) are credited and that the original publication in this journal is cited, in accordance with accepted academic practice. No use, distribution or reproduction is permitted which does not comply with these terms.
*Correspondence: Ravi Nandi, bmFuZGk5OTlodUBnbWFpbC5jb20=
Disclaimer: All claims expressed in this article are solely those of the authors and do not necessarily represent those of their affiliated organizations, or those of the publisher, the editors and the reviewers. Any product that may be evaluated in this article or claim that may be made by its manufacturer is not guaranteed or endorsed by the publisher.
Research integrity at Frontiers
Learn more about the work of our research integrity team to safeguard the quality of each article we publish.