
95% of researchers rate our articles as excellent or good
Learn more about the work of our research integrity team to safeguard the quality of each article we publish.
Find out more
ORIGINAL RESEARCH article
Front. Sustain. Food Syst. , 21 June 2022
Sec. Crop Biology and Sustainability
Volume 6 - 2022 | https://doi.org/10.3389/fsufs.2022.824929
This article is part of the Research Topic Coffee: From the Field to the Cup View all 14 articles
 Beatriz Ripper1Maysa Silva Barreto2
 Fabio Junior Moreira Novaes3,4
 Mateus Gomes de Godoy5
 Denise Maria Guimarães Freire2Claudia Moraes de Rezende4Juliana Cortes Nunes6
 Daniel Perrone1*
Exotic coffees may be defined as extravagant and unique coffees, primarily due to their production mode, including unusual bioprocessing or fermentation conditions associated with superior sensorial characteristics. The aim of the present study was to investigate the influence of bioprocessing and of growing conditions on flavor precursors of Jacu and Kopi Luwak exotic green coffees, respectively. Moreover, this is the first study to perform a detailed chemical analysis of these exotic coffees. Thirteen green Coffea arabica bean samples were obtained, five from Espírito Santo state, Brazil, and eight Kopi Luwak from different regions of Indonesia. Samples were analyzed regarding their proximate composition, chlorogenic acids (CGA), sucrose, alkaloids, triacylglycerols (TAG), diacylglycerols, free fatty acids, sterols, diterpenes and tocopherols. Scanning electron micrography confirmed bioprocessing of Jacu and Kopi Luwak coffee samples. Bioprocessing by the Jacu bird caused reductions of 69 and 28% in caffeine and CGA contents, respectively. The TAG profile of Jacu coffee was modified. TAG containing two saturated fatty acids were preferably hydrolyzed in detriment to those containing two unsaturated fatty acids. Other coffee components were not affected by the bird's digestion of the beans. Kopi Luwak coffee samples had a chemical composition in accordance with reported ranges for non-bioprocessed green C. arabica samples, except for caffeine (0.48 g/100 g) and CGA (5.09 g/100 g), which were found in low amounts. Crop year rather than location or post-harvest processing discriminated Kopi Luwak coffee samples, suggesting that weather conditions would be the most crucial aspect for their chemical composition, especially in terms of total lipids, ashes, total CGA, sucrose and proteins.
Exotic coffees may be defined as extravagant and unique coffees, primarily due to their production mode, including unusual bioprocessing or fermentation conditions which leads to peculiar and superior sensorial characteristics (Lee et al., 2015). Kopi Luwak is the most commercialized and well-known exotic coffee. For its production, beans cultivated in Indonesia are ingested by the Asian palm civet (Paradoxurus hermaphroditus), being digested in their gastrointestinal tract and excreted in their feces (Marcone, 2004; Lee et al., 2015; Ellis et al., 2016; Jumhawan et al., 2016; Arboleda, 2018; Hadipernata and Nugraha, 2018; Burns and Walker, 2019; Muzaifa et al., 2019; Tawali and Laga, 2019). Then, beans are cleaned and undergo the usual steps of either dry or wet post-harvest processing and roasting. Another bioprocessed exotic coffee is Jacu coffee, produced in Brazil and whose beans are ingested and excreted by the Jacu bird (Penelope superciliares), following dry post-harvest processing and roasting (Conti et al., 2013; Malacarne et al., 2017).
Exotic coffees have high selling prices (from USD 340 to USD 2,400 per kilogram), up to 100 times higher than the average, a direct consequence of its rarity and exclusiveness, but also to its complex production, which hypothetically adds a distinct and appreciated flavor to the product. The idea is that the animals select the ripest coffee cherries, which contain flavor precursors—caffeine, trigonelline, sugars, lipids, proteins, and chlorogenic acids (CGA)—that may be modified due to digestive conditions, including acid and neutral pH media (ranging from 2.7 to 6.4 for the Jacu bird and from 2.5 to 7.6 for the civet mammal), hydrolytic enzymes and microbiota, potentially impacting the volatile compounds produced during roasting (Lee et al., 2015; Ongo et al., 2015). According to Marcone (2004), bioprocessing associated with the digestion by the Asian palm civet attributes a unique flavor to Kopi Luwak coffee beans, described as earthy, musty, syrupy, smooth, and rich with both jungle and chocolate undertones.
Although some studies in the literature deal with the composition of exotic coffees, usually the approach is fragmented since limited classes of compounds are generally investigated. One of the first papers dealing with exotic coffees was published by Marcone (2004), which determined the proximate and microbiological composition of exotic civet coffees (Kopi Luwak, Nekemte Civet, and Abdela Civet), as well as of their controls (non-bioprocessed beans). Results suggested that during bioprocessing proteolytic enzymes penetrate the beans and caused proteolysis, impacting on coffee flavor. Conti et al. (2013) compared the contents of moisture, ash, protein, lipid, carbohydrate, total phenolic, 5-caffeoylquinic acid (the main CGA present in coffee), trigonelline, nicotinic acid and caffeine from roasted exotic (Kopi Luwak and Jacu), special (Gourmet and Premium) and traditional coffees. Cheong et al. (2013) analyzed the volatile composition of Asian coffees from different locations, including Kopi Luwak coffee, as well as studied the phenolic composition, sensory analysis and antioxidant activity. More recently, Ongo et al. (2015) applied the eletronic nose technique to geographically distinguish samples of Kopi Luwak coffee from different regions of the Philippines. It should be highlighted that there are only two studies dealing with the effect of Kopi Luwak coffee bioprocessing on the composition of flavor precursors (Marcone, 2004; Muzaifa and Hasni, 2016), and no investigation is available concerning the effect of Jacu coffee bioprocessing. The impact of growing conditions on the coffee flavor precursors has also been poorly studied, with only one study describing the effect of geographic origin on the non-volatile composition of Asian coffees, among them Kopi Luwak (Cheong et al., 2013).
Most studies, however, pay little attention to the lipid profile, which may significantly impact the flavor of exotic coffees (Muzaifa et al., 2019). This class has been related to coffee body, creaminess, and foam formation. Other flavor precursors such as caffeine, trigonelline and chlorogenic acids have also been related to coffee aroma (Cheng et al., 2016). Caffeine seems to provide strength, body and bitterness to coffee beverage, while trigonelline is associated to the overall aromatic perception and bitterness. Finally, chlorogenic acids attribute acidity, astringency and bitterness to coffee beverage.
In this context, in addition to determining proximate composition, alkaloids, sugars, and CGA, the profile of lipids was comprehensively analyzed, aiming to investigate the influence of bioprocessing and of growing conditions on these flavor precursors of Jacu and Kopi Luwak exotic green coffees, respectively.
Zinc acetate and potassium hexacyanoferrate (II) were acquired from Merck (Darmstadt, Germany). Analytical standards of trigonelline (98.5%), caffeine (99.0%), sucrose (99.5%), and 5-caffeoylquinic acid (5-CQA) (95.0%) were purchased from Sigma-Aldrich (St. Louis, MO, USA). Analytical standards of fatty acids were purchased from Supelco (Bellefonte, PA, USA; all 99% purity). Analytical standards of sterols (campesterol, 65%; β-sitosterol, 40%; stigmasterol, 95%) and triacylglycerols (1,2,3-triheptadecanoylglycerol and 1,2-distearoyl-3-palmitoyl-rac-glycerol, ~99%) were purchased from Sigma–Aldrich (St. Louis, MO, USA). Coffee diterpenes were isolated and purified (purity > 97%) from Brazilian green Arabica coffee as described in previous work (Novaes et al., 2020). HPLC solvents were purchased from Tedia (Fairfield, OH, USA). HPLC grade water (Milli-Q system, Millipore, Bedford, MA, USA) was used throughout the experiments.
Five organic green Coffea arabica samples were obtained from Camocim Organic Farm, located at Domingos Martins, Espírito Santo state, Brazil (20°23'40.39”S, 41° 1'37.31”W) (Figure 1B). Two of these samples were bioprocessed by the Jacu bird (Jacu coffee), while the other three were not bioprocessed (non-Jacu coffee). Two samples were harvested in 2016: one Jacu coffee (dry-processed, dp) and one non-Jacu coffee (wet-processed, wp). Another three samples were harvested in 2017: one Jacu coffee (dp) and two non-Jacu coffees (dp and wp).
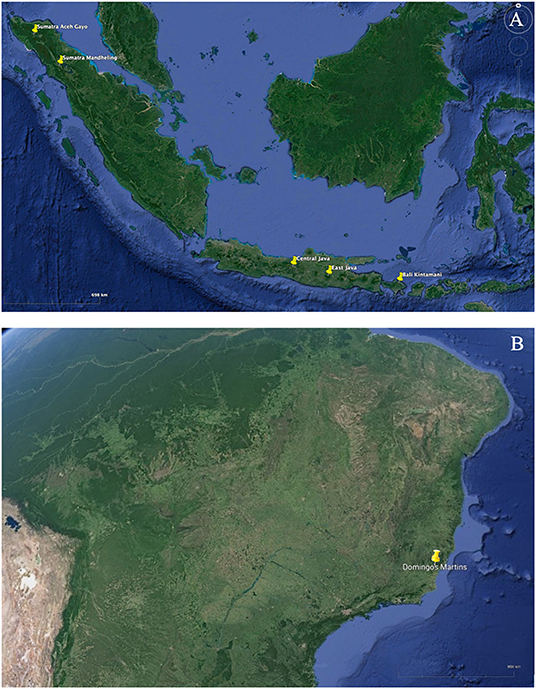
Figure 1. Regions of Indonesia (A) and Brazil (B) from where Kopi Luwak and Jacu samples were obtained, respectively.
Eight non-organic Kopi Luwak green C. arabica samples of good quality (no coffee defects) from different regions of Indonesia (East Java, Central Java, Sumatra Aceh Gayo, Bali Kintamani, and Sumatra Mandheling) (Figure 1A) were purchased from Kora Coffee Import Company. Four samples were harvested in 2015 (East Java, Sumatra Aceh Gayo, Bali Kintamani and Sumatra Mandheling) and the other four in 2017 (Central Java, Sumatra Aceh Gayo, Bali Kintamani and Sumatra Mandheling). Sumatra Aceh Gayo and Sumatra Mandheling samples were dry-processed (dp), while Bali Kintamani, East Java, and Central Java samples were wet-processed (wp).
The harvest region, crop, post-harvest processing, and production mode of all green coffee samples investigated in the present study are described in Table 1. All samples were stored at −20°C until analyses.
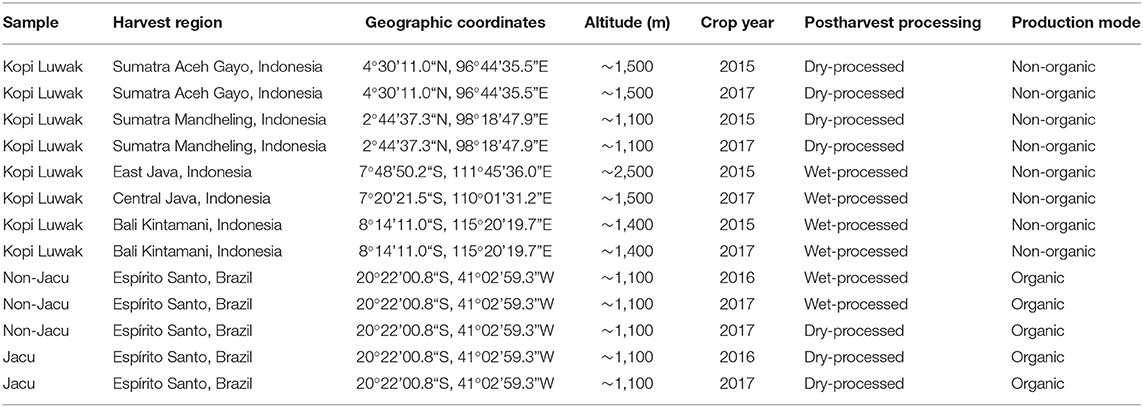
Table 1. Harvest region, greographic coordinates, altitude, crop year, postharvest processing, and production mode of the green coffee samples investigated in the present study.
To confirm that Kopi Luwak and Jacu coffee samples were bioprocessed, beans were analyzed by Scanning Electron Microscopy (SEM) under conditions similar to that described by Marcone (2004). Beans were fixed at an aluminum apparatus with a double-sided carbon tape and coated in silver on an SCD005 Sputter Coater metallizer (BAL-TEC, Germany) under ultrapure argon for 250 s. Following coating, beans were viewed under a TM 3030 Plus scanning electron microscope (Hitachi, Japan) with a high voltage setting of 15 kV and magnification of 100 times. Prior to analyses, each sample was frozen in liquid nitrogen and ground to pass through a 0.46 mm sieve.
Moisture, protein, lipid, dietary fiber, and ash contents of ground green coffee beans were determined in triplicate, according to official methods (AOAC, 2000). Carbohydrate content was estimated by difference.
CGA extraction was performed according to Trugo and Macrae (1984) in triplicate. An aliquot of 0.2 g of ground green coffee was added to 100 mL of boiling water and shaken at 300 rpm for 15 min in a water bath at 100°C. The mixture was centrifuged for 10 min at 1,500 g, and the supernatant was filtered through a filter paper (Whatman n° 1). The extract was clarified by adding Carrez's solutions, 0.3 M K2Fe(CN)6 and 1.0 M Zn (OAc)2, and the final volume was made up with water to 100 mL. After 15 min, the colloidal suspension was filtered through a filter paper (Whatman n° 1) and kept at −20°C until LC-DAD analysis.
Chromatographic analysis was performed according to Perrone et al. (2008a). The LC system (Shimadzu, Kyoto, Japan) was comprised of a LC-10ADvp quaternary pump, a CTO- 10ASvp column oven, an 8,125 manual injector (Rheodyne), with a 5 μL loop and a SPD M10Avp diode array detector (DAD) recording from 190 nm to 370 nm. The chromatographic separation was achieved by a C30 reverse-phase column (150 × 2.0 mm, 5 μm, Michrom BioResources, Auburn, WA, USA) maintained at 40°C. The mobile phase used was a gradient between 0.3% aqueous formic acid (eluent A) and methanol (eluent B) at a flow rate of 0.2 mL/min. Before injection, the column was equilibrated with 17% B for 10 min. Immediately after injection, this proportion was changed to 60% in 14 min until the end of the run in 35 min. CGA were quantified by external standardization (absorbance at 325 nm) using 5-CQA standard, corrected with each molar extinction coefficient. The method was previously validated by Farah et al. (2005). The calibration curve ranged from 0.1 to 20 ppm and its coefficient of determination (R2) was 0.9993. The method is similar to that previously validated by Badmos et al. (2019).
Sucrose extraction was performed according to Perrone et al. (2008b) in triplicate. An aliquot of 0.2 g of ground green coffee was added to 60 mL of boiling water and shaken at 300 rpm for 15 min at room temperature. The mixture was filtered through a filter paper (Whatman no. 1). The extract was clarified by adding 2 mL of aqueous basic lead acetate (20%), and the final volume was made up with water to 100 mL. After 15 min, the colloidal suspension was filtered through a filter paper (Whatman n° 1) and kept at −20°C until HPLC-Evaporative Light Scattering detection (ELSD) analysis.
Chromatographic analysis was performed according to Kimball et al. (2004). The LC system (Shimadzu, Kyoto, Japan) was comprised of a LC-20AT quaternary pump, a 7725i manual injector (Rheodyne), with a 20 μL loop and a L20314500010 Evaporative Light Scattering Detector (ELSD), set at 40°C, gain of 4 and nitrogen flow pressure of 350 kPa. The chromatographic separation was achieved by a C18 reverse-phase column (Zorbax NH2, 250 × 4.6 mm, 5 μm, Agilent Technologies, Palo Alto, CA, USA). An isocratic elution during 10 min with acetonitrile and water (80:20) at a flow rate of 1.0 mL/min was used. Sucrose was quantified by external standardization using the commercial standard. The calibration curve ranged from 10 to 400 ppm and its coefficient of determination (R2) was 0.9991. The method was previously validated by Perrone et al. (2008b).
The extraction of alkaloids was performed according to Perrone et al. (2008b), in triplicate. Chromatographic analysis was performed according to Alves et al. (2006). The LC system (Shimadzu, Kyoto, Japan) was the same as reported in item 2.5. The chromatographic separation was achieved with a C30 column (150 × 2.0 mm, 5 μm, Michrom BioResources, Auburn, USA) maintained at room temperature. The mobile phase used was a gradient among 0.3% aqueous formic acid (eluent A), methanol (eluent B), and acetonitrile (eluent C) with a flow rate of 0.7 mL/min. Before injection, the column was equilibrated with 95% A, 0% B, and 5% C during 40 min. Immediately after injection, this proportion was changed to 93% A, 0% B, and 7% C during 8 min and 87% A, 13% B, and 0% C until the end of the run in 10 min. Alkaloids were quantified by external standardization (absorbances at 260 nm and 272 nm for trigonelline and caffeine, respectively) using the commercial standards. The calibration curves for caffeine and trigonelline ranged from 0.5 to 20 ppm and their coefficients of determination (R2) were 0.9992 and 0.9999, respectively. The method was previously validated by Perrone et al. (2008b).
The following lipid classes were analyzed according to the method described by Novaes et al. (2018), with slight modifications: triacylglycerols (TAG), diacylglycerols (DAG), free fatty acids (FFA), sterols, diterpenes, and tocopherols. Extraction of lipids was performed in triplicate by adding an aliquot of 0.5 g of ground green coffee to 2 mL of hexane. The mixture was shaken by a magnetic bar at room temperature for 30 min. The suspension was filtered through a 0.22 μm cellulose ester membrane (Millipore, Brazil) and kept at −20°C until the GC-MS analysis.
The GC system (GC 6890, AgilentTechnologies, Palo Alto, CA, USA) comprised an automatic injector (7683) and a mass spectrometer (5975C). The chromatographic separation was achieved by a DB-17HT capillary column (50% phenyl and 50% methylsiloxane, 15 m × 0.25 mm i.d. × 0.15 μm, J&W Scientific, Agilent Technologies, Palo Alto, CA, USA). Helium was used as a carrier gas at a flow rate of 2 mL/min. The split ratio was 1:50, the injector was heated to 330°C, and a pressure pulse of 25 psi was applied during the initial 15 s. The oven temperature was raised from 50°C (0.25 min) to 380°C (10 min), at a heating rate of 15°C/ min. Mass spectrometer conditions were: ion source temperature at 230°C, quadrupole at 200°C, acceleration voltage of 200 eV, transfer line at 380°C, and ionization voltage of 70 eV. Mass spectra were obtained in scan mode (50–800 Da). Lipids were identified by comparison with NIST/EPA/NIH Mass Spectral Library databases (2014 version) and values ≥ 70% were accepted. When library spectra were not available, the identification was performed by mass spectral interpretation and comparison with profiles described in the literature from authentic standards, according to our previous works (Novaes et al., 2015, 2018, 2020). In order to quantify lipids, the same extracts were also analyzed in an Agilent 6850 GC instrument (Santa Clara, CA) equipped with a flame ionization detector (GC-FID), using the same chromatographic conditions described above, except for the carrier gas, which was hydrogen at a flow rate of 2 mL/min. FID was kept at 400°C. Lipids values obtained were normalized based on the total group peak areas according to Novaes et al. (2018). The method was previously validated by our group and its performance parameters were reported by Novaes et al. (2015).
Kopi Luwak coffee samples were subjected to principal component analysis (PCA) to investigate similarities among samples and possible associations of variables. PCA was performed using all individual non-volatile compounds, as well as using compounds grouped according to their chemical class (i.e., DAG, TAG, FFA, diterpenes, CGA, sterols). PCA analysis was performed by PAST for Windows (version 2.17c). Differences were considered significant when p < 0.05.
Non-Jacu (wp) coffee beans showed fewer surface irregularities than non-Jacu (dp) coffee beans (Figures 2A,B). This characteristic may be related to damage of coffee beans cell membranes during the drying process (Borém et al., 2014), which may also cause minerals to leach, possibly leading to the lower ashes contents of non-Jacu (dp) (1.9 g/100 g) in comparison to non-Jacu (wp) (2.7 g/100 g) (Table 2).
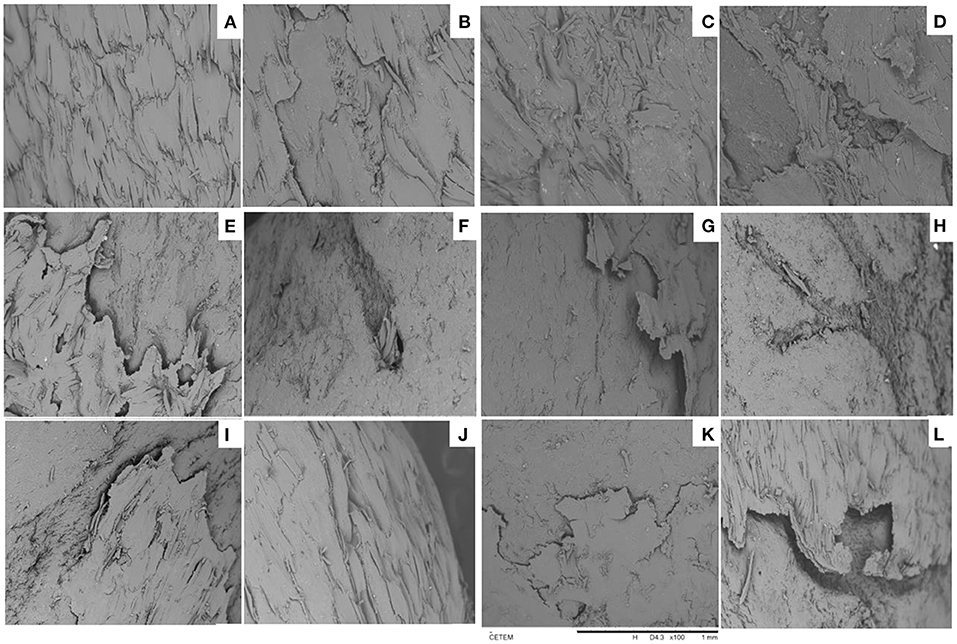
Figure 2. Typical scanning electron micrographs of non-Jacu wet-processed crops 2016 and 2017 (A), Non-Jacu dry-processed crop 2017 (B), Jacu dry-processed crop 2016 (C), Jacu dry-processed crop 2017 (D), Sumatra Aceh Gayo dry-processed crop 2015 (E), Sumatra Aceh Gayo dry-processed crop 2017 (F), Sumatra Mandheling dry-processed crop 2015 (G), Sumatra Mandheling dry-processed crop 2017 (H), East Java wet-processed crop 2015 (I), Central Java wet-processed crop 2017 (J), Bali Kintamani wet-processed crop 2015 (K), and Bali Kintamani wet-processed crop 2017 (L) coffee samples.
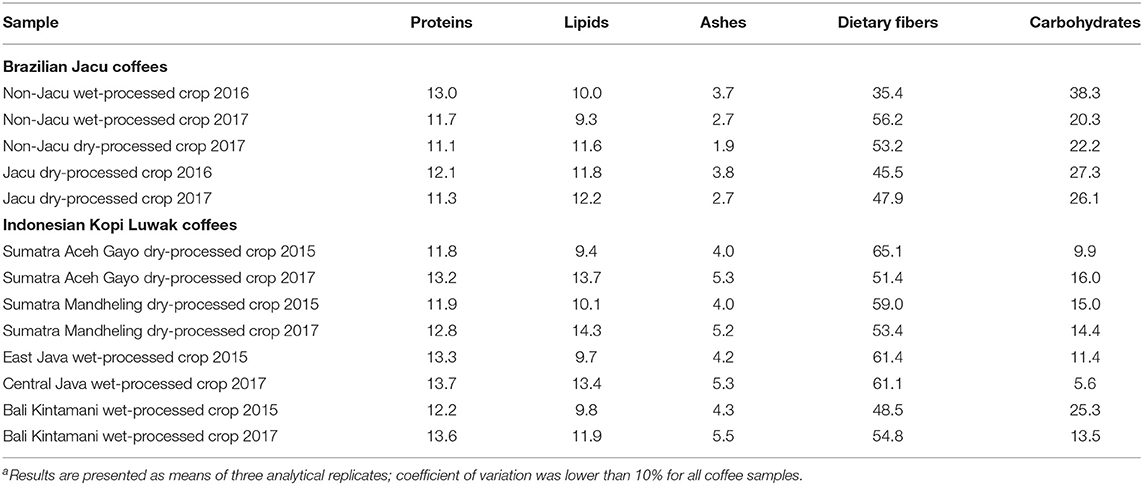
Table 2. Proximate composition (g/100 g dry weight) of non-Jacu, Jacu and Kopi Luwak coffee samplesa.
All Jacu and Kopi Luwak coffee beans showed exfoliations on their surfaces (Figures 2C–L), similar to those observed by Marcone (2004) for different types of civet bioprocessed coffees. According to the author, these exfoliations are a consequence of the peristaltic movements of the animal's gastrointestinal tract during coffee digestion. Moreover, the acidic gastric juice and proteolytic digestive enzymes penetrate the coffee cherry endocarp leading to micro-pittings (Marcone, 2004). As a whole, micrographic results confirmed that Jacu and Kopi Luwak green coffee beans were bioprocessed.
The main limitation of our study is the small number of samples analyzed, which is a consequence of the difficulty in obtaining coffee bioprocessed samples from reliable producers. Because of this, we did not had control over parameters such as post-harvesting processing and crop year and, consequently, could not perform statistical analyses to compare them. In that way, this study should be considered as a case study, but despite its limitations, it should be of interest for those working with coffee quality, especially bioprocessed samples, for which chemical composition data is scarce or inexistent.
The proximate composition of both Jacu coffee samples was according to the range reported in the literature for these components in non-bioprocessed C. arabica coffees (Clarke and Macrae, 1985). Bioprocessing by Jacu bird did not affect proteins, lipids, ashes, and dietary fibers contents of coffee beans (Table 2). Marcone (2004) and Mahendradatta et al. (2012) reported a decrease in protein contents of civet coffee, associated with both proteolysis and leaching during bioprocessing. However, mammals such as the civet “cat” present a larger gut size (greater total surface area and thus absorptive capacity), longer digesta retention time (Whorter et al., 2009), and higher pepsin activity in gastric juice (Reece et al., 2011) when compared to birds, which may explain our results in comparison to those previously reported for civet coffee. To compensate, birds seem to present a higher passive (paracellular) nutrient absorption than mammals (Whorter et al., 2009). Ashes and dietary fibers contents of our Brazilian (Espírito Santo) coffees from the 2016 and 2017 crops showed differences. Considering that these samples were from the same cultivars and harvested in the same farm, these differences are probably explained by the climate conditions in these years during coffee growth. According to the meteorology coordination of Espírito Santo state, Brazil (Incaper, 2022), the region where coffee samples were grown had higher minimum and maximum temperatures in 2016 than in 2017.
Caffeine contents in non-Jacu (both dp and wp) coffee samples were in accordance with the reported range for C. arabica non-bioprocessed coffees (0.6–1.8 g/100 g) (Cheng et al., 2016). Jacu coffees presented similar contents to that reported by Nishiguchi et al. (2017) for a civet sample (0.36 g/100 g). Bioprocessing caused a trend of reducing caffeine contents by about 69%, as observed by comparing non-Jacu (1.12 g/100 g, on average) and Jacu (0.34 g/100 g, on average) coffee samples (Table 3). There is some evidence in the literature that bioprocessed coffees show lower contents of caffeine than non-bioprocessed ones (Mahendradatta et al., 2012; Conti et al., 2013; Nishiguchi et al., 2017; Ifmalinda et al., 2019). Recently, Febrina et al. (2021) reported that civet coffee samples had lower caffeine contents (determined by NMR) than regular coffee. This work, however, is the first to analyze samples of bioprocessed and non-bioprocessed coffees from the same farmer (same harvest location and cultivar), which strengthens the relevance of this finding. Since caffeine is recognized as toxic for avians (Lightfoot and Yeager, 2008), it was probably not absorbed in the digestive tract of the Jacu bird. Baumann et al. (1995) reported that under simulated gastric conditions, caffeine was not released from guaraná (Paullinia cupana) seeds. Nevertheless, some authors suggest that caffeine could be fermented by gut microbiota (Mahendradatta et al., 2012; Ifmalinda et al., 2019), and many studies indicate that Pseudomonas spp. isolated from soil samples are able to metabolize caffeine (Mazzafera, 2002). These bacteria may also be found in the microbiota of birds, along with Bacteroides, Clostridium, Lactobacillus, Streptococcus, and Campylobacter (Hird et al., 2015), possibly explaining our results. The low caffeine content in Jacu coffee may impact its flavor, reducing its perceived strength, body, and bitterness (Clarke and Macrae, 1988; Cheng et al., 2016).
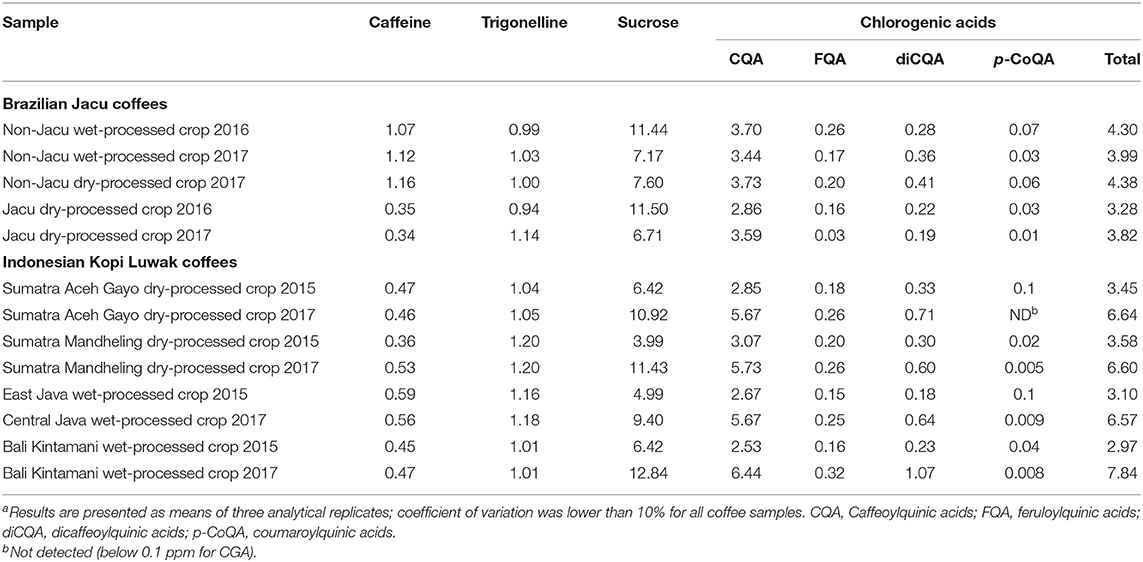
Table 3. Caffeine, trigonelline, sucrose and chlorogenic acids contents (g/100 g dry weight) in non-Jacu, Jacu and Kopi Luwak coffee samplesa.
Trigonelline contents were similar between non-Jacu and Jacu coffee samples and in accordance with the range reported for C. arabica (0.3–1.3 g/100 g) (Cheng et al., 2016) (Table 3), suggesting that this alkaloid was more resistant to bioprocessing than caffeine during bird digestion. Also, there were no differences between non-Jacu and Jacu coffee samples concerning sucrose contents, which were in accordance with the range reported for C. arabica (5.0–12.0 g/100 g) (Redgwel and Fischer, 2006). Sucrose contents were also not affected by post-harvesting processing (dry vs. wet-processing). Still, differences were observed between 2016 and 2017 crops, possibly related to the climate conditions in these years during coffee growth. Insolation intensity, for instance, is positively correlated to sucrose biosynthesis (Cheng et al., 2016).
Eleven CGA were quantified in non-Jacu and Jacu coffee samples: 3-CQA, 4-CQA, 5-CQA, 3-CoQA, 4-CoQA, 5-CoQA, 4-FQA, 5-FQA, 3,4-diCQA, 3,5-diCQA and 4,5-diCQA (Figure 3). CQA was a major class (86.2%), followed by di-CQA (7.9%), FQA (4.9%), and p-CoQA (0.9%) (Table 3). CGA contents of non-Jacu samples (4.2 g/100 g, on average) were close to the lower limit of the reported range for C. arabica in the literature (Farah and Donangelo, 2006; Cheng et al., 2016) (4.0–8.4 g/100 g) and CGA contents of Jacu coffee samples (3.4 g/100 g, on average) were similar to that reported by Cheong et al. (2013) for Kopi Luwak coffee (3.0 g/100 g). Bioprocessed samples seem to contain less CGA than non-bioprocessed ones, and this difference could be possibly explained by the degradation and/or absorption of these compounds during the bird's digestion. When CGA classes are considered separately, similar behaviors could be noticed. Even though it is well known that CGA is absorbed and extensively metabolized in humans (Clifford et al., 2020) and rodents (Clifford, 2000), there are no studies investigating these processes in birds. Nevertheless, Karasov et al. (2012) reported that birds have a higher capacity of absorbing water-soluble secondary plant metabolites, such as phenolic compounds, than rodents. Moreover, Zhang et al. (2020) recently showed that CGA consumption minimizes damage to the small intestine structure of chickens, as well as improves antioxidant capacity and inhibits the transcriptional activity of inflammatory cytokines, implying CGA absorption. However, further studies with adequate statistical power must be conducted to confirm these preliminary observations.
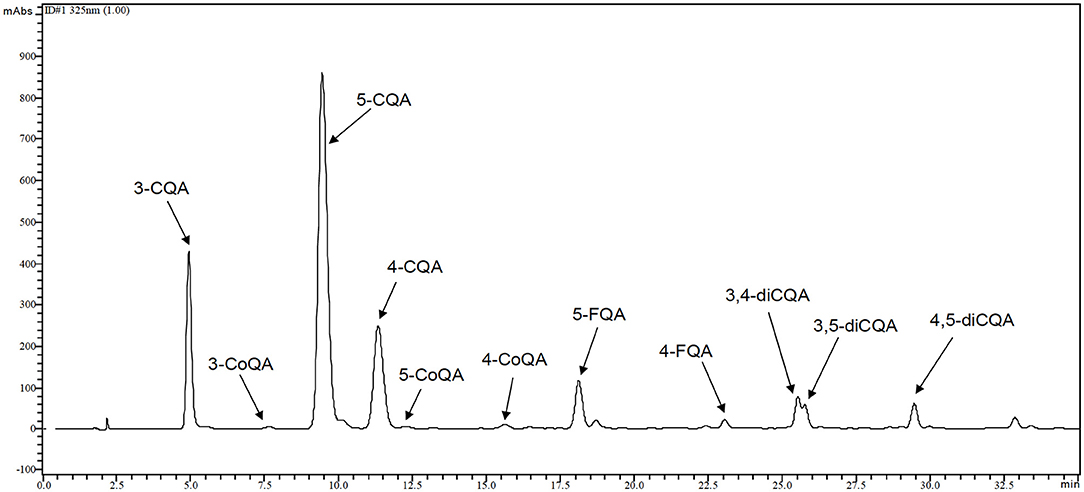
Figure 3. Typical chromatographic separation of chlorogenic acids (CGA) released from non-Jacu, Jacu and Kopi Luwak coffee samples. CQA, Caffeoylquinic acid; FQA, feruloylquinic acid; diCQA, dicaffeoylquinic acid; p-CoQA, coumaroylquinic acid.
The lipid fraction of all green coffee samples was composed of FFA, diterpenes, tocopherols, sterols, DAG, and TAG (Figure 4), as reported in the literature for C. arabica non-bioprocessed green coffees (Speer and Kölling-Speer, 2006; Farah, 2012; Novaes et al., 2018). TAG were the predominant class, representing, on average, 88.7% of lipids (Figure 5). Dipalmitoyl-linoleoyl glycerol (PPL) and palmitoyl-dilinoleoyl glycerol (PLL) were those found in the highest proportions, on average of 32.7 and 27.6%, respectively, similar to those reported by González et al. (2001). Other seven TAG were found in coffee samples at lower proportions: palmitoyl-stearoyl-linoleoyl glycerol (PSL), palmitoyl-oleoyl-linoleoyl glycerol (POL), palmitoyl-linoleoyl-arachidonoyl glycerol (PLA), stearoyl-oleoyl-linoleoyl glycerol (SOL), distearoyl-linolenyl glycerol (SSLn), oleoyl-linoleoyl-linolenyl glycerol (OLLn) and dilinoleoyl-linolenyl glycerol (LLLn). FFA accounted for an average of 1.7% of lipids (Figure 5), similar to that reported by Farah (2012). Linoleic, oleic, and palmitic acids corresponded, on average, to 38.7%, 33.1%, and 28.2% of this lipid class, respectively, in accordance with previous reports in the literature (Speer and Kölling-Speer, 2006; Oliveira et al., 2014). Campesterol, β-sitosterol, and stigmasterol were the sterols identified in the coffee samples (Figure 6), accounting for 4.8% of total lipids, in accordance with Novaes et al. (2015). β-Sitosterol was the most abundant sterol, representing on average 50.7% of this lipid fraction, similar to that reported by Farah (2012).
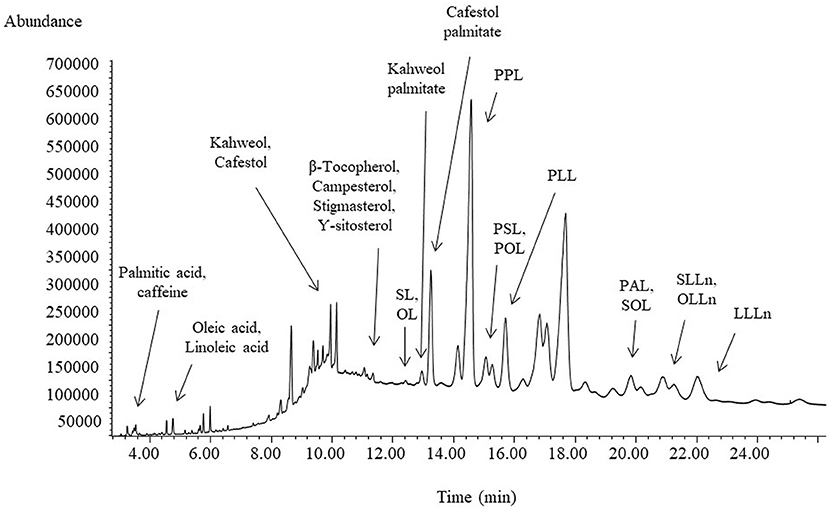
Figure 4. Typical chromatogram of the crude lipid fraction from Kopi Luwak coffee samples. Dashed lines indicate regions of fatty acids, caffeine, free diterpenes, tocopherols and sterols, diacylglycerols, esterified diterpenes and triacylglycerols. P, palmitic; O, oleic; L, linoleic; S, stearic; A, arachidonic; Ln, linoleic.
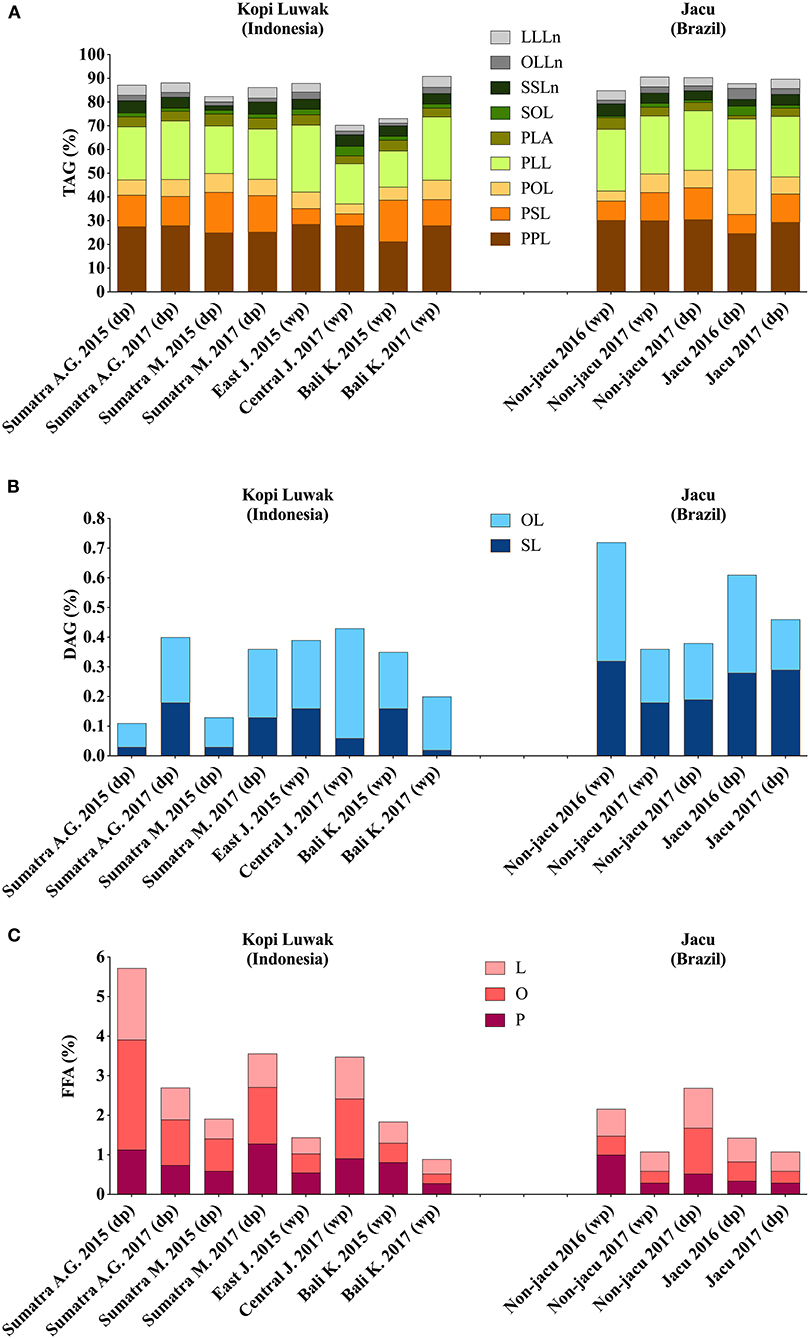
Figure 5. Profile of triacylglycerols [TAG, (A)], diacylglycerols [DAG, (B)] and free fatty acids [FFA, (C)] of coffees from Indonesia (Kopi Luwak) and Brazil (Non-jacu and Jacu). Indonesian samples were from 2015 and 2017 crops of different regions (A.G., Aceh Gayo; M., Mandheling; J., Java; K., Kintamani). Brazilian samples were from 2016 and 2017 crops. Samples were either dry processed (dp) or wet processed (wp). P, palmitic; O, oleic; L, linoleic; S, stearic; A, arachidonic; Ln, linoleic.
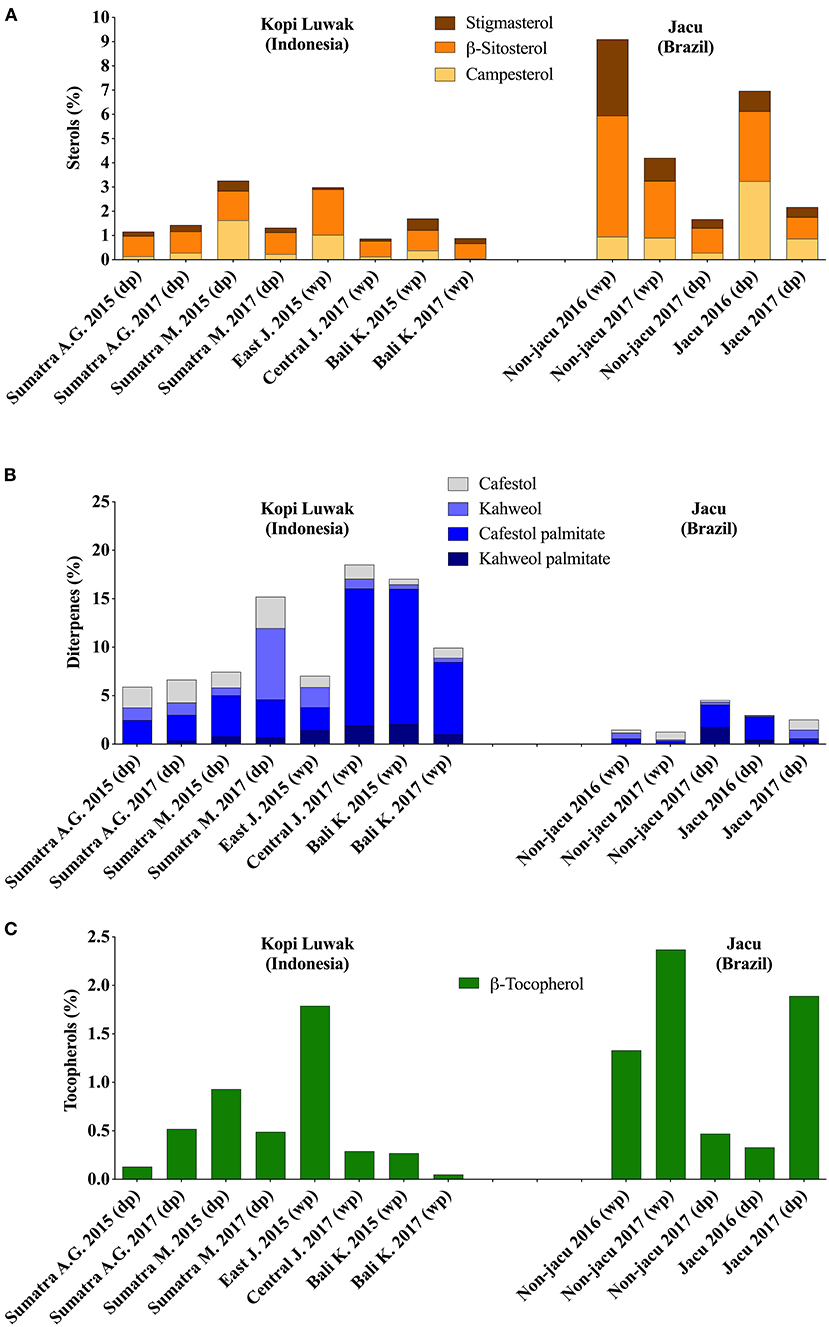
Figure 6. Profile of sterols (A), diterpenes (B), and tocopherols (C) of coffees from Indonesia (Kopi Luwak) and Brazil (Non-jacu and Jacu). Indonesian samples were from 2015 and 2017 crops of different regions (A.G., Aceh Gayo; M., Mandheling; J., Java; K., Kintamani). Brazilian samples were from 2016 and 2017 crops. Samples were either dry processed (dp) or wet processed (wp).
Kahweol and cafestol were the two diterpenes observed in all samples (Figure 6), as previously reported by the literature (Clifford, 1985; Clarke and Macrae, 1988; Tinoco et al., 2019; Cyrus et al., 2021). In their free forms (dialcohol), these compounds together accounted for an average of 0.9% of lipids, similarly to that reported by Speer and Kölling-Speer (2006). As diterpenic fatty acids, kahweol palmitate and cafestol palmitate were identified in all samples, as previously reported by the literature (Kurzrock and Speer, 2001; Speer and Kölling-Speer, 2006; Lima et al., 2020). The most abundant was cafestol palmitate, which represented on average 66% of this class, and together these compounds accounted from 0.3 to 4.1% of lipids, on average. The literature reports a wide range for the contents of esterified diterpenes in C. arabica coffee oil: from 1.1 to 18.0% (Speer and Kölling-Speer, 2006; Novaes et al., 2015, 2020). The ratio between cafestol and kahweol, which has been suggested as an indicator of cup quality (Novaes et al., 2015), ranged from 0.5 to 2, in accordance with the literature (Gross et al., 1997; Silva et al., 2012; Oliveira et al., 2014).
Bioprocessing by the Jacu bird seems to have affected the lipid profile of coffee samples, especially the contents of TAG. While PPA, LLLn and PPL seem to have decreased, SOL, POL and OLLn seem to have increased, and PSL, PLL and SSLn did not change. DAG contents were not modified due to bioprocessing. In avians, lipids are digested through hydrolysis by lipolytic enzymes (colipase and pancreatic lipase) followed by absorption in the small intestine (Bauer et al., 2005). Together, our results suggest that TAG containing two saturated fatty acids (PPL and PLA) were preferably hydrolyzed in detriment to those containing two unsaturated fatty acids (POL, SOL, and PLL) and that the FFA produced were absorbed in the digestive tract of the Jacu bird. Alternatively, FFA could have been degraded by the avian gut microbiota (e.g., Bacteroides, Clostridium, Lactobacillus, Streptococcus, and Campylobacte). Bioprocessing by the Jacu bird seems to have also increased campesterol contents, possibly associated to a higher absorption of the other two sterols. Bioprocessing did not modify diterpenes proportions, consequently not changing the ratio between cafestol and kahweol, an indicator of cup quality (Novaes et al., 2015).
Post-harvest processing of the Brazilian coffee samples also affected their lipid profile. Wet-processed samples seem to have higher contents of PLA, LLLn, stigmasterol, β-sitosterol and β-tocopherol than dry-processed ones. Differently from most enzymes, which need water activities above 0.7 to catalyze reactions, lipases have a unique ability to be active at lower water activities (Wehtje and Adlercreutz, 1997). Therefore, the observed changes in lipids could be associated to different lipase activities in dry and wet-processed samples. Moreover, each post-harvest process entails a different fermentation step, with different microbiota, which may also have influenced their lipid profile.
The average contents of proteins (12.8 g/100 g dwb), lipids (11.5 g/100 g dwb), ashes (4.7 g/100 g dwb) and total carbohydrates (70.7 g/100 g dwb) in Kopi Luwak coffee samples (Table 2) were similar to those previously reported in the literature (Marcone, 2004; Muzaifa and Hasni, 2016; Hadipernata and Nugraha, 2018; Muzaifa et al., 2020), with the exception of the lipid contents reported by Muzaifa and Hasni (2016) (on average 1.3 g/100 g), which was much lower than expected for green coffee beans. This study is the first to report the dietary fiber contents in Kopi Luwak coffee samples (on average 56.8 g/100 g dwb) (Table 2), which were slightly higher than the 40–50% content expected to be found in green coffee beans (Trugo, 1985), possibly due to the relative decrease of digestible nutrients. Kopi Luwak samples from the 2015 crop, independently of different harvesting regions and post-harvest processes, had lower contents of proteins (8%), lipids (27%) and ashes (23%) compared with those from the 2017 crop, probably due to different weather conditions in these years.
Kopi Luwak coffee samples had an average caffeine content of 0.48 g/100 g (dwb) (Table 3), which is similar to that reported by Nishiguchi et al. (2017) (0.36 g/100 g) for Kopi Luwak and that found for Jacu coffees in the present study (0.34 g/100 g, on average), but lower than that reported by Muzaifa et al. (2020) (on average 1.20 g/100 g) for Kopi Luwak and that of non-bioprocessed green C. arabica samples (0.6–1.8 g/100 g) (Cheng et al., 2016). This result reinforces the previously mentioned hypothesis that bioprocessing reduces green coffee caffeine content. Trigonelline average content in Kopi Luwak coffee samples was 1.11 g/100 g (dwb) (Table 3), which is in accordance with the content reported for non-bioprocessed green C. arabica samples (0.3–1.3 g/100 g) (Cheng et al., 2016). To the best of our knowledge, our study is the first to analyze this compound in Kopi Luwak coffee. Sucrose contents showed a wide variation among Kopi Luwak coffee samples, ranging from 3.99 to 12.84 g/100 g (dwb) (Table 3), in accordance with the literature for non-bioprocessed green C. arabica (Redgwel and Fischer, 2006). While samples from the 2015 crop (on average, 5.5 g/100 g dwb) had sucrose contents similar to that reported by Muzaifa (2018) for Kopi Luwak coffees (on average, 6.3 g/100 g), samples from the 2017 crop had twice as much (on average, 11.1 g/100 g dwb) (p < 0.0001). This difference may be explained by insolation intensity in these years, as shading negatively affects sucrose biosynthesis (Cheng et al., 2016).
The same CGA found in non-Jacu and Jacu coffee samples were observed in Kopi Luwak coffees, with the same order of abundance for CGA classes: CQA (80.0%), di-CQA (8.7%), FQA (4.3%) and p-CoQA (1.1%) (Table 3). 5-CQA was also the most abundant, representing an average of 62.2% of the total CGA. Kopi Luwak samples had an average content of total CGA of 5.09 g/100 g (dwb), with samples from the 2017 crop showing twice as much CGA (on average, 6.91 g/100 g dwb) than those from the 2015 crop (on average, 3.28 g/100 g dwb), a behavior observed for all CGA classes. Therefore, while Kopi Luwak samples from 2015 had total CGA contents very similar to those reported by Muzaifa et al. (2020) for Kopi Luwak (on average 3.73 g/100 g), samples from 2017 were more similar with non-bioprocessed C. arabica (Farah and Donangelo, 2006; Cheng et al., 2016), which usually contains more than 5% of total CGA.
Similar to Jacu coffee samples, TAG were the predominant class of lipids in Kopi Luwak coffee samples (83.3% of lipids, on average), with PPL and PLL as the major ones (26.5 and 21.9%, respectively, on average) (Figure 5). On the other hand, Kopi Luwak coffee samples had higher FFA contents (2.69%) and lower DGA contents (0.30%) than Jacu coffee samples (1.26 and 0.54%, respectively). Kopi Luwak coffee samples also showed lower content of sterols (1.70%) and higher content of diterpenes (10.97%) when compared to Jacu coffee samples (4.57 and 2.76%, respectively) (Figure 6). These results may be related to differences in lipids digestion process of mammals and avians.
In order to understand the contribution of volatile precursors in the distinction of each Kopi Luwak coffee sample and their relationship with crop year, post-harvesting processing and growing conditions, the principal component analysis (PCA) was performed, either grouping compounds according to their chemical class (Figure 7A) or considering each individual compound as a separate variable (Figure 7B). The first three principal components accounted together for 73.7 and 66.4% of the variance in these plots, respectively. In both plots, samples harvested in 2015 are located in the left quadrants, whereas those from 2017 are in the right ones, indicating that the crop year, in other words weather conditions, was a contributor to discriminating samples. The most important contributors for the discrimination of these samples were total lipids, ashes, total CGA, sucrose and proteins, all of which were found at higher contents in 2017 samples compared to 2015 ones. Neither the harvesting location nor the post-harvest processing have discriminated Kopi Luwak, as samples with equivalent characteristics (SG and BK, for instance) were located in opposite quadrants of the PCA plots.
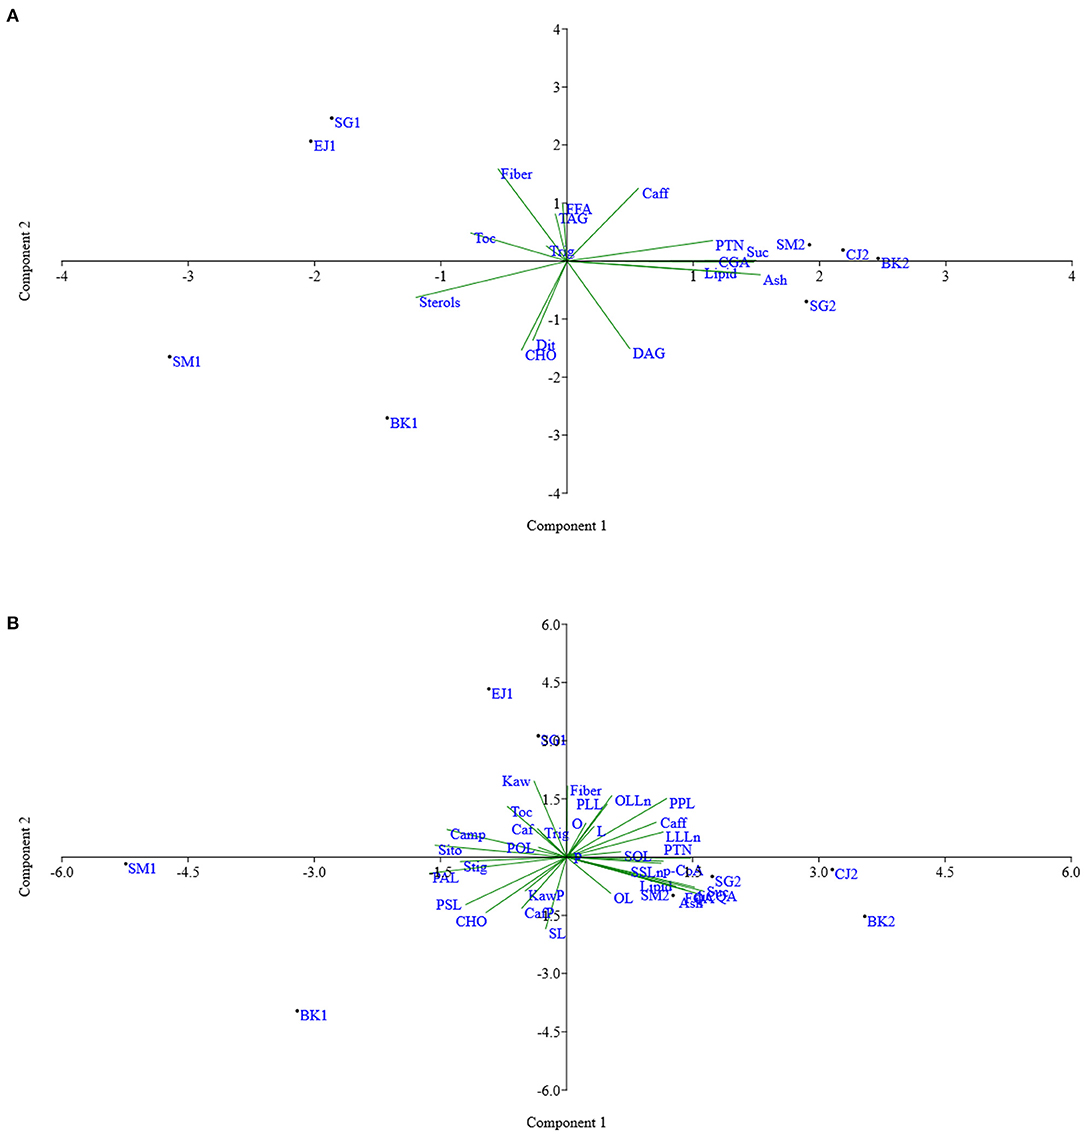
Figure 7. Principal component analysis (PCA) concerning the distribution of grouped compounds of Kopi Luwak (SG, Sumatra Aceh Gayo; SM, Sumatra Mandheling; EJ, East Java; CJ, Central Java; BK, Bali Kintamani) coffee samples from crops 1 (2015) and 2 (2017) (A) or in relation to all measured individual (B). PTN, Protein; CHO, Carbohydrates; Caff, Caffeine; Trig, Trigonelline; Suc, Sucrose; Dit, Diterpenes; CGA, Chlorogenic acids; FFA, Free fatty acids; DAG, Diacylglycerols; TAG, Triacylglycerols; P, palmitic; O, oleic; L, linoleic; S, stearic; A, arachidonic; Ln, linolenic; Kaw, Kaweol; Caf, Cafestol; Toc, β-Tocopherol; Camp, Campesterol; Sito, γ-Sitosterol; Stig, Stigmaesterol; KawP, Kahweol palmitate; CafP, Cafestol palmitate.
This was the first study to perform a detailed chemical characterization of exotic coffees, with emphasis on flavor precursors. Moreover, the effect of bioprocessing on these components was evaluated for the first time, specifically for Jacu coffee. The digestion process by the Jacu bird seem to have modified the profile of several flavor precursors, namely caffeine, CGA and TAG. However, further studies with adequate statistical power are needed to confirm these preliminary observations. The crop year of Kopi Luwak affected the flavor precursors composition, namely total lipids, total CGA, sucrose and proteins. However, it was not possible to identify which specific climatic conditions of these crop years led to these differences. All these changes may affect the formation of volatile compounds upon roasting, thus contributing to the unique flavor and aroma of these exotic coffees.
The raw data supporting the conclusions of this article will be made available by the authors, without undue reservation.
BR: methodology, validation, formal analysis, investigation, data curation, and writing—original draft. MB: formal analysis and investigation. FN: methodology, validation, data curation, and writing—review and editing. MG, DF, and CR: resources and writing—review and editing. JN: conceptualization, data curation, writing—review and editing, supervision, project administration, and funding. DP: conceptualization, data curation, writing—review and editing, visualization, supervision, project administration, and funding acquisition. All authors contributed to the article and approved the submitted version.
The financial support of Fundação Carlos Chagas Filho de Amparo à Pesquisa do Estado do Rio de Janeiro (FAPERJ; E-26/203.276/2016, E-26/010.000266/2017, E-26/202.708/2018, E-26/210.151/2018, E-26/010.101004/2018, and E-26/202.694/2019) is greatly acknowledged. This study was financed in part by the Coordenação de Aperfeiçoamento de Pessoal de Nível Superior—Brasil (CAPES)—Finance Code 001.
The authors declare that the research was conducted in the absence of any commercial or financial relationships that could be construed as a potential conflict of interest.
All claims expressed in this article are solely those of the authors and do not necessarily represent those of their affiliated organizations, or those of the publisher, the editors and the reviewers. Any product that may be evaluated in this article, or claim that may be made by its manufacturer, is not guaranteed or endorsed by the publisher.
Alves, S., Dias, R., Eloy, R., Benassi, M., and Scholz, M. (2006). HPLC analysis of nicotinic acid, trigonelline, chlorogenic acid and caffeine in roasted coffee. Química Nova 29, 1164–1168. doi: 10.1590/S0100-40422006000600003
AOAC (2000). Official Methods of Analysis. 17th Edn. Gaitherburg, MD: Association of Analytical Communities.
Arboleda, E. R. (2018). Discrimination of civet coffee using near infrared spectroscopy and artificial neural network. Int. J. Adv. Computer Res. 8, 39. doi: 10.19101/IJACR.2018.839007
Badmos, S., Lee, S., and Kuhner, N. (2019). Comparison and quantification of chlorogenic acids for differentiation of green Robusta and Arabica coffee beans. Food Res. Int. 126, 108544. doi: 10.1016/j.foodres.2019.108544
Bauer, E., Jakob, S., and Mosenthin, R. (2005). Principles of physiology of lipid digestion. Asian-Aust. J. Anim. Sci. 18, 282–295. doi: 10.5713/ajas.2005.282
Baumann, T. W., Schulthess, B. H., and Hänni, K. (1995). Guaraná (Paullinia cupana) rewards seed dispersers without intoxicating them by caffeine. Phytochemistry 39, 1063–1070. doi: 10.1016/0031-9422(94)00141-F
Borém, F. M., Isquierdo, E. P., Oliveira, P. D., Ribeiro, F. C., Siqueira, V. C., and Taveira, J. H. S. (2014). Effect of intermittent drying and storage on parchment coffee quality. Biosci. J. 30, 609–616.
Burns, D. T., and Walker, M. J. (2019). Critical review of analytical and bioanalytical verification of the authenticity of coffee. J. AOAC Int. 103, 283–294. doi: 10.5740/jaoacint.18-0392
Cheng, B., Furtado, A., Heather, E., Smyth, R., and Henry, J. (2016). Influence of genotype and environment on coffee quality. Food Sci. Technol. 57, 20–30. doi: 10.1016/j.tifs.2016.09.003
Cheong, M., Tong, K., Ong, J., Liu, S., Curran, P., and Yu, B. (2013). Volatile composition and antioxidant capacity of Arabica coffee. Food Res. Int. 51, 1388–1396. doi: 10.1016/j.foodres.2012.12.058
Clarke, R. J., and Macrae, R. (1985). Coffee. Vol. 1: Chemistry. 1st Edn. London: Elsevier Applied Science.
Clarke, R. J., and Macrae, R. (1988). Coffee. Volume 3: Physiology, 1st Edn. London: Elsevier Applied Science.
Clifford, M. N. (1985). “Coffee: botany, biochemistry and production of beans and beverage,” in eds M. N. Clifford, and K. C. Wilson, 1st Edn. (Bristol: Croom Helm Ltd.), 305p.
Clifford, M. N. (2000). Chlorogenic acids and other cinnamates - nature, occurence, dietary burden, absorption and metabolism. J. Sci. Food Agric. 80, 1033–1043. doi: 10.1002/(SICI)1097-0010(20000515)80:7<1033::AID-JSFA595>3.0.CO;2-T
Clifford, M. N., Kerimi, A., and Williamson, G. (2020). Bioavailability and metabolism of chlorogenic acids (acyl-quinic acids) in humans. Compr. Rev. Food Sci. Food Saf. 19, 1299–1352. doi: 10.1111/1541-4337.12518
Conti, M. C. M. D., Kitzberger, C., Scholz, M., and Prudencio, S. H. (2013). Physical and chemical characteristics of exotic and conventional roasted and ground coffees. Boletim do Centro de Pesquisa e Processamento de Alimentos 31, 161–172. doi: 10.5380/cep.v31i1.32720
Cyrus, V. A., Novaes, F. J. M., Pereira, H. M. G., Sardela, V. F., and Rezende, C. M. (2021). Metabolic study of cafestol using in silico approach, zebrafish water tank experiments and liquid chromatography high-resolution mass spectrometry analyses. J. Chromatogr. B 1186, 123028. doi: 10.1016/j.jchromb.2021.123028
Ellis, D. I., Muhamadali, H., Allen, D. P., Elliot, C. T., and Goodacre, R. (2016). A flavour of omics approaches for the detection of food fraud. Food Sci. 10, 7–15. doi: 10.1016/j.cofs.2016.07.002
Farah, A. (2012). “Coffee constituents,” in Coffee: Emerging Health Benefits and Disease Prevention. 1st Edn., ed Y.-F. Chu (Hoboken, NJ: John Wiley & Sons, Inc.), 21–50.
Farah, A., and Donangelo, C. M. (2006). Phenolic compounds in coffee. Braz. J. Plant Physiol. 18, 23–36. doi: 10.1590/S1677-04202006000100003
Farah, A. P. T., Trugo, L. C., and Martin, P. R. (2005). Effect of roasting on the formation of chlorogenic acids lactones in coffee. J. Agric. Food Chem. 53, 1505–1513. doi: 10.1021/jf048701t
Febrina, L., Happyana, N., and Syah, Y. M. (2021). Metabolite profiles and antidiabetic activity of the green beans of Luwak (civet) coffees. Food Chem. 355, 129496. doi: 10.1016/j.foodchem.2021.129496
González, A. G., Pablo, S. M., Martín, M. J., León-Camacho, M., and Valdenebro, M. (2001). HPLC analysis of tocopherols and triglycerides in coffee and their use as authentication parameters. Food Chem. 73, 93. doi: 10.1016/S0308-8146(00)00282-X
Gross, G., Jaccaud, E., and Huggett, A. C. (1997). Analysis of the content of the diterpenes cafestol and kahweol in coffee brews. Food Chem. Toxicol. 35, 547–554. doi: 10.1016/S0278-6915(96)00123-8
Hadipernata, M., and Nugraha, S. (2018). Process technology of luwak coffee through bioreactor utilization. IOP Conf. Series Earth Environ. Sci. 102, 012092. doi: 10.1088/1755-1315/102/1/012092
Hird, S. M., Sánchez, C., Carstens, B. C., and Brumfield, R. T. (2015). Comparative gut microbiota of 59 neotropical bird species. Front. Microbiol. 6, 1403. doi: 10.3389/fmicb.2015.01403
Ifmalinda, I., Setiasih, I. S., Muhaemin, M., and Nurjanah, S. (2019). Chemical characteristics comparison of palm civet coffee (kopi luwak) and arabica coffee beans. J. Appl. Agric. Sci. Technol. 3, 280–288. doi: 10.32530/jaast.v3i2.110
Incaper (2022). Website of the “Coordenação de Meteorologia da Secretaria de Estado da Agricultura, Abastecimento, Acquicultura e Pesca do Governo do Estado do Espírito Santo”. Available onlien at: https://meteorologia.incaper.es.gov.br/graficos-da-serie-historica-domingos_martins (accessed May 2, 2022).
Jumhawan, U., Putri, S. P., Yusianto; Bamba, T., and Fukusaki, E. (2016). Quantification of coffee blends for authentication of Asian palm civet coffee (Kopi Luwak) via metabolomics: a proof of concept. J. Biosci. Bioeng. 122, 79–84. doi: 10.1016/j.jbiosc.2015.12.008
Karasov, W. H., Caviedes-Vidal, E., Bakken, B. H., Izhaki, I., Blank, M., and Arad, Z. (2012). Capacity for absorption of water-soluble secondary metabolites greater in birds than in rodents. PLoS ONE. 7:e32417. doi: 10.1371/journal.pone.0032417
Kimball, B. A., Arjo, W. M., and Johnston, J. J. (2004). Single-point calibration with a non-linear detector: carbohydrate analysis of conifer needles by hydrophobic interaction Chromatography–Evaporative Light-Scattering Detection (HIC– ELSD). J. Liquid Chromatogr. Relat. Technol. 27, 1835–1848. doi: 10.1081/JLC-120038771
Kurzrock, T., and Speer, K. (2001). Identification of kahweol fatty acid esters in Arabica coffee by means of LC/MS. J. Separat. Sci. 24, 843–848. doi: 10.1002/1615-9314(20011101)24:10/113.0.CO;2-9
Lee, L., W; Cheong, M. W., Curan, P., Yu, B., and Liu, S. Q. (2015). Coffee fermentation and flavor – An intricate and delicate relationship. Food Chem. 185, 182–191. doi: 10.1016/j.foodchem.2015.03.124
Lightfoot, T. L., and Yeager, J. M. (2008). Pet bird toxicity and related environmental concerns. Vet. Clin. North Am. Exotic Anim. Pract. 11, 229–259. doi: 10.1016/j.cvex.2008.01.006
Lima, A. L., Bezerra, M. A. M., Souza, R., Itabaiana, I. Jr., Haynes, T., Hermans, S., et al. (2020). Fast and highly selective continuous-flow catalytic hydrogenation. ACS Omega 5, 25712–25722. doi: 10.1021/acsomega.0c01835
Mahendradatta, M., Zainal, I., and Tawali, A. B. (2012). Comparison of Chemical Characteristics and Sensory Value Between Luwak Coffee and Original Coffee From Arabica (Caffea arabica. L) and Robusta (Caffea canephora. L) Varieties. Makassar: Food Science and Technology Study Program, Department of Agricultural Technology, Faculty of Agriculture, Hasanuddin University.
Malacarne, A., Silva, L. N., Macêdo, R. F., and Bortoli, R. (2017). Geographic indication can add value to jacu coffee' producers. Ingi J. 1, 1–17.
Marcone, M. F. (2004). Composition and proprerties od Indonesian palm civet coffee (Kopi Luwak) and Ethiopian civet coffee. Food Res. Int. 37, 901–912. doi: 10.1016/j.foodres.2004.05.008
Mazzafera, P. (2002). Degradation of caffeine by microorganisms and potential use of decaffeinated coffee husk and pulp in animal feeding. Sci. Agric. 59, 815–821. doi: 10.1590/S0103-90162002000400030
Muzaifa, M. (2018). Exploration study of Kopi Luwak: chemical compounds and sensory profile. Int. J. Curr. Innovat. Res. 4, 1273–1276. doi: 10.24327/IJCIR
Muzaifa, M., and Hasni, D. (2016). Exploration study of Gayo specialty coffee (Coffea arabica L.): chemical compounds, sensory profile and physical appearance. Pakistan J. Nutr. 15, 486–491. doi: 10.3923/pjn.2016.486.491
Muzaifa, M., Hasni, D., Febrani; Patria, A., and Abubakar, A. (2020). Chemical composition of green and roasted coffee bean of Gayo arabica civet coffee (kopi luwak). IOP Conf. Series Earth Environ. Sci. 425, 012001. doi: 10.1088/1755-1315/425/1/012001
Muzaifa, M., Hasni, D., Yunita, D., Febrian; Patria, A., and Abubakar, A. (2019). Amino acid and sensory profile of Kopi Luwak (Civet Coffee). IOP Conf. Series Mater. Sci. Eng. 523, 012028. doi: 10.1088/1757-899X/523/1/012028
Nishiguchi, Y., Goromaru-shinkai, M., Kuroda, J., Kiuchi, S., and Ihara, H. (2017). Estimation of protein, total polyphenol, chlorogenic acid, caffeine, and caffeic acid contents in Indonesian palm civet coffee (Kopi Luwak). Int. J. Anal. Biosci. 5, 53–56.
Novaes, F. J. M., Kulsing, C., Bizzo, H. R., Neto, F. R. A., Rezende, C. M., and Marriott, P. J. (2018). Analysis of underivatised low volatility compounds by comprehensive two-dimensional gas chromatography with a short primary column. J. Chromatogr. A 1536, 75–81. doi: 10.1016/j.chroma.2017.08.069
Novaes, F. J. M., Lima, F. A., Calado, V., Marriott, P. J., Aquino Neto, F. R., and Rezende, C. M. (2020). Isolating valuable coffee diterpenes by using an inexpensive procedure. Indus. Crops Prod. 152, 112494. doi: 10.1016/j.indcrop.2020.112494
Novaes, F. J. M., Oigman, S. S., Souza, R., Rezende, C. M., and Aquino Neto, F. R. (2015). New approaches on the analyses of thermolabile coffee diterpenes by gas chromatography and its relationship with cup quality. Talanta 139, 159–166. doi: 10.1016/j.talanta.2014.12.025
Oliveira, P. M. A., Almeida, R. H., Oliveira, N. A., Bostyn, S., Gonçalves, C. B., and Oliveira, A. L. (2014). Enrichment of diterpenes in green coffee oil using supercritical fluid extraction – Characterization and comparison with green coffee oil from pressing. J. Supercrit. Fluids 95, 137–145. doi: 10.1016/j.supflu.2014.08.016
Ongo, E., Falasconi, M., Sevilla, F., Montevecchi, G., Sberveglieri, V., Concina, I., et al. (2015). Geographic origin differentiation of Philippine civet coffeeusing an electronic nose. Acta Manila. Ser. A. 63, 17–24. doi: 10.53603/actamanil.63.2015.wxxj5891
Perrone, D., Donangelo, C. M., and Farah, A. (2008b). Fast simultaneous analysis of caffeine, trigonelline, nicotinic acid and sucrose in coffee by liquid chromatography-mass spectrometry. Food Chem. 110, 1030–1035. doi: 10.1016/j.foodchem.2008.03.012
Perrone, D., Farah, A., Donangelo, C. M., Paulis, T., and Martin, P. (2008a). Comprehensive analysis of major and minor chlorogenic acids and lactones in economically relevant Brazilian coffee cultivars. Food Chem. 106, 859–867. doi: 10.1016/j.foodchem.2007.06.053
Redgwel, R., and Fischer, M. (2006). Coffee carbohydrates. Braz. J. Plant Physiol. 18, 165–174. doi: 10.1590/S1677-04202006000100012
Reece, J., Urry, L., Cain, M., Wasserman, S., Minorsky, P., and Jackson, R. (2011). Campbell, Biology. 9th Edn. Boston: Benjamin Cummings/Pearson Education, Print.
Silva, J. A., Borges, N., Santos, A., and Alves, A. (2012). Method validation for cafestol and kahweol quantification in coffee brews by HPLC-DAD. Food Anal. Methods 5, 1404–1410. doi: 10.1007/s12161-012-9387-5
Speer, K., and Kölling-Speer, I. (2006). The lipid fraction of the coffee bean. Braz. J. Plant Physiol. 18, 201–216. doi: 10.1590/S1677-04202006000100014
Tawali, A. B., and Laga, A. (2019). Luwak coffee in vitro fermentation: literature review. IOP Conf. Series: Earth Environ. Sci. 230, 012096. doi: 10.1088/1755-1315/230/1/012096
Tinoco, N. A. B., Pacheco, S., Godoy, R. L. O., Bizzo, H. R., Aguiar, P. F., Leite, S. G. F., et al. (2019). Reduction of βN-alkanoyl-5-hydroxytryptamides and diterpenes by yeast supplementation to green coffee during wet processing. Food Res. Int. 115, 487–492. doi: 10.1016/j.foodres.2018.10.007
Trugo, L. C. (1985). “Carbohydrates” in Coffee. Vol 1: Chemistry, 1st Edn, eds R. J. Clarke and R. Macrae (Essex: Elsevier Science Publishers Ltd.), 85.
Trugo, L. C., and Macrae, R. (1984). A study of the effect of roasting on the chlorogenic acid composition of coffee using HPLC. Food Chem. 15, 219–227. doi: 10.1016/0308-8146(84)90006-2
Wehtje, E., and Adlercreutz, P. (1997). Water activity and substrate concentration effects on lipase activity. Biotechnol. Bioeng. 55, 798–806. doi: 10.1002/(SICI)1097-0290(19970905)55:5<798::AID-BIT10>3.0.CO;2-8
Whorter, T. J. M., Caviedes-Vidal, E., and Karasov, W. H. (2009). The integration of digestion and osmoregulation in the avian gut. Biol. Rev. 84, 533–565. doi: 10.1111/j.1469-185X.2009.00086.x
Zhang, X., Zhao, Q., Ci, X., Chen, S., Xie, Z., Li, H., et al. (2020). Evaluation of the efficacy of chlorogenic acid in reducing small intestine injury, oxidative stress, and inflammation in chickens challenged with Clostridium perfringens type A. Poult. Sci. 99, 6606–6618. doi: 10.1016/j.psj.2020.09.082
Keywords: caffeine, chlorogenic acids, diterpenes, lipids, proximate composition, sterols, trigonelline
Citation: Ripper B, Barreto MS, Novaes FJM, de Godoy MG, Freire DMG, de Rezende CM, Nunes JC and Perrone D (2022) Comprehensive Composition of Flavor Precursors in Kopi Luwak and Jacu Exotic Green Bioprocessed Coffees. Front. Sustain. Food Syst. 6:824929. doi: 10.3389/fsufs.2022.824929
Received: 29 November 2021; Accepted: 19 May 2022;
Published: 21 June 2022.
Edited by:
Paulo Mazzafera, State University of Campinas, BrazilReviewed by:
Marcelo Ribeiro Malta, Agronomical Research Institute of Minas Gerais, BrazilCopyright © 2022 Ripper, Barreto, Novaes, de Godoy, Freire, de Rezende, Nunes and Perrone. This is an open-access article distributed under the terms of the Creative Commons Attribution License (CC BY). The use, distribution or reproduction in other forums is permitted, provided the original author(s) and the copyright owner(s) are credited and that the original publication in this journal is cited, in accordance with accepted academic practice. No use, distribution or reproduction is permitted which does not comply with these terms.
*Correspondence: Daniel Perrone, ZGFuaWVscGVycm9uZUBpcS51ZnJqLmJy
Disclaimer: All claims expressed in this article are solely those of the authors and do not necessarily represent those of their affiliated organizations, or those of the publisher, the editors and the reviewers. Any product that may be evaluated in this article or claim that may be made by its manufacturer is not guaranteed or endorsed by the publisher.
Research integrity at Frontiers
Learn more about the work of our research integrity team to safeguard the quality of each article we publish.