
95% of researchers rate our articles as excellent or good
Learn more about the work of our research integrity team to safeguard the quality of each article we publish.
Find out more
ORIGINAL RESEARCH article
Front. Sustain. Food Syst. , 29 April 2022
Sec. Nutrition and Sustainable Diets
Volume 6 - 2022 | https://doi.org/10.3389/fsufs.2022.738453
This article is part of the Research Topic Everything Edamame: Biology, Production, Nutrition, Sensory and Economics View all 13 articles
 Renata Carneiro1†
 Kyle Adie1
 Dajun Yu1
 Mariah Beverly2
 Clinton Neill2†
 Bo Zhang3
 Thomas Kuhar4
 Steven Rideout5
 Mark Reiter6
 Haibo Huang1
 Sean O'Keefe1
 Susan Duncan1*
Appearance properties of vegetables can affect consumers' acceptance toward them as well as purchase intent. Hence, appearance is highly associated with quality of edamame (Glycine max (L.) Merr.), a protein-rich vegetable that is experiencing increased sales in the USA. Edamame is a high-value specialty crop and its production has been promoted in Virginia and other states in the USA where the tobacco production has decreased in the last decade. To support current efforts to develop the edamame industry in the USA, consumer and color data of 10 edamame genotypes grown in Virginia were analyzed in this follow-up study to understand the role of overall appearance and color characteristics in consumers' acceptability of edamame beans. In two consecutive years, untrained adult volunteers used 9-point hedonic scales (1 = “dislike extremely”, 9 = “like extremely”) to evaluate appearance and overall liking of edamame samples (cooked and shelled edamame beans) and our researchers measured the reflective color of the samples with a chroma meter. In the first year, sensory panelists also completed a choice-based conjoint analysis to determine their willingness-to-pay (WTP) for dark vs. light green edamame beans in a salad. Edamame genotypes were significantly different in appearance and overall liking (p < 0.05) and the genotype R14-16195 was the most liked overall. Hedonic scores and color were significantly affected by “year” (p < 0.05), so intentional changes between years (e.g., sample preparation) should be avoided in future studies. Consumers showed higher WTP for dark green edamame beans. Additionally, green intensity (color index) and a* color coordinate were correlated to appearance liking scores (p < 0.05), which suggests color data can support breeding selection criteria and possibly predict consumer acceptability. Employing color measurement as quality control method can help improve harvest procedures, post-harvest handling, and define edamame quality standards for the USA market.
Edamame (vegetable soybean; Glycine max (L.) Merr.) is a lucrative food commodity of major economic importance in Asian countries; it is a popular appetizer in Japan and has been largely produced and exported by China and Taiwan for the last five decades (Wang, 2018). More recently, edamame consumption has been increasing significantly in the USA, which has driven plant-breeding researches to improve this high-value specialty crop for domestic production (Carneiro et al., 2021). Moreover, as tobacco production decreases in the country, edamame has been suggested as an alternative crop to farmers in Virginia and other tobacco producing states (Carneiro et al., 2020; Neill and Morgan, 2021). Current efforts to breed new edamame varieties for sustainable production in the USA are also justified by the fact that most seeds available to domestic farmers that aim to grow this nutritious vegetable are expensive, came from other countries, or were not bred to be grown in major production regions of the country (Lord et al., 2021).
Color and appearance are often the initial criteria used by consumers to judge quality of fruits and vegetables and they can influence food consumption and purchases (Lawless and Heymann, 2010; Pathare et al., 2013). Accordingly, appearance is one of the major categories that define quality of edamame, which is frequently associated to green color and shape of pods and seeds, for example (Masuda, 1991; Moseley et al., 2021). The green color in edamame can be considered an indicator of freshness, in opposition to the yellow color. Yellowing indicates freshness decline in edamame and it is associated to degradation of free amino acids, sugars and ascorbic acid (Masuda, 1991). This information is relevant when handling both types of edamame products available in the market: fresh and frozen. Amilia et al. (2021) reported that brightness and green color of frozen salted edamame decreased during storage at room temperature while yellowness first increased then decreased when products turned brownish, which shows that color measurement can help determining shelf life, as well as best storage conditions and thawing practices.
Color of fruits and vegetables is associated with natural pigments (e.g., chlorophylls, carotenoids, anthocyanins, flavonoids) and this visual property can change as consequence of plant maturation, ripening, spoilage, processing, or packaging (Pathare et al., 2013). Visual analysis based on color and appearance standards can be useful tools to select genotypes, monitor post-harvest quality, determine best practices, and can also be used to define premium prices of edamame. Indeed, recent study suggested edamame genotypes that develop dark (black or brown) seed coat at maturity may not be the best option for production (Moseley et al., 2021). Besides color, other appearance properties that can be evaluated in foods include size, shape, visual surface texture, reflectance, glossiness, turbidity, and translucency (Lawless and Heymann, 2010). In addition to the green color of pods and beans, good shape and a spotless surface without defects are also valued in edamame (Carneiro et al., 2020). However, different than shape or size, color is an appearance property that can be an indicator of other sensory properties of foods, such as flavor and texture. Overall, color measurement requires simpler and cheaper equipment than flavor or texture analysis and does not require highly trained analysts. It is also faster and cheaper than sensory evaluation tests for quality control, so it can be a valuable and affordable tool to breeders, food producers and processors committed to the development of the edamame varieties that can perform well in the USA climate and environment, which is vital to assure a long-term sustainable production.
There are multiple coordinate systems that can be used to describe color of fruits and vegetables, such as Hunter L a b, RGB (red, green and blue), and the Commission Internationale de l'Eclairage (CIE) L*a*b*, and colorimeters and spectrophotometers are examples of instruments that can be used to measure color coordinates (Pathare et al., 2013). The impact of color and other appearance properties in the overall acceptability of edamame still requires further investigation to guide best practices and the development of quality standards based on the needs and expectations of the growing USA market. Therefore, in this follow-up study we aimed to further understand the role of appearance liking and color characteristics of edamame beans in consumers' acceptability and willingness-to-pay (WTP) for edamame products. The information provided in this study complements our previous report on how consumer perception of edamame has been used to guide new variety development for sustainable domestic (USA) production in Virginia, Arkansas, Mississippi, and Missouri (Carneiro et al., 2021). This study provides support and guidance to current and future research on edamame.
As reported in our previous publication (Carneiro et al., 2021), an initial set of 20 edamame genotypes (2 cultivars and 18 advanced breeding lines) was analyzed by consumers in the first years of our multistate breeding research program that aims to develop new edamame varieties for production in the USA. Sensory data (overall liking and appearance liking) of a subset of 10 edamame genotypes was further analyzed and its correlation with instrumental data (color measurement) was investigated in this follow-up study. The 10 selected genotypes were: 4 advanced breeding lines from the Virginia Tech breeding program (V10-3653, V16-0524, V16-0528, and V16-0547), 5 advanced breeding lines from the University of Arkansas breeding program (R14-16195, R14-6238, R14-6450, R15-10280, and R16-5336), and the cultivar UA-Kirksey (control). These 10 genotypes were selected from the initial set of 20 genotypes because they were the ones that successfully grew in two Virginia locations, Blacksburg (Virginia Tech's Kentland Farm) and Painter (Eastern Shore Agricultural Research and Extension Center), in the first 2 years of our research (2018 and 2019) and were analyzed by sensory panelists in both years.
Sample preparation for sensory panels was previously reported in Carneiro et al. (2021). Blanched edamame samples (boiling distilled water; 98°C for 1 min) were manually shelled, and healthy beans were packed (re-sealable plastic bags) and frozen stored (−20°C) for sensory evaluation. The day before each sensory panel, frozen edamame beans were transferred to a refrigerator (4°C) to thaw (minimum of 4 h) then cooked in microwave oven (SHARP, model R-2W38, serial n°34328, 120 VAC, 60 Hz, Thailand, 1996). In the first year, edamame beans (200–250 g) were cooked for 4 min (high power) in the same re-sealable plastic (polyethylene) bags used for storage. In the second year, edamame beans (100 g) were cooked 1.5 min (high power) in a glass microwave-safe container covered with a paper towel sheet and remained covered in the container for another minute. In both years, cooked edamame beans cooled to room temperature (~21°C), then a sample was separated for color measurement and the other beans were placed in 2-ounce plastic cups with lids for sensory evaluation. Samples were kept refrigerated until served.
Reflective color of the edamame beans (as prepared for sensory evaluation) was measured in CIE L*a*b* (CIELAB) color scale [L* = darkness (0) or lightness (100); a* = greenness (–) or redness (+); b* = blueness (–) or yellowness (+)] using a Minolta CR-300 Chroma Meter (Minolta Co., Osaka, Japan). In the first year, 100 g of edamame beans were placed inside a clear plastic bag and lined on top of a plane surface (laboratory benchtop) for color measurement. In the second year, 50 g of edamame beans were placed in a plastic petri dish plate. In both years, the equipment was previously calibrated with a standard white plate (L* = 96.77, a* = 0.45, b* = 2.37), then it was positioned over the beans aligned on the top layer. Edamame beans were shuffled between measurements, and L*a*b* values were measured in triplicate, averaged, and recorded. Next, green intensity (GI = - a*/b*) was calculated for each sample (Flores et al., 2019) and correlations between color and sensory data were investigated.
Consumer studies were approved by the Virginia Tech Institutional Review Board (IRB) for Research Involving Human Subjects (IRB 18-310). Sensory tests were performed as described in our previous report (Carneiro et al., 2021). Overall liking (OL) and appearance liking (AL) of edamame samples were evaluated by untrained adult volunteers (N = 50–53 per session) that were not allergic to soy and participated in one or more sensory panels. Participants used 9-point hedonic scales ranging from “dislike extremely” (1) to “like extremely” (9) to evaluate shelled edamame beans prepared as described in section sample preparation (edamame pods were not evaluated by the sensory panelists). Next, correlation between OL and AL of edamame was investigated.
In the first year of the sensory evaluation study, participants (N = 188) were also asked to complete a choice-based conjoint analysis to determine their WTP for edamame products with different characteristics, such as color and taste. Color was varied at two levels (dark vs. light green) as well as flavor (beany vs. sweet). Price for a salad containing edamame beans was varied at three levels. Every choice question contained two options plus a “no buy” option. The experiment was designed using a fractional factorial which resulted in 10 choice questions per participant. To simulate the choice of color, pictures were used that had distinct color variation between light and dark green edamame beans. The color difference was also stated in words under each picture. An example of a choice question answered by consumers is shown in Figure 1.
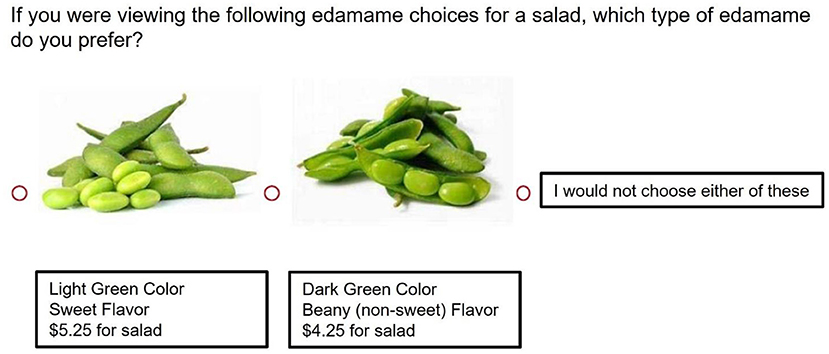
Figure 1. Example of a choice question answered by consumers in the choice-based conjoint analysis to determine their willingness-to-pay (WTP) for edamame products.
The effects of edamame genotype (10 genotypes listed in section edamame samples), growing location (Blacksburg and Painter, VA), year of research (1 and 2), and interaction factors (“genotype*location,” “genotype*year,” “location*year,” “genotype*location*year”) on color (L*a*b* values) and sensory evaluation responses (OL and AL) were tested. The following statistical analysis were performed in JMP® Pro 15.0.0: analysis of variance (ANOVA), Tukey's Honestly Significant Difference (HSD) tests, and Spearman's rank-order correlation (correlations multivariate analysis). WTP was estimated via random-parameters logit model in MATLAB. The standard errors for WTP were calculated via Daly et al. (2012). Significance level was set to 5% (α = 0.05).
Color characteristics of the 10 edamame genotypes grown in Virginia in both years of research are shown in Table 1. Color of edamame beans (L*, a*, b* values) was significantly affected by “year” (p < 0.05). Overall, GI increased from year 1 (range: 0.41–0.57) to year 2 (range: 0.51–0.60). The interaction “location*year” was significant for a* (greenness; p < 0.05). “Genotype” was a significant effect for b* (yellowness; p < 0.05), with variety R14-6450 having the lowest b* values when averaging the two locations: 38.1 (year 1) and 37.8 (year 2).
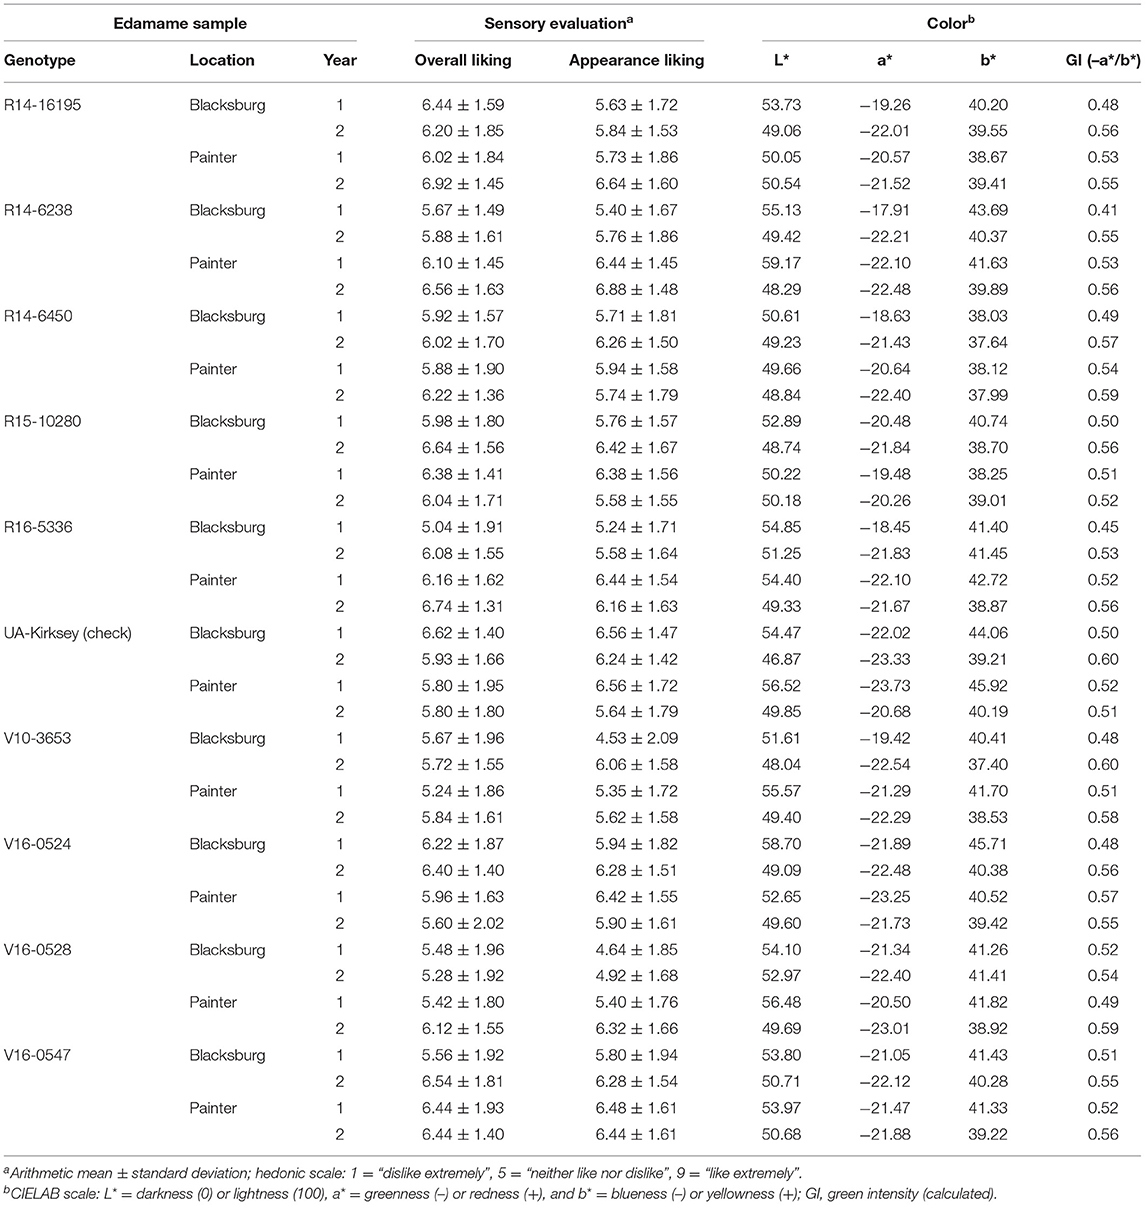
Table 1. Overall liking, appearance liking, and color characteristics of edamame genotypes.
Genotype, location, year, and all interaction factors significantly affected AL (p < 0.05). OL was affected by edamame genotype, year, and the interaction factors “genotype*location” and “genotype*location*year” (p < 0.05). Differences in consumer acceptability of edamame genotypes grown in Virginia are shown in Table 2 (least squares mean; both locations, both years). Breeding lines V10-3653 and V16-0528 were the least liked edamame samples. Breeding lines R14-16195, R15-10280, and V16-0547 were the most liked genotypes overall, and UA-Kirksey (commercial check) and V16-0547 beans had the most liked appearance. Overall, hedonic mean scores (OL and AL) significantly increased from year 1 to year 2 (p < 0.05), and edamame genotypes grown in Painter had significantly higher AL mean scores than edamame grown in Blacksburg (p < 0.05). Furthermore, the choice-based conjoint analysis conducted in the first year of research showed that consumers are willing to pay $0.77 more for dark green edamame beans in a salad, relative to beans with a light green color. The WTP value is significant at α = 0.05, with a standard error of 0.32.
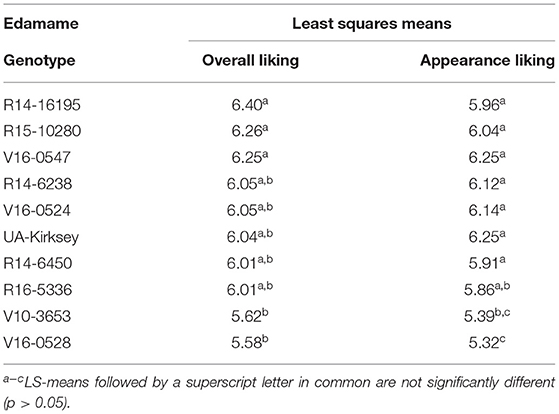
Table 2. Consumer acceptability of edamame genotypes.
Correlations between consumer acceptability scores (OL and AL) and edamame color characteristics (L*a*b* values and GI) were investigated using the complete dataset reported in Table 1 (10 edamame genotypes, 2 VA locations, 2 years). Spearman's correlations (ρ) ranged between −1 (dark blue, cool) and +1 (dark red, warm), as shown in the heatmap (Figure 2). A strong positive correlation was observed between OL and AL hedonic scores (ρ = 0.68), as well as between the L* and b* color coordinates (ρ = 0.82) (Table 3). A significant but less strong correlation was observed between the L* and a* color coordinates (ρ = 0.32). GI was negatively correlated with L* (ρ = −0.76), a* (ρ = −0.74), and b* (ρ = −0.58). A significant correlation was not observed between OL and color characteristics (p > 0.05). However, the GI color index and the red-green coordinate (a*) of the color space seemed to be significant predictors of AL scores (p < 0.05), which were correlated with OL. AL was negatively correlated with a* (ρ = −0.51) and was positively correlated with GI (ρ = 0.40).
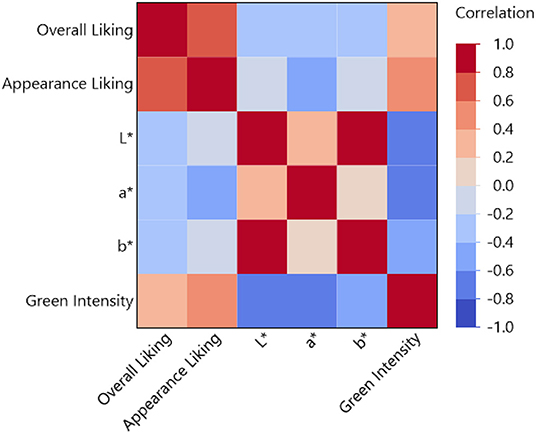
Figure 2. Heatmap on Spearman's correlations between edamame color characteristics and consumer acceptability scores.
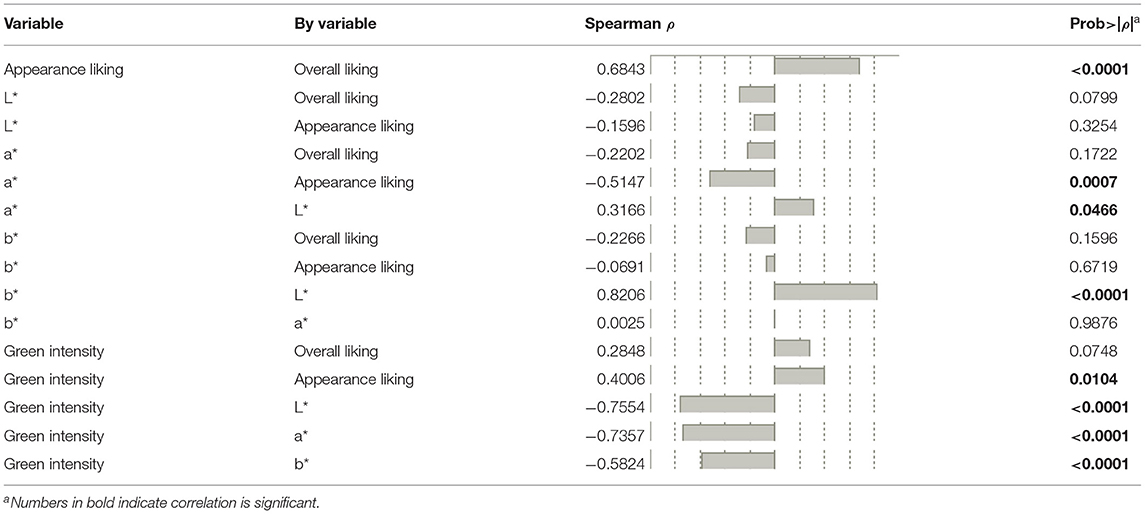
Table 3. Correlation between color characteristics and consumer acceptability (appearance and overall liking) of edamame.
Edamame appearance/color variability can be linked to genotype, planting date, harvest, processing conditions, such as blanching, and storage (Mozzoni et al., 2009; Amilia et al., 2021; Moseley et al., 2021). The blanching procedure followed in both years of our research was the same: immersion of edamame pods in boiling distilled water for 1 min (section sample preparation). Thus, color variation and differences in hedonic scores (OL and AL) were likely associated, for example, with changes in sample preparation for sensory tests (microwave cooking described in section sample preparation), environmental conditions of growing locations (e.g., temperature, precipitation), and/or harvest time and procedures. Nevertheless, the fact that OL and AL scores significantly increased from year 1 to 2 suggests that some changes were positive. Likewise, the overall increase in green intensity (GI) from year 1 to 2 suggests better quality of the samples (lower freshness decline). In fact, it is possible that in the first year, samples were overcooked during sample preparation for sensory tests; all edamame beans had a “wrinkled” appearance that was much less noticed in the second year. Variability in size of the edamame beans (either within a same sample or among different ones) was not evaluated, but it may also have affected AL and/or OL scores. A previous study with peas reported that frozen pea samples were sorted into four sieves sizes with the purpose of reducing variation (Edelenbos et al., 2001). In this study, edamame samples were not selected by size due to limited amount of beans available for the sensory tests, but a similar approach could be considered to select edamame beans in future investigations. Nevertheless, as research on edamame continues in the USA, it is important to control as many sources of variability as possible to draw stronger conclusions and better guide edamame breeders, growers, processors, and consumers. Improving communication is also important to consolidate best production practices, including irrigation methods and standard harvest procedures (e.g., precooling strategies).
In our previous report (Carneiro et al., 2021), we described that the check-all-that-apply (CATA) answered by our sensory panelists investigated only flavor descriptors. In future sensory studies, the inclusion of appearance descriptors to the CATA questions could be valuable to better explain AL scores and the impact of specific appearance characteristics in overall acceptability of edamame. However, there is still a need for a standardized vocabulary (lexicon) that includes appearance terms to describe edamame pods and beans (Carneiro et al., 2020). Additionally, due to the limited amount of edamame pods, only shelled edamame beans were served in the sensory panels. Thus, samples tested by our panelists were closer to what consumers would see and consume in a salad, which was assessed in the WTP questions. Our statistical analysis showed that the a* axis of the color space was affected by the interaction factor “location*year,” and significant differences among genotypes were observed in the b* color coordinate (yellowness). AL was significantly correlated with OL, a*, and GI, but no color characteristic was significantly correlated with overall acceptability scores. Descriptive sensory methods and focus group discussions are possible tools that can be applied in future research to guide further development of color standards. The need for further studies on color and appearance of edamame is also supported by the fact consumers in the USA are willing to pay more for dark green edamame beans in a salad ($0.77 more than light green edamame beans).
Although the appearance of pods is an important quality characteristic of edamame, it was not evaluated by our sensory panel. However, pod dimensions (length, width, and thickness) and pod pubescence (hairs per 2.4 cm2) of all 10 genotypes evaluated in this study were analyzed by Lord et al. (2021). As reported by the authors, harvest occurred when plants reached the R6 stage and the immature edamame seeds (green color) reached 80–90% of their pod capacity. Genotype had a significant effect on pod length (range: 40–51 mm average) and pod pubescence, but did not have a significant effect on pod width (range: 10.9–12.2 mm average) and thickness (range: 6.5–8.1 mm average). Lord et al. (2021) also reported that genotype had a significant effect on other agronomic characteristics such as 10-pod sample weights and proportion of one-seeded pods and the advanced breeding lines R14-6450 and R15-10280 had the heaviest pods. In a recent study that analyzed edamame in the pods, Flores et al. (2019) measured color of pods of three edamame cultivars (Giant Midori, Kuroshinja, and Butterbean) and reported that only the a* color coordinate (greenness) was significantly different among genotypes. The authors also reported that higher AL scores were associated to greener color, as well as higher L* values (lightness).
Appearance is an important contributor to overall acceptability of edamame beans and it is often associated with quality of the product. GI (color index) and a* (red-green coordinate of the color space) showed significant correlation with AL scores and are suggested as indicators of edamame quality. Also, as consumers are willing to pay more for dark green edamame beans in a salad, color measurement can be used as a fast and affordable method to support breeding selection, monitor edamame quality (growers and processors), determine best storage conditions and preparation practices, and it also allows the selection of premium price products. Further research is needed to assist in the development of edamame color and appearance standards; focused discussions can be used in future studies to link subjective/visual measurement and green intensity (color index), for example. Further studies are also suggested to investigate the impact of other appearance attributes (e.g., size and glossiness of edamame beans) on consumer acceptability, and CATA questions containing appearance descriptors can be of great value to explain sensory evaluation data in future research. Additionally, minimizing possible sources of color and appearance variations pre- and post-harvest is of great importance as the edamame research continues in Virginia and other states in the USA.
The raw data supporting the conclusions of this article will be made available by the authors, without undue reservation.
The studies involving human participants were reviewed and approved by Virginia Tech Institutional Review Board (IRB) for Research Involving Human Subjects (IRB 18-310). The patients/participants provided their written informed consent to participate in this study.
RC wrote first draft. RC, CN, and SD contributed with conception and design of the study. RC, DY, and KA worked on edamame processing. RC and KA collected and analyzed consumer and color data. MB contributed with WTP data analysis. BZ led the development and selection of the edamame breeding lines. TK, SR, and MR led the field trials in the Virginia growing locations. All authors reviewed, edited, and approved the final version of the manuscript.
This work was supported by the USDA-NIFA (Grant No. 2018-51181-28384; Accession No. 436 1016465) and the Virginia Agricultural Experiment Station.
The authors declare that the research was conducted in the absence of any commercial or financial relationships that could be construed as a potential conflict of interest.
All claims expressed in this article are solely those of the authors and do not necessarily represent those of their affiliated organizations, or those of the publisher, the editors and the reviewers. Any product that may be evaluated in this article, or claim that may be made by its manufacturer, is not guaranteed or endorsed by the publisher.
The authors thank all the students and researchers of our edamame team for their hard work during the first two years of research. The authors also thank all volunteers that participated in the consumer studies, Drs. Hengjian Wang, Katherine Phetxumphou, and Jacob Lahne of the Virginia Tech Department of Food Science and Technology for their support throughout the project, and the Virginia Tech Statistical Applications and Innovations Group (SAIG) for their assistance with data analysis.
Amilia, W., Wiyono, A. E., Ferzia, D., Rusdianto, A. S., Suryaningrat, I. B., Mahardika, N. S., et al. (2021). Physical, chemical, and sensory characteristics of frozen salted edamame during storage at room temperature. Int. J. Food Agric. Nat. Resour. 2, 9–18. doi: 10.46676/ij-fanres.v2i1.20
Carneiro, R., Duncan, S., O'Keefe, S., Yu, D., Huang, H., Yin, Y., et al. (2021). Utilizing consumer perception of edamame to guide new variety development. Front. Sustain. Food Syst. 4, 556580. doi: 10.3389/fsufs.2020.556580
Carneiro, R. C. V., Duncan, S. E., O'Keefe, S. F., Yin, Y., Neill, C. L., and Zhang, B. (2020). Sensory and consumer studies in plant breeding: a guidance for edamame development in the U.S. Front. Sustain. Food Syst. 4, 124. doi: 10.3389/fsufs.2020.00124
Daly, A., Hess, S., and Jong, G.. (2012). De Calculating errors for measures derived from choice modelling estimates. Transportation Res. Part B 46, 333–341. doi: 10.1016/j.trb.2011.10.008
Edelenbos, M., Thybo, A., Erichsen, L., Wienberg, L., Andersen, L., and Edelenbos, M. (2001). Relevant measurements of green pea texture. J. Food Qual. 24, 91–110. doi: 10.1111/j.1745-4557.2001.tb00594.x
Flores, D., Giovanni, M., Kirk, L., and Liles, G. (2019). Capturing and explaining sensory differences among organically grown vegetable-soybean varieties grown in northern California. J. Food Sci. 84, 613–622. doi: 10.1111/1750-3841.14443
Lawless, H. T., and Heymann, H. (2010). Sensory Evaluation of Food Principles and Practices (Second). New York, NY: Springer. doi: 10.1007/978-1-4419-6488-5
Lord, N., Kuhar, T., Rideout, S., Sutton, K., Alford, A., Li, X., et al. (2021). Combining agronomic and pest studies to identify vegetable soybean genotypes suitable for commercial edamame production in the Mid-Atlantic U.S. Agric. Sci. 12, 738–754. doi: 10.4236/as.2021.127048
Masuda, R (1991). “Quality requirement and improvement of vegetable soybean,” in Vegetable Soybean: Research Needs for Production and Quality Improvement, ed S. Shanmugasundaram (Taiwan: Asian vegetable research and Development Center), 92–102.
Moseley, D., Silva, M. P., Mozzoni, L., Orazaly, M., Florez-Palacios, L., Acuña, A., et al. (2021). Effect of planting date and cultivar maturity in edamame quality and harvest window. Front. Plant Sci. 11, 585856. doi: 10.3389/fpls.2020.585856
Mozzoni, L. A., Chen, P., Morawicki, R. O., Hettiarachchy, N. S., Brye, K. R., and Mauromoustakos, A. (2009). Quality attributes of vegetable soybean as a function of boiling time and condition. Int. J. Food Sci. Technol. 44, 2089–2099. doi: 10.1111/j.1365-2621.2009.02038.x
Neill, C. L., and Morgan, K. L. (2021). Beyond scale and scope: exploring economic drivers of U.S. specialty crop production with an application to edamame. Front. Sustain. Food Syst. 4, 582834. doi: 10.3389/fsufs.2020.582834
Pathare, P. B., Linus Opara, U., and Al-Said, F. A.-J. (2013). Colour measurement and analysis in fresh and processed foods: a review. Food Bioprocess Technol. 6, 36–60. doi: 10.1007/s11947-012-0867-9
Keywords: sensory, willingness-to-pay (WTP), vegetable soybean, Glycine max (L) Merr, specialty crop
Citation: Carneiro R, Adie K, Yu D, Beverly M, Neill C, Zhang B, Kuhar T, Rideout S, Reiter M, Huang H, O'Keefe S and Duncan S (2022) Understanding the Role of Overall Appearance and Color in Consumers' Acceptability of Edamame. Front. Sustain. Food Syst. 6:738453. doi: 10.3389/fsufs.2022.738453
Received: 08 July 2021; Accepted: 04 April 2022;
Published: 29 April 2022.
Edited by:
Rakesh Bhardwaj, National Bureau of Plant Genetic Resources (ICAR), IndiaReviewed by:
Alexandru Rusu, Biozoon Food Innovations GmbH, GermanyCopyright © 2022 Carneiro, Adie, Yu, Beverly, Neill, Zhang, Kuhar, Rideout, Reiter, Huang, O'Keefe and Duncan. This is an open-access article distributed under the terms of the Creative Commons Attribution License (CC BY). The use, distribution or reproduction in other forums is permitted, provided the original author(s) and the copyright owner(s) are credited and that the original publication in this journal is cited, in accordance with accepted academic practice. No use, distribution or reproduction is permitted which does not comply with these terms.
*Correspondence: Susan Duncan, ZHVuY2Fuc0B2dC5lZHU=
†Present addresses: Renata Carneiro, Department of Chemistry and Fermentation Sciences, Appalachian State University, Boone, NC, United States
Clinton Neill, Dyson School of Applied Economics and Management, Cornell University, Ithaca, NY, United States
Disclaimer: All claims expressed in this article are solely those of the authors and do not necessarily represent those of their affiliated organizations, or those of the publisher, the editors and the reviewers. Any product that may be evaluated in this article or claim that may be made by its manufacturer is not guaranteed or endorsed by the publisher.
Research integrity at Frontiers
Learn more about the work of our research integrity team to safeguard the quality of each article we publish.