 Yiming Liu
 Danyu Kong2
 Sabine Douxchamps
 Mary Atieno
 Bin Xu
 Guodao Liu
94% of researchers rate our articles as excellent or good
Learn more about the work of our research integrity team to safeguard the quality of each article we publish.
Find out more
ORIGINAL RESEARCH article
Front. Sustain. Food Syst., 29 March 2022
Sec. Climate-Smart Food Systems
Volume 6 - 2022 | https://doi.org/10.3389/fsufs.2022.725656
This article is part of the Research TopicRealizing Livelihood and Environmental Benefits of Forages in Tropical Crop-Tree-Livestock SystemsView all 16 articles
Tropical areas have a large distribution of saline soils and tidal flats with a high salinity level. Salinity stress is a key factor limiting the widespread use of tropical forage such as Stylosanthes guianensis (Aubl.) Sw. This study was designed to screen the salinity tolerance of 84 S. guianensis accessions; In a greenhouse experiment, plants were subjected to Hoagland solution or Hoagland solution with 200 mM NaCl for up to 15 days. Salinity tolerant accession CIAT11365 and salinity sensitive accession FM05-2 were obtained based on withered leaf rate (WLR). Further verification of salinity tolerance in CIAT11365 and FM05-2 with different salinity gradients showed that salinity stress increased WLR and decreased relative chlorophyll content (SPAD), maximum photochemical efficiency of photosystem II (Fv/Fm), and photosynthetic rate (Pn) in FM05-2, but CIAT11365 exhibited lower WLR and higher SPAD, Fv/Fm, and Pn. Leaf RNA-Seq revealed that Ca2+ signal transduction and Na+ transport ability, salinity tolerance-related transcription factors and antioxidant ability, an increase of auxin, and inhibition of cytokinin may play key roles in CIAT11365 response to salinity stress. The results of this study may contribute to our understanding of the molecular mechanism underlying the responses of S. guianensis to salinity stress and also provide important clues for further study and in-depth characterization of salinity resistance breeding candidate genes in S. guianensis.
Soil salinity is a major limiting factor in agriculture in terms of yield and productivity (Munns and Tester, 2008). Most forage species are salt sensitive; the effect of NaCl on forage is caused by both the reduction of water availability caused by high Na+ concentration and the toxic effect of Na+ and Cl− on plants. Elucidating salinity-tolerant mechanisms, mining salinity-tolerant genes, and improving crop salinity tolerance are good strategies to deal with increased saline soil (Deinlein et al., 2014). Research on the salt-tolerant mechanism of plant includes forage, improvement, and utilization of saline soil, which have become the focus of recent studies (Abiala et al., 2018; Zelm et al., 2020; Zhao et al., 2020).
Stylo (Stylosanthes spp.) is an important forage legume that is grown in tropical and subtropical areas, mainly used for pasture and green manure. The Chinese Academy of Tropical Agricultural Sciences (CATAS) introduced more than 500 Stylo accessions to China from the International Center for Tropical Agriculture (CIAT) or other countries since the 1960's. Stylo has become a very important tropical forage legume in tropical areas of China. Till now, CATAS has cultivated 15 nationally approved Stylo varieties (Huang et al., 2017). Stylosanthes guianensis (Aubl.) Sw. is one of the most important species in Stylosanthes spp., a subshrub with height ranging from 0.6 to 1.2 m and a stem diameter of 0.3–0.8 cm, which grows well in tropical and subtropical climates, and is adapted to acid and drought soils. S. guianensis also has the earliest origin, the most branches, the richest genetic diversity, and the widest distribution in Stylosanthes spp. Almost half of stylo accessions in the CATAS seed bank are S. guianensis (249 accessions) (Jiang et al., 2017).
Coastal saline soils and tidal flats are distributed in vast areas in tropical regions (Ivushkin et al., 2019), and have an adverse effect on tropical forage yield and quality. Screening of salinity-tolerant tropical forage such as Stylo is a sustainable and economical viable option of improving and utilizing such coastal saline soils. Previous studies have shown the high variation of salinity tolerance in 67 accessions from 23 species of Stylosanthes spp., S. erecta P.Beauv. CIAT11900, and S. hippocompoides Mohlenbr. Fine stem, S. hamata (L.) Taub. CIAT1010, S. fruticosa (Retz.) Alston CIAT11052, S. debilis M.B. Ferreira & Sousa Costa CIAT11927, and S. hamata Verano have the relatively best salinity tolerance with 200 mM NaCl for 15 days. Only 10 S. guianensis accessions were evaluated for their salinity tolerance and most of them had intermediate- or above-level performance (Liu et al., 2017). Considering the high biomass advantage and the high diversity of S. guianensis, it is essential to evaluate the salinity tolerance of S. guianensis in a wider range of accessions and explore the molecular mechanism of response to salinity stress.
The objectives of this study were to (1) Examine the salinity tolerance of 84 accessions of S. guianensis; (2) Clarify the performance of salinity-tolerant and salinity-sensitive S. guianensis with different salinity concentrations; and (3) Explore the salinity-tolerant mechanisms and differentially expressed genes (DEGs) by transcriptomic analysis.
This study was carried out in the greenhouses of CATAS, Danzhou, Hainan, China. A total of 84 S. guianensis accessions were screened for their salinity tolerance (Supplementary Material 1). About 6- to 8-cm-long stems of each S. guianensis accessions were taken from the field gene bank of CATAS, wrapped with sponge, and planted on a foam board. The foam board was floated in a plastic box (110 × 90 × 20 cm) filled with 40 L Hoagland solution. Pumps supply with oxygen to each plastic box. The equivalent of water lost through evaporation and transpiration was supplied into the plastic box every day, and solutions were changed every week. Salinity treatment was conducted with 200 mM NaCl after 2 months' cultivation when the height of seedlings reached 20–25 cm; NaCl concentration was gradually increased to 200 mM by adding 50 mM NaCl per 12 h to avoid sudden death. Withered leaf rate (WLR) was measured at 15 days of salinity treatment; and a few yellow leaves were removed before salt treatment to avoid impact of WLR. WLR (%) = number of leaves with withered symptoms more than 50%/total number of leaves × 100 (Liu et al., 2017).
A split plot design was used with salt stress treatments as the main plots and the accessions as the subplots. Each treatment had 3 replicates. The 84 S. guianensis accessions grown in the plastic box were randomly placed.
Two S. guianensis accessions, CIAT11365 (salinity tolerant, ST) and FM05-2 (salinity sensitive, SS), were selected based on experiment 1. Seeds of both accessions were sowed into plastic pots with 20 cm diameter and 24 cm height, filled with sand. Plants were maintained in the greenhouse for 2 months and then treated with 100, 200, 300, and 400 mM NaCl. Both accessions were irrigated daily with 400 ml of Hoagland solution or salt solution for 15 days, and the redundant solution at the bottom of the pot was drained to avoid salinity accumulation. Each treatment had 4 replicates. The exposure of plants to increasing salt concentration allowed a gradual acclimation to salinity conditions to avoid sudden death at high salt concentration. Leaf samples were collected at 5 days with 200 mM NaCl for transcriptomic analysis.
WLR, relative chlorophyll content (SPAD), maximum photochemical efficiency of photosystem II (Fv/Fm), and photosynthetic rate (Pn) were estimated in this experiment. SPAD value was measured on upper-middle leaves with a SPAD meter (TYS-B, Zhejiang, China); Fv/Fm was estimated with a chlorophyll fluorometer (PAM-2500, Heinz Walz GmbH, Effeltrich, Germany) after leaves were dark-adapted for 15 min, and Pn was measured using a portable photosynthesis system (Li-6400 XT, LICOR, Inc, Lincoln, NE, USA).
Total RNA was extracted using Trizol reagent (Invitrogen, CA, USA) purified using the RNeasy Plant Mini kit (Qiagen) according to the manufacturer's protocol. RNA purity was checked using the kaiaoK5500®spectrophotometer (Kaiao, Beijing, China); RNA integrity and concentration were assessed using the RNA Nano 6000 Assay Kit of the Bioanalyzer 2100 system (Agilent Technologies, CA, USA) and agarose gel electrophoresis.
A total amount of 2 μg of RNA per leaf sample was used for the RNA sample preparations, sequencing libraries were generated using NEBNext® Ultra™ RNA Library Prep Kit for Illumina® (#E7530L, NEB, USA) following the manufacturer's recommendations, and index codes were added to attribute sequences to each sample. mRNA was purified from total RNA using poly-T oligo-attached magnetic beads. Fragmentation was carried out using divalent cations under elevated temperature in NEBNext First-Strand Synthesis Reaction Buffer (5X). First-strand cDNA was synthesized using random hexamer primer and RNase H. Second-strand cDNA synthesis was subsequently performed using buffer, dNTPs, DNA polymerase I, and RNase H. The library fragments were purified with QiaQuick PCR kits and eluted with EB buffer, and then terminal repair, A-tailing, and the added adapter were implemented. The aimed products were retrieved, PCR was performed to complete the library. Preliminary quantification of RNA concentration of library was obtained using Qubit® RNA Assay Kit in Qubit® 3.0 then diluted to 1 ng/μl. Insert size was assessed using the Agilent Bioanalyzer 2100 system (Agilent Technologies, CA, USA), and qualified insert size was accurately quantified using the StepOnePlus™ Real-Time PCR System (Library valid concentration >10 nM). The clustering of the index-coded samples was performed on a cBot cluster generation system using HiSeq PE Cluster Kit v4-cBot-HS (Illumina) according to the manufacturer's instructions. After cluster generation, the libraries were sequenced on an Illumina platform and 150-bp paired-end reads were generated.
De novo assembly was employed to construct transcripts from these RNA-Seq reads because of the absence of reference genomic sequences. Trinity software was used for de novo assembly of the Illumina reads. For a quality control before subsequent analysis, raw data were processed with Perl scripts. The raw reads were processed by removing reads containing adapter, the adaptor-polluted reads, the low-quality reads, and reads with number of N bases accounting for more than 5%. The obtained Clean Data after filtering will be subjected to statistics analyses on its quality, including Q30, data quantity and quality, base content statistics, etc.
The software Trinity was used for de novo assembly, which was developed at the Broad Institute and the Hebrew University of Jerusalem. Trinity represents a novel method for the efficient and robust de novo reconstruction of transcriptomes from RNA-seq data. Trinity partitions the sequence data into many de Bruijn graphs, each representing the transcriptional complexity at a given gene or locus. Each graph was processed independently to extract the full-length splicing isoforms and to tease apart transcripts derived from paralogous genes.
Trinotate was used for performing the functional annotation of unigenes and ORFs. Trinotate is a comprehensive annotation suite designed for automatic functional annotation of transcriptomes, particularly for de novo assembled transcriptomes, from model to non-model organisms. Trinotate makes use of a number of different well-referenced methods for functional annotation including homology search to known sequence data (BLAST+/SwissProt), protein domain identification (HMMER/PFAM), protein signal peptide and transmembrane domain prediction (singalP/tmHMM), and comparison to current annotation databases (EMBL Uniprot eggNOG/GO Pathways databases).
Read count for each gene in each sample was counted by HTSeq v0.6.0, and RPKM (Reads Per Kilobase Millon Mapped Reads) was then calculated to estimate the expression level of genes in each sample (Guo et al., 2013). DEGseq v1.18.0 was used for differential gene expression analysis between two samples with non-biological replicates. Under the assumption that the number of reads deriving from a gene (or transcript isoform) follows a binomial distribution, DEGseq is proposed based on MA plot and widely used for differential gene expression analysis. The p-value could be assigned to each gene and adjusted by the Benjamini and Hochberg's approach for controlling the false discovery rate. Genes with q ≤ 0.05 and |log2_ratio| ≥ 1 are identified as DEGs. DESeq (v1.16) was used for differential gene expression analysis between two samples with biological replicates using a model based on the negative binomial distribution. The p-value could be assigned to each gene and adjusted by the Benjamini and Hochberg's approach for controlling the false discovery rate. Genes with q ≤ 0.05 and |log2_ratio| ≥ 1 are identified as DEGs.
The GO (Gene Ontology, http://geneontology.org/) enrichment of DEGs was implemented by the hypergeometric test, in which p-value is calculated and adjusted as q-value, and data background is genes in the whole genome. GO terms with q < 0.05 were considered to be significantly enriched. GO enrichment analysis could exhibit the biological functions of the DEGs. KEGG (Kyoto Encyclopedia of Genes and Genomes, http://www.kegg.jp/) is a database resource containing a collection of manually drawn pathway maps representing our knowledge on the molecular interaction and reaction networks. The KEGG enrichment of DEGs was implemented by the hypergeometric test, in which p-value was adjusted by multiple comparisons as q-value. KEGG terms with q < 0.05 were considered to be significantly enriched.
The expression of selected genes was validated by quantitative real-time PCR (qRT-PCR); the same RNA samples as the RNA-seq library construction were used. First-strand cDNA fragments were synthesized using the cDNA synthesis kit (Fermentas, Burlington, Ontario, Canada). Gene primers were designed using Primer 5 software. Ef1A gene was used as reference gene. Each sample had three biological replicates and each biological replicate had three technical replicates; 20 μl of reaction includes 5 μl of cDNA, 10 μl of 2 × SYBR® Premix Ex Taq™ (Tli RNaseH Plus), and 0.5 μl of the forward and reverse primers. The synthesis reaction lasted 39 cycles at 95°C for 10 S and 60°C for 34 S.
All data were subjected to analysis of variance (SAS 8.1; SAS Institute Inc., Cary, NC). Differences among the mean values were assessed by the least significant difference (LSD) test at p = 0.05.
WLR showed that S. guianensis accessions had large variation in salinity tolerance (Figure 1). Schofield, L1-82, CIAT25, NF01078, Fitzory, Oxley, TPRC90139, ReyanNo.5, CIAT11365, CIAT10594, USF873015, and CIAT10390 had relatively lower WLR (<14%) at 15 days of 200 mM NaCl stress, and these accessions were considered to be salinity tolerant. In contrast, CIAT74, GC1557, GC1480, FM05-2, CIAT11369, E9, TPRC87, CIAT11279, CIAT75, GC1517, CIAT2950, and CIAT2659 were considered to be salt-sensitive accessions with a relatively higher WLR (>96%) at 15 days of 200 mM NaCl stress.
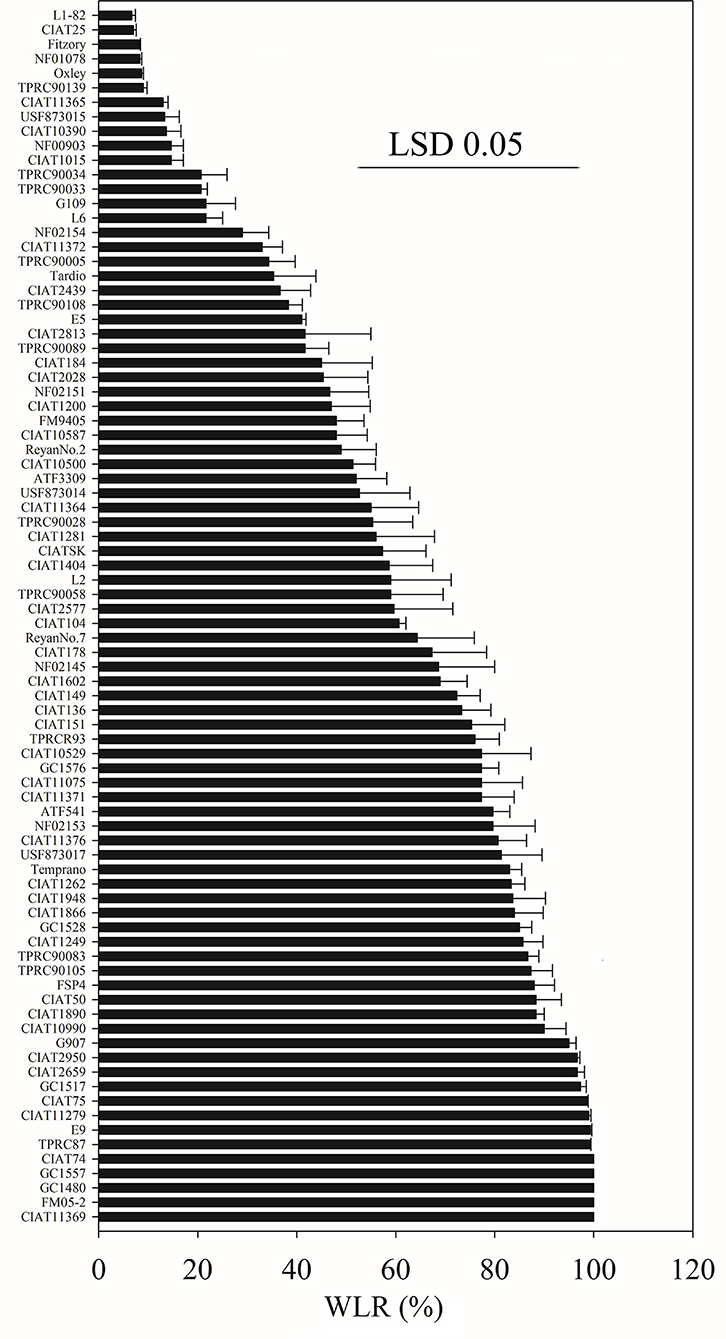
Figure 1. The range in WLR vertical bars of 84 S. guianensis accessions treated with 200 mM NaCl for 15 days. The LSD 0.05 was 45.39. Values are means (n = 3).
Based on WLR (Figure 1), two accessions, CIAT11365 (salinity tolerant, ST) and FM 05-2 (salinity sensitive, SS), were selected for physiological responses at different salinity levels, and the result showed that ST can survive at 15 days of 200 mM treatment (WLR = 46.67%) whereas SS almost have no green leaves left (WLR = 100%) (Figures 2, 3). WLR, SPAD, Fv/Fm, and Pn showed that ST and SS had a decline trend under 100–400 mM NaCl treatment, but ST had a significant higher value of WLR, SPAD, Fv/Fm, and Pn at 15 days of 100–200 mM NaCl treatment than SS (Figure 3).
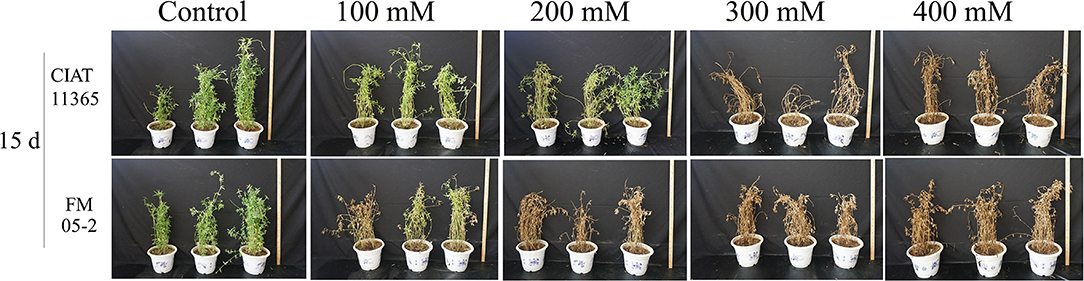
Figure 2. Phenotype of two S. guianensis accessions CIAT11365 (salinity tolerant, ST) and FM05-2 (salinity sensitive, SS) under different NaCl concentrations (100–400 mM) at 15 days.
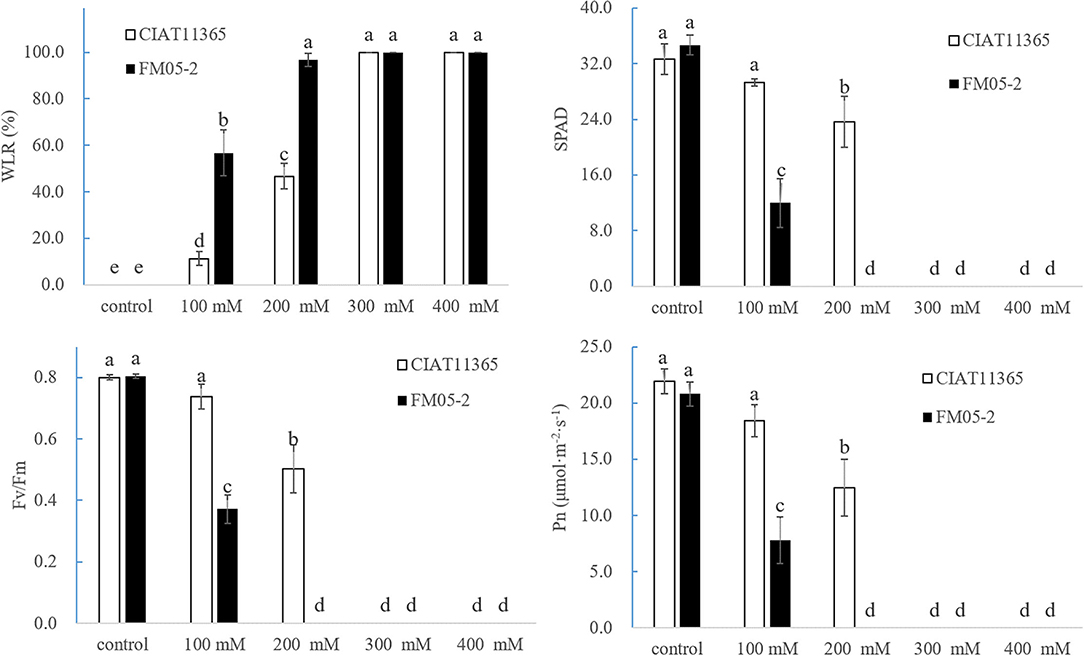
Figure 3. Effect of different salinity concentrations to WLR, SPAD, Fv/Fm, and Pn in ST and SS. ST, CIAT11365; SS, FM05-2.
An overview of the RNA-Seq reads is presented in Supplementary Material 2. A total of 151,356 contigs were obtained from the clean reads with a mean length of 1,118.6 bp and length ranging from 201 to 16,419 bp (Supplementary Material 3). Among the 151,356 contigs, 74,515 unigenes were obtained with an average length of 879.4 bp. The length of a unigene ranged from 201 bp to 16,419 bp; N50 was 1,617 bp and N90 was 320 bp. RNA-seq data from this article can be found in the NCBI SRA database under the BioProject ID: PRJNA771864.
The unigenes were annotated by searching against the seven public databases (Supplementary Material 4). A total of 38,426 unigenes (51.57%) were matched in the NR database, 30,953 (41.54%) in the BLASTX database, 30,420 (40.82%) in the Prot database, 29,963 (40.21%) in the GO database, and 23,209 (31.15%) in the PFAM database. A total of 50,529 unigenes (67.81%) were successfully annotated in NR, BLASTX, Prot, GO, PFAM, BLASTP, NT, eggnog, KO, TmHMM, or SignalP databases.
For GO analysis, there were 29,963 unigenes divided into three ontologies (Figure 4). “Cellular process”-, “metabolic process”-, and “single-organism process”-related genes were mainly included in the biological process category; “cell part”-, “organelle”-, and “organelle part”-related genes were mainly included in the cellular component category; for the molecular function category, “binding,” “catalytic,” and “transporter” were the main genes. There were 14,313 unigenes assigned to KOG classification divided into 26 function classes (Figure 5). The top 4 classes were “General functional prediction only” (2,143), “Translation, ribosomal structure, and biogenesis” (1,973), “Posttranslational modification, protein turnover, chaperones” (1,555), and “Energy production and conversion” (1,252), respectively.
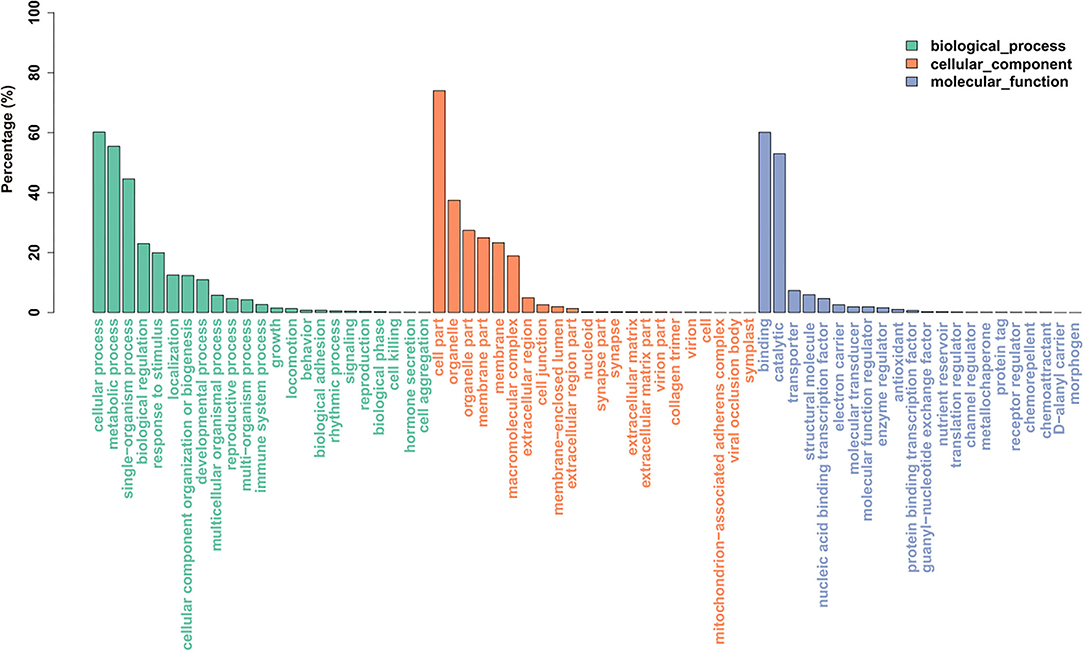
Figure 4. Histogram of gene ontology (GO) classification. The results are summarized in three main categories: biological process, cellular component, and molecular function.
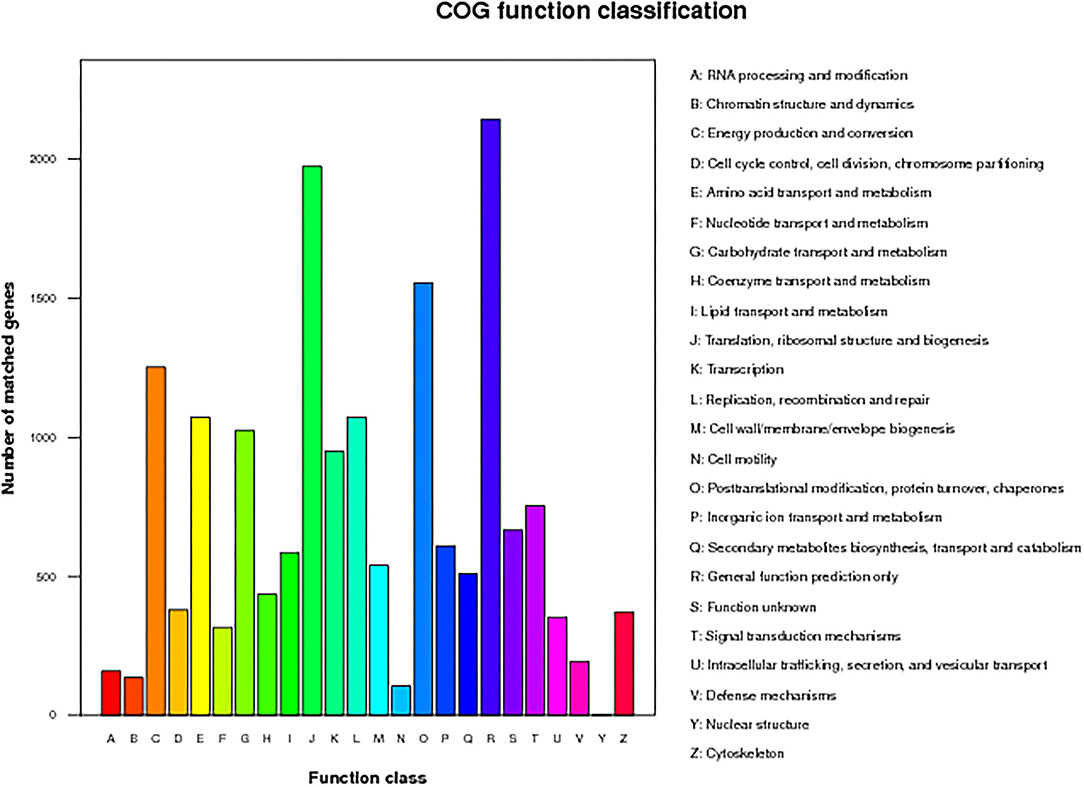
Figure 5. The euKaryotic Ortholog Groups (KOG) annotation of putative proteins. All 14,313 putative proteins showing significant homology to those in the KOG database were functionally classified into 26 molecular families.
DEGs (padj<q ≤ 0.05 and log2FoldChange|log2_ratio| ≥ 1) were identified between 4 comparisons, including A (control ST_control SS), B (salt ST_control ST), C (salt SS_ control SS), and D (salt ST_salt SS). The number of DEGs detected in A, B, C, and D were 6,892, 1,199, 2,080, and 4,706, respectively (Figure 6). DEGs are clustered by hierarchical clustering using up and down gene regulation and gene enrichment analysis (Figure 7). The blue color represents low gene expression quantity, and the yellow represent high gene expression quantity. Figure 6 showed that more DEGs were detected in comparison A and D than in B and C, suggesting that there are more DEGs in different accessions than in the same accession, and more up-expressed genes in salt and control of ST than in salt and control of SS (Figure 7).
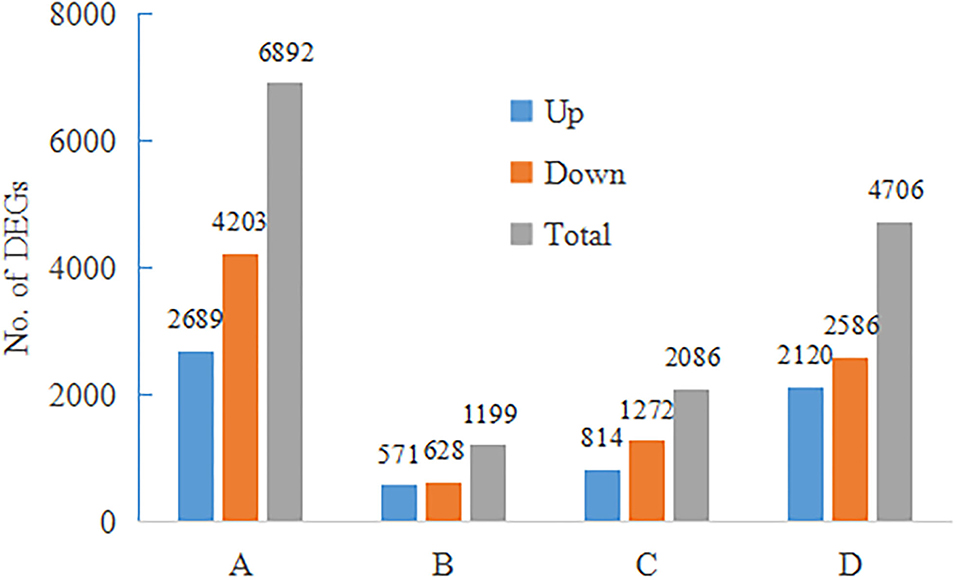
Figure 6. Differentially expressed genes (DEGs) were identified between 4 comparisons, including A (control ST_control SS), B (salt ST_control ST), C (salt SS_ control SS), and D (salt ST_salt SS).
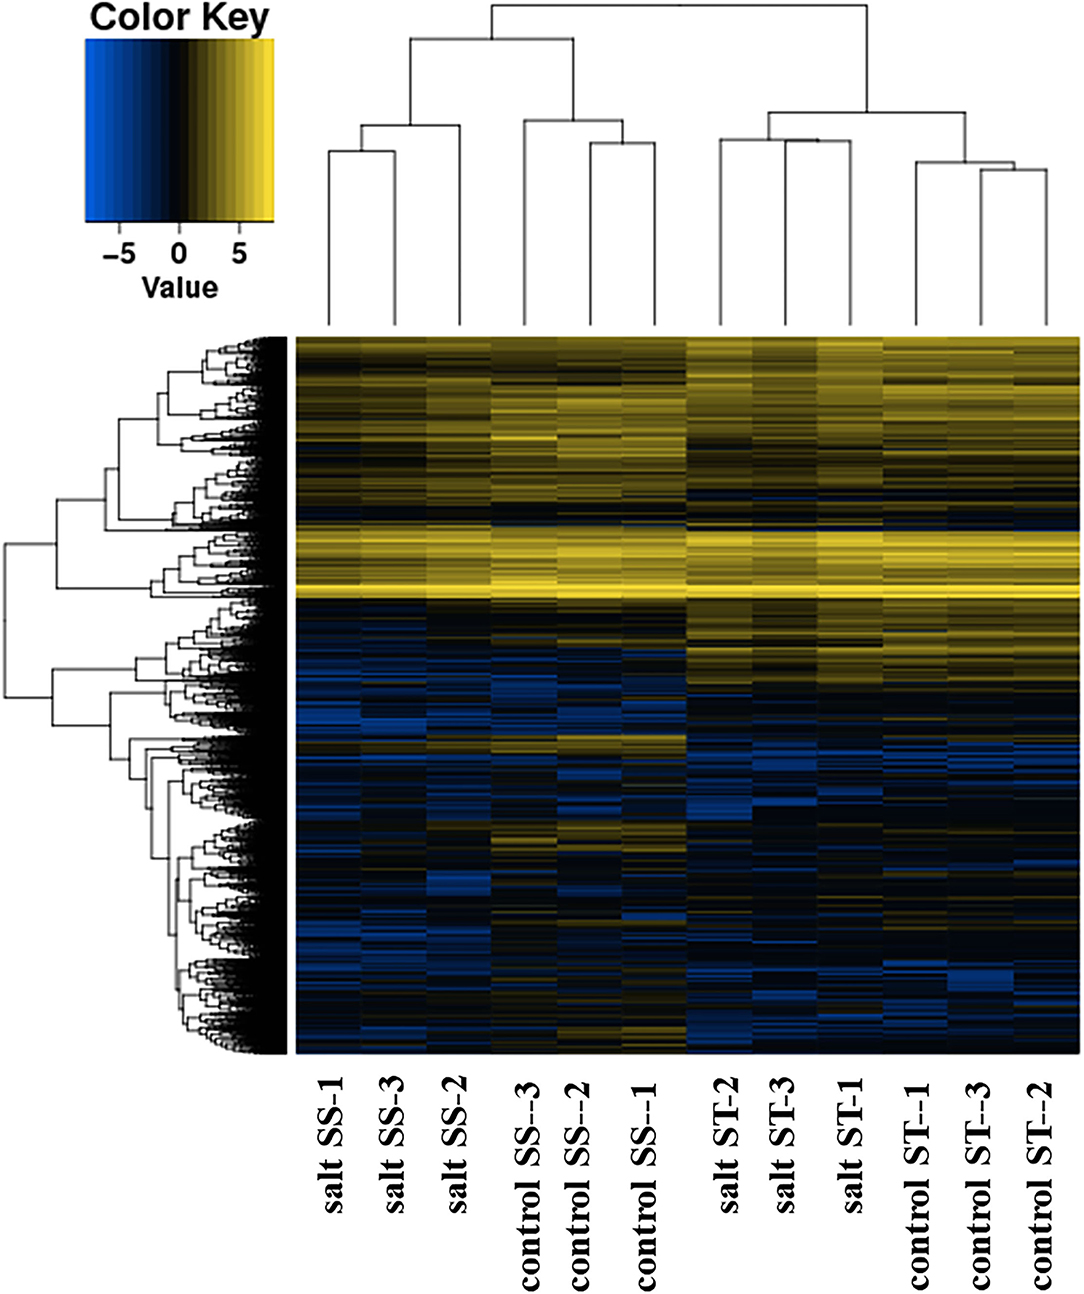
Figure 7. Hierarchical clustering of the differentially expressed genes.
Venn diagram analysis revealed the unigenes were overlapping between the four comparisons (Figure 8). There were (a) 74 DEGs in two hybrid combinations of B and D, 18 DEGs in two hybrid combinations of B, C, and D, and 282 DEGs in two hybrid combinations of B and C; and (b) 74 DEGs in two hybrid combinations of A, B, and C, and 58 DEGs in four hybrid combinations of A, B, C, and D. The DEGs were either up- or downregulated; those five groups may contain the most important DEGs that contributed to the salinity tolerance of ST.
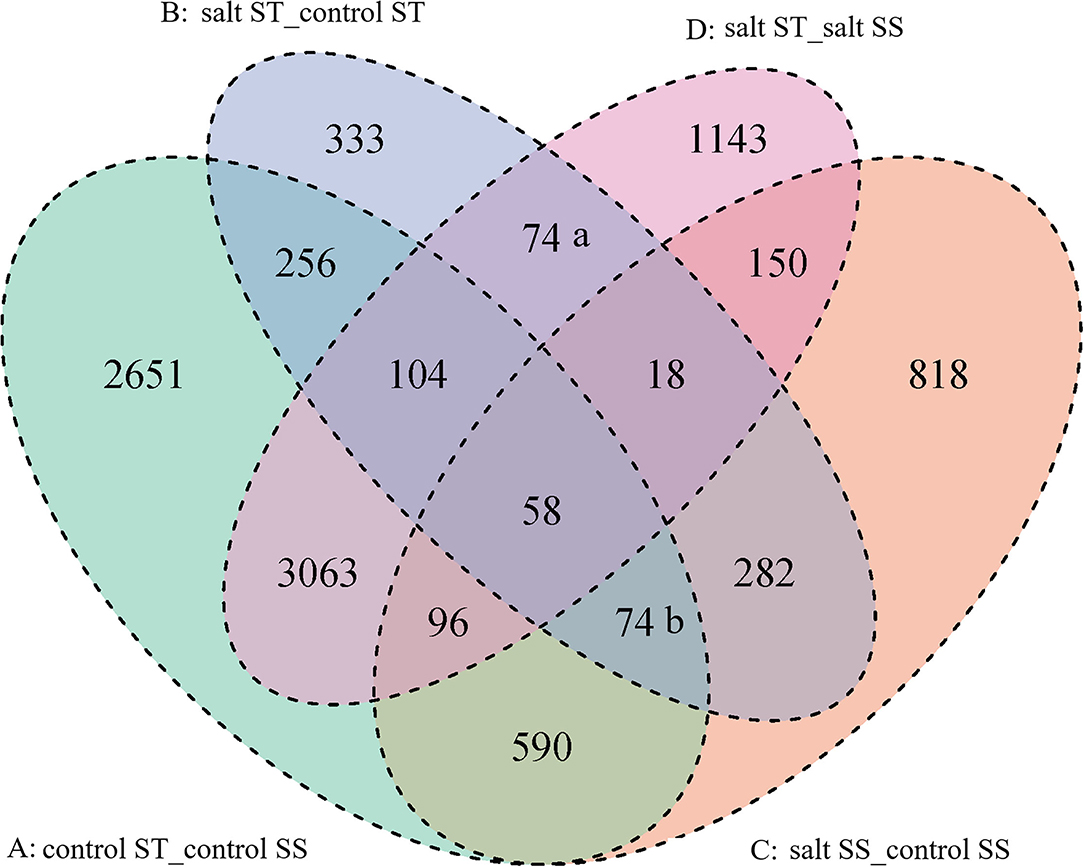
Figure 8. Venn diagram of differentially expressed genes. The sum of the numbers in each large circle represents the total number of differentially expressed genes between comparison, and the overlap part of the circles represents common differentially expressed genes between comparisons. ST: salinity-tolerant accession CIAT11365, SS: salinity-sensitive accession FM 05-2.
Heatmap of KEGG pathway enrichment analysis for DEGs showed that circadian rhythm-plant was a special pathway in comparison to salt ST_control ST; pentose phosphate pathway, glutathione metabolism, carbon fixation in photosynthetic organisms, and oxidative phosphorylation were special pathways in comparison to salt ST_salt SS; and plant hormone signal transduction was a common pathway in comparison to control ST_control SS, salt SS_ control SS, and salt ST_control ST but not enriched in salt ST_control ST (Figure 9).
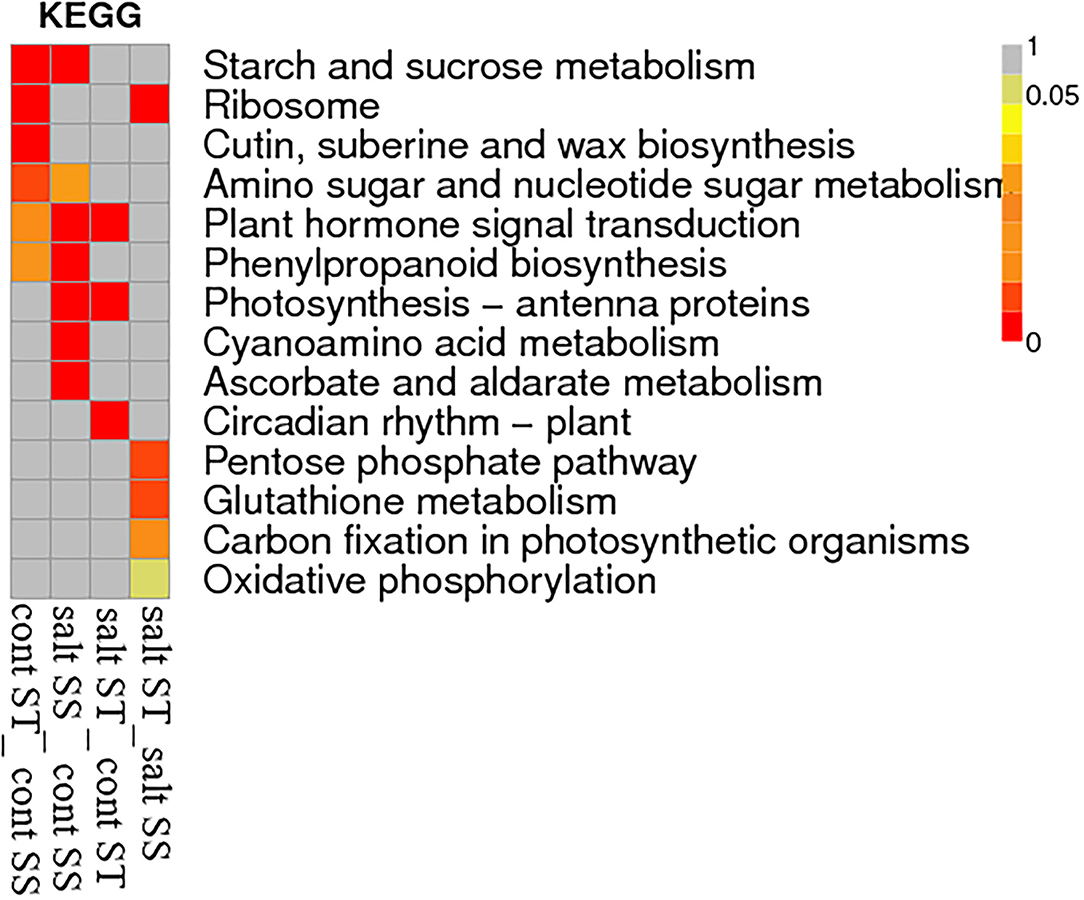
Figure 9. Heatmap of KEGG pathway enrichment analysis for DEGs of four comparisons, namely, control ST_control SS, salt ST_control ST, salt SS_ control SS, and salt ST_salt SS.
To validate the data from RNA-sequencing, 41 DEGs mainly including salt response genes from 74 (a), 282, 18, 74 (b), and 58 groups of Venn diagram were selected for real-time RT-PCR analysis in ST and SS accessions in response to salt stress (Figure 8). The primers of selected genes are listed in Supplementary Material 5. The qRT-PCR results showed a strong correlation with the RNA-seq-generated data (Table 1). Among the 41 DEGs, 14 had a significant difference between salt ST and salt SS according to the RT-PCR result (Table 4 in Supplementary Material 6), 12 DEGs in salt ST had a significant increase compared to salt SS, and 2 DEGs in salt ST had a significant decrease compared to salt SS. The functions of the 12 increased DEGs are mainly ion transporter (c25614_g1, c34374_g1, c34262_g1, c34502_g2, and c34262_g2), plant hormone (c38854_g1 and c40459_g1), antioxidant enzyme (c41938_g5), transcription factor (c32634_g1), aquaporin (c18276_g1), and other functions (c41881_g1 and c32133_g1). The functions of the 2 decreased DEGs are mainly redoxin (c33369_g1) and disease resistance protein (c33712_g1).

Table 1. Comparisons of RNA-Seq and RT-PCR in 41 DEGs of ST and SS.
High variation of salinity tolerance in 84 S. guianensis accessions was observed according to WLR, ranging between relative salinity tolerant (ST) with 13.0% WLR at 15 days of 200 mM NaCl stress and relatively salinity sensitive (SS) with 100% WLR. The high variation of salinity tolerance may come from the high genetic diversity of S. guianensis (Tang et al., 2009; Jiang et al., 2017). Based on our previous study, WLR is a good physiological parameter for the screening of salinity-tolerant Stylosanthes spp. (Liu et al., 2017). This study showed that WLR is also a good parameter for S. guianensis accessions. WLR can reflect the salinity stress symptoms from the whole plant level. Other physiological parameters such as chlorophyll content or SPAD, Fv/Fm, Pn, EL and RWC are conventional and reliable.
The phenotype of two S. guianensis accessions ST and SS under different NaCl concentrations (100–400 mM) for 15 days confirmed that the screening result from WLR is reliable. SPAD, Fv/Fm, and Pn were further proof of different salinity tolerance between ST and SS, as these physiological parameters were consistant with WLR. Previous studies showed that the salinity-tolerant ability of Stylosanthes spp. is between 0.9% and 1.2% NaCl (Wu et al., 2013; Dong et al., 2017). In this study, phenotype and physiological parameters showed that salinity-tolerant S. guianensis ST can endure 100–200 mM NaCl, which confirms the findings of former studies, so that ST could be applied in moderate saline soil of tropical areas.
Ca2+ is one of the very important intracellular second messenger molecules involved in many signal transduction pathways in plants (Seifikalhor et al., 2019). The latest research showed that glycosyl inositol phosphorylceramide (GIPC) sphingolipids in the plasma membrane act as Na+ receptors for sensing Na+ in the apoplastic and then gate Ca2+ influx channels in plants (Jiang et al., 2019). Increased concentrations of the Ca2+ activate the classical salt overly sensitive (SOS) signaling pathway (SOS1, SOS2, and SOS3) (Zhang et al., 2021). The activity of the SOS1 exchanger is regulated through protein phosphorylation by the SOS2/SOS3 kinase complex; SOS2 is a Ser-Thr protein kinase belonging to the SNF1-related kinase (SnRK) family and SOS3 is a myristoylated Ca2+ sensor (Manishankar et al., 2018). Annexins are calcium-dependent lipid-binding proteins spread through the fungi, plants, animals, archaea, and prokaryotes, which exhibit the conserved core domains in their protein structure (Yadav et al., 2018). Annexins are Ca2+ and phospholipid binding proteins, facilitate Ca2+ conductance across the plasma membrane, and sense the Ca2+ changes in the cell (Saad and Ben Romdhane, 2020). Ca2+ transmembrane transport (c34262_g2) and annexin (c34262_g1) showed a significant increase in salt ST compared to salt SS, indicating that higher Ca2+ accumulation in ST cytoplasm may lead to activate SOS pathway or other salinity tolerance pathways in ST, which contribute to the high salinity tolerance of ST.
Cysteine-rich receptor-like kinases (CRKs) are one kind of upstream signaling molecules and act as sensing stress signals and responses to various abiotic stresses in plant (Zhang et al., 2018). About 37–170 members of the CRK family in monocots and dicots were found, but their physiological roles and functions on a biochemical and cellular level remain largely uncharacterized. A previous study found that the extracellular domains of typical CRKs contain two unknown function 26 (DUF26) configuration of conserved cysteines C-X8-C-X2-C, the DUF26 domain has antifungal activity and plays a crucial role in salt stress resistance (Zhang et al., 2009). Cysteine receptor-like protein kinase 25 (c41881_g3) showed a significant increase in salt ST compared to salt SS, indicating that CRK may contribute to the salinity tolerance of ST.
Maintaining a dynamic balance of ions under salinity stress is an important strategy for plants, salinity-tolerant plants maintain the ion balance by excreting Na+ out of the cell or compartmentalizing Na+ into the vacuole to avoid salinity damages (Zhao et al., 2020). Plasma membrane and vacuolar membrane transporters or ion channels such as Na+/H+ antiporters (NHX), Ca2+/H+ antiporter (CAX), high-affinity K+ transporter (HKT), Ca2+-activated vacuolar channel (TPK1/VK), and slow anion channel-associated 1 (SLAC1) play a leading role in mediating the excretion or deposit of Na+ in plants (Pantoja, 2021). In this study, cation/H+ antiporter (c25614_g1), nodulin MtN21/EamA-like transporter family protein (c34374_g1), and vacuolar amino acid transporter (c34502_g2) were significant increased in salt ST compared to salt SS, indicating that salinity stress upregulated many ion transporters, which led to a better ion homeostasis in ST.
Response to salinity stress requires the integration and coordination of multiple hormones such as abscisic acid (ABA), jasmonic acid (JA), gibberellic acid (GA), ethylene (ET), salicylic acid (SA), cytokinin (CKs), and auxin (Ryu and Cho, 2015). Auxin plays a major role in regulating plant growth and development. Some studies report that high salt stress is linked with greatly remodeled root architecture by altering auxin accumulation and its redistribution (Petersson et al., 2009; Wang et al., 2009). In this study, auxin-induced protein (c40459_g1) had a significant increase in salt ST compared to salt SS, indicating that auxin may increase in ST than in SS and contribute to salinity tolerance of ST. CKs are involved in many physiological and biochemical processes in plants, including cell division, reproductive capacity, leaf senescence, and adaptation to abiotic stresses; however, CKs play negative roles in plant salt tolerance (Yu et al., 2020). Cytokinin dehydrogenase (CKXs) is the key enzyme involved in CK metabolism and can effectively reduce the CK concentration in plants, an increase of CKXs has been shown to cause sensitivity to salt stress in Arabidopsis (Nishiyama et al., 2011). RT-PCR showed that CKXs (c38854_g1) had a significant increase in salt ST, and that in consequence zeatin biosynthesis KEGG pathway showed that CKX was significantly increased as well in salt ST compared to salt SS (Figure 10). A reduction of cytokinin biosynthesis in the root system and the subsequent reduction of the cytokinin supply in the shoot could alter the gene expression network and could elicit appropriate responses to ameliorate salinity stress (Tran et al., 2010; Nishiyama et al., 2011).
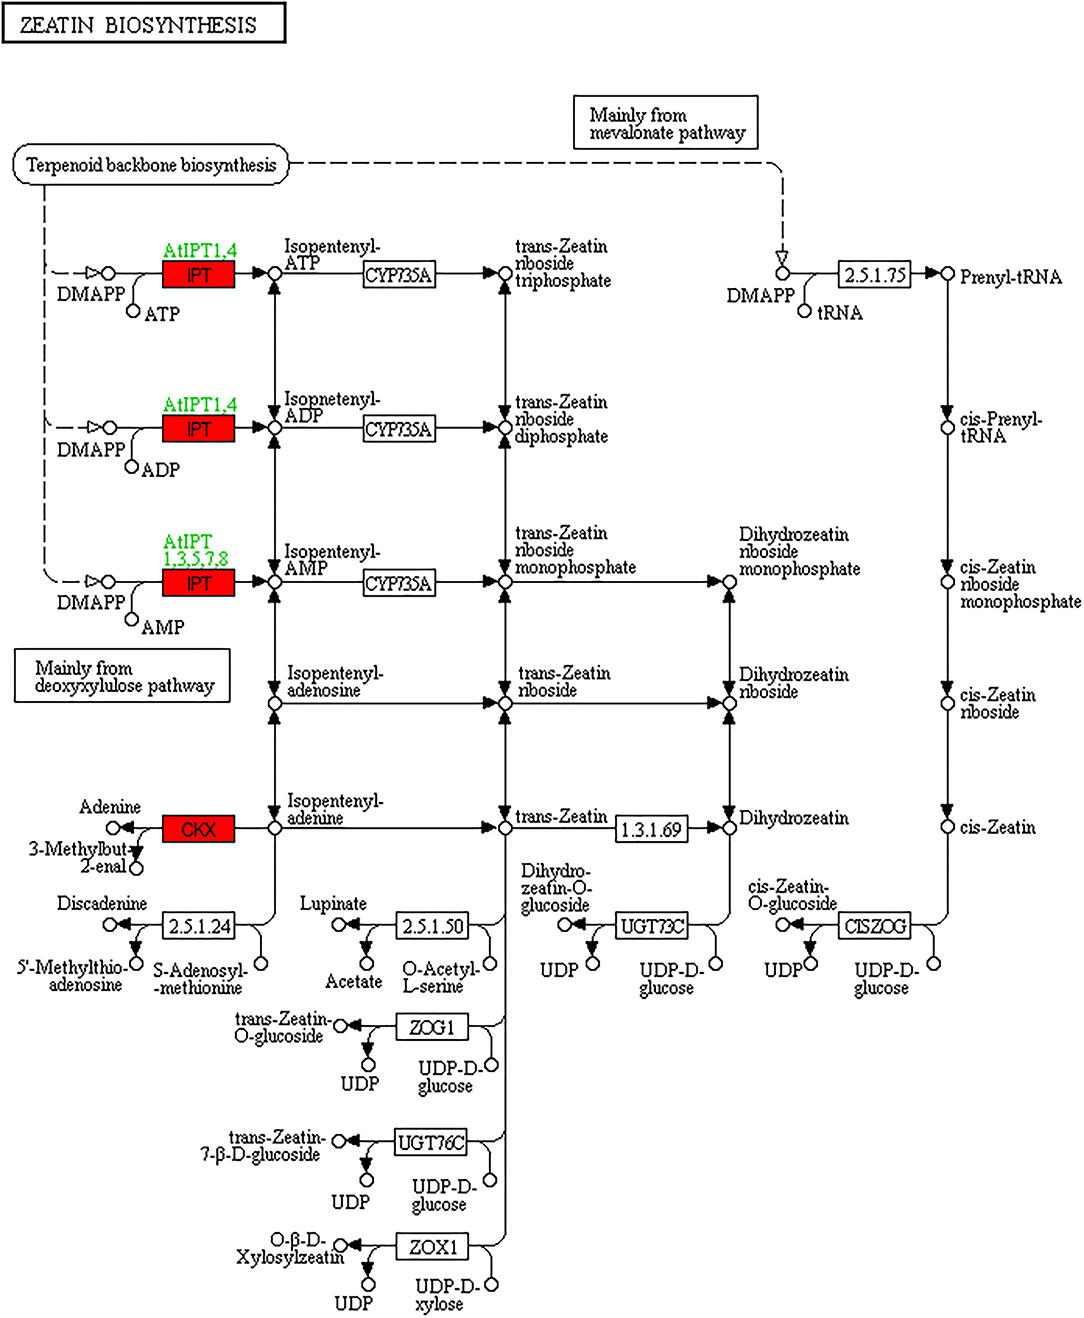
Figure 10. Differentially expressed genes in zeatin biosynthesis KEGG pathway in comparisons of salt ST_salt SS; red denotes upregulated genes.
NAC transcription factors (TFs) belong to a unique class of transcription factors in plants, which play important roles in multiple biological processes including salinity tolerance (Dudhate et al., 2021). A recent study found that NAC TFs could cause the accumulation of proline and glycine betaine to alleviate or avoid the negative effects of ROS in soybean (Li et al., 2021). RT-PCR showed that NAC-like transcription factor (c32634_g1) and peroxidase (c41938_g5) had a significant increase in salt ST compared to salt SS, suggesting that high antioxidant ability may play an essential role in salinity tolerance of salt ST. Interestingly, overexpression of the annexin gene TdANN12 in transgenic tobacco improves stress tolerance through ROS removal (Saad and Ben Romdhane, 2020).
There was high variation of salinity tolerance in S. guianensis accessions, CIAT11365 was a relatively salinity-tolerant accession, which can survive between 100 and 200 mM NaCl. Transcriptomic analysis showed that an increase of Ca2+ signal transduction and Na+ transport ability, salinity tolerance-related transcription factors and antioxidant ability, as well as an increase of auxin, and inhibition of cytokinin may contribute to the salinity tolerance of CIAT11365. In consequence, CIAT 11365 could be utilized in moderate saline soil of tropical areas.
The datasets presented in this study can be found in online repositories. The names of the repository/repositories and accession number(s) can be found at: NCBI [accession: PRJNA771864].
YL and GL conceived the study as well as participated in its design and coordination. YL carried out all salinity treatment experiments. YL, DK, and WW analyzed the data. YL, HY, SD, MA, BX, and WW wrote the manuscript and revised the manuscript. All authors contributed to the article and approved the submitted version.
This work was funded by the Central Public-interest Scientific Institution Basal Research Fund for Chinese Academy of Tropical Agricultural Sciences (1630032021005), the Key Research and Development Program of Hainan (ZDYF2019078), the Hainan Provincial Natural Science Foundation of China (321RC646), the National Science and Technology Basic Resources Investigation Project (2017FY100600), the National Tropical Plants Germplasm Resource Center, and the Modern Agro-industry Technology Research System (CARS-34).
The authors declare that the research was conducted in the absence of any commercial or financial relationships that could be construed as a potential conflict of interest.
All claims expressed in this article are solely those of the authors and do not necessarily represent those of their affiliated organizations, or those of the publisher, the editors and the reviewers. Any product that may be evaluated in this article, or claim that may be made by its manufacturer, is not guaranteed or endorsed by the publisher.
The Supplementary Material for this article can be found online at: https://www.frontiersin.org/articles/10.3389/fsufs.2022.725656/full#supplementary-material
Abiala, M. A., Abdelrahman, M., Burritt, D. J., and Tran, L.-S. P. (2018). Salt stress tolerance mechanisms and potential applications of legumes for sustainable reclamation of salt-degraded soils. Land Degrad. Dev. 29, 3812–3822. doi: 10.1002/ldr.3095
Deinlein, U., Stephan, A. B., Horie, T., Luo, W., Xu, G. H., and Schroeder, J. I. (2014). Plant salt-tolerance mechanisms. Trends Plant Sci. 19, 371–379. doi: 10.1016/j.tplants.2014.02.001
Dong, R., Zhang, J., Huan, H., Bai, C., Chen, Z., and Liu, G. (2017). High salt tolerance of a bradyrhizobium strain and its promotion of the growth of Stylosanthes guianensis. Int. J. Mol. Sci. 18:1625. doi: 10.3390/ijms18081625
Dudhate, A., Shinde, H., Yu, P., Tsugama, D., Gupta, S. K., Liu, S., et al. (2021). Comprehensive analysis of NAC transcription factor family uncovers drought and salinity stress response in pearl millet (Pennisetum glaucum). BMC Genomics 22:70. doi: 10.1186/s12864-021-07382-y
Guo, Y., Sheng, Q., Li, J., Ye, F., Samuels, D. C., and Shyr, Y. (2013). Large scale comparison of gene expression levels by microarrays and RNAseq using TCGA data. PLoS ONE 8, e71462. doi: 10.1371/journal.pone.0071462
Huang, C., Liu, G., and Bai, C. (2017). Identification of 12 stylosanthes cultivars by SRAP molecular markers. Mol. Plant Breed. 15, 2856–2862.
Ivushkin, K., Bartholomeus, H., Bregt, A. K., Pulatov, A., Kempen, B., and De Sousa, L. (2019). Global mapping of soil salinity change. Remote Sens. Environ. 231:111260. doi: 10.1016/j.rse.2019.111260
Jiang, Y., Shen, Q., Ding, X., Yan, L., Liu, G., and Bai, C. (2017). Phenotypic diversity analysis of Stylosanthes germplasms. Pratacult. Sci. 34, 1032–1041.
Jiang, Z., Zhou, X., Tao, M., Yuan, F., Liu, L., Wu, F., et al. (2019). Plant cell-surface GIPC sphingolipids sense salt to trigger Ca2+ influx. Nature 572, 341–346. doi: 10.1038/s41586-019-1449-z
Li, M., Chen, R., Jiang, Q., Sun, X., Zhang, H., and Hu, Z. (2021). GmNAC06, a NAC domain transcription factor enhances salt stress tolerance in soybean. Plant Mol. Biol. 105, 333–345. doi: 10.1007/s11103-020-01091-y
Liu, Y., Feng, Y., Ding, X., Chen, Z., Huang, C., Dong, R., et al. (2017). Synthetical evaluation of salinity tolerance of 67 Stylosanthes Sw. materials. Chin. J. Trop. Crops 38, 1–7.
Manishankar, P., Wang, N., Köster, P., Alatar, A. A., and Kudla, J. (2018). Calcium signaling during salt stress and in the regulation of ion homeostasis. J. Exp. Bot. 69, 4215–4226. doi: 10.1093/jxb/ery201
Munns, R., and Tester, M. (2008). Mechanisms of salinity tolerance. Annu. Rev. Plant Biol. 59, 651–681. doi: 10.1146/annurev.arplant.59.032607.092911
Nishiyama, R., Watanabe, Y., Fujita, Y., Le, D. T., Kojima, M., Werner, T., et al. (2011). Analysis of cytokinin mutants and regulation of cytokinin metabolic genes reveals important regulatory roles of cytokinins in drought, salt and abscisic acid responses, and abscisic acid biosynthesis. Plant Cell 23, 2169–2183. doi: 10.1105/tpc.111.087395
Pantoja, O.. (2021). Recent advances in the physiology of ion channels in plants. Annu. Rev. Plant Biol. 72, 463–495. doi: 10.1146/annurev-arplant-081519-035925
Petersson, S. V., Johansson, A. I., Kowalczyk, M., Makoveychuk, A., Wang, J. Y., Moritz, T., et al. (2009). An auxin gradient and maximum in the Arabidopsis root apex shown by high-resolution cell-specific analysis of IAA distribution and synthesis. Plant Cell 21, 1659–1668. doi: 10.1105/tpc.109.066480
Ryu, H., and Cho, Y.-G. (2015). Plant hormones in salt stress tolerance. J. Plant Biol. 58, 147–155. doi: 10.1007/s12374-015-0103-z
Saad, R. B., and Ben Romdhane, W. (2020). Insights into plant annexins function in abiotic and biotic stress tolerance. Plant Signal. Behav. 15:1699264. doi: 10.1080/15592324.2019.1699264
Seifikalhor, M., Aliniaeifard, S., and Shomali, A. (2019). Calcium signaling and salt tolerance are diversely entwined in plants. Plant Signal. Behav. 14:1665455. doi: 10.1080/15592324.2019.1665455
Tang, Y., Hu, X., Guo, J., Bai, C., and He, H. (2009). Genetic diversity of Stylosanthes revealed by ISSR markers. Acta Pratacultuae Sinica 18, 57–64.
Tran, L.-S. P., Shinozaki, K., and Yamaguchi-Shinozaki, K. (2010). Role of cytokinin responsive two-component system in ABA and osmotic stress signalings. Plant Signal. Behav. 5, 148–150. doi: 10.4161/psb.5.2.10411
Wang, Y., Li, K., and Li, X. (2009). Auxin redistribution modulates plastic development of root system architecture under salt stress in Arabidopsis thaliana. J. Plant Physiol. 166, 1637–1645. doi: 10.1016/j.jplph.2009.04.009
Wu, F., Yu, X., Liu, F., Bai, C., and Liu, G. (2013). Comparative analysis of salt tolerance of four cultivars of stylosanthes. J. Trop. Biol. 4, 36–42.
Yadav, D., Boyidi, P., Ahmed, I., and Kirti, P. B. (2018). Plant annexins and their involvement in stress responses. Environ. Exp. Bot. 155, 293–306. doi: 10.1016/j.envexpbot.2018.07.002
Yu, Z., Duan, X., Luo, L., Dai, S., Ding, Z., and Xia, G. (2020). How plant hormones mediate salt stress responses. Trends Plant Sci. 25, 1117–1130. doi: 10.1016/j.tplants.2020.06.008
Zelm, E. V., Zhang, Y., and Testerink, C. (2020). Salt tolerance mechanisms of plants. Annu. Rev. Plant Biol. 71, 403–433. doi: 10.1146/annurev-arplant-050718-100005
Zhang, H., Zhu, J., Gong, Z., and Zhu, J.-K. (2021). Abiotic stress responses in plants. Nat. Rev. Genet. 23, 104–119. doi: 10.1038/s41576-021-00413-0
Zhang, L., Tian, L. H., Zhao, J. F., Song, Y., Zhang, C. J., and Guo, Y. (2009). Identification of an apoplastic protein involved in the initial phase of salt stress response in rice root by two-dimensional electrophoresis. Plant Physiol. 149, 916–928. doi: 10.1104/pp.108.131144
Zhang, Z. W. J., Jin, W., Ge, D., Liu, K., Lü, F., and Sun, J. (2018). Identification and expression analysis of CRK gene family in upland cotton. Sci. Agricult. Sinica 51, 2442–2461.
Keywords: Stylosanthes guianensis (Aubl.) Sw., salinity tolerance, differentially expressed genes, transporter, hormones
Citation: Liu Y, Kong D, Yang H, Douxchamps S, Atieno M, Xu B, Wang W and Liu G (2022) A Transcriptomic Analysis of Stylo [Stylosanthes guianensis (Aubl.) Sw.] Provides Novel Insights Into the Basis of Salinity Tolerance. Front. Sustain. Food Syst. 6:725656. doi: 10.3389/fsufs.2022.725656
Received: 15 June 2021; Accepted: 31 January 2022;
Published: 29 March 2022.
Edited by:
Stephen Whitfield, University of Leeds, United KingdomReviewed by:
Teodardo Calles, Food and Agriculture Organization of the United Nations, ItalyCopyright © 2022 Liu, Kong, Yang, Douxchamps, Atieno, Xu, Wang and Liu. This is an open-access article distributed under the terms of the Creative Commons Attribution License (CC BY). The use, distribution or reproduction in other forums is permitted, provided the original author(s) and the copyright owner(s) are credited and that the original publication in this journal is cited, in accordance with accepted academic practice. No use, distribution or reproduction is permitted which does not comply with these terms.
*Correspondence: Guodao Liu, bGl1Z3VvZGFvMjAwOEAxNjMuY29t; Wenqiang Wang, d3dxbm1nQDE2My5jb20=
Disclaimer: All claims expressed in this article are solely those of the authors and do not necessarily represent those of their affiliated organizations, or those of the publisher, the editors and the reviewers. Any product that may be evaluated in this article or claim that may be made by its manufacturer is not guaranteed or endorsed by the publisher.
Research integrity at Frontiers
Learn more about the work of our research integrity team to safeguard the quality of each article we publish.