
95% of researchers rate our articles as excellent or good
Learn more about the work of our research integrity team to safeguard the quality of each article we publish.
Find out more
ORIGINAL RESEARCH article
Front. Sustain. Food Syst. , 07 December 2022
Sec. Crop Biology and Sustainability
Volume 6 - 2022 | https://doi.org/10.3389/fsufs.2022.1043647
 Steven A. Mauget1*
 Sushil K. Himanshu2
 Tim S. Goebel1Srinivasulu Ale3Paxton Payton4Katie Lewis5R. Louis Baumhardt6
Although winter cover crop residue can mitigate the stresses of dryland production in semi-arid regions, cover crops can also reduce soil moisture and cash crop yields. In some field studies of dryland cotton grown after terminated winter wheat in the U.S. Southern High Plains (SHP) and Texas Rolling Plains cotton yields were increased relative to continuous cotton, while others had no significant yield or soil water effect. These uncertain outcomes may be due to the trial's limited sampling of seasonal rainfall conditions. To estimate the probabilities of cover crop effects under more representative SHP climate conditions, 294 station-years of crop model simulations of terminated winter wheat followed by dryland cotton were conducted. These simulations were driven by weather data from 21 SHP weather stations during 2005–2019. Each station-year's simulations were repeated under 54 combinations of wheat planting, termination, and cotton planting dates, 2 soil series with different water capacities, and 10 initial soil moisture conditions. When simulations begin with fall soil moisture at field capacity optimal management options for both soils plant wheat early and cotton late, but have different wheat termination dates. Before cotton planting winter cover crop effects are dominated by reduced surface evaporation and increased transpiration, with greater transpiration effects producing decreased column soil moisture (CSM) at wheat termination. Some soil moisture recharge occurs between termination and cotton planting, but cover crops reduce CSM at cotton planting in both soils in ~75% of simulations. Reduced soil evaporation and soil moisture recovery continues after cotton planting, resulting in positive effects on seed cotton yield in 50% of the silty clay loam simulations and in 67% of the fine sandy loam simulations. Gradually reducing initial fall soil moisture in the silty clay loam reduces wheat biomass but increases the incidence of positive effects on seed cotton yields and CSM at cotton planting and harvest. By contrast, drier initial soil moisture in the fine sandy loam had relatively minor yield and CSM effects. In both soils terminated wheat residue led to increased CSM at cotton harvest in at least 70% of the simulations regardless of soil moisture at wheat planting.
In the U.S. Southern High Plains (SHP) dryland cotton (Gossypium Hirsutum L.) production is confronted with a number of challenges. High evaporative demand (Robinson and Nielsen, 2015), summer rainfall levels that are consistently below 50% of potential crop demand (Mauget et al., 2013), and the region's windy spring conditions (Stout, 2001) can make crop establishment difficult and reduce yields. In addition to being climatically water-limited for un-irrigated “dryland” cotton production, many of the region's soils are sandy, leading to lower water holding capacity and potentially further limiting crop water availability.
In response to these challenges SHP cotton producers are considering planting winter cover crops, which might increase the organic carbon, water retention, and aggregate stability of soil, reduce wind and water erosion, and may also conserve soil water by reducing runoff and surface evaporation (SARE, 2012; Sharma et al., 2018; Adetunji et al., 2020; Wallander et al., 2021). In addition to no or reduced tillage and intercropping or crop rotations, maintaining residue cover from previous crops or winter cover crops is a basic practice of conservation agriculture (Kassam et al., 2009; Serraj and Siddique, 2012; Pittelkow et al., 2015). However, in semi-arid agriculture the transpiration of winter cover crops planted before a dryland cash crop can also reduce soil moisture and subsequent crop yields (Unger and Vigil, 1998; Dabney et al., 2001; Balkcom et al., 2007). Unger and Vigil's (1998) review of cover crop effects in published reports indicates that this reducing effect is generally greater in soils with limited water holding capacity.
Past field studies conducted in the SHP and neighboring Texas Rolling Plains (TRP) provide unclear evidence about the impacts of winter cover crops on cotton yields. A terminated wheat (Triticum aestivum L.)—dryland cotton rotation in Bordovsky et al.'s (1994) 4-year SHP field trial resulted in a 12.6% cotton yield increase relative to continuous cotton. By contrast, Baumhardt and Lascano's (1999) field trial found that dryland cotton stands preceded by terminated winter wheat were harder to establish, and did not increase yields or conserve water. Rye winter cover under strip-till and no-till management in Sij et al.'s (2003) 2001–2002 TRP field experiment resulted in no significant effects on subsequent cotton lint yield. Similarly, DeLaune et al.'s (2020) 2013–2016 TRP field study found that various winter cover crops had no significant effect on lint yields or net economic returns. In the final 3 years (2014–2017) of a 20-year SHP field experiment, Lewis et al. (2018) reported that, relative to conventional tillage, cotton lint yield was reduced with a no-till rye winter cover in 2 of 3 years. However, they also cite Keeling et al.'s (1989) SHP field study in which cover crops and conservation tillage increased cotton yields, and note that the effects of cover crops may vary regionally and from year-to-year.
The different outcomes of previous SHP and TRP field trials might be traced to their being conducted under a limited sampling of seasonal rainfall conditions. In a semi-arid environment cover crop water-competition with dryland cash crops may depend strongly on evaporative demand and the amount and timing of precipitation. For example, the Bordovsky et al. (1994) trial was marked by above average May rainfall in each year of 1986–1989, which suggests that the positive impact of a SHP wheat cover crop on dryland cotton yields may depend on wet spring conditions. One year of the 2-year Sij et al. (2003) trial was marked by extremely dry and hot conditions. As a result, these trials, indeed, any dryland field trial conducted over a limited number of years, may provide a similarly limited sampling of weather-related cover crop effects.
One way to generate a more climatically representative range of cropping outcomes is through crop modeling. Given enough weather data inputs, crop production can be simulated under a wider range of seasonal rainfall conditions. In addition, unlike field trials, crop simulations can be easily repeated under various management options and soil types. Two previous modeling studies have simulated the effects of winter cover crops on TRP cotton production. Adhikari et al. (2017; hereafter A17) used the CROPGRO-Cotton and CERES-Wheat models to simulate winter wheat cover effects on dryland and irrigated cotton production based on 2001–2015 Chillicothe, Texas weather data. Their 15-year model runs found no substantial differences in the effects on soil moisture balances and cotton yields, and they concluded that winter wheat was a viable TRP cover crop for producing cotton. Himanshu et al. (2022; hereafter, H22) similarly drove the CERES-Wheat and CROPGRO-Cotton models with 2001–2020 Chillicothe weather inputs, with additional attention to the effects on soil organic carbon (SOC) and crop water productivity. They found that although winter wheat depleted soil water before termination, it was replenished by rainfall after termination and during the cotton growing season. Winter wheat cover was found to improve water productivity and SOC under both dryland and irrigated conditions.
The goal here is to use the CROPGRO-Cotton and CERES-Wheat crop models to better resolve the uncertain effects of winter cover crops in SHP dryland cotton production found in past modeling and field studies. Given the ongoing depletion of the southern Ogallala Aquifer (Scanlon et al., 2012; McGuire, 2017) and an anticipated transition to dryland production, the emphasis is on cover crop effects on SHP dryland column soil moisture and seed cotton yields. Compared to A17 and H22 these simulations are driven by a wider sampling of seasonal rainfall outcomes and repeated over a range of management options. These options include variable wheat termination dates, which may be important in minimizing soil moisture effects on subsequent cash crops (Unger and Vigil, 1998). By using weather input data from 21 West Texas Mesonet (WTM) stations (Schroeder et al., 2005) during 14 cropping years these simulations generate 294 outcomes for wheat biomass, column soil moisture balances, and seed cotton yields for each management option. The resulting distributions of yield and soil water effects allow for a probabilistic and risk-based analysis of winter cover crop impacts on dryland cotton production under current SHP climate conditions. In addition, given the regional variability of sand content in SHP soils (Holliday, 1990), the simulations were repeated with two SHP soils of varying texture and water retention properties. Finally, whereas the A17 and H22 model runs were conducted continuously over the duration of their weather input records, the simulations here were conducted separately for each annual cropping cycle to control for and estimate the effects of initial fall soil moisture conditions.
Wheat biomass and seed cotton yields were simulated using the CERES-Wheat (Ritchie and Otter, 1985; Ritchie et al., 1998) and CROPGRO-Cotton (Pathak et al., 2007, 2012) crop modules of the Decision Support System for Agrotechnology Transfer (DSSAT) cropping system model (Jones et al., 2003; Boote et al., 2008; Hoogenboom et al., 2019). The DSSAT system (ver. 4.7.5.034) consists of 42 crop modules that simulate the growth of individual crops and an underlying set of weather, soil, soil-plant-atmosphere, and management modules common to the simulation of all crops. Although crop photosynthesis can be calculated hourly, these components update crop development over daily time steps. Soil water in up to 20 layers is calculated daily using a one-dimensional tipping bucket approach (Ritchie, 1998; Boote et al., 2008). As the Priestley-Taylor option for calculating potential evaporation (PET) produced a closer match between observed and simulated yields than alternative methods in the H22 model calibration trials, that method was also used here. Actual soil evaporation was calculated based on PET and surface soil water content via the Suleiman-Ritchie option (Ritchie et al., 2009). When run in sequential mode, common soil process modules allow the simulation of crop rotations through the carry-over of soil water, SOC, and total nitrogen (N) from one cropping period to the next. The CENTURY (Parton) soil carbon module (Gijsman et al., 2002), simulates in-season senescence of plant components and surface residue decomposition, which are important for the simulation of a terminated wheat-cotton crop sequence. Additional details about the calculation of soil water balances, partitioning of crop transpiration and soil evaporation, root water uptake, and root growth can be found in Boote et al. (2008). Together, the DSSAT modules require weather and management parameter inputs, crop ecotype, species and cultivar characteristics, and soil and soil profile characteristics.
The sequential CERES-Wheat/CROPGRO-Cotton simulations were driven with daily weather data from 21 WTM stations (Figure 1A) over the 14 winter-spring-summer cropping seasons of 2005–2006 to 2018–2019. When combined, the resulting model output produced 294 station-years of outcomes for each management option. The DSSAT daily weather inputs were calculated from the 5-min resolution records provided by the WTM weather network. These inputs include daily total solar radiation and precipitation, average dew point temperature and wind run, and daily minimum and maximum temperatures. After daily data gaps were replaced with data from the station's nearest neighboring stations, continuous daily weather records were produced for each station from Jan. 1 2005 to Dec. 31 2019. Driving DSSAT with the resulting dense sampling of seasonal precipitation (Figure 1B) and weather outcomes produced similarly dense distributions of terminated wheat biomass and seed cotton yield outcomes, and modeled distributions of soil drainage, runoff, surface evaporation, crop transpiration, and column soil water. As these distributions reflect recent (2005–2019) SHP climate conditions, they allow for probabilistic estimates of winter wheat cover crop yield and soil moisture effects under current dryland production conditions.
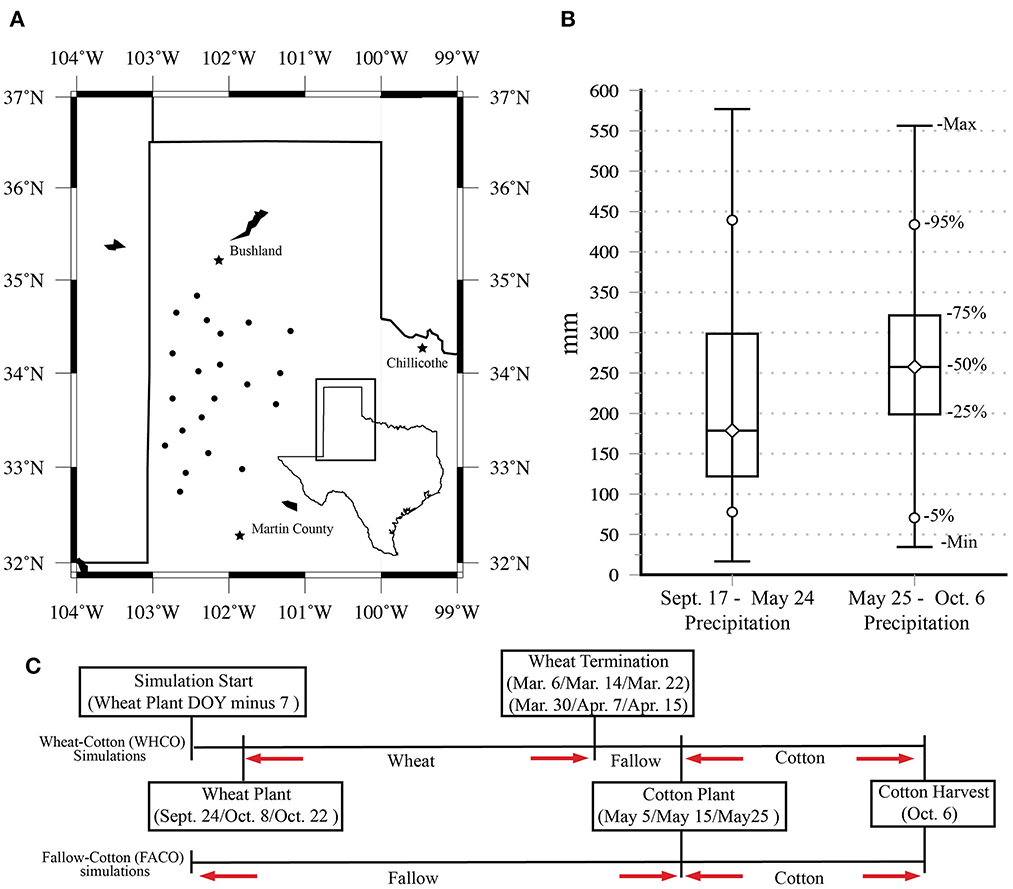
Figure 1. (A) Locations of 21 west Texas Mesonet weather stations. Starred locations mark the locations of the Texas A&M AgriLife Research Station at Chillicothe TX, the USDA-ARS research station at Bushland, TX, and the Martin County, TX, field research site. (B) Distributions of cumulative Sept.17–May 25 and May 25–0ct. 6 rainfall aggregated from the 21 mesonet stations during 2005–2006 to 2018–2019. (C) Schematic time lines of the terminated wheat-cotton (WHCO) and fallow-cotton (FACO) control simulations.
The ecotype (ECO), cultivar (CUL) and species (SPE) parameters used for the Deltapine 1219 cotton and TAMU112 wheat cultivars simulated here were those estimated by H22 based on measured data from a 10-year (2011–2020) cover crop field study conducted at the Texas A&M AgriLife Research Station at Chillicothe, TX. These model parameters were estimated through a three-step calibration process that sequentially minimized the difference between simulated and observed daily soil moisture, harvested wheat biomass and seed cotton yield, and SOC at various soil depths. The ECO, CUL, and SPE parameters were estimated and validated based on 10-year continuous cotton and wheat-cotton simulations that were compared with the field study's outcomes for biomass/yield, soil moisture, and SOC. After a 2011–2012 model initialization period, optimal parameters were estimated by manually adjusting their values over specified testing ranges to minimize the difference between observed outcomes and corresponding model output values during 2013–2014. Parameter testing ranges were determined by other cultivars in the DSSAT database and the calibrated values reported in other studies from the Southern High Plains and Texas High Plains regions. Given the optimal parameters, the calibrated model outputs were validated through observed vs. modeled comparisons over varying periods during 2015–2020. Additional details of this process and the validation statistics and methods used can be found in Himanshu et al. (2021) and H22.
To explore the effects of planting and wheat termination dates, simulations of winter wheat followed by summer cotton (WHCO) were conducted under 54 management options. These options were defined by three wheat planting dates (Sept. 24, Oct. 8, Oct. 22), six wheat termination dates (Mar. 6, Mar. 14, Mar. 22, Mar. 30, Apr. 7, Apr. 15), and three cotton planting dates (May 5, May 15, May 25). The fall wheat planting dates were selected based on regional extension recommendations for forage or dual-purpose wheat (Kimura et al., 2017), while the latest termination date was selected to occur before the earliest date that grain was produced in the model runs. Cotton planting dates were selected based on common regional planting practices and previous simulations that tested planting date effects on SHP and TRP cotton production (Mauget et al., 2017). Wheat and cotton planting densities were 102 and 13 plants m−2 respectively. No tillage was applied other than planting and no N was applied, but each soil level's initial N was set to values that reproduced the 0–90 cm regional average (96 kg ha−1) estimated by Bronson et al. (2009). To estimate the soil moisture and yield effects of winter wheat cover crops, for each of the 54 management options (MO) a fallow cotton (FACO) control simulation was conducted that repeated each station-year's WHCO simulation except for the planting of a winter wheat cover crop. Each WHCO and FACO simulation began 7 days before the fall wheat planting date, planted cotton in May of the next year, and harvested cotton on the following Oct. 6 (Figure 1C).
The effect of a wheat-cotton management option relative its fallow-cotton control simulation was calculated as the difference between WHCO and FACO outcomes. Here, the upper-case delta (Δ) indicates those WHCO minus FACO effects. Thus, seed cotton yield (SCY) effects are calculated as the difference between WHCO and FACO seed cotton yields.
As no wheat biomass is generated in the FACO simulations, the wheat biomass (WBIO) effect is equivalent to WHCO wheat biomass.
The column soil moisture (CSM) for a dryland crop at the end of a crop growth period can be estimated as the period's precipitation (PRCP) minus the combined effects of cumulative soil drainage (DR), surface evaporation from soil and mulch (SE), runoff (RO), and crop transpiration (TR), plus the period's initial column soil moisture (CSMi).
The effects of a WHCO management option on CSM relative to FACO production were calculated as,
As each station-year's WHCO and FACO simulations experience identical rainfall totals before and after cotton planting, then,
where,
The WHCO and FACO simulations were repeated with soil profile inputs for a Pullman silty clay loam (PSCL; fine, mixed, superactive, thermic Torrertic Paleustoll) and a Midessa fine sandy loam (MFSL; fine-loamy, mixed, superactive, thermic Aridic Calciustepts). PSCL soil cores were sampled to a 210 cm depth at the USDA-ARS Bushland, TX location, while MFSL cores of the same depth were sampled at a producer's field in Martin County, TX (Figure 1A). The sampling and processing of the PSCL and MFSL soil cores to estimate soil texture, bulk density, and soil organic carbon in 13 soil layers followed the process described in Mauget et al. (2021). The resulting profiles of PSCL and MFSL sand, silt, and clay content is plotted in Figures 2A,B. Using those soil property inputs, volumetric water content at wilting point (θwp), field capacity (θfc), and saturation (θs) were calculated at each level from the average of the outputs of seven pedotransfer functions, a process also described in Mauget et al. (2021). The resulting PSCL and MFSL θwp, θfc and θs profiles are plotted in Figures 2C,D. The column total field capacity (FC), plant available water (PAW), and column averaged texture composition for both soils are found in Table 1.
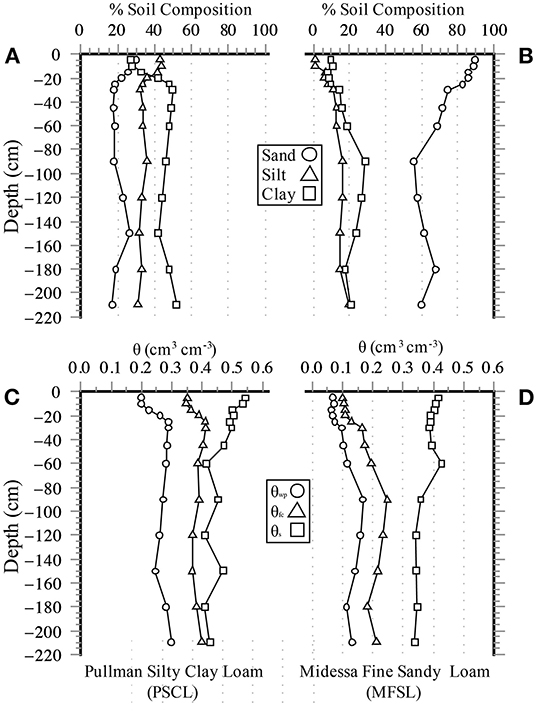
Figure 2. (A) Sand, silt, and clay percentages for the Pullman silty clay loam (PSCL) at 13 levels. (B) As in (A) for Midessa fine sandy loam (MFSL) texture composition. (C) Volumetric water content of the PSCL soil at wilting point (θwp), field capacity (θfc), and saturation (θs) at each level. (D) As in (C) for MFSL volumetric water content.
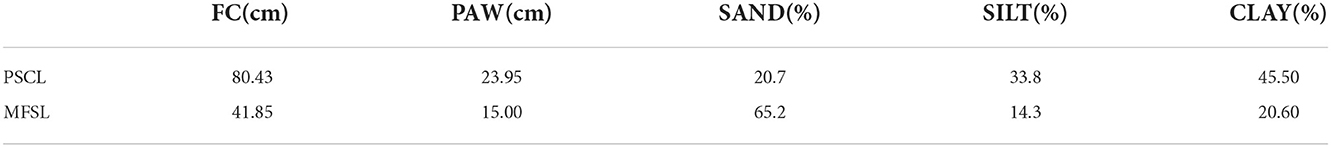
Table 1. Column integrated field capacity (FC) and plant available water (PAW), and column averaged sand-silt-clay composition for the PSCL and MFSL soils.
The two soils most distinguishing feature are their sand content and water holding characteristics. Over the entire MFSL soil core the average sand content is 65.2%, but in levels above 25 cm MFSL composition is more than 80.0% sand. By contrast, PSCL average sand content is 20.7%, with the highest sand content (30.0%) in the 0–5 cm surface layer. The PSCL soil's lower sand content is accompanied by greater water holding capacity. At field capacity the 210 cm PSCL soil core holds 80.43 cm of water, almost twice that of the MFSL soil (41.85 cm). The MFSL total column plant available water (15.0 cm) is 62.6% that of the PSCL soil (23.95 cm).
To control for initial soil moisture conditions, each station-year's simulations in Sections ‘Management effects on wheat biomass and seed cotton yield’, ‘Wheat cover crops effects: Simulation start to cotton planting’, and ‘Wheat cover crop effects: Cotton planting to cotton harvest’ were initialized with the CSMi of each soil at field capacity, i.e.,
where ΔZn are the depths of the 13 soil core layers in cm. In Section Initial soil moisture effects this condition is relaxed to simulate WBIO, CSM, and SCY effects under varying initial soil moisture conditions.
Pearson correlations between ΔSE and ΔTR soil moisture effects before cotton planting, ΔCSM and seasonal precipitation totals before cotton planting, and summer growing season soil moisture effects and ΔSCY yield effects were calculated using the R statistical software's cor.test function (R Core Team, 2017). Significance of Pearson correlations were defined at a 95% confidence level or better (p < 0.05).
Figure 3A plots the WBIO distributions at wheat termination for each of the 54 management options simulated with the PSCL soil. The clearest management effect is seen in delayed wheat termination, with later termination dates leading to increased biomass. Thus, for example, as wheat termination is delayed in MO 1-6, median PSCL WBIO increases from 4330.0 to 6986.0 kg ha−1 (+2656.0 kg ha−1). A smaller decreasing biomass effect is seen with delayed wheat planting dates. As wheat planting is delayed from Sept. 24 to Oct. 22 in MOs 6 and 42, median WBIO drops from 6986.0 kg ha−1 to 6065.0 kg ha−1 (−921.0 kg ha−1).
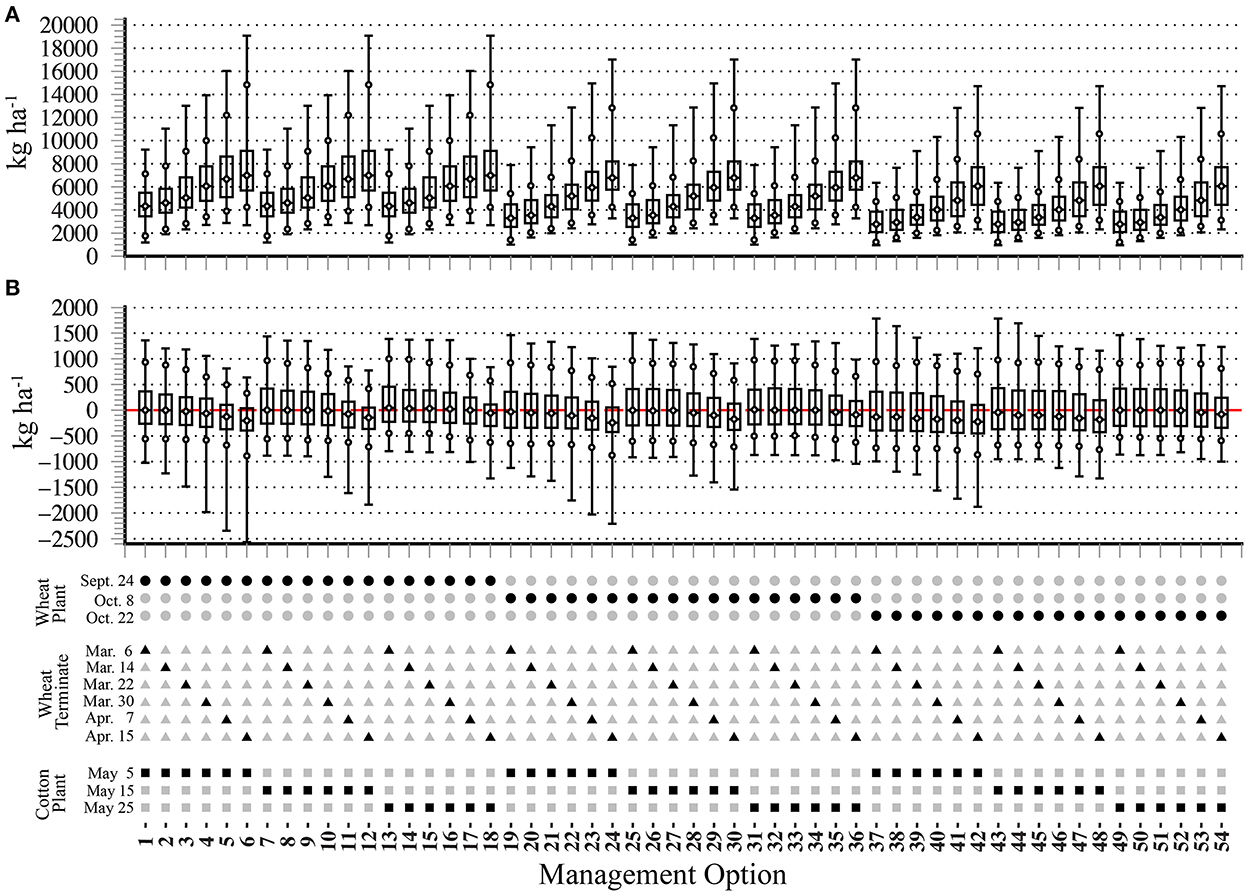
Figure 3. (A) Distributions of wheat biomass at termination for each management option in the PSCL simulations. (B) Distributions of each management option's WHCO minus FACO seed cotton yield effects in the PSCL simulations.
Figure 3B plots each management option's ΔSCY yield effect distributions. As wheat termination dates are delayed median ΔSCY decreases as median WBIO in Figure 3A increases, most clearly with later termination dates. Management option 13 produces the highest positive median ΔSCY effect (46.0 kg ha−1) and MO 24 produces the greatest negative median effect (−243.0 kg ha−1). All but 6 management options (MO 7, 13, 14, 15, 16, 31) result in negative or 0.0 kg ha−1 median ΔSCY effects. This shows that, at best, the probability of a WHCO management option increasing a subsequent seed cotton yield relative to a FACO yield in the PSCL soil is similar to that of an equally weighted coin flip.
The 54 management options show an inverse response of median wheat biomass and seed cotton yield effects in the PSCL soil as wheat termination dates are delayed, with median WBIO in Figure 3A increasing as median ΔSCY in Figure 3B decreases. The decrease in ΔSCY is particularly evident with termination dates after Mar. 22. As a result, early termination dates that minimize negative seed cotton yield effects result in reduced biomass production (e.g., MO 13), while late termination dates that maximize median WBIO result in clear reductions in median ΔSCY (e.g. MO 6).
An optimal WHCO management option would maximize biomass production while minimizing negative effects on seed cotton production. These options were identified here by ranking ΔSCY and WBIO medians, then adding the rankings to determine the options that jointly maximize the median production of both ΔSCY and WBIO. For example, with 1 indicating the highest ranked median and 54 the lowest, MO 13 results in a ΔSCY ranking of 1 and a WBIO ranking of 31, for a combined ranking of 32. The ΔSCY and WBIO rankings of MO 6 are 52 and 3 respectively, for a combined ranking of 55. Based on the ranked medians in Figures 3A,B, the option that plants wheat in the PSCL soil on Sept. 24, terminates wheat on Apr. 7, and plants cotton on May 25 (MO 17) results in a ΔSCY ranking of 8 and a WBIO ranking of 7, for a minimum combined ranking of 15.
Figure 4A plots the 54 WBIO distributions simulated with the MFSL soil. As in Figure 3A, delayed wheat planting leads to relatively small decreases in biomass, with delayed wheat termination producing more substantial increases. However, when compared with median WBIO yields generated with the PSCL soil, the sandier MFSL soil produces generally lower biomass levels. Delaying wheat planting from Sept. 24 to Oct. 22 in MOs 6 and 42 reduces median WBIO from 5741.0 kg ha−1 to 4151.0 kg ha−1 (−1,590 kg ha−1), while delayed wheat termination in MO 1-6 increases median biomass from 2,824 kg ha−1 to 5,741.0 kg ha−1 (+2917 kg ha−1).
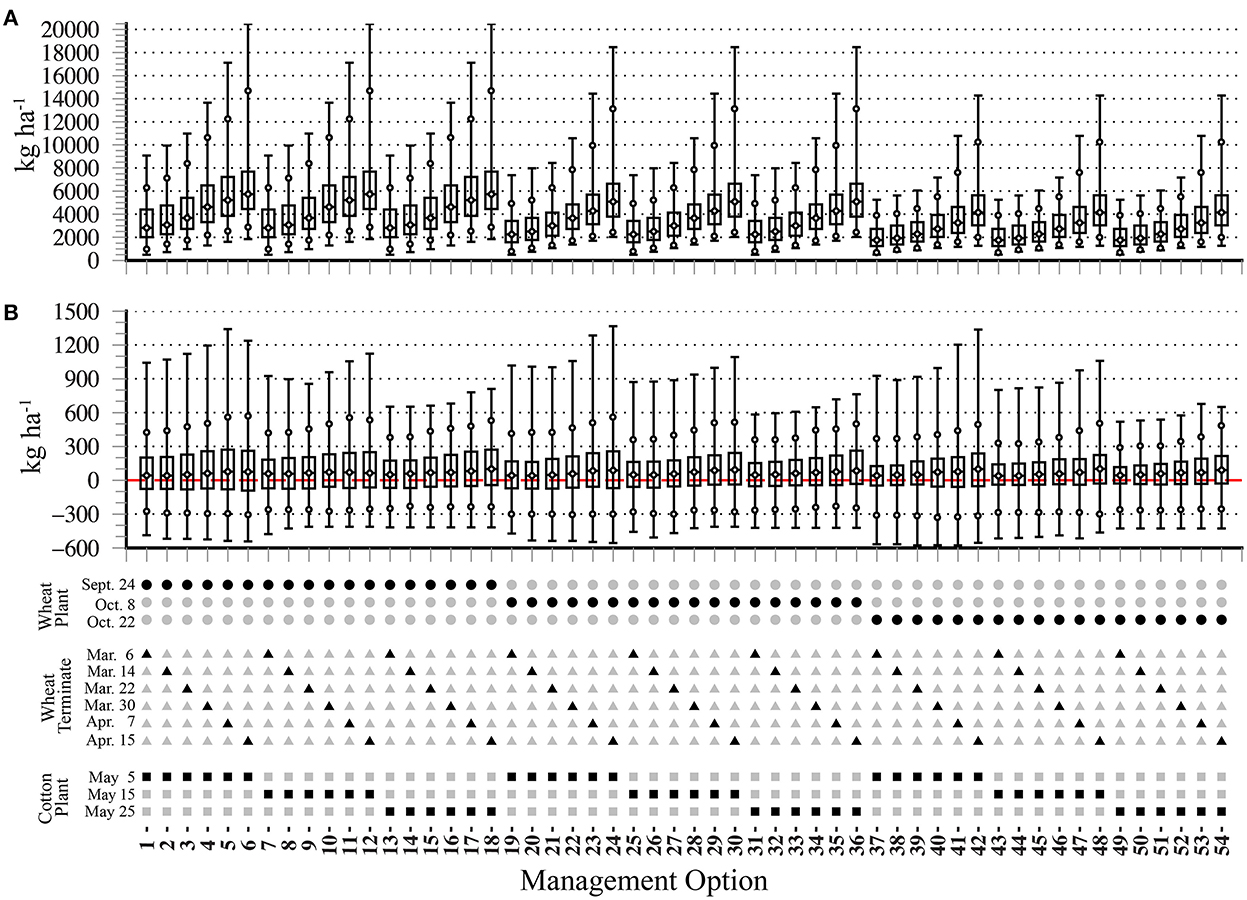
Figure 4. (A) Distributions of wheat biomass at termination for each management option in the MFSL simulations. (B) Distributions of each management option's WHCO minus FACO seed cotton yield effects in the MFSL simulations.
Figure 4B plots the MFSL ΔSCY distributions for each management option. In contrast to the Figure 3B distributions, the Figure 4B medians are all positive, with a minimum of 39.0 kg ha−1 (MO 43) and a maximum of 101.0 kg ha−1 (MO 48). Also, unlike the simulations conducted with the PSCL soil, ΔSCY medians increase with later wheat termination dates. Thus, management options with the latest Apr. 15 termination date produce both higher WBIO and ΔSCY medians. The optimal management option that plants wheat on Sept. 24, terminates wheat on Apr. 15, and plants cotton on May 25 (MO 18) produces the highest WBIO median and the second highest ΔSCY median, for a minimum combined ranking of 3.
Figure 5A plots the distribution of MO 17 management effects on cumulative drainage (ΔDR), runoff (ΔRO), surface evaporation (ΔSE), and transpiration (ΔTR) during the period between simulation start (Sept. 17) and cotton planting (May 25) for the PSCL soil. The wheat cover crop's leading effects are to increase transpiration and reduce surface evaporation, with negligible drainage and runoff effects. As both the WHCO and FACO simulations begin with column soil moisture at field capacity (ΔCSMi = 0.0), column soil moisture effects are mainly determined by the effects on soil evaporation and wheat transpiration.
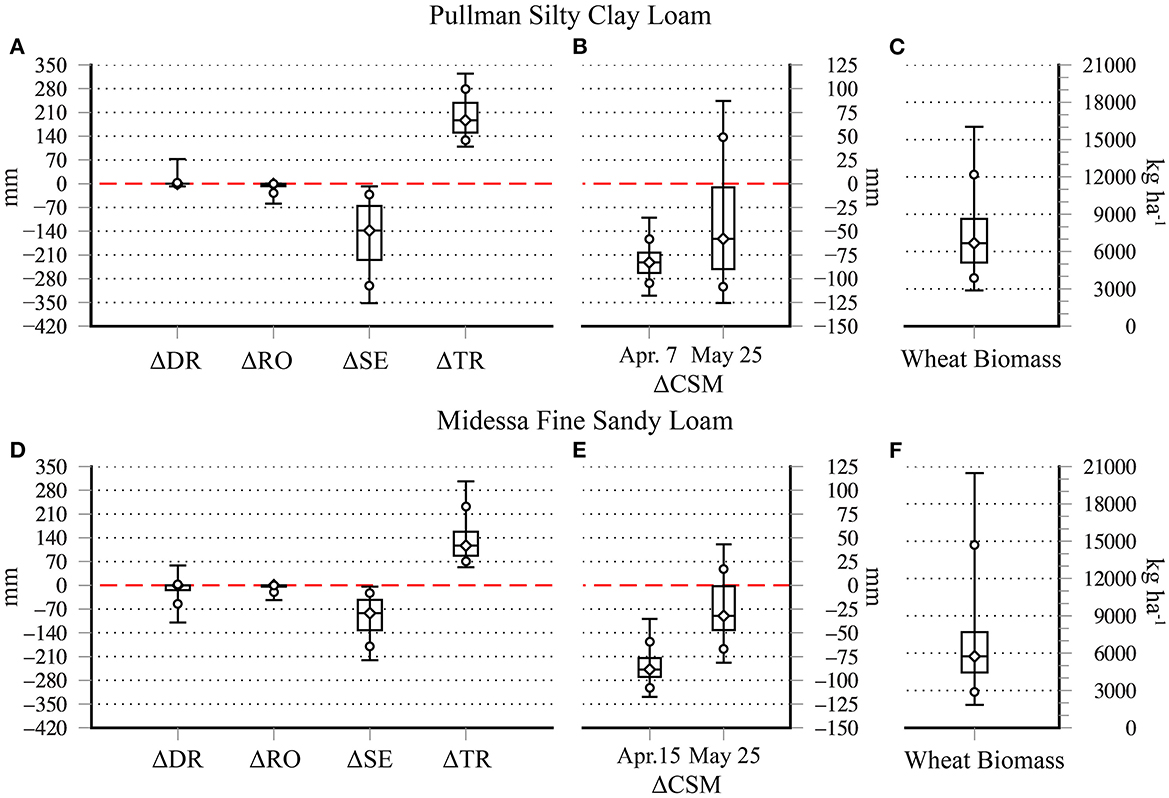
Figure 5. (A) Distributions of MO 17 WHCO-FACO management effects on cumulative drainage (ΔDR), runoff (ΔRO), surface evaporation (ΔSE), and transpiration (ΔTR) during simulation start to cotton planting for the PSCL soil. (B) Distributions of column soil moisture effects (ΔCSM) at MO 17 wheat termination (Apr. 7) and cotton planting (May 25) dates. (C) Distribution of MO 17 wheat biomass (WBIO) outcomes. (D) Distributions of MO 18 WHCO-FACO management effects on cumulative drainage (ΔDR), runoff (ΔRO), surface evaporation (ΔSE), and transpiration (ΔTR) during simulation start to cotton planting for the MFSL soil. (E) Distributions of column soil moisture effects (ΔCSM) at MO 18 wheat termination (Apr. 15) and cotton planting (May 25) dates. (F) Distribution of MO 18 wheat biomass (WBTO) outcomes.
The median PSCL transpiration effect is +186.86 mm, with a 25th to 75th percentile inter-quartile range (IQR) of 87.68 mm. The surface evaporation effect magnitudes are generally smaller but more variable, with a −138.0 mm median and an IQR of 159.36 mm. In Table 2 the 294 ΔSE and ΔTR effects in the PSCL soil are also highly anti-correlated (ρ = −0.903), showing that a wheat cover crop's strong (weak) reductions in surface evaporation are associated with proportionately strong (weak) increases in wheat transpiration.
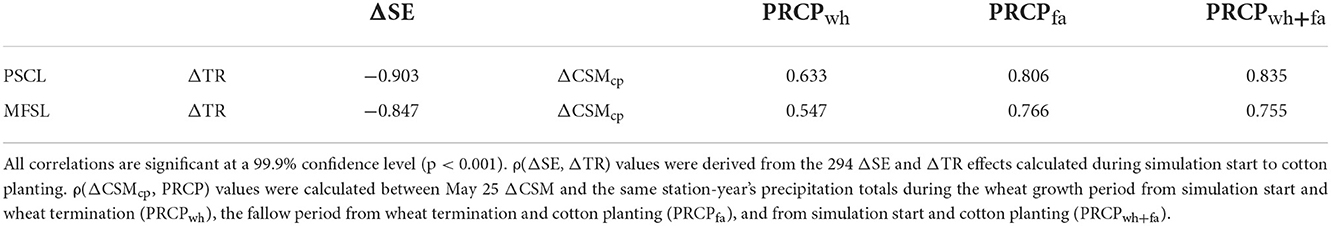
Table 2. Pearson correlations (ρ) of transpiration (ΔTR) vs. surface evaporation effects (ΔSE) and column soil moisture effects at cotton planting (ΔCSMcp) vs. precipitation totals (PRCP) in the PSCL and MFSL soils.
Figure 5B plots the MO 17 ΔCSM distributions at wheat termination (Apr. 7) and cotton planting. Because of the greater magnitude of wheat transpiration effects, at wheat termination the effect on column soil moisture is entirely negative, with the median effect of −82.89 mm, a maximum effect of −117.98 mm, and a minimum effect of −35.78 mm. But while transpiration effects that reduce soil moisture stop at wheat termination, the cover crop's surface shading effects that reduce surface evaporation continue between termination and cotton planting. As a result, the CSM reducing effects of the winter wheat cover crop are reduced or reversed during this period, producing soil moisture recharge. At cotton planting median ΔCSM is increased to −58.08 mm, and in 70 station years (23.8%) ΔCSM effects are positive. Figure 5C plots the PSCL soil's distribution of MO 17 wheat biomass at wheat termination. The median WBIO is 6675.0 kg ha−1, with an IQR of 3511.0 kg ha−1.
Table 2 shows Pearson correlations between May 25 ΔCSM and cumulative precipitation during simulation start to wheat termination (PRCPwh), the fallow period between wheat termination and cotton planting (PRCPfa), and simulation start to cotton planting (PRCPwh+fa). The PSCL ΔCSM is positive correlated (ρ = 0.633) with rainfall between simulation start and cotton planting, but correlated at a higher level with rainfall totals between wheat termination and cotton planting (ρ = 0.806). Thus, the effects of a winter wheat cover crop on May 25 PSCL soil moisture are more sensitive to precipitation conditions during the fallow period between termination and cotton planting.
Figures 5D–F, are the MFSL soil's counterparts to Figures 5A–C under the MO 18 management option. Like the PSCL soil, in Figure 5D the dominant WHCO effects are increased transpiration and reduced surface evaporation relative to the FACO control simulations. Also, similar to the PSCL soil, in Table 2 the ΔSE and ΔTR effects in the MFSL simulations are strongly anti-correlated (ρ = −0.847). But because the sandier MFSL soil holds less water than the PSCL soil (Table 1) the Figure 5D ΔSE and ΔTR effects have smaller magnitudes. The median ΔSE is −81.05 mm, with an IQR of 89.14 mm, while median ΔTR is +117.13 mm, with an IQR of 40.88 mm.
Figure 5E plots the ΔCSM distributions on the MO 18 wheat termination date (Apr. 15), and the May 25 cotton planting date. The column soil moisture effect at wheat termination is similar to the PSCL effect in Figure 5B, with a −88.73 mm median and an IQR of 19.97 mm. Also, like the PSCL soil, this negative soil moisture effect is reduced between wheat termination and cotton planting. On May 25 median ΔCSM increases to −32.15 mm, with an IQR (46.16 mm) roughly half that of the PSCL May 25 IQR in Figure 5B (89.51 mm). Similar to the PSCL soil, moisture recharge between wheat termination and planting results in a positive ΔCSM effect in roughly a quarter (23.5%) of station years. The Table 2 Pearson correlations between May 25 ΔCSM and precipitation totals during the PRCPwh, PRCPfa, and PRCPwh+fa periods show the highest correlation (ρ = 0.766) during the fallow period. Thus, like the PSCL soil, MFSL wheat cover crop effects on ΔCSM at cotton planting appear more sensitive to rainfall conditions after wheat termination. The median yield of wheat biomass simulated with the MFSL soil in Figure 5F (5741.0 kg ha−1) is less than that simulated with the PSCL soil (6675.0 kg ha−1). However, the MFSL soil produces a more skewed upper tail, with a 14720.0 kg ha−1 95th percentile of May 25 ΔCSM, vs. the 12191.0 kg ha−1 95th percentile of the PSCL soil.
Figure 6A plots the distributions of MO 17 effects on ΔDR, ΔRO, ΔSE, and ΔTR during the period between cotton planting (May 25) and harvest (Oct. 6) for the PSCL soil. Before cotton planting the simulated effects of a wheat cover crop are due to wheat transpiration before termination and the impacts of wheat residue after termination. However, the Figure 6A effects are that of cotton grown in terminated wheat residue vs. cotton grown in bare ground. Like Figure 5A's effects for the period before cotton planting, opposing surface evaporation and transpiration effects dominate, with a median ΔSE effect of −130.19 mm and a median ΔTR effect of +69.12 mm. The central 50% of ΔSE outcomes ranges between −157.81 and −96.72 mm, while the central 50% of ΔTR outcomes extends between 43.53 and 100.73 mm. Thus, relative to the FACO simulations, the WHCO simulations with cotton planted and grown in wheat residue generally result in increased cotton transpiration and decreased surface evaporation, but with larger surface evaporation effects. This is a reversal of the PSCL cover crop effects before cotton planting in Figure 5A, where the ΔTR effects that reduce column soil moisture generally exceeded the ΔSE effects that recharge CSM. In Figure 6A the reduction in runoff in WHCO production is considerably less than the reduction of surface evaporation, with a median ΔRO of −11.78 mm and the central 50% of ΔRO outcomes ranging between −3.73 and −22.39 mm. Although drainage effects are 0.0 mm in 248 station-years, in 45 station-years (15.3%) ΔDR values are positive and as large as 155.47 mm.
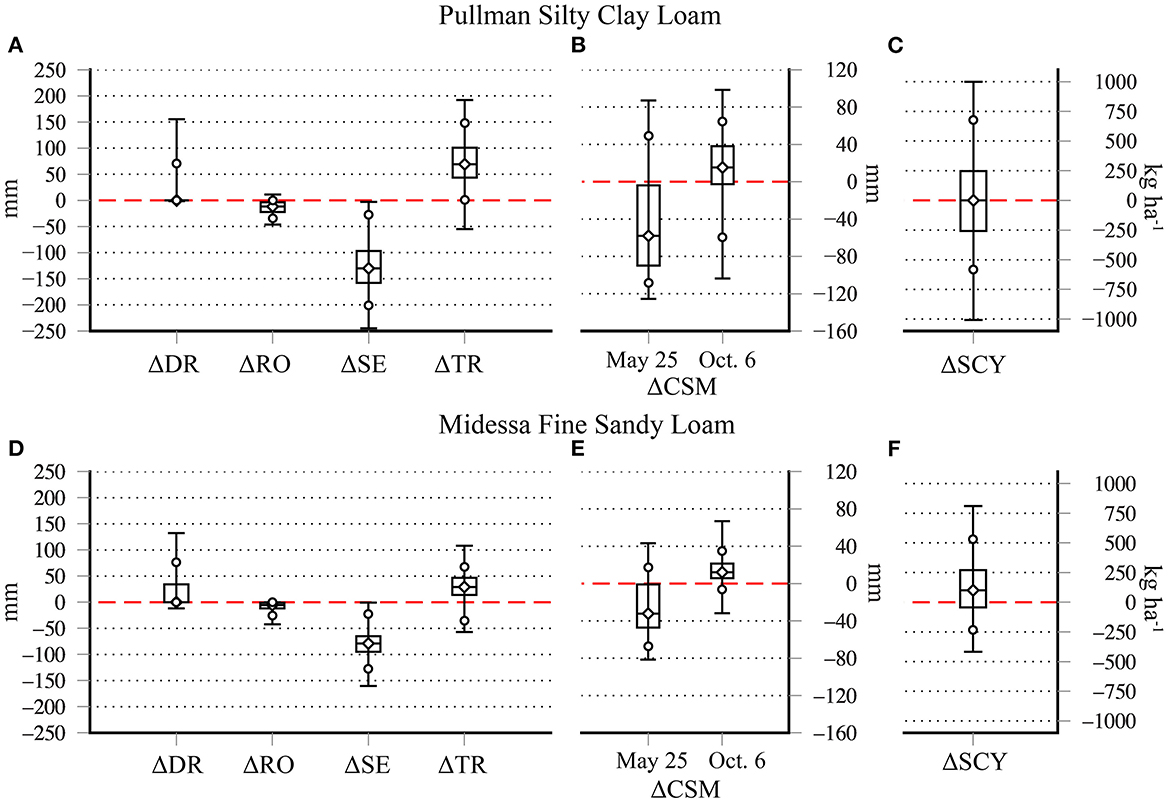
Figure 6. (A) Distributions of MO 17 WHCO-FACO management effects on cumulative drainage (ΔDR), runoff (ΔRO), surface evaporation (ΔSE), and transpiration (ΔTR) during cotton planting to cotton harvest for the PSCL soil. (B) Distributions of column soil moisture effects (ΔCSM) at MO 17 cotton planting (May 25) and harvest (Oct. 6) dates. (C) Distribution of MO 17 seed cotton yield effects (ΔSCY). (D) Distributions of MO 18 WHCO-FACO management effects on cumulative drainage (ΔDR), runoff (ΔRO), surface evaporation (ΔSE), and transpiration (ΔTR) during cotton planting to cotton harvest for the MFSL soil. (E) Distributions of column soil moisture effects (ΔCSM) at MO 18 cotton planting (May 25) and harvest (Oct. 6) dates. (F) Distribution of MO 18 seed cotton yield effects (ΔSCY).
Figure 6B plots the ΔCSM distributions at cotton planting (May 25) and harvest (Oct. 6). As the WHCO and FACO simulations have different column soil moisture at cotton planting, the Oct 6. distribution reflects the combined effects of Figure 6A's distributions and the initial ΔCSM effects at planting (Equation 5). Whereas at cotton planting the WHCO simulations resulted in higher CSM than the control FACO simulation in 23.8% of station-years, at cotton harvest that percentage increases to 69.7%. The median ΔCSM on May 25 is −58.08 mm, but increases to 15.25 mm on Oct. 6. As a result, because of the dominance of negative surface evaporation effects over positive transpiration effects during the summer growing season, the WHCO cotton crop increases harvest column soil moisture in almost 70% of station-years.
Figure 6C plots the distribution of seed cotton yield effects for MO 17. That distribution is almost exactly divided between positive and negative yield effects, with a median of 0.0 kg ha−1, a 25th percentile of −258.0 kg ha−1, and a 75th percentile of 247.0 kg ha−1. Thus, despite the clear summer CSM recharge effects, the probability of MO 17 WHCO management producing a positive yield effect relative to FACO management is similar to an evenly weighted coin flip. To gauge the connections between the PSCL seed cotton yield effects and the soil water effects of Equation 5, Table 3 lists the Pearson correlations of the Figure 6C ΔSCY values with the Equation 5 soil water effects. These include ΔCSM at cotton planting, ΔDR, ΔRO, ΔSE, and ΔTR effects from cotton planting to harvest, and total precipitation during planting to harvest (PRCPcp − ch). Although all correlations except that with ΔDR are significant, none suggests particularly strong connections with ΔSCY in the PSCL simulations. The highest magnitude correlation is with ΔTR (ρ = 0.546), followed by ΔCSM at cotton planting (ρ = 0.484). The former correlation is, however, higher than that with cotton growing season precipitation (ρ = 0.200), which indicates that cover crop-related soil moisture deficits at planting may have a stronger influence on seed cotton yield effects than in-season precipitation.
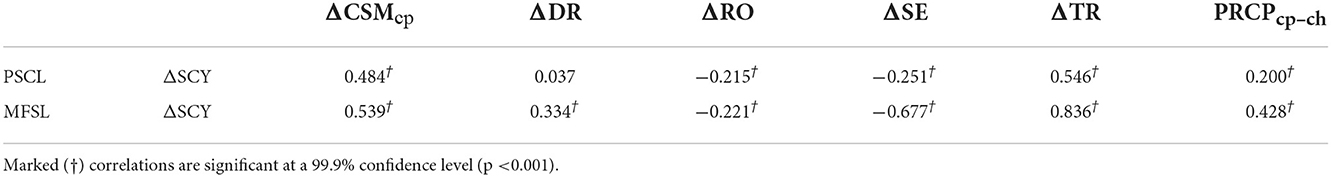
Table 3. Pearson correlations of PSCL and MFSL seed cotton yield effects (ΔSCY) vs. column soil moisture effects at planting (ΔCSMcp), drainage (ΔDR), runoff (ΔRO), surface evaporation (ΔSE), and transpiration (ΔTR) effects during the cotton planting to harvest period, and total planting to harvest precipitation (PRCPcp−ch).
Figure 6D is the MFSL counterpart for Figure 6A under the MO 18 management option. The effects of WHCO management on the four water balance components resemble those of the PSCL soil, except for smaller magnitudes and a higher incidence of positive drainage effects that reduce column soil water. Like the PSCL soil, the leading surface evaporation and transpiration effects are dominated by surface evaporation, with median ΔSE and ΔTR of −78.88 and 29.27 mm, respectively. Runoff effects range between 0.0 mm and a maximum ΔRO of −42.15 mm. But in contrast to the 15.3% incidence of positive ΔDR effects in the PSCL soil, positive drainage effect values occur in the MFSL soil in 50.0% of the 294 station-years. This indicates a loss of column soil moisture, but also indirectly shows that increased soil moisture infiltration in cotton grown in wheat residue resulted in more water crossing the depth of the sandier MFSL soil column. In 25% of the station-years the MFSL ΔDR effects are >34.29 mm, with a maximum of 132.27 mm.
Figure 6E plots the ΔCSM distributions for the MFSL soil at cotton planting and harvest. Because of the dominance of reduced surface evaporation, summer cotton production in the WHCO simulations results in a general shift from reduced soil moisture at planting to increased soil moisture at harvest, relative to the control FACO simulations. At cotton planting the incidence of negative ΔCSM effects is 76.5%, but drops to 11.9% at harvest. Median ΔCSM at planting is −32.15 mm, but increases to 12.10 mm at harvest.
Figure 6F plots the distribution of seed cotton yield effects for MO 18. In contrast to the PSCL soil's coin-flip yield effects, the simulated MFSL effects are positive in 196 of 294 station-years (66.7%), with a median effect of 100.0 kg ha−1. Also, the Table 3 correlations calculated with ΔSCY effects simulated with the MFSL soil indicate stronger connections with transpiration, surface evaporation, and drainage effects, and in-season precipitation. Compared to the PSCL simulations, ΔSCY effects with the sandier MFSL soil are more strongly correlated with transpiration (ρ = 0.836) and surface evaporation effects (ρ = −0.677). Although drainage effects were not significantly correlated with seed cotton yield effects in the PSCL simulations (ρ = 0.037), in the MFSL simulations there is a weak (ρ = 0.334) but significant positive correlation of ΔSCY with ΔDR. This, combined with the higher positive correlation of MFSL ΔSCY with planting-to-harvest precipitation totals (ρ = 0.428), indicates that cotton production in wheat residue in sandier soils may lead to stronger reductions in soil evaporation, increased infiltration of precipitation, increased crop transpiration, and a higher incidence of positive yield effects.
To control for the effects of initial soil moisture in dryland production, the simulated results in Figure 3 through 6 were derived from fall soil moisture conditions at field capacity. However, in the SHP's semi-arid climate winter cover crops are rarely planted into a full soil moisture profile. To estimate winter cover crop effects under more representative fall planting conditions, the simulations were repeated over a range of initial soil moisture levels.
For the PSCL soil the MO 17 WHCO and FACO simulations were repeated with Sept. 17 CSMi at k = 10 levels from field capacity to slightly above the soil's wilting point, i.e.,
where ΔZn are the 13 soil core layer's thickness in cm and k = 1.0, 0.9, 0.8, ..., 0.1. The MO 18 simulations were similarly repeated for the MFSL soil based on CSMi values calculated from that soil's θfc and θwp values (Figure 2D). As a result, CSMi values were linearly reduced from 100 to 10% of each soil's maximum plant available water (PAWmx). Total CSMi for the PSCL soil dropped from 80.43 to 58.84 cm as k is reduced, while the values for the MFSL soil dropped from 41.85 to 28.37 cm.
Both soil's wheat biomass distributions are plotted in Figure 7A. In the PSCL soil median WBIO remains above 6200.0 kg ha−1 with CSMi above 70% of PAWmx, but drops from 5605.0 kg ha−1 to 582 kg ha−1 as CSMi is reduced from 70 to 10%. At 10% of PAWmx, 25% of the station-years produced negligible amounts (< 70.0 kg ha−1) of wheat biomass. By contrast, WBIO levels simulated with the MFSL soil are more stable as initial soil moisture is reduced. The median WBIO level for the MFSL soil at 100% PAWmx is 5471.0 kg ha−1, decreasing to 3177 kg ha−1 at 10% PAWmx. At 10% of PAWmx, 75% of the station-years produced more than 1771.0 kg ha−1 of wheat biomass.
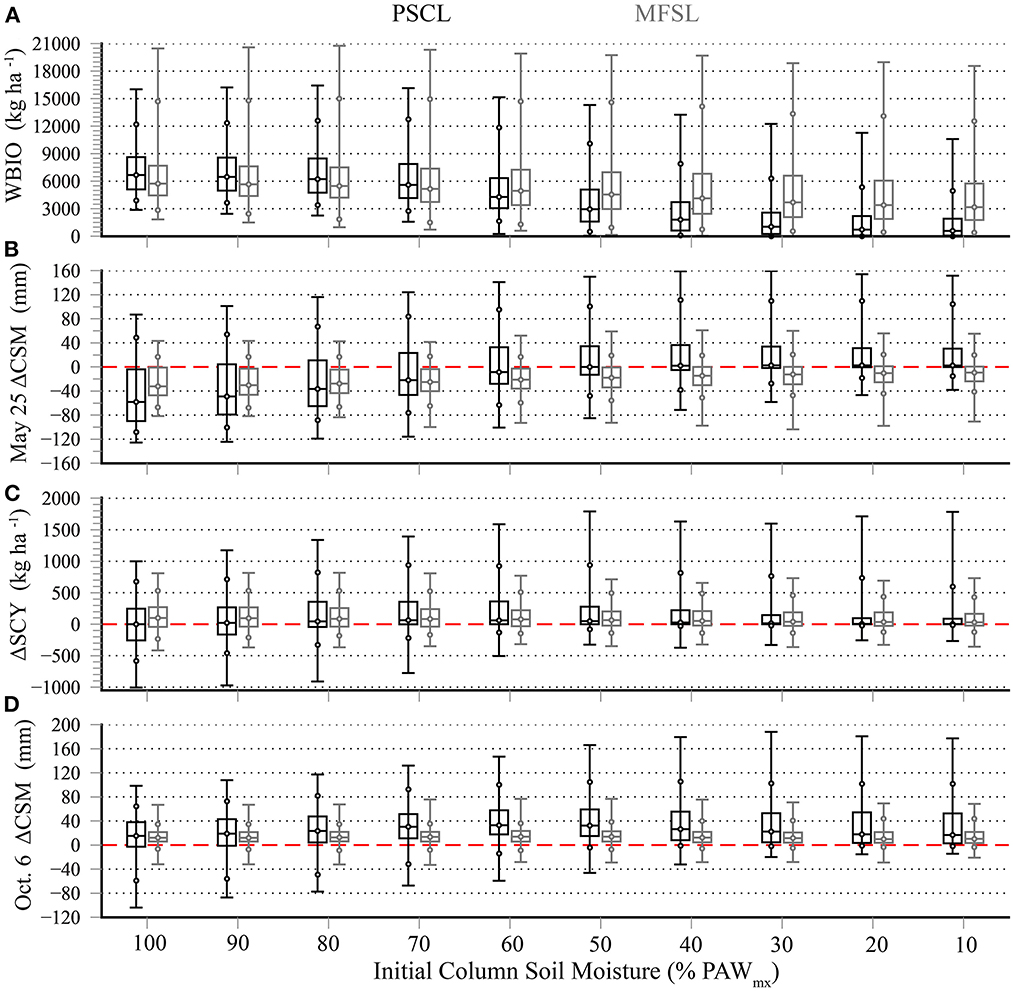
Figure 7. (A) Distributions of PSCL MO 17 and MFSL MO 18 wheat biomass (WBIO) for initial fall column soil moisture conditions ranging from 100 to 10% of maximum plant available water (PAWmJ). (B) As in (A) for PSCL and MFSL column soil moisture effects (ΔCSM) at cotton planting. (C) As in (A) for PSCL and MFSL seed cotton yield (ΔSCY). (D) As in (A) for PSCL and MFSL ΔCSM at cotton harvest.
Figure 7B plots the distributions of column soil moisture effects at cotton planting. As initial fall CSM is decreased in the PSCL soil median May 25 ΔCSM increases from −58.08 to +2.57 mm. At 100% PAWmx 76.2% of ΔCSM outcomes are negative, but when initial soil moisture drops to 10% PAWmx that fraction drops to 33.7%. Thus, relative to the control FACO simulations, in the PSCL soil decreasing soil moisture at wheat planting leads to more soil moisture at cotton planting. This is a consequence of Figure 7A's decreasing PSCL wheat biomass production, which produces reduced surface evaporation effects, but also leads to greater reductions in wheat evapotranspiration. As in Figure 5A, ΔSE and ΔTR effects dominate in the Figure 7 simulations, but the greater reduction in transpiration from reduced WBIO production reduces and reverses the net negative effects on May 25 ΔCSM in Figure 5B. Because reduced soil moisture at wheat planting has a weaker effect on reducing wheat biomass in the MFSL soil, a similar effect is not found in the medians of MFSL May 25 ΔCSM. As initial fall column soil moisture is decreased in the MFSL soil ΔCSM at cotton planting increases from −32.15 mm to −9.25 mm, but ~75% of CSM effects remain negative regardless of initial soil moisture conditions.
Figure 7C plots both soil's ΔSCY distributions as fall CSMi is reduced. As CSMi drops and the incidence of positive PSCL ΔCSM effects at cotton planting increases in Figure 7B, the incidence of positive ΔSCY similarly increases. At 100% PAWmx the probability of a positive PSCL ΔSCY outcome resembles a coin flip, but at 70% PAWmx those odds rise to 75.3%. Median ΔSCY increases from 0.0 kg ha−1 at 100% PAWmx to a maximum of 62.0 kg ha−1 at 70% PAWmx. At 70% PAWmx the central 50% of ΔSCY outcomes extend from −2.0 to 357.0 kg ha−1, but decreases to 0.0 to 87.0 kg ha−1 when initial fall soil moisture is reduced to 10% PAWmx. But like the MFSL soil's limited variability in WBIO and ΔCSM at cotton planting in Figures 7A,B, MFSL ΔSCY effects remain mostly positive as initial fall soil moisture is reduced. As soil moisture is reduced from 100% to 10% PAWmx, median ΔSCY decreases from 100.0 to 30.0 kg ha−1, with positive outcomes occurring in between 65.3 and 69.1% of station-years.
Figure 7D plots the distributions of harvest ΔCSM, which shows a high incidence of positive effects for both soils regardless of initial soil moisture conditions. Median ΔCSM values for the PSCL soil increase to a maximum 33.01 mm as initial soil moisture is reduced to 60% PAWmx, then decline to 16.07 mm at 10% PAWmx. The highest percentage of positive Oct. 6 ΔCSM (93.5%) outcomes occurs at 40% PAWmx. Like the MFSL effects in Figures 7A–C, median ΔCSM values remain relatively unchanged, varying between 9.88 mm (20% PAWmx) and 13.99 mm (50% PAWmx). Under no initial soil moisture level is the probability of a positive MFSL ΔCSM effect < 87.4%.
Although the cotton yield effects of winter wheat cover crops were sensitive to the soil types the simulations were based on, when soil moisture was initialized at field capacity the critically important effects on soil water balances were generally consistent. Before cotton planting (Figure 5) terminated winter wheat's effects on column soil moisture (ΔCSM) in both the PSCL and MFSL soils were dominated by highly anti-correlated surface evaporation and transpiration effects, with winter wheat cover reducing soil moisture via transpiration but also increasing soil moisture through reduced surface evaporation. In both soils the transpiration effects exceeded the surface evaporation effects, which resulted in a net reduction in both soil's water content at wheat termination relative to control simulations that planted no winter wheat (Figures 5B,E). After termination transpiration effects stop but the wheat residue's effects on reducing surface evaporation continue, resulting in soil moisture recharge between termination and cotton planting in both soils. Correlations between ΔCSM at cotton planting and precipitation totals between simulation start and wheat termination, wheat termination and cotton planting, and simulation start to cotton planting (Table 2), indicated that soil moisture effects at cotton planting are most sensitive to rainfall between termination and cotton planting. But in both soils, winter wheat cover crops still reduced column soil moisture at cotton planting in roughly 75% of the simulations. After cotton planting (Figure 6) the impact of wheat residue on summer soil moisture were also dominated by transpiration and surface evaporation effects, but residue's reductions in surface evaporation generally exceeded the increased transpiration of cotton grown in wheat residue. As a result, relative to the control simulations, in simulations initialized with soil water at field capacity both soils showed increases in column soil moisture at harvest in more than 70% of the simulations (Figures 6B,E). Thus, although the Adhikari et al. (2017) DSSAT simulations found that a winter wheat cover crop produced no clear effect on average soil water in Texas Rolling Plains (TRP) dryland cotton production, the simulations here showed a modest positive effect with at least a 70% probability. Before and after cotton planting, the simulated column soil moisture effects here were also generally proportional to the soil's water-holding capacity (Table 1), e.g., the PSCL soil's more negative median ΔCSM and wider inter-quartile range of ΔCSM at cotton planting in Figure 5B relative to the Figure 5E MFSL effects. Similarly, summer soil moisture recharge and surface evaporation effects in Figures 6A,D, and column soil moisture effects in Figures 6B,E, had higher magnitudes and were more variable in the higher capacity PSCL soil.
The incidence of positive and negative cotton yield effects in both soils suggests that the mixed outcomes of past SHP field trials (Keeling et al., 1989; Bordovsky et al., 1994; Baumhardt and Lascano, 1999; Sij et al., 2003; Lewis et al., 2018) might reflect their semi-random sampling of seasonal rainfall conditions and/or the soil types the trials were conducted in. But although the effects of a wheat cover crop on soil moisture were similar in the two soils, the seed cotton yield effects simulated here also suggest that, contrary to Unger and Vigil's (1998) review of cover crop effects, growing dryland cotton in wheat residue may increase yields in the SHP region's sandier soils more often than not. While the impacts of wheat residue in the PSCL soil were evenly divided between positive and negative yield effects (Figure 6C), there was a 67% incidence of positive effects in simulations conducted in the MFSL soil (Figure 6F). Comparing Pearson correlations calculated between seed cotton yield effects and the Equation 5 components contributing to soil moisture effects in both soils (Table 3) also shows that wheat residue's effects on soil moisture have a stronger impact on simulated yields in the sandier MFSL soil. Thus, while the Adhikari et al. (2017) simulations showed no substantial cover crop effect on average seed cotton yield under dryland and irrigated conditions, the results here indicate a 2 in 3 chance of positive dryland yield effects in sandier soils. But although the Himanshu et al. (2022) TRP simulations found that winter wheat cover improved dryland water productivity, the results here also indicated that cover crops can also reduce dryland cotton yields and water productivity with probabilities that are soil dependent.
The simulations here also suggest that the effects of a wheat cover crop may be more sensitive to initial soil conditions and management practices in higher water capacity soils. Relative to the MFSL simulations, varying initial soil moisture in the simulations had clear effects on wheat biomass and column soil moisture effects at cotton planting in the PSCL soil (Figures 7A,B). Winter-spring precipitation was more highly correlated with column soil moisture effects at cotton planting in the PSCL soil (Table 2), while PSCL seed cotton yield effects were more highly correlated with ΔCSM at cotton planting than summer precipitation (Table 3). As a result, in higher capacity soils fall soil moisture and winter precipitation conditions may play a larger role in determining a wheat cover crop's effect on cotton yields. Because the El Niño-Southern Oscillation (ENSO) mechanism has predictable effects on SHP winter precipitation (Mauget and Upchurch, 1999), decisions to plant or not plant a wheat cover crop in these soils might be guided by ENSO seasonal forecasts and fall soil moisture conditions. Also, timely termination of winter wheat may play a larger role in determining cover crop effects on soil moisture and cash crop yields. In the PSCL soil delayed wheat termination led to increased biomass production, but, unlike the MFSL simulations, increasing incidences of negative seed cotton yield effects (Figures 3B, 4B). This is due to the larger effects of PSCL wheat cover on reducing soil moisture at cotton planting (Figures 5B,E). Thus, while the latest Apr. 15 termination date resulted in an optimal balance between wheat biomass production and seed cotton yield in the MFSL soil, in the PSCL soil terminating on that date led to increased wheat biomass but an increased incidence of negative cotton yield effects. However, when the PSCL wheat simulations were terminated on Apr. 7 with initial fall soil moisture conditions at field capacity there was still only a 50% chance of a positive effect on seed cotton yield. Under drier initial soil conditions those odds may improve (Figure 7C), but at the expense of reduced wheat biomass production (Figure 7A).
Mauget et al. (2021) proposed a “virtuous cycle” where the gradual transformation of cover crop residue into soil organic carbon (SOC) might increase soil water capacity in semi-arid regions, which could in turn support increased cover crop production, residues, and cash crop yields. But they also found that higher SOC levels produced a weak effect on soil water capacity in their pedotransfer function analyses of two SHP soils. It was suggested that this weak effect might be compensated for by the increased soil water inputs resulting from residue retention, and such an effect was found in these simulations. Although moisture-depleting wheat transpiration is the leading effect before wheat termination, wheat residue's moisture-recharging surface evaporation effects dominate after termination. In these simulations this resulted in high incidences of positive column moisture effects at the end of a terminated wheat – cotton production cycle in both soils regardless of initial soil moisture conditions (Figure 7D). This is consistent with Burke et al.'s (2021) 3-year (2014–2015, 2015–2016, 2016–2017) SHP field study of irrigated cotton preceded by fallow and winter cover crops, which found that while cover crops reduced CSM prior to cotton planting, they also led to soil moisture recovery after termination and during the cotton growing season. This is also generally consistent with Himanshu et al.'s (2022) simulations, which found that soil moisture depleted by a winter cover crop was replenished by spring precipitation after termination, and that cover crop residue resulted in increased soil moisture during the cotton growing season. Thus, together, these field study and simulated results suggest that this cycle might not be achieved via the higher SOC and soil water capacity effects of cover crop residue, but through residue's effects on reducing summer surface evaporation and increasing precipitation storage. However, the simulations here also show that wheat cover crops can reduce cotton yields with varying probabilities that depend on soil type and initial soil moisture conditions. Given the possibility of reduced yields and yield revenues, in SHP dryland cotton production these potential yield effects would be accompanied by profit risk on a year-to-year basis.
In the semi-arid dryland cotton production modeled here the effects of terminated winter wheat cover crops were probabilistic and, in some respects, dependent on the silty clay loam and fine sandy loam soils the simulations were based upon.
• In DSSAT simulations initialized at field capacity there was a consistent response in both soils of soil moisture depletion before spring wheat termination, with soil moisture recharge after termination and during the summer growing season.
• Over a range of initial soil moisture conditions the net effect on soil moisture in both soils at cotton harvest was of modest positive effects with at least a 70% probability.
• The magnitude and variability of cover crop soil moisture effects, and the related surface evaporation and transpiration effects contributing to them, were proportional to the soil's water holding capacity.
• Generally positive soil moisture effects were accompanied by the risk of reduced seed cotton yields, with negative yield effects found in 50% and 33% of the silty clay loam and fine sandy loam simulations respectively.
• The effect of cover crop residue in reducing surface evaporation during the summer growing season may be a key factor in increasing precipitation retention and soil moisture in semi-arid dryland production.
Overall, these results demonstrate that dryland semi-arid cropping outcomes that are strongly dependent on growing season weather variation are probabilistic in nature. Thus, the outcomes of field and modeling studies conducted over a limited sampling of growing seasons may not be climatically representative. As a result, estimating weather-sensitive agricultural impacts in semi-arid regions requires estimating the effects of a broad sampling of growing season weather conditions. Practically, this may only be possible though crop model simulation.
The raw data supporting the conclusions of this article will be made available by the authors, without undue reservation.
SM conducted simulations and produced the manuscript's first draft. SH and SA conducted simulations and contributed to the revised manuscript draft. TG, PP, and KL conducted field soil surveys and provided estimates of soil texture composition and organic carbon levels. RB contributed to and advised on experimental design, and contributed to first and revised drafts of manuscript. All authors contributed to the article and approved the submitted version.
The authors would like to thank NOAA's National Mesonet Program and Texas Tech University for continued support in maintaining the West Texas Mesonet. Thanks to Fabio Oliviera and Gerritt Hoogenboom of the University of Florida's Food System Institute for help with configuring the DSSAT model to simulate a winter wheat cover crop – dryland cotton cropping sequence. All figures were produced using Generic Mapping Tools (Wessel et al., 2013). The mention of trade or manufacturer names is made for information only and does not imply an endorsement, recommendation, or exclusion by the USDA-Agricultural Research Service (ARS). The USDA is an equal opportunity provider and employer.
Author PP is employed by Goanna Ag.
The remaining authors declare that the research was conducted in the absence of any commercial or financial relationships that could be construed as a potential conflict of interest.
All claims expressed in this article are solely those of the authors and do not necessarily represent those of their affiliated organizations, or those of the publisher, the editors and the reviewers. Any product that may be evaluated in this article, or claim that may be made by its manufacturer, is not guaranteed or endorsed by the publisher.
ARS, Agricultural Research Service; CSM, Column Soil Moisture; CUL, DSSAT Cultivar Parameters; DR, Drainage; DSSAT, Decision Support System for Agrotechnology Transfer; ECO, DSSAT Ecotype Parameters; ET, Evapotranspiration; FACO, Fallow-Cotton Crop Sequence; fc, Field Capacity; MFSL, Midessa Fine Sandy Loam; MO, Management Option; N, Nitrogen; PAW, Plant Available Water; PET, Potential Evapotranspiration; PRCP, Precipitation; PRCPwh, Precipitation (Simulation Start – Wheat Termination); PRCPwh, Precipitation (Wheat Termination – Cotton Planting); PRCPwh, Precipitation (Simulation Start – Cotton Planting); PRCPcp−ch, Precipitation (Cotton Planting – Cotton Harvest); PSCL, Pullman Silty Clay Loam; RO, Runoff; s, Saturation; SCY, Seed Cotton Yield; SE, Surface Evapotranspiration; SHP, Southern High Plains; SOC, Soil Organic Carbon; SPE, DSSAT Species Parameters; TR, Transpiration; TRP, Texas Rolling Plains; USDA, U.S. Department of Agriculture; WBIO, Wheat Biomass; WHCO, Wheat-Cotton Crop Sequence; wp. Wilting Point; WTM, West Texas Mesonet; Z, Soil Layer Depth.
Adetunji, A. T., Ncube, B., Mulidzi, R., and Lewu, F. B. (2020). Management impact and benefit of cover crops on soil quality: a review. Soil Till. Res. 204:104717. doi: 10.1016/j.still.2020.104717
Adhikari, P., Omani, N., Ale, S., DeLaune, P. B., Thorp, K. R., Barnes, E. M., et al. (2017). Simulated effects of winter wheat cover crop on cotton production systems of the Texas Rolling Plains. T. ASABE 60, 2083–2096. doi: 10.13031/trans.12272
Balkcom, K., Schomberg, H., Reeves, W., Clark, A., Baumhardt, L., Collins, H., et al. (2007). “Managing cover crops in conservation tillage systems,” in Sustainable Agriculture Research and Education (SARE), ed A. Clark (College Park, MD: SARE (Sustainable Agriculture Research and Education) Outreach), 44–61.
Baumhardt, R. L., and Lascano, R. J. (1999). Water budget and yield of dryland cotton intercropped with terminated winter wheat. Agron. J. 91, 922–927. doi: 10.2134/agronj1999.916922x
Boote, K. J., Sau, F., Hoogenboom, G., and Jones, J. W. (2008). “Experience with water balance, evapotranspiration, and predictions of water stress effects in the CROPGRO model,” in Response of Crops to Limited water: Understanding and Modelling Water Stress Effects on Plant Growth Processes, eds L. R Ahuja, V. R. Reddy, S. A. Sassendran, Q. Yu (Madison, WI: ASA - CSSA – SSSA), 59–103. doi: 10.2134/advagricsystmodel1.c3
Bordovsky, J. P., Lyle, W. M., and Keeling, J. W. (1994). Crop rotation and tillage effects on soil water and cotton yield. Agron. J. 86, 1–6. doi: 10.2134/agronj1994.00021962008600010001x
Bronson, K. R., Malapati, A., Booker, J. D., Scanlon, B. R., Hudnall, W. H., and Schubert, A. M. (2009). Residual soil nitrate in irrigated Southern High Plains cotton fields and Ogallala groundwater nitrate. J. Soil Water Conserv. 64, 98–104. doi: 10.2489/jswc.64.2.98
Burke, J. A., Lewis, K. L., Ritchie, G. L., DeLaune, P. B., Keeling, J. W., Acosta-Martinez, V., et al. (2021). Net positive soil water content following cover crops with no tillage in irrigated semi-arid cotton production. Soil Till. Res. 208:104869. doi: 10.1016/j.still.2020.104869
Dabney, S. M., Delgado, J. A., and Reeves, D. W. (2001). Using winter cover crops to improve soil and water quality. Commun. Soil Sci Plan. 32, 1221–1250. doi: 10.1081/CSS-100104110
DeLaune, P. B., Mubvumba, P., Fan, Y., and Bevers, S. (2020). Agronomic and economic impacts of cover crops in Texas rolling plains cotton. Agrosys. Geo. Environ. 3:e20027. doi: 10.1002/agg2.20027
Gijsman, A. J., Jagtap, S. S., and Jones, J. W. (2002). Wading through a swamp of complete confusion: how to choose a method for estimating soil water retention parameters for crop models. Eur. J. Agron. 18, 75–105. doi: 10.1016/S1161-0301(02)00098-9
Himanshu, S. K., Ale, S., Bordovsky, J. P., Kim, J. J., Samanta, S., Omani, N., et al. (2021). Assessing the impacts of irrigation termination periods on cotton productivity under strategic deficit irrigation regimes. Sci. Rep. 11:20102. doi: 10.1038/s41598-021-99472-w
Himanshu, S. K., Ale, S., DeLaune, P. B., Singh, J., Mauget, S. A., and Barnes, E. M. (2022). Assessing the effects of a winter wheat cover crop on soil water use, cotton yield, crop water productivity, and soil organic carbon in no-till cotton production systems. J. ASABE. 65, 1163–1177. doi: 10.13031/ja.15181
Holliday, V. T. (1990). Soils and landscape evolution of eolian plains: the Southern High Plains of Texas and New Mexico. Geomorphology 3, 489–515. doi: 10.1016/0169-555X(90)90018-L
Hoogenboom, G., Porter, C. H., Boote, K. J., Shelia, V., Wilkens, P. W., Singh, U., et al. (2019). “The DSSAT crop modeling ecosystem,” in Advances in Crop Modeling for a Sustainable Agriculture, eds K. J. Boote (Cambridge: Burleigh Dodds Science Publishing), 173–216. doi: 10.19103/AS.2019.0061.10
Jones, J. W., Hoogenboom, G., Porter, C. H., Boote, K. J., Batchelor, W. D., Hunt, L. A., et al. (2003). The DSSAT cropping system model. Eur. J. Agron. 18, 235–265. doi: 10.1016/S1161-0301(02)00107-7
Kassam, A., Friedrich, T., Shaxson, F., and Pretty, J. (2009). The spread of conservation agriculture: justification, sustainability and uptake. Int. J. Agr. Sustain. 7, 292–320. doi: 10.3763/ijas.2009.0477
Keeling, W., Segarra, E., and Abernathy, J. R. (1989). Evaluation of conservation tillage cropping systems for cotton on the Texas Southern High Plains. J. Prod. Agric. 2, 269–273. doi: 10.2134/jpa1989.0269
Kimura, E., Bell, J., Trostle, C., and Neely, C. (2017). Winter Wheat Management Calendar for the Rolling Plains and High Plains of Texas. Available online at: https://agrilifeextension.tamu.edu/wp-content/uploads/2019/07/ESC-048_-Winter-Wheat-Management-Calendar-for-the-Rolling-Plains-and-High-Plains-of-Texas.pdf (accessed May 6, 2021).
Lewis, K. L., Burke, J. A., Keeling, W. S., McCallister, D. M., DeLaune, P. B., and Keeling, J. W. (2018). Soil benefits and yield limitations of cover crop use in Texas High Plains cotton. Agron. J. 110, 1616–1623. doi: 10.2134/agronj2018.02.0092
Mauget, S., Leiker, G., and Nair, S. (2013). A web application for cotton irrigation management on the U.S. Southern High Plains. Part I: crop yield modeling and profit analysis. Compute. Electron. Agr. 99, 248–257. doi: 10.1016/j.compag.2013.10.003
Mauget, S. A., Adhikari, P., Leiker, G., Baumhardt, R. L., Thorp, K. R., and Ale, S. (2017). Modeling the effects of management and elevation on West Texas dryland cotton production. Agr. Forest. Meteor. 247, 385–398. doi: 10.1016/j.agrformet.2017.07.009
Mauget, S. A., Himanshu, S. K., Goebel, T. S., Ale, S., Lascano, R. J., Gitz, I. I. I., et al. (2021). Soil and soil organic carbon effects on simulated Southern High Plains dryland Cotton production. Soil Till. Res. 212:105040. doi: 10.1016/j.still.2021.105040
Mauget, S. A., and Upchurch, D. R. (1999). El Niño and La Niña related climate and agricultural impacts over the Great Plains and Midwest. J. Prod. Agr. 12, 203–215. doi: 10.2134/jpa1999.0203
McGuire, V. L. (2017). Water-Level and Recoverable Water in Storage Changes, High Plains Aquifer, Predevelopment to 2015 and 2013–15. Scientific Investigations Report 2017-5040, USGS Groundwater and Streamflow Information Program. doi: 10.3133/sir20175040
Pathak, T. B., Fraisse, C. W., Jones, J. W., Messina, C. D., and Hoogenboom, G. (2007). Use of global sensitivity analysis for CROPGRO cotton model development. T. ASABE. 50, 2295–2302. doi: 10.13031/2013.24082
Pathak, T. B., Jones, J. W., Fraisse, C. W., Wright, D., and Hoogenboom, G. (2012). Uncertainty analysis and parameter estimation for the CSM-CROPGRO-Cotton model. Agron. J. 104, 1363–1373. doi: 10.2134/agronj2011.0349
Pittelkow, C. M., Liang, X., Linquist, B. A., van Groenigan, K. J., Lee, J., Lundy, M. E., et al. (2015). Productivity limits and potentials of the principles of conservation agriculture. Nature 517, 365–368. doi: 10.1038/nature13809
R Core Team (2017). R: A Language and Environment for Statistical Computing. Available online at: https://www.RProject.org/ (accessed March 28, 2018).
Ritchie, J. T. (1998). “Soil water balance and plant water stress,” in Understanding Options for Agricultural Production, eds G. Y. Tsuji, G. Hoogenboom, G. P. K. Thornton (Dordrecht: Kluwer Academic Publishing), 41–54. doi: 10.1007/978-94-017-3624-4_3
Ritchie, J. T., and Otter, S. (1985). “Description and performance of CERES-wheat: a user-oriented wheat yield model,” in ARS Wheat Yield Project, ARS-38. National Technology Information Service (Alexandria, VA: Springfield), 159–175.
Ritchie, J. T., Porter, C. H., Judge, J., Jones, J. W., and Suleiman, A. A. (2009). Extension of an existing model for soil water evaporation and redistribution under high water content conditions. Soil Sci. Soc. Am. J. 73, 792–801. doi: 10.2136/sssaj2007.0325
Ritchie, J. T., Singh, U., Godwin, D. C., and Bowen, W. T. (1998). “Cereal growth, development and yield. Understanding options for agricultural production,” in Understanding Options for Agricultural Production, eds G. Y. Tsuji, G. Hoogenboom, G. P. K. Thornton (Dordrecht: Kluwer Academic Publishing), 79–98. doi: 10.1007/978-94-017-3624-4_5
Robinson, C., and Nielsen, D. (2015). The water conundrum of planting cover crops in the Great Plains: when is an inch not an inch? Crops Soils 48, 24–31. doi: 10.2134/cs2015-48-1-7
SARE (2012). Managing Cover Crops Profitably. Sustainable Agriculture Research and Education, College Park, MD. 244. Available online at: https://www.sare.org/wp-content/uploads/Managing-Cover-Crops-Profitably.pdf (accessed April, 22 2021).
Scanlon, B. R., Faunt, C. F., Longuevergne, L., Reedy, R. C., Alley, W. M., McGuire, V. L., et al. (2012). Groundwater depletion and sustainability of irrigation in the US High Plains and Central Valley. Proc. Natl. Acad. Sci. U.S.A. 109, 9320–9325. doi: 10.1073/pnas.1200311109
Schroeder, J. L., Burgett, W. S., Haynie, K. B., Sonmez, I., Skwira, G. D., Doggett, A. L., et al. (2005). The West Texas Mesonet: a technical overview. J. Atmos. Ocean. Tech. 22, 211–222. doi: 10.1175/JTECH-1690.1
Serraj, R., and Siddique, K. (2012). Conservation agriculture in dry areas. Field Crop. Res. 132, 1–6. doi: 10.1016/j.fcr.2012.03.002
Sharma, P., Singh, A., Kahlon, C. S., Brar, A. S., Grover, K. K., Dia, M., et al. (2018). The role of cover crops towards sustainable soil health and agriculture—A review paper. Am. J. Plant Sci. 9, 1935–1951. doi: 10.4236/ajps.2018.99140
Sij, J. W., Ott, J. P., Baughman, T. A., and Bordovsky, D. (2003). “Dryland cropping systems to enhance soil moisture capture and water-use efficiency in cotton,” in Proceedings of the 2003 Beltwide Cotton Conferences (Nashville, TN: National Cotton Council), 1861–1866.
Stout, J. E. (2001). Dust and environment in the southern high plains of North America. J. Arid Environ. 47, 425–441. doi: 10.1006/jare.2000.0732
Unger, P. W., and Vigil, M. F. (1998). Cover crop effects on soil water relationships. J. Soil. Water Conserv. 53, 200–207.
Wallander, S., Smith, D., Bowman, M., and Claassen, R. (2021). Cover Crop Trends, Programs, and Practices in the United States. EIB 222, U.S. Department of Agriculture, Economic Research Service, 31. p. Available online at: https://www.ers.usda.gov/webdocs/publications/100551/eib-222.pdf (accessed January 20, 2022).
Keywords: crop yield modeling, DSSAT, dryland cotton production, winter cover crop, soil water effects, conservation agriculture, semi-arid
Citation: Mauget SA, Himanshu SK, Goebel TS, Ale S, Payton P, Lewis K and Baumhardt RL (2022) Modeling management of continuous dryland cotton with an intervening winter wheat cover crop in a semiarid climate. Front. Sustain. Food Syst. 6:1043647. doi: 10.3389/fsufs.2022.1043647
Received: 13 September 2022; Accepted: 17 November 2022;
Published: 07 December 2022.
Edited by:
Matteo Balderacchi, Independent Researcher, Piacenza, ItalyReviewed by:
Gustavo Ovando, National University of Cordoba, ArgentinaCopyright © 2022 Mauget, Himanshu, Goebel, Ale, Payton, Lewis and Baumhardt. This is an open-access article distributed under the terms of the Creative Commons Attribution License (CC BY). The use, distribution or reproduction in other forums is permitted, provided the original author(s) and the copyright owner(s) are credited and that the original publication in this journal is cited, in accordance with accepted academic practice. No use, distribution or reproduction is permitted which does not comply with these terms.
*Correspondence: Steven A. Mauget, U3RldmVuLk1hdWdldEB1c2RhLmdvdg==
Disclaimer: All claims expressed in this article are solely those of the authors and do not necessarily represent those of their affiliated organizations, or those of the publisher, the editors and the reviewers. Any product that may be evaluated in this article or claim that may be made by its manufacturer is not guaranteed or endorsed by the publisher.
Research integrity at Frontiers
Learn more about the work of our research integrity team to safeguard the quality of each article we publish.