
94% of researchers rate our articles as excellent or good
Learn more about the work of our research integrity team to safeguard the quality of each article we publish.
Find out more
ORIGINAL RESEARCH article
Front. Sustain. Food Syst., 19 October 2022
Sec. Climate-Smart Food Systems
Volume 6 - 2022 | https://doi.org/10.3389/fsufs.2022.1030915
 Tewodros A. Zewdie1,2
 Mulugeta A. Delele2
 Solomon W. Fanta2Maarten Vanierschot3
 Melkamu Alemayehu4Getachew Alemayehu4
 Enyew Adgo5Hirut Assaye2
 Pieter Verboven1*
 Bart M. Nicolai1,6
In developing countries like Ethiopia, where the time of harvesting coincides with the dry season, farmers cure onion bulbs naturally on the field. Field curing generally takes longer than artificial curing and results in more losses and reduced quality of the bulbs due to increased risks for infestations and uncontrolled suboptimal drying conditions. Large-scale artificial curing systems are expensive and electrical energy supply is limited in rural areas. A CFD model was employed to design an alternative and sustainable onion curing system that can be deployed on the field in rural areas. The developed CFD model was validated by comparing the predicted air velocity, temperature, and mass loss to measured values on a prototype curing system operated on a field in Ethiopia. A good agreement between the model and experimental value was observed for the time profiles of temperature at different positions in the bulk of onions during curing, expressed by a root mean square error of 1.1°C in the temperature range from 28 to 47°C, 0.16 m s−1 in the velocity range from 0.1 to 2.5 m s−1, and 0.565% for the mass loss that ranged up to 6.35%. The developed model was used to assess the air velocity, temperature, and relative humidity distribution in order to get an insight into the uniformity of curing of onion bulbs using the develop alternative curing system. For all of the examined curing durations, the drying air temperature variation inside 80% of the porous medium was < 3°C. In the remaining 20% of the porous medium, a temperature variation of up to 6°C was observed. Thus, the newly designed and developed curing system was found to cure the onion bulbs uniformly. Moreover, its performance was evaluated experimentally and the onions were cured to a desirable level of curing for long-term storage within a total curing duration of 48 h. It is vital to consider bulb shrinkage, particularly in the neck, in order to further improve the model mass loss prediction.
In Ethiopia, onion is a high-value bulb crop produced by smallholder farmers and commercial growers since it is an indispensable part of the Ethiopian diet (Abdissa et al., 2011). During peak harvesting, high postharvest losses occur due to poor postharvest handling, mainly caused by a lack of processing and good storage facilities, and improper curing practices (Kasso and Bekele, 2018). Aslam et al. (2022), for example, developed an efficient ozonation treatment system for minimally processed onions, and this developed system was found to be effective in microbial log reductions. Curing is the most important postharvest operation for onion bulbs, which should be performed as soon as possible after harvesting to reduce the postharvest decay of onions during storage (Eshel et al., 2014). Curing improves the postharvest performance of the onion bulbs by sealing the cut neck of the bulb, which is an entry point for spoiling microorganisms, and by drying the outer scales, which then serve as a barrier to moisture loss during storage (Nabi et al., 2013).
Curing can be performed either in the field or artificially in a dryer unit. Field curing, also commonly known as “windrowing,” involves harvesting mature bulbs and laying them on their sides on the surface of the ground to be dried for 1 up to 2 weeks (Gubb and MacTavish, 2002). In wet weather, the bulbs can take longer than 3 weeks to achieve a desirable level of curing. Successful windrowing, hence, is weather dependent and cannot be used for large-scale commercial production. Onion bulbs cured naturally in the field may develop higher levels of rots during storage. The side of the bulb in contact with the wet ground develops brown strains, which reduce the appearance quality, and value of the bulb (Wright et al., 2001). Moreover, during field curing bulbs are vulnerable to damage caused by rodents and insects as well as an unexpected rain.
Onion is cured artificially by blowing heated dry air across the surface of the harvested bulb at night and day. In this method, the curing may take from 1 to 14 d depending on the temperature and relative humidity of the drying air. Increasing the curing temperature of drying air at a constant relative humidity resulted in reducing curing durations while increasing relative humidity at a constant temperature resulted in increased curing times. This is to be anticipated as the ability of the drying air to remove moisture increases with an increase in air temperature and decreased air relative humidity (Zewdie et al., 2019). Although artificial curing is more expensive, it minimizes skin staining and fungal attack, resulting in improved quality, commercial value, and skin appearance of the bulb (Wright et al., 2001; Gubb and MacTavish, 2002). The artificial curing technique is expensive, and not affordable for farmers and small-scale onion producers in developing countries like Ethiopia. Therefore, it is crucial to develop an alternative, sustainable and affordable curing system for farmers and small-scale producers. Various studies have shown that solar dryers are effective and can be used to dry agricultural products (Anyanwu et al., 2012; Hao et al., 2018).
In a previous study, a heat and mass transfer model for the curing process of a single onion bulb was developed to evaluate the effect of curing conditions on set curing criteria. The result revealed that achieving a desirable level of curing for long-term storage of onions depends on curing process conditions (curing relative humidity and duration) (Zewdie et al., 2022). To obtain homogeneous curing it is, thus, essential to design and construct a solar dryer with proper airflow, temperature, and relative humidity that are sufficiently homogeneous across the drying chamber. Computational fluid dynamics (CFD) has been successfully applied to design and develop solar dryers for drying agricultural products (Benhamza et al., 2021; Chavan et al., 2021). However, solar systems designed and developed for drying other agricultural products could not be directly used for curing onions since, unlike drying of other fruit and vegetables, curing aims to remove moisture from the outer few scales while maintaining the high moisture content of the inner scales. A CFD simulation has not been utilized to design and develop an onion curing system, to the best of our knowledge.
In the present study, transient CFD modeling was employed to model the heat and mass transfer in the bulk of onions with the aim of designing and developing an alternative and sustainable onion curing system. The model outcome was then validated using experimental data obtained in a prototype curing system that was built according to the CFD simulation results. The performance of the designed and constructed solar curing system was evaluated experimentally.
A preliminary CFD simulation was carried out to come up with the final design of the dryer (see section CFD simulation). In the preliminary CFD simulation the fan position, the plenum structure under the drying chamber, the height of the collector, the dimensions of the drying chamber, and the angle of the plenum structure were considered. The onion bulbs are modeled as a porous medium with a 0.3 m thickness. The dryer consisted of three main parts: (i) the solar collector with an area of 2 m2, (ii) the drying chamber (1 m × 1 m × 0.73 cm), and (iii) the fan. The drying chamber had a vent at the top, which acted as the chimney outlet and an inlet vent was provided at the opening of the collector part. The air used for drying was heated as it passed through a flat plate solar collector and then the hot drying air was introduced into the drying chamber at the bottom of the plenum channel. The drying air partially cooled as it removed moisture from the onion bulbs. Forced air circulation was achieved by using a fan located at the top of the drying chamber. The schematic 3D geometrical configuration of the final solar dryer design is displayed in Figure 1.
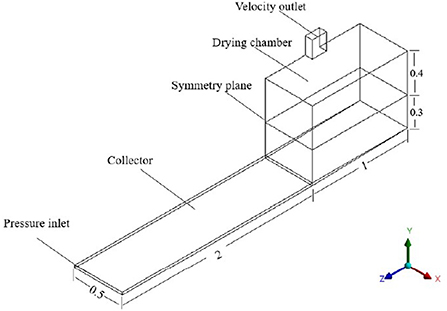
Figure 1. Computational domain (with symmetry plane) of the geometry of the solar dryer (dimensions in m) with a capacity to cure 150 kg of onions. A fan is positioned at the velocity outlet drafting heated air up through the drying chamber from an inclined plenum attached to the collector unit.
The turbulent airflow in the curing system was modeled by the standard Reynolds-averaged Navier-Stokes equations, complete with energy and moisture transport equations. Due to the relatively small temperature and air humidity ranges, constant air properties (density, viscosity, thermal conductivity, and specific heat) were assumed. The Boussinesq approximation for natural convection and the eddy viscosity approximation of Reynolds stresses and fluxes were used.
The following set of equations governs the flow and energy transfer in the bulk of onions stacked in the drying chamber, which is modeled as a porous medium (Verboven et al., 2006). In this approach, the conservation equations are volume integrated over the bulk geometry, which results in additional closure terms to describe the momentum, heat, and mass transfer between the bulbs and the air (Verboven et al., 2006). The simplified mass conservation equation reads:
The momentum equation is:
with v′ the fluctuating velocity component (m s−1) and the Reynold stress tensor. The Reynold stress tensor in Equation (2) is expressed as:
The porous medium momentum source term is added to the standard fluid flow equations to account for the airflow resistance of the bulk. The resistance term is composed of two parts: a viscous loss term and an inertial loss term:
with α the permeability (m2) and C the internal resistance factor (m−1). The first and the second term on the right side of Equation (4) are the viscous and inertial loss terms, respectively. The Ergun equations can be used to estimate permeability and internal resistance (Ergun, 1952). The permeability and the internal resistance were determined experimentally in the present work. The procedure for determining these coefficients is described in detail in Section Pressure drop of onion bulk.
The conservation equation for energy is solved separately for fluid (air) and solid (onions) zones. The conservation equation for the fluid zone is:
and the conservation energy equation for the solid zone is:
where is the specific Reynolds flux term and Se is the energy source term due to water evaporation during curing (W m−3). This source term was calculated according to the following equation:
The water vapor concentration Ca (kg m−3) was considered as a scalar property and modeled independently using the following transport equation:
where w is the moisture ratio (kg water vapor per kg dry air) and is the specific Reynolds flux term. Sw is the moisture source term (kg m−3 s−1), and was obtained from the following equation:
The equivalent water vapor concentration of the onion and water vapor concentration of the air is given by Equations (10) and (11), respectively:
The overall mass transfer coefficient in Equation (9) is composed of skin and external mass transfer coefficients and was obtained using the following equation (Zewdie et al., 2022):
with hs and hm,s are the skin mass transfer coefficient and surface mass transfer coefficient (m s−1), respectively. It is known that the skin mass transfer coefficient during bulb curing is affected by its moisture content. Hence, in the present study, a variable skin mass transfer coefficient was used. Equation (12) holds for a linear moisture gradient through the skin, from surface concentration Cs to inner bulb concentration Ce. An estimate for hs is developed as a function of the average moisture content of the skin:
Equalizing the convective flux to the skin flux renders a formula for the unknown surface water vapor concentration of the onion bulb Cs:
In our previous work, a moisture-dependent skin diffusivity was developed (Equation 16), from which hs can be simply calculated using the skin thickness (0.37 ± 0.03 mm).
The value of hm,s is calculated from a Nusselt correlation for stacked spheres and the Lewis analogy. The details about the calculation of hm, s can be found in Zewdie et al. (2022). Hence, the relative importance of the external and skin mass transfer coefficient could be evaluated using a mass transfer Biot number analysis from high to a low moisture content of the skin. hs is 10−6-10−4 and 10−13-10−19 times lower than hm, s, for high and low water content, respectively. Therefore, the rate of moisture transfer from the onion bulb to the drying air is mainly controlled by the skin mass transfer coefficient, which means that the surface water vapor concentration of the bulb can be assumed equal to the water vapor concentration of the air. Thus Equation (15) becomes:
Cs≃ Ca
Equations (9) and (14) were rewritten as follows:
The unknown function f , which relates skin mass transfer coefficient to water vapor concentration, was determined by calculating skin permeability from moisture-dependent effective moisture diffusivity at various water vapor concentrations from our previous work (Zewdie et al., 2022), and then by curve fitting the skin permeability vs water vapor concentration plot using the Matlab curve fitting toolbox (The MathWorks, Inc., Natick, MA, USA). The following exponential expression of skin permeability as a function of water vapor concentration provided a very good fit:
with parameters listed in Table 1. The discrepancy between the data and an estimation of the model was evaluated using the sum of squared estimate of errors (SSE) and root mean square error (RMSE). The SSE was calculated according to the following equation:
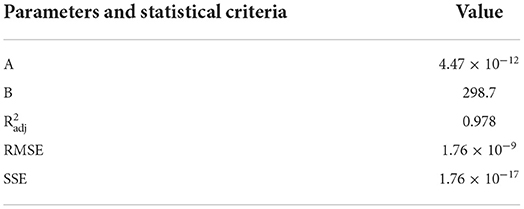
Table 1. Estimated parameter and statistical results for skin permeability of onion bulbs.
Where and Yi is the actual and predicted value of the variable, respectively.
Reynolds-averaged Navier-stokes equations (RANS) were used to model turbulent flow by time-averaging the Navier-Stokes equations. The turbulence model and the Reynolds-averaged Navier-Stokes equations are coupled by turbulent viscosity, conductivity, and diffusivity. For closure, several turbulence models such as the k–ε model are available. Despite the k–ε turbulence model being a widely used model, it has certain shortcomings, particularly when applied to complex flows. As a result, several alternative turbulence models have been developed and implemented in several CFD codes. The SST model (Shear Stress Transport) is the most promising of these models (Menter, 1994). The SST model is preferred and widely used over other RANS models in handling most large turbulence modeling for its accurate blending of the flows both near and away from the boundary or wall regions (Defraeye et al., 2013; Ajani et al., 2021). The advantages of both k-ϵ and k-ω models are combined in this model (Wilkening et al., 2008). The SST model can reliably estimate flow near the walls and in free-flowing streams. It employs functions that gradually blend two models. Hence, the SST turbulence model was used in the current study.
The flow near solid walls gives rise to a complex turbulent boundary layer. The present model used an enhanced wall function in order to accurately predict the studied parameters in the boundary layers. The wall function is well-refined close to the wall in order for the first node to lie within the viscous sublayer. The y+ value is defined as the dimensionless distance from the wall to judge if the viscous sublayer is resolved. Since the SST turbulence model is used in the present study, a y+ value lower than 1 is required to properly refine the mesh in the boundary layer.
For solving the governing equations, relevant initial and boundary conditions were used. For the inlet of the solar dryer, a pressure inlet with zero-gauge pressure condition was set and the drying air leaves the solar dryer at a velocity of 3.5 m s−1. This velocity was used based on the measurement using a hot wire anemometer (Testo 405i, range 0–30, accuracy ± 0.05 m s−1, Testo, Ternat, Belgium) and it was considered to remain constant throughout the drying time since the fan was powered by a solar battery. The inlet temperature and the RH of the air were obtained by measuring every hour for 3 days using a temperature-relative humidity data logger (HOBO UX100-011 temp/RH logger, range −20–70°C and 10–90% RH, accuracy ± 0.21°C and ± 2.5% RH, Onset, Bourne, USA). The solar radiation intensity was also measured every hour over a day using a lux meter (LX1330B Digital Illuminance Light Meter, accuracy ± 4%, range 0–200,000, Dr. Meter, USA). The inlet temperature, RH profile of the air, and solar radiation intensity are presented in Supplementary material B.
The solar collector was modeled as a wall with a variable heat flux based on the hourly measurement of incoming solar radiation from 7 a.m. to 6 p.m. for a total drying time of 3 days. The inlet temperature, relative humidity (water vapor concentration) of air, and solar radiation intensity varied every hour throughout the drying time. A no-slip condition was considered over the solid walls that surround the fluid. The detailed initial and boundary conditions, as well as additional model parameters, are listed in Table 2.
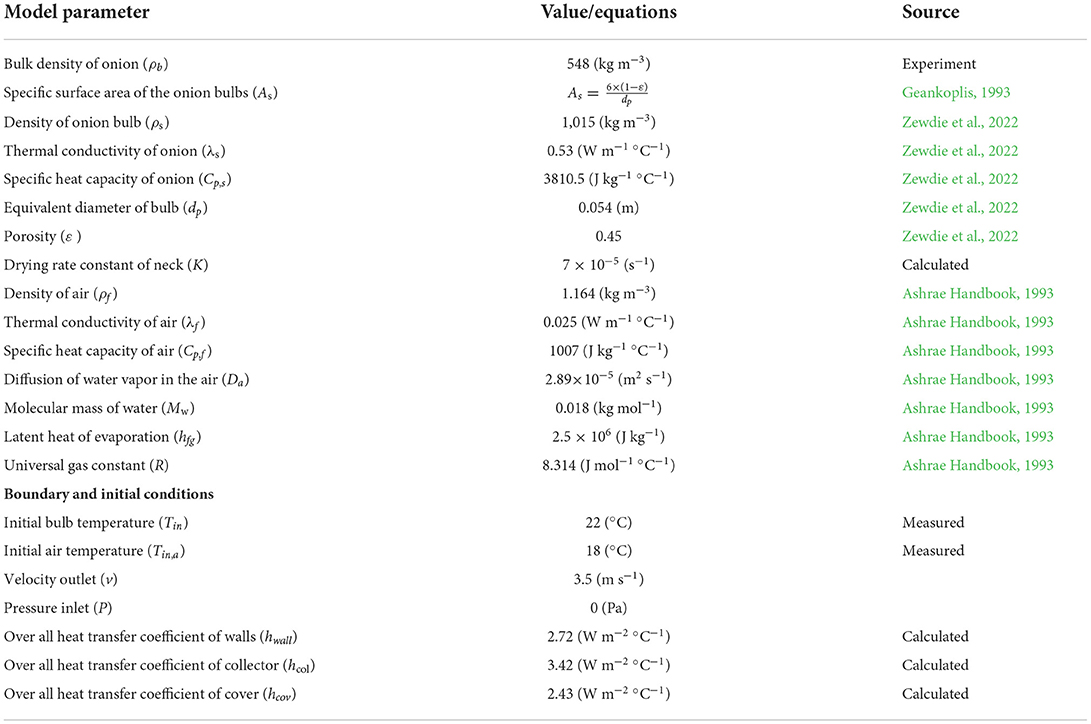
Table 2. Model parameters; boundary and initial conditions.
To determine the airflow resistance of an onion bulk, a wind tunnel was used as shown in Figure 2. The wind tunnel has a turbulence intensity of < 0.1% as measured by Vanierschot et al. (2013). Pressure drop measurements were carried out for an air velocity ranging from 0.5 to 2.5 m s−1 since this range ensures coverage of air velocities used in most convective food drying (Velić et al., 2004). Moreover, this range fits with the working conditions in the dryer. The equipment for the pressure drop experiment consisted of the test chamber that was 1.5 m long with a rectangular internal cross-section dimension of 0.4 m by 0.26 m. The test section was designed to allow measurement of the pressure drop over a layer of onions of varying sizes by creating slits every 0.1 m over a length of 0.9 m. Since airflow resistance through the onion bed depends on the depth of fill and airflow rate, the pressure drop experiment was conducted for different thicknesses of the onion layers (Gomathy et al., 2019). The onions were placed in the middle of the test chamber with different layer thicknesses. A thin metal plate with a large opening area, to minimize its impact on the measured pressure drop characteristics, was used to keep the onions in place. The air velocity at the inlet of the test chamber was measured by an air velocity meter (Testo 480, range 0–30 ± 0.1 m s−1, Testo, Ternat, Belgium). The superficial velocity was used in all calculations of the model. For pressure drop measurement over the layers of the onion, the Testo climate measuring instrument (Testo 480, Testo, Ternat, Belgium) with a range from −100 to 100 hPa differential pressure and accuracy of ±0.2 hPa was used. The pressure drop measurement was obtained via recording the pressure at the inlet and outlet of the onion stacks as can be seen in Figure 2A. The onions were stacked with care taken to avoid creating a wide-open space near the test chamber walls (Figure 2B). For each batch, three replications were made to minimize the influence of filling.

Figure 2. (A) Schematic representation of the experimental setup for pressure drop measurements: (1) centrifugal fan, (2) wind tunnel conditioning unit, (3) airflow speed measurement, (4) measurement section, and (5) data logger. A and B are pressure taps (dimensions in m). (B) The testing chamber of 0.3 m in length and is filled with a bulk of onion bulbs.
The computational domain covered half of the dryer for computational efficiency, using symmetry planes, as shown in Figure 1. This domain was discretized using an unstructured three-dimensional mesh by tetrahedral cells, except for the solid-air interface region. In this region, an inflation layer was added. The solution domain was discretized with different element sizes. The mesh sensitivity test is carried out for six different mesh sizes. The pressure drop and average temperature at the symmetry plane of the porous domain were monitored for all mesh sizes. According to the mesh sensitivity study, pressure drop and average temperature for meshes with more than three million elements are essentially similar (see Supplementary material E). The present model used an enhanced wall function in order to accurately predict the studied parameters in viscous sublayers. As per the requirement of enhanced wall function for the SST turbulence model, the calculated y+ values were < 1. The calculated y+ values lower than one were obtained when the mesh element is higher than seven million elements. Therefore, the mesh with 7,0131,276 elements was selected for the simulation analysis.
The numerical simulation was performed using the CFD software ANSYS CFX 2020R2 (Fluent Inc., Lebanon, USA). The momentum, energy, and moisture transport governing equations were discretized using the second-order backward Euler method and numerically solved using the finite volume method. A double-precision solver was chosen. The calculation was performed using a Pentium IV, 3.21 GHz Windows 10 workstation with 128 GB Ram. The following approach was employed to perform the simulations: first, a steady-state simulation of drying air velocity was performed. Second, using the result from the steady-state simulation as an initial condition, a transient simulation of the drying air temperature distribution for 3 days was performed. The time independency study was carried out by choosing three different time steps (120, 240, and 480 s). There was no significant difference between time steps of 120 and 240 s (see Supplementary material F). Hence, the time step of 240 s was used for the transient simulation to minimize the computational cost. Convergence criteria of 10−6 for continuity, momentum, turbulence, energy, and moisture transport equations were used.
The developed model was validated by comparing the predicted temperature, velocity, and mass loss against measured values in a prototype dryer developed based on CFD design. The solar dryer with a loading capacity of 150 kg of onion was fabricated in the mechanical workshop of Bahir Dar Institute of Technology, Ethiopia (11.5983°N, 37.3977°W, 1,800 m) based on the output of CFD design simulations as shown in Figure 3. The air velocity of the loaded solar dryer was measured at six different positions at the center of the drying chamber. The measurements were taken using a hot wire anemometer (Testo 405i, range 0–30, accuracy ± 0.05 m s−1, Testo, Ternat, Belgium) starting from 0.05 m above the bottom of the dryer at 0.15 m intervals along the height of the drying chamber.
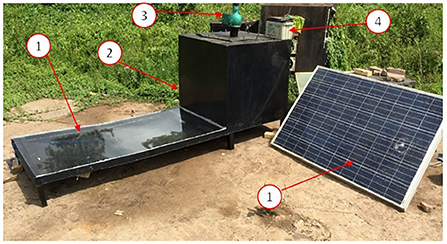
Figure 3. CFD-based designed and constructed solar dryer for curing of onion bulbs: (1) collector, (2) drying chamber; (3) fan; (4) solar battery, and (5) solar panel.
The air temperature of the load dryer was measured every 1-h interval at the center of the drying chamber using the temperature/relative humidity data logger (HOBO UX100-011 temp/RH logger, range −20–70°C and 10% to 90% RH, accuracy ± 0.21°C and ±2.5% RH, Onset, Bourne, USA). The measurements were obtained at 0.15 m intervals along the length of the drying chamber, starting at 0.05 m above the bottom of the dryer. Along the height of the drying chamber, the measurements were recorded at three different positions starting at 0.1 m from the wall of the drying chamber at 0.4 m intervals.
Mass loss was determined by weighing five bulbs before curing and then weighing them after curing at every 2-h interval for the entire 72 h curing period (only during the day), and the results were reported as percent mass loss. It was carried out with the use of a PA-Series Analytical Balance (Cole-Parmer, Vernon Hills, USA). Moreover, the mass loss of the whole bulb was measured before curing and after 72 h at the end of curing.
The accuracy of predictions of the model was evaluated quantitatively using root mean square error (RMSE). The RMSE between the experimental data and numerical results was evaluated using Equation (22):
where is the model predicted value of the ith observation, is the corresponding experimentally observed value and n is the total number of observations.
The performance of the indirect solar dryer depends on its collector overall efficiency and useful power. The collector efficiency ηu is defined as the ratio of heat gain by the drying air to the incidence of solar energy upon the absorber surface and is calculated from the following equation:
with Ac the area of the collector (m2), Qu the useful energy gain of the drying air (W), and I the incidence of solar energy (W m−2). Qu can be determined from:
Drying efficiency refers to the amount of heat required to evaporate the moisture within a product. It was expressed as the ratio of the energy necessary to remove moisture from onion bulbs to the total energy supplied to the dryer and written as the following equation:
with Mw is moisture removed from the sample in kg.
The onion cultivar “Bombay Red” grown in the 2021 dry season with irrigation in North-Western Ethiopia was used as the test crop. The growing site is specifically located at 11°53′ N latitude and 37°31′E longitude with an elevation of 1,830 m above sea level. Bulbs were harvested manually at the maturity stage of stage 2 when 60–80% of leaves collapsed. The shoot of each bulb was topped at a length of 25 mm from the neck before curing. Finally, the onion bulbs were cured for 3 and 7 days using a solar dryer and field curing method, respectively. The onion bulbs were cured by pilling them on the ground at a height of 35 cm in the case of field curing. The mass loss and neck moisture content were measured every 2 h for both curing methods. The neck moisture content was determined experimentally by weighing on an analytical balance (PA-107 Series, Cole-Parmer, repeatability ≤ 0.1 mg, Vernon Hills, USA) after curing and drying in the oven at a temperature of 105°C until a constant mass was achieved (AOAC, 2005).
A steady-state preliminary CFD simulation was employed to determine the final design and dimensions of the solar dryer. For that purpose, a stepwise approach was followed. First, the plenum shape under the drying chamber was optimized via CFD modeling to assure a uniform supply of airflow and heat transfer rates to onions along the length of the plenum. Adding a plenum structure with a narrowing channel below the onion bulk resulted in more uniform air velocity distribution and heat transfer rates of the drying air across the onion bulbs. Then, CFD simulations were performed in order to determine the most suitable fan position and the height of the collector. A suction fan configuration and 3 cm height of the collector section resulted in a homogenous velocity and temperature distribution in the collector as well as inside the drying chamber. This final design of the solar dryer obtained (Figure 1) based on preliminary CFD simulation is used for transient CFD simulation (see the sections below) and eventual prototype construction and evaluation. The results of the preliminary CFD simulation to determine the final design and dimensions of the solar dryer are discussed in detail in Supplementary material A.
Once a final design of the onion curing system was obtained upon using steady state CFD simulation, a transient CFD simulation was employed to evaluate the velocity, temperature, and RH distribution, and to predict the mass loss of onion during curing. In the following subsections, therefore, the results obtained from the CFD simulation of the final design are presented to evaluate the velocity, temperature, and RH distribution in detail inside the solar dryer and then to get insight into the uniformity of curing of the onion bulbs. Moreover, the measured velocity, temperature, and relative humidity profile were compared with the corresponding calculated values.
The airflow velocity contours are depicted in Figure 4A on the collector. It is evident that the air travels smoothly and uniformly through the collector before passing through the narrowing channel underneath the layers of the onion. Figure 4B shows the velocity contour of the loaded dryer on the symmetry plane in the middle section of the dryer. As can be seen from the contour plot of the velocity distribution, the highest velocities are observed in the collector, the plenum, and around the outlet of the dryer (chimney unit).
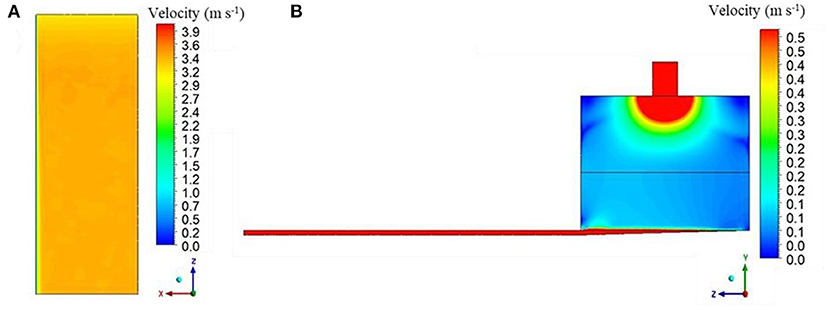
Figure 4. Contours of the predicted velocity distribution in the optimized design of the loaded solar dryer: (A) a horizontal profile through the middle of the collector from inlet to plenum, (B) a vertical profile on the symmetry plane of the dryer.
To further evaluate the velocity distribution of the drying air inside the drying chamber quantitatively, the predicted and experimentally measured velocity profile along the height of the loaded drying chamber on the symmetry plane is plotted in Figure 5. The velocity of the drying air under the onion bulbs was high and equal to 2.25 m s−1. The velocity magnitude of the air was drastically decreased from 2.25 to 0.18 m s−1 when it enters the onion domain from the plenum. This is due to a change in the flow direction of the drying air from the horizontal to the vertical axis, and the corresponding change in cross-sectional flow area from small in the plenum to large in the bulk. The airflow leaves the bulk at a uniform low speed and then speeds up again toward the fan chimney around the outlet of the dryer due to a change in cross-section. Generally, the drying air velocity inside the drying chamber varied between 0.11 and 3.5 m s−1. The velocity of the drying air inside the porous medium was very low in the range of 0.10–0.15 m s−1. The high velocity at the bottom of the porous medium cannot be avoided because it is close to the narrowing channel with the highest velocity of 2.2 m s−1. The highest velocity of the drying air which is 3.4 m s−1 was obtained at the outlet of the dryer, where the fan is positioned. In general, a uniform velocity distribution of drying air in the region of interest, which is the porous medium and collector, was achieved in the present design of the solar dryer as shown in both Figures 4, 5.
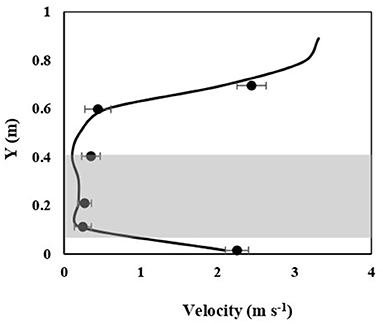
Figure 5. Air velocity profile in the drying chamber along the height of the loaded solar dryer at a distance of 0.5 m from the front side. The solid line and the symbols represent predicted and measured velocity profiles (error bars are standard error, n = 3), respectively. The shaded region indicates the area of the onion bulk layer.
For experimental validation, the calculated velocity profile was plotted together with the measured values. Figure 5 shows that the simulated velocity profile along the height of the drying chamber follows the same trend as the measured velocity profile. Experimental observations and the predicted velocity profile are in good agreement. Furthermore, the result of the statistical analysis shows that the predicted CFD and experimentally obtained airflow velocity have good correlations. This is demonstrated by the fact that drying air velocity had low RMSE values (Table 3).
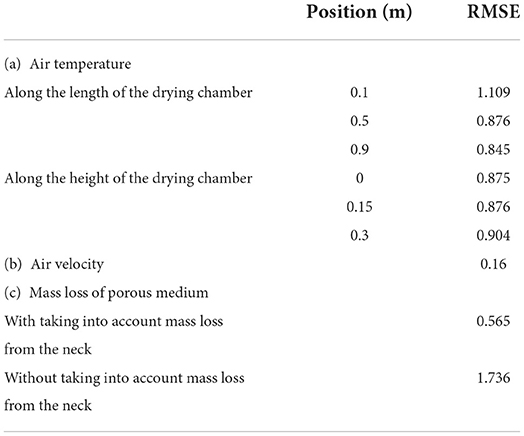
Table 3. Percentage of root mean square error for mass loss, velocity, and temperature profile.
The drying air temperature distribution for the whole dryer is presented at the symmetry plane and for the collector on a horizontal plane (X-Z plane) in Figure 6. Since the heat absorbed by the collector was transferred to the air, the temperature of the air was raised as it passed from the inlet to the end of the collector as shown on the temperature contour plot of the collector (see Figure 6A). For uniform temperature distribution of the air inside the drying chamber, the temperature of the air along the width and the height of the collector at the inlet of the drying chamber (end of the collector) should be uniform. However, there was a slight variation in air temperature along the height of the collector in comparison to the temperature profile along the width of the collector. In the collector unit, the temperature of the air at the bottom of the collector was higher compared to the temperature near the transparent cover.
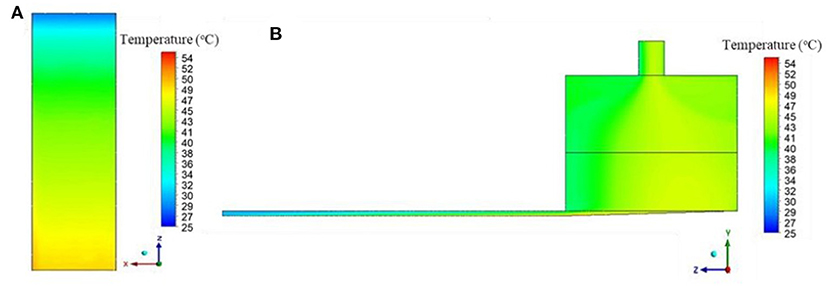
Figure 6. Contours of the predicted temperature profile of the air in the solar dryer at 1:00 p.m. through, (A) a horizontal profile through the middle of the collector from inlet to plenum, (B) vertical profile on the symmetry plane of the dryer.
In comparison to the velocity distribution of the air inside the drying chamber, the temperature distribution was slightly more variable along the length of the drying chamber (Figure 6B). The temperature of the air at the center and on the back side of the drying chamber was slightly higher than the temperature at the front side of the drying chamber. To further evaluate the uniformity of drying temperature distribution at the drying chamber throughout the day quantitatively, the air temperature in the morning, midday, and afternoon were plotted along the length and height of the drying chamber (Figure 7). In all investigated curing times, the predicted drying air temperature profile along the length of the drying chamber at a distance of 0.15 m from the bottom of the porous medium followed the same trend as can be seen in Figure 7B. The drying air temperature increased along the length of the drying chamber up to 0.5 m or center, and then the temperature remained almost constant in the rest part of the drying chamber, before undergoing a small drop near the back side wall of the drying chamber due to heat loss through the walls. The highest and the lowest air temperature were observed at the center and near the front side of the drying chamber at 1:00 p.m., respectively. The maximum air temperature variation along the length of the drying chamber was 6°C. This variation in the predicted temperature profile was mainly due to the temperature variation along the height of the collector. As can be seen in the temperature contour plot, the air is relatively higher in temperature, which is near the bottom of the collector at the entrance of the drying chamber, directed by the plenum chamber to move to the center and back side of the drying chamber. And, the air near the top of the collector, relatively lower in temperature, moves to the front side of the drying chamber (Figure 6B).
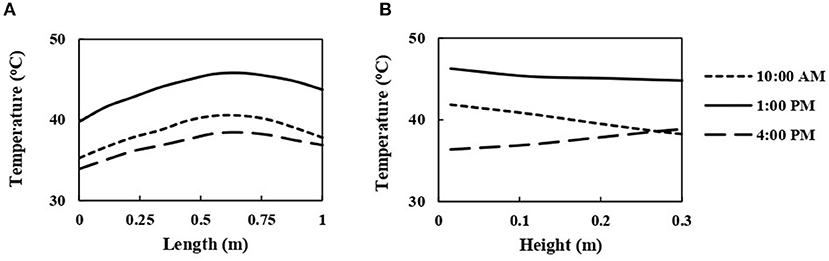
Figure 7. Predicted air temperature inside the onion bulk layer of the solar dryer as a function of time of day, (A) along the length at mid-height of the bulk layer, (B) along the height in the center of the bulk layer.
Unlike the predicted air temperature distribution along the length of the drying chamber, the temperature distribution along the height of the dryer follows a different trend for different curing times (Figure 7B). In the morning, the air temperature first decreased linearly from the bottom up to 0.35 m height of the drying chamber and then remained constant throughout the rest of the drying chamber. Thus, a variation in air temperature was observed in the porous domain. This is because the drying air is cooled by the onions as it moves from the bottom to the top of the dryer. Since onion bulb temperature variations become smaller and smaller as the curing process proceeds, the air temperature distribution along the height of the drying chamber was uniform or very small (lower than 1°C) at 1:00 p.m. In contrast to the air temperature profile in the morning, the temperature of the drying air in the afternoon (at 4:00 p.m.) increased linearly from the bottom up to 0.3 m height of the drying chamber. The reason is that the air got heated as it moved from the bottom to the top of the drying chamber through the onion bulbs since the air temperature was lower than the onion bulbs in the later stage of curing (in the afternoon). The temperature distribution above the porous domain was uniform regardless of the curing time. The maximum temperature variation along the height of the drying chamber was 4.5°C.
Figures 8A,B compare the experimental values for air temperature collected from three points along the length and three points along the height of the porous medium on the symmetry plane for a curing period of 8 h with the corresponding results extracted from CFD analysis, respectively. The temperature of the drying air along the length and height of the drying chamber increased until the mid of the day and then dropped for all positions where temperature data were collected. In the case of the temperature profile along the height of the dryer, the air temperature at top of the porous medium was highest during the early stage of curing. However, due to the release of heat absorbed by the onion bulbs to the air in the later stages of curing, the air temperature at the bottom of the porous medium was the highest and the air temperature at the top was the lowest. This air temperature trend along the length and height of the porous medium was very well-captured for a total curing duration of 8 h in simulation results as illustrated in Figure 8. The CFD model slightly underestimated the air temperature in most curing periods particularly from 11:00 to 2:00 p.m. This might be due to additional heat absorption by the wall of the drying chamber since the dryer walls were painted black. Overall, the experimentally measured air temperature at 5 different points over an 8-h curing period has shown a good resemblance with the corresponding simulated results (Figures 8A,B). The good agreement between the experimental and predicted value was further confirmed by using statistical analysis. The RMSE for temperature varied from 1.1 to 0.85 (Table 3). Thus, a good correlation between the simulated and experimental values was observed.
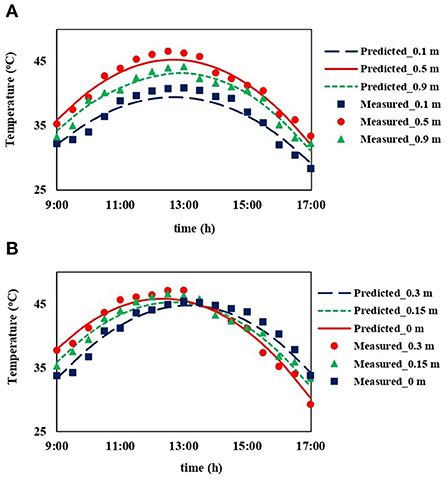
Figure 8. Validation of the predicted temperature profiles at different positions inside the onion bulk of the solar dryer during an 8-h day of curing: (A) at 3 positions along the length in the symmetry plane at mid-height of bulk, (B) at 3 positions along the height in the center of the bulk layer.
Overall, the drying air temperature variation for 80% of the porous medium (onion bulb) was lower than 3 and 2°C for all investigated curing times along the length and the height of the drying chamber, respectively. However, a temperature difference of up to 6°C was detected in the remaining 20% of the porous domain, particularly near the front side of the drying chamber. As a result, it is essential to ensure that the onion bulbs located near the front side of the drying chamber have been cured uniformly. In our previous study, the effect of curing temperature and relative humidity on different quality attributes was evaluated (Zewdie et al., 2019). The result revealed that a drying temperature difference of up to 10°C did not have a significant effect on all investigated quality attributes. Moreover, a coupled heat and mass transfer model was developed for optimizing the curing process as well as to assess the influence of curing parameters on the desirable level of curing (Zewdie et al., 2022). From the result of this study, it was observed that relative humidity had a more pronounced effect than temperature. Therefore, relative humidity distribution along the length and height of the drying chamber was plotted as indicated in Figure 9. The highest variation in drying air relative humidity up to 7% was obtained at 4:00 p.m. along the length of the drying chamber. According to Zewdie et al. (2019), the air relative humidity difference lower than 10% had no significant influence on all of the set targeted curing criteria, which assess whether onion bulbs were sufficiently cured enough for long-term storage with minimal mass loss or not. Since the current design of the solar dryer attained a maximum relative humidity variation of lower than 10% in all investigated curing time, the temperature and relative humidity distribution of the drying air was uniform enough for curing onion bulbs for long-term storage utilizing this design of dryer. The temperature and relative humidity distribution at three different positions for the whole curing duration (3 d) including the profile at the night are presented in Supplementary material C. Moreover, the temperature of the drying air and the onion bulk at mid of the bulk positions during a 72 h curing day and night was shown in Supplementary material D.
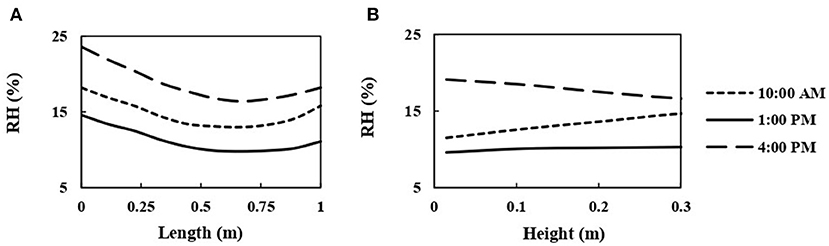
Figure 9. Predicted relative humidity of the air in the onion bulk layer of the solar dryer as a function of time of day (A) along the length at mid-height of the bulk layer, (B) along the height in the center of the bulk layer.
Since onion is sold on a mass basis, mass loss was set as one of the curing criteria in our previous study of heat and mass transfer modeling of a single onion bulb (Zewdie et al., 2022). The result of mass loss of the CFD model was, therefore, compared with the corresponding experimental result. Figure 10 shows the comparison of the simulated and experimentally measured mass loss of the whole bulk for a total curing duration of 3 days. There was a significant discrepancy between predicted and experimental mass loss values. However, the mass-loss trend was well-captured by the CFD model, particularly after the first 10 h of curing. Over the curing period of 3 days, the measured and simulated average mass loss were 4.82 and 3.04%, respectively. This might be mainly due to the mass loss from the neck of the bulbs not being taken into account since the mass loss model only considered water loss from the bulbs through the outer scales. The large mass loss contribution from the neck of the bulb was confirmed using the model developed for heat and mass transfer of a single onion bulb from the previous study (Zewdie et al., 2022). A substantial amount of moisture removal from the neck of the bulb was observed. The reason is that the neck has high initial moisture content and lower resistance against moisture loss during curing in contrast to the remaining part of the bulb (Zewdie et al., 2022).
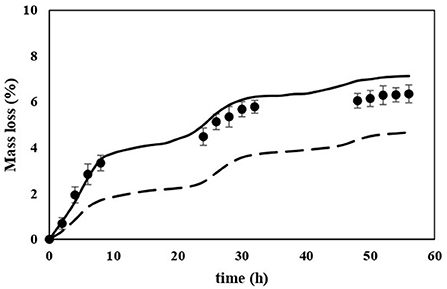
Figure 10. Predicted mass loss of the whole onion bulbs cured for a total duration of 3 days in comparison with experimental data. Solid and broken lines represent predicted mass loss with and without taking into account mass loss from the neck, respectively. Symbols represent measured mass loss (error bars are standard errors, n = 5).
To improve the mass loss prediction by the CFD model an additional term was incorporated into the moisture source equation (Equation 9). This additional source term was the moisture transfer from the neck of the bulb, and it was stated as the equation below:
where K (s−1) is a drying rate constant and was determined from our previous results on the neck moisture ratio as a function of curing time. Ce, n is the equilibrium water vapor concentration of the neck (kg m−3) as determined from the moisture sorption isotherm (Zewdie et al., 2022). Finally, the total mass loss from the porous medium using the CFD model was estimated by adding the mass loss from the bulb and neck. The volume of the neck and the bulb is taken into account independently in the mass loss estimate, as shown in the equation follows:
where Mt, Mb, and Mn are the total mass loss, mass loss from the bulb, and mass loss from the neck in %, respectively. Vb and Vn are the volume ratio of the bulb and neck, respectively.
The mass loss prediction using the CFD model improved significantly by taking into account the mass loss from the neck separately, as shown in Figure 10. Hence, a good agreement between the experimental and simulated mass loss was obtained in comparison with the prediction by the model without taking into consideration mass loss from the neck. This was further proved by the result of the statistical analysis as shown in Table 3. When the neck mass loss was taken into account independently, the RMSE was 0.565, whereas when the neck mass loss was not taken into account, the RMSE was 1.736. Although mass loss prediction was improved, the model still slightly overpredicts the mass loss in the latter stage of curing mainly due to shrinkage of the neck that was not considered in the current model in which the volume of the neck was assumed constant throughout the curing process. However, during our previous experimental investigation of the curing process, a substantial reduction in the volume of the neck was observed (Zewdie et al., 2019).
Finally, the performance of the constructed solar dryer for curing onions was evaluated by calculating useful thermal power, collector, and dryer efficiency. Furthermore, its performance was evaluated by experimentally determining the neck moisture content and mass loss of the bulb cured using a solar dryer for 3 days, and then it was also compared with bulbs cured naturally in the field for 7 days.
The thermal performance of the solar dryer depends on the collector efficiency in addition to the evaporating power of air in the drying unit. Figure 11A shows the evaluation of the collector thermal efficiency and useful thermal power. The performance of the solar collector reached its maximal value at solar midday. The maximum collector efficiency was 37%, which was comparable to those of Mehdipour and Ghaffari (2021). However, the efficiency was higher than those obtained by Dissa et al. (2011).
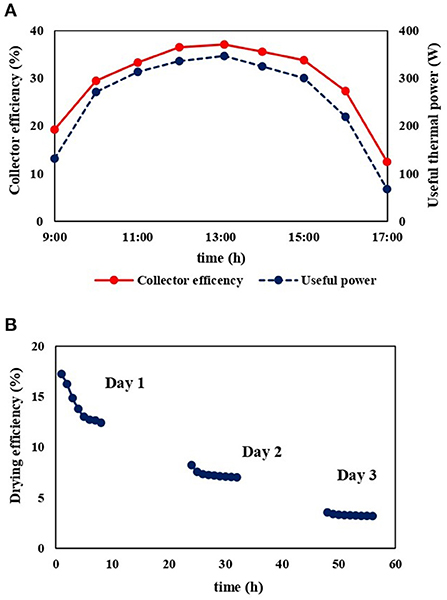
Figure 11. (A) Daily variation of the instantaneous collector efficiency and useful thermal power for the solar drying unit and (B) variation of the drying efficiency of the solar dryer as a function of time for a total curing duration of 3 days.
The drying efficiency of the constructed dryer varied from 17.2 to 3.2% as indicated in Figure 11B. The lowest drying efficiency was observed on day 3 due to onion bulbs creating a better barrier against moisture loss during the later stage of curing. Since research regarding curing onion using a solar dryer has not been done to the best of the author's knowledge, the efficiency of the developed solar dryer was compared with solar dryers designed for drying other fruit and vegetables. The dryer efficiency in the present work was low when compared to solar dyers developed for drying other fruit and vegetables (Mintsa Do Ango et al., 2013; Tan et al., 2022). This is because, in comparison with other fruit and vegetables, the rate of moisture removal from the onion bulb was quite low since excess moisture is removed only from the neck, outer few scales, and root of the bulb during curing (Maw and Mullinix, 2005). In other words, there is no moisture removal from the inner scales of the bulb during curing due to the absence of connection between the different layers in contrast to other fruit and vegetables.
In our previous work, we optimized the curing process to determine when to stop curing in order to limit mass loss while retaining good postharvest performance by sealing the bulb's neck and establishing a good moisture barrier (Zewdie et al., 2022). Three curing criteria with targeted values were set: a mass loss lower than 7%, neck moisture content lower than 0.15 (decimal, w.b.), and effective moisture diffusivity of the outer scale lower than 3 × 10⁻¹³ m2 s−1 for optimization (Zewdie et al., 2022). From the result of the optimization of the curing process, when the targeted value set for mass loss and neck moisture content were met, the targeted set for effective moisture diffusivity was achieved simultaneously regardless of harvesting stages and bulb sizes (Zewdie et al., 2022). In the present work, therefore, only mass loss and neck moisture content were used to decide how long it takes to adequately cure onion bulbs using a developed solar dryer. The neck moisture content was proposed as a second curing criterion since the neck moisture content should be minimized to a lower level until the neck of the bulb, which is used as an entering point for spoilage microorganisms, is sealed. A total curing duration of 48 h was sufficient to attain a set targeted values of mass loss and neck moisture content or to properly cure the onion bulbs for longer-term storage using the developed solar dryer (Figure 12A). Similar to onions cured using a solar dryer, mass loss and neck moisture content of onions cured for a total duration of 7 d by field curing technique were plotted on the same graph as can be seen in Figure 12B. It takes more than 7 d to properly cure onion bulbs using field curing methods. Consequently, the developed solar dryer cut the drying period by more than 5 days when compared to field curing. Moreover, curing using a solar dryer in comparison with field curing: (i) results in a better uniformity in curing, (ii) avoids sun scalded produce by direct exposure of the bulb to hot sun, (iii) prevents the risk of damage by insects and rodents, and (iv) eliminates damage of bulbs caused by unexpected rain (Gubb and MacTavish, 2002; Maw and Mullinix, 2005).
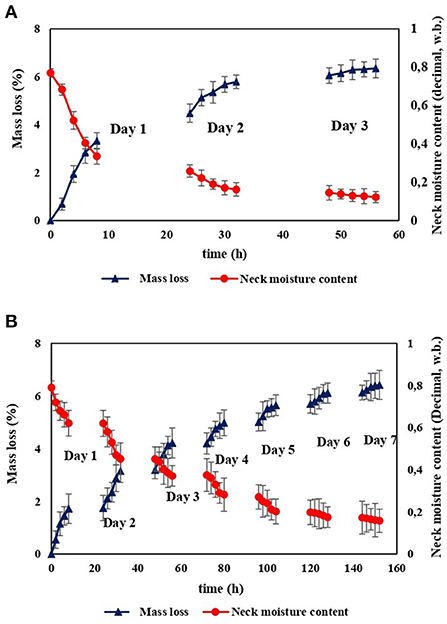
Figure 12. Measured mass loss and neck moisture content of onion bulb as a function of curing time cured: (A) using a solar dryer for a total duration of 3 days, (B) using field curing method for a total duration of 7 days (error bars are standard error, n = 5).
In the present study, a prototype solar energy-driven onion curing system with a loading capacity of 150 kg of onions was designed and developed. In future work, this prototype onion curing system needs to be scaled up in order for a farmer or small-scale onion producers to be able to cure a huge amount of onions at a time. The most important design features that should be taken into consideration to scale up the current prototype onion curing system are the sizing of the solar collector and drying chamber, fan configuration and power, plenum structure, and the size of the chimney. The same fan configuration and design of plenum structure can be used in upscaling of the onion curing system since the suction fan configuration and angled plenum structure results in uniform curing (see Supplementary material A). However, the collector and drying chamber should be resized in order to increase the capacity (scale up) of the onion curing system. CFD model helps in the sizing and scaling of dryers to achieve a similar system behavior and performance as the prototype dryer (Onwude et al., 2021). Experimental validation of the CFD model is required before the model is used for scaling up the dryer (Mondal et al., 2022). Given the impracticality of taking measurements on large dryers, they concluded that validation work on small-scale equipment was likely sufficient. The proposed CFD model was here validated experimentally as explained in section Model validation. Consequently, as the flow regimes are not likely to change with scale up, the current CFD model can be further used to study designs for scale up of the onion curing system.
The present developed onion curing system is effective only during the day and also the efficiency of the dryer varies with time depending on the intensity of the coming solar radiation. At night the drying air temperature decreases and the air RH increases which leads to a reduction of the rate of moisture removal from the neck and the outer scales, thereby extending the total curing time. The low efficiency of solar-powered curing systems can be enhanced by integrating a thermal storage component such as using phase change materials (PCM) inside fluid storage tanks. This enables greatly prolonging the drying process time at a higher and more uniform temperature which means it reduces the total drying time. For example, when compared to a solar dryer without PCM, utilizing PCM inside the storage tank shortens the drying time by 9.37–10.02% depending on air flow rates (Iranmanesh et al., 2020). In future work, therefore, a solar curing system integrated with thermal storage needs to be designed and developed to further increase efficiency and reduce the curing time.
A solar curing system was designed and developed in Bahir Dar, Ethiopia with the help of transient 3D CFD modeling. The velocity, temperature, and relative humidity distribution of the drying air in the drying chamber of the present design were uniform enough for curing onion bulbs for long-term storage. The accuracy of the model prediction was validated against experimental values and good agreement was observed for airflow velocity and temperature within the drying chamber. The maximum temperature, velocity, and relative humidity discrepancy between the measured and predicted results were found to be 1.7°C, 0.17 m s−1, and 0.84%, respectively. Moreover, the model was used to predict the mass loss from the bulbs, and the mass loss prediction was significantly improved by incorporating addition terms into the model equation that takes into account mass loss from the neck of the bulbs. The CFD model slightly over-predicted the mass loss at the later stage of curing, and this mass loss prediction of the bulb can be further improved by taking the shrinkage of the neck of the bulb into consideration. In general, based on the CFD model and the experimental evaluation, the designed and developed solar dryer can be used as an alternative and sustainable system for curing onions and attain an adequate level of curing within a total duration of 2 days.
The original contributions presented in the study are included in the article/Supplementary material, further inquiries can be directed to the corresponding author/s.
TZ performed the experiment, carried out modeling, conceptualization, and wrote the manuscript. PV and BN contributed to modeling, development of the manuscript and revising it critically, supervision of the work, conceptualization, and funding application. MD and SF participated in modeling, funding application, review, and editing of the manuscript. MV participated in the supervision of the experimental work, reviewing, and editing the manuscript. MA, GA, EA, and HA contributed funding application, review, and editing of the manuscript. All authors contributed to the manuscript revision and approved the final version as submitted.
The authors would like to gratefully acknowledge the Postharvest and Food Processing project (P4) of the VLIRUOS IUC—BDU program for its financial support of this research.
The authors declare that the research was conducted in the absence of any commercial or financial relationships that could be construed as a potential conflict of interest.
All claims expressed in this article are solely those of the authors and do not necessarily represent those of their affiliated organizations, or those of the publisher, the editors and the reviewers. Any product that may be evaluated in this article, or claim that may be made by its manufacturer, is not guaranteed or endorsed by the publisher.
The Supplementary Material for this article can be found online at: https://www.frontiersin.org/articles/10.3389/fsufs.2022.1030915/full#supplementary-material
Abdissa, Y., Tekalign, T., and Pant, L. M. (2011). Growth, bulb yield and quality of onion (Allium cepa L.) as influenced by nitrogen and phosphorus fertilization on vertisol I. Growth attributes, biomass production and bulb yield. Afr. J. Agric. Res. 6, 3252–3258. doi: 10.5897/AJAR10.1024
Ajani, C. K., Zhu, Z., and Sun, D. W. (2021). Recent advances in multiscale CFD modelling of cooling processes and systems for the agrifood industry. Crit. Rev. Food Sci. Nutr. 61, 2455–2470. doi: 10.1080/10408398.2020.1809992
Anyanwu, C. N., Oparaku, O. U., Onyegegbu, S. O., Egwuatu, U., Edem, N. I., Egbuka, K., et al. (2012). Experimental investigation of a photovoltaic-powered solar cassava dryer. Drying Technol. 30, 398–403. doi: 10.1080/07373937.2011.644649
AOAC. (2005). AOAC.Official Methods of Analysis. Association of Official Analytical Chemists. (Arlington, VA) 3–4.
Ashrae Handbook (1993). Fundamentals. American Society of Heating, Refrigerating, and Air-Conditioning Engineering, Inc. Atlanta, GA.
Aslam, R., Alam, M. S., and Pandiselvam, R. (2022). Aqueous ozone sanitization system for fresh produce: design, development, and optimization of process parameters for minimally processed onion. Ozone Sci. Eng. 44, 3–16. doi: 10.1080/01919512.2021.1984206
Benhamza, A., Boubekri, A., Atia, A., Hadibi, T., and Arici, M. (2021). Drying uniformity analysis of an indirect solar dryer based on computational fluid dynamics and image processing. Sustain. Energy Technol. Assessments 47, 101466. doi: 10.1016/j.seta.2021.101466
Chavan, A., Vitankar, V., and Thorat, B. (2021). CFD modeling and experimental study of solar conduction dryer. Drying Technol. 39, 1087–1100. doi: 10.1080/07373937.2020.1846051
Defraeye, T., Verboven, P., and Nicolai, B. (2013). CFD modelling of flow and scalar exchange of spherical food products: turbulence and boundary-layer modelling. J. Food Eng. 114, 495–504. doi: 10.1016/j.jfoodeng.2012.09.003
Dissa, A. O., Desmorieux, H., Bathiebo, J., and Koulidiati, J. (2011). A comparative study of direct and indirect solar drying of mango. Global J. Pure Appl. Sci. 17, 273–294.
Eshel, D., Teper-Bamnolker, P., Vinokur, Y., Saad, I., Zutahy, Y., and Rodov, V. (2014). Fast curing: a method to improve postharvest quality of onions in hot climate harvest. Postharvest Biol. Technol. 88, 34–39. doi: 10.1016/j.postharvbio.2013.09.002
Geankoplis, C. J. (1993). Transport Processes and Unit Operations. New Jersey, NJ: PTR Prentice Hall.
Gomathy, K., Balakrishnan, M., and Pandiselvam, R. (2019). Nonlinear and multiple linear regression analysis of airflow resistance in multiplier onion. J. Food Process Eng. 42, 1–10. doi: 10.1111/jfpe.13280
Gubb, I. R., and MacTavish, H. S. (2002). “Onion pre-and postharvest considerations,” in Allium Crop Science: Recent Advances, eds H. D. Rabinowitch and C. Lesley (New York, NY: CABI), 233–265.
Hao, W., Lu, Y., Lai, Y., Yu, H., and Lyu, M. (2018). Research on operation strategy and performance prediction of flat plate solar collector with dual-function for drying agricultural products. Renew. Energy 127, 685–696. doi: 10.1016/j.renene.2018.05.021
Iranmanesh, M., Samimi Akhijahani, H., and Barghi Jahromi, M. S. (2020). CFD modeling and evaluation the performance of a solar cabinet dryer equipped with evacuated tube solar collector and thermal storage system. Renew. Energy 145, 1192–1213. doi: 10.1016/j.renene.2019.06.038
Kasso, M., and Bekele, A. (2018). Post-harvest loss and quality deterioration of horticultural crops in Dire Dawa Region, Ethiopia. J. Saudi Soc. Agric. Sci. 17, 88–96. doi: 10.1016/j.jssas.2016.01.005
Maw, B. W., and Mullinix, B. G. (2005). Moisture loss of sweet onions during curing. Postharvest Biol. Technol. 35, 223–227. doi: 10.1016/j.postharvbio.2004.04.008
Mehdipour, R., and Ghaffari, A. (2021). Solar dryer performance simulation: experimental and numerical study. J. Food Process Eng. 44, 1–18. doi: 10.1111/jfpe.13875
Menter, F. R. (1994). Two-equation eddy-viscosity turbulence models for engineering applications. AIAA J. 32, 1598–1605. doi: 10.2514/3.12149
Mintsa Do Ango, A. C., Medale, M., and Abid, C. (2013). Optimization of the design of a polymer flat plate solar collector. Solar Energy 87, 64–75. doi: 10.1016/j.solener.2012.10.006
Mondal, S., Dutta, S., Pande, P., and Naik-Nimbalkar, V. (2022). Intensify staple fibre drying by optimizing air distribution in multistage convective dryer using CFD. Chem. Eng. Process. Process Intensification 173, 108807. doi: 10.1016/j.cep.2022.108807
Nabi, G., Rab, A., Sajid, M., Ullah, F., Abbas, S. J., and Ali, I. (2013). Influence of curing methods and storage conditions on the post-harvest quality of onion bulbs. Pakistan J. Botany 45, 455–460.
Onwude, D. I., Iranshahi, K., Rubinetti, D., Martynenko, A., and Defraeye, T. (2021). Scaling-up electrohydrodynamic drying for energy-efficient food drying via physics-based simulations. J. Cleaner Prod. 329, 129690. doi: 10.1016/j.jclepro.2021.129690
Tan, A. S. T., Janaun, J., Tham, H. J., Siambun, N. J., and Abdullah, A. (2022). Performance analysis of a solar heat collector through experimental and CFD investigation. Mater. Today Proc. 57, 1338–1344. doi: 10.1016/j.matpr.2022.02.159
Vanierschot, M., Timmermans, J., and Van Den Bulck, E. (2013). “Application of particle Image Velocimetry (PIV) in the study of perforated plate wake flow,” in Proceedings of OPTIMESS2012: Optical Measurements Techniques for Structures and Systems (Maastricht: Shaker), 423–431.
Velić, D., Planinić, M., Tomas, S., and Bilić, M. (2004). Influence of airflow velocity on kinetics of convection apple drying. J. Food Eng. 64, 97–102. doi: 10.1016/j.jfoodeng.2003.09.016
Verboven, P., Flick, D., Nicolaï, B. M., and Alvarez, G. (2006). Modelling transport phenomena in refrigerated food bulks, packages and stacks: basics and advances. Int. J. Refriger. 29, 985–997. doi: 10.1016/j.ijrefrig.2005.12.010
Wilkening, H., Baraldi, D., and Heitsch, M. (2008). CFD simulations of light gas release and mixing in the Battelle Model-Containment with CFX. Nucl. Eng. Design 238, 618–626. doi: 10.1016/j.nucengdes.2007.02.042
Wright, P. J., Grant, D. G., and Triggs, C. M. (2001). Effects of onion (Allium cepa) plant maturity at harvest and method of topping on bulb quality and incidence of rots in storage. N. Zeal. J. Crop Horticult. Sci. 29, 85–91. doi: 10.1080/01140671.2001.9514166
Zewdie, T. A., Delele, M. A., Fanta, S. W., Alemayehu, M., Alemayehu, G., Adgo, E., et al. (2022). Optimisation of onion bulb curing using a heat and mass transfer model. Biosyst. Eng. 214, 42–57. doi: 10.1016/j.biosystemseng.2021.12.009
Zewdie, T. A., Fanta, S., Alemayehu, M., Alemayehu, G., Adgo, E., Nyssen, J., et al. (2019). “Effect of curing conditions and harvesting stage of maturity on Ethiopian onion bulb drying properties,” in 7th European Drying Conference (Turin), 429–435.
aw, Water activity
As, Interfacial area density (m2 m–3)
Cp, Specific heat capacity (J kg–1 °C–1)
Ce, Equivalent water vapor concentration of onion (kg m–3)
Deff, Effective moisture diffusivity (m2 s–1)
g, Gravitational force (N m–3)
h, Heat transfer coefficient (W m–2 K–1)
hm, Over all mass transfer coefficient (m s–1)
hfg, Latent heat of evaporation (J kg–1)
k, turbulent kinetic energy (m2 s–2)
Ls, skin thickness (m)
mw, The rate of moisture loss (kg m–3 s–1)
ṁa, mass flow rate of the drying air (kg s–1)
Mw, Molecular mass of water (kg mol–1),
δ, Kronecker delta
P, Static pressure (Pa)
Psat, Saturation water vapor pressure (Pa)
Se, Energy source term (W m–3)
Sm, Momentum source term (kg m s–1)
Sw, Moisture source term (kg m–3 s–1)
R, Universal gas constant (J mol–1 K–1)
RH, Relative humidity of air (decimal)
t, Time (s)
T, Temperature (°C)
v, Mean velocity vector (m s–1)
X, Moisture content in dry basis (kg kg–1)
λ, Thermal conductivity (W m–1 °C–1)
μ, Dynamic viscosity of air (kg m–1 s–1)
μt, Turbulent viscosity (kg m–1 s–1)
ρ, Density of onion (kg m–3)
 , Gradient operator
a, Air
f, Fluid
i, inlet
o, Outlet
s, Solid
Keywords: drying, heat and mass transfer, porous media, turbulent flow, radiation heating
Citation: Zewdie TA, Delele MA, Fanta SW, Vanierschot M, Alemayehu M, Alemayehu G, Adgo E, Assaye H, Verboven P and Nicolai BM (2022) Design and evaluation of a prototype solar energy driven onion curing system using CFD modeling. Front. Sustain. Food Syst. 6:1030915. doi: 10.3389/fsufs.2022.1030915
Received: 29 August 2022; Accepted: 29 September 2022;
Published: 19 October 2022.
Edited by:
Waseem Amjad, University of Agriculture, Faisalabad, PakistanReviewed by:
Sajjad Miran, University of Gujrat, PakistanCopyright © 2022 Zewdie, Delele, Fanta, Vanierschot, Alemayehu, Alemayehu, Adgo, Assaye, Verboven and Nicolai. This is an open-access article distributed under the terms of the Creative Commons Attribution License (CC BY). The use, distribution or reproduction in other forums is permitted, provided the original author(s) and the copyright owner(s) are credited and that the original publication in this journal is cited, in accordance with accepted academic practice. No use, distribution or reproduction is permitted which does not comply with these terms.
*Correspondence: Pieter Verboven, cGlldGVyLnZlcmJvdmVuQGt1bGV1dmVuLmJl
Disclaimer: All claims expressed in this article are solely those of the authors and do not necessarily represent those of their affiliated organizations, or those of the publisher, the editors and the reviewers. Any product that may be evaluated in this article or claim that may be made by its manufacturer is not guaranteed or endorsed by the publisher.
Research integrity at Frontiers
Learn more about the work of our research integrity team to safeguard the quality of each article we publish.