 Caroline Fadeke Ajilogba
 Johan Habig
 Olubukola Oluranti Babalola
- 1Food Security and Safety Focus Area, Faculty of Natural and Agricultural Sciences, North-West University, Mmabatho, South Africa
- 2MicroLife Research Centre, Agri Technovation, Wellington, South Africa
The diversity of microbes in the soil of plants is important for sustainable agriculture as these microbes are important in carrying out different functional processes to improve the soil and invariably plant growth. Inversely the presence of the crop also affects the types of microbial communities in the soil. In this study, bambara groundnut was grown during the planting season in South Africa, from November to March 2014/2015 and 2015/2016 and soil samples were taken after every 4 weeks after planting. Soil samples were taken 15 cm deep from 2 different landraces named VBR and VL. Microbial diversity was determined by soil microbial Carbon Source Utilization Profiles (CSUP) using BIOLOG™ GN2 plates. The abundance and richness of the soil microbes was also determined using the Shannon-Weaver and Evenness diversity indices. The diversity of the soil microbial population changed over the stages of plant growth, according to cluster analysis. Bacterial abundance and diversity were higher at 4 and 8 weeks after planting (WAP). The microbial abundance (richness index) in this study ranged from 0.64 to 0.94 with cultivar VL2 at 8 WAP being the highest while bulk soil (control), R2 was the lowest. The Shannon-Weaver index varied between 2.19 and 4.00 with the lowest corresponding to control while the highest was VL2 at 8 WAP. Carbon sources utilized by bacterial communities spread across the 96 carbon sources. The highest utilization of carboxylic acids, ester, amino acids and polymers and carbohydrates was found in the bacterial communities of the different landraces across growth stages. The highest utilization of alcohols, amides, amines, aromatic chemicals, brominated chemicals and phosphorylated chemicals was found in the control landraces. This indicates that the soil samples between 4 WAP and 12 WAP were richer in diversity of microbial species and their abundance. This soil diversity and richness is an indicator of the quality of the soil in order to increase crop yields and agricultural production.
Highlights
- This is the first time that the metabolic profiling of Bambara groundnut rhizosphere is done at different growth stages using BIOLOG™.
- Carbon profile of the soil bacterial communities of Bambara groundnut rhizosphere was different at each growth stages.
- The growth stage with highest carbon source utilization was between 4 and 12 weeks after planting.
- From this study, it is clear that more insight is gained on intercropping cropping system such that the period that cereals can be intercropped with Bambara groundnut should be between 4 and 12 weeks after planting to gain the biofertilization impact.
- Increased in microbial activities of the soil is related to the plant species/landraces/cultivars.
Introduction
Bambara groundnut, is an annual crop with a root system comprising a well-developed tap root. Numerous stems about 20 cm long having very short internodes from where the roots grow out with the stems bearing trifoliate compound leaves emanating from the tap root (Khan et al., 2021; Ajilogba et al., 2022b). These stems can have branches as many as twenty after the first few weeks of germination (Khan et al., 2021). Flowers are borne on auxiliary peduncle on branching stems from where they grow downwards taking with them the developing seeds (Tan et al., 2020). The pods develop first about 1 cm beneath the surface of the soil and then the seeds develop inside the pods (Tan et al., 2020; Khan et al., 2021). Pollination in flowers can either be self or by ants depending on if they are the spreading or branching types, respectively (Mohammed, 2014).
Growth stages in Bambara groundnut can be categorized into 4 stages (vegetative, flowering, pod-filling, and maturation stages) (Ajilogba et al., 2022c). After 7–15 days of planting it germinates. This is followed by flowering which is between 4 and 8 weeks (30–55 days) and may continue throughout the plant's life (Ajilogba et al., 2022c). For nodule formation in bambara groundnut, the flowering stage is critical. At 12 weeks, there is seed development and by sixteenth week, the nuts are matured for harvest (Mohammed, 2014; Khan et al., 2021). Growth stages in the plant have different effect on soil environment and also on the microbial community of the soil. In the rhizosphere, bacterial communities are dynamic and liable to changes in plant conditions (Ajilogba et al., 2022c), and some plants rhizobacteria communities also change due to climate change (Wang et al., 2017).
It has been demonstrated that soil, plant species, plant genotypes, plan organs and developmental stages affect the plant microbiome community composition (Dastogeer et al., 2020). The effect of plant developmental stage on rhizosphere microbial communities is being studied in recent times (Chaparro et al., 2014; Xiong et al., 2021; Ajilogba et al., 2022c). This is to validate the fact that the change from young seedling, flowering plant, to a plant in senescence may influence the microbial community structure and therefore, the microbial richness and variability at different developmental stages (Houlden et al., 2008).
This dynamism of bacteria in the rhizosphere can be analyzed as a measure of the level of richness and abundance of the different species present in the soil (Xia et al., 2022). To examine soil microbial populations, a variety of molecular and microbiological approaches are available. However, the methods selected to study these changes, should be both cost-effective and useful (valuable) in order to contribute to a better understanding of the effect of management practices such as cropping systems, for example crop rotation and tillage on the biological component of soils (Das and Chakrabarti, 2013). This is because cropping systems involving legume species have been observed to stimulate the microbial community due to the association between the soil microbes and the rhizosphere (Igiehon and Babalola, 2018; Dang et al., 2020). This leads to the release of exudates that improve cycling of plant nutrients, its availability to the plants, plant growth promotion and also diseases and pest resistance (McNear, 2013; Olanrewaju et al., 2017; Saeed et al., 2021). This process leads to improvement of soil health and quality and thus improved crop health, crop yield and food security (Ajilogba and Babalola, 2019; Ajilogba et al., 2022b). Given that functional diversity in the soil is associated with the actual or potential functions of organisms that contribute to ecosystem functioning, it can be measured to determine the biological status of soil microbial communities (Dey and Tribedi, 2018; Jezierska-Tys et al., 2020). BIOLOG™ has been used in comparing the different metabolic diversity of microbial communities including water, soil and wheat rhizosphere (Dey and Tribedi, 2018; Gałazka et al., 2019; Jezierska-Tys et al., 2020; Zhang et al., 2020). Using the BIOLOG® method, it is possible to identify the catabolic diversity of bacterial populations based on how well they utilize sole-carbon substrates (Wang et al., 2007; Wolińska et al., 2018; Zhao et al., 2019). Its principle rests on the way environmental samples use carbon sources, in which case the carbon sources have been dried in 95 wells to which colorless tetrazolium dye had been added. Upon utilization/oxidation of the substrate by the bacterial communities in the samples, the dyes in the wells are reduced to violet formazan (Campbell et al., 1997; Garland, 1999; Insam et al., 2004; Stefanowicz, 2006; Zhang et al., 2016). Therefore, AWC helps to indicate the rhizobacterial activities in soil microbiome (Houlden et al., 2008).
In this context, soil microbial carbon source utilization profiles (CSUP), i.e., profiling the different food sources utilized by the microbial species within a population, are widely utilized as markers of the soil's quality. This involves the ability of the microbial population to utilize a specific substrate (“food source”). A metabolic fingerprint is a distinctive reaction pattern that is produced by these populations of organisms. This technique has been utilized extensively as a soil quality indicator for various land-use and management practices (Habig and Swanepoel, 2015).
This is the first study where the metabolic diversity of Bambara groundnut rhizospheric bacteria is analyzed using BIOLOG™. Therefore, this study was done to observe the impact of the different growth stages of Bambara groundnut on carbon profile of the soil bacterial communities of Bambara groundnut rhizosphere.
Materials and methods
Preparation of bambara groundnut landraces for sample collection
Two bambara groundnut landraces VBR and VL were collected from the International Institute of Agriculture (IITA) (based on approved proposal) and planted in the experimental farm of the North-West University Mafikeng. Soil samples were collected before planting and referred to as the control (bulk soil) and after planting referred to as VBR1, VBR2, VL1, and VL2.
Agricultural practices
Irrigation
Mean annual precipitation (MAP) in Mafikeng during the 2015/2016 planting season was 445 mm as a result of the severe El Nino scenario (Botai et al., 2016). Apart from this, occasional watering was applied as the plant grows under rainfed conditions.
Fertilization
Biofertilization was carried out using biofertilizers identified as Bacillus thuringiensis, Bacillus amyloliquefaciens and Bacillus sp as used by Ajilogba et al. (2022a).
Sample collection
At the North-West University agricultural farm, Mafikeng campus (Lat. 25°7891 Long. 25°61'84) South Africa, soil samples were taken from field trials conducted throughout the planting season between October 2014 and March 2016. In addition to the bulk soil that was taken before planting, four soil samples from each of the uprooted bambara groundnut roots were taken at random over the course of 16 weeks, at intervals that corresponded to the plant's various growth stages. A total of twenty four (24) soil samples were taken, each at a depth of 15 cm, and stored at 4°C until needed.
Analysis of bacterial community in the soil samples /microbial activities
Soil chemical analysis
Chemical analysis was conducted on soil samples at each growth stage (4 weeks interval). Composite soil samples were taken at four sampling points using a soil auger. After being air dried, the soil samples were run through a 2 mm sieve. In order to conduct the P (Bray 1), total N (Dumas technique), and organic C (Walkley-Black) analyses, standard laboratory methods were followed (Ajilogba et al., 2016).
Soil microbial functional diversity
Sample preparation
Three replicates were made per soil making a total of 72 soil samples to be analyzed. Ten (10) g of each soil sample were measured into 90 ml of sterile distilled water (SDW). The resultant solutions were shaken on the rotary shaker for 45–60 min at 160 rpm and were allowed to settle for another 45 min so that solid particles are not transferred during dilution. Thereafter, serial dilution was carried out on all samples by taking 1 ml from the resultant supernatant and adding to 2 ml of SDW. To 9.9 ml of SDW, 0.1 ml of the previous supernatant was added and finally, 2 ml of this supernatant was added to 18 ml of SDW.
Inoculation of soil samples in BIOLOG GN2 plates
Each supernatant from the 72 samples was used to inoculate the 96 wells of BIOLOG GN2 Plates (Biolog Inc., Hayward, CA, USA) each plate containing 95 sources of C and a control well by aliquoting 150 μl of supernatant into each well. The samples were incubated at 28°C. Respiration of C sources by microbial populations reduced the tetrazolium dye within each BIOLOG GN2 well, causing a color change. This color change was spectrophotometrically determined by taking readings every 8 h for 7 days using ThermoFisher MultiSkan EFX at absorbance of 590 nm. This was in order to determine the average well color development (AWCD) within each plate (Habig and Swanepoel, 2015).
Determination of functional diversity
The AWCD method was used to analyse the optical density (OD) data that were obtained from each plate (Wang et al., 2007; Gryta et al., 2014). Standardized By comparing the absorbance values of the wells with C sources to the absorbance value of the control well without a C source, patterns were established. Any negative results were changed to zero, and any variations in the inoculum density were taken into account by dividing the average absorbance for the entire plate by the absorbance of each individual well to produce the standardized OD.
Analysis of carbon source utilization profiles
The amount and equitability of carbon sources metabolized as indices of microbial richness and evenness, respectively, were used to calculate carbon source utilization profiles (CSUP), or functional diversity, of soil microbial assemblages (Wang et al., 2007; Habig and Swanepoel, 2015; Mofokeng et al., 2020).
Shannon-Weaver substrate diversity index was used to measure biodiversity. Therefore, the number of different substrates utilized by the microbial communities was a measure of their functional diversity (Habig and Swanepoel, 2015). Substrate richness and evenness was also used to measure bacterial functional diversity (E) (Lupwayi et al., 2001).
Statistical analyses
Raw data on carbon source utilization from the reading of the spectrophotometer were transposed on Excel. Data was analyzed using non-parametric statistical analyses in STATISTICA 12 (StatSoft, Inc.). This program has four blocks. The raw data were fed into the first block. The second block subtracted the control from each of the well. The third block got rid of all the negative values. AWCD was calculated from the fourth block at OD 0.25 nm. Soil microbial diversity was statistically analyzed using Principal Component Analysis (PCA) and cluster analyses (vertical hierarchical tree plots). Fisher Least Significant Difference (LSD) was applied to determine homogenous grouping and calculated at p < 0.05. The Fisher LSD test is considered to be a less conservative post-hoc test than the Tukey Honest Significant Difference (HSD) (Habig and Swanepoel, 2015).
Results
AWCD analysis
Main groups of carbon sources utilized by soil microbial communities in the different landraces over time and at the different growth stages are summarized in Table 1. Significant differences in carbon source utilization by soil microbial communities in the different landraces are evident. The highest utilization of alcohols, amides, amines, aromatic chemicals, brominated chemicals and phosphorylated chemicals was found in the control (bulk soil). The highest utilization of carboxylic acids was found in the VBR1 cultivar, while the highest utilization of esters was found in the VBR2 cultivar. Soil microbial communities in the VL1 landraces demonstrated the highest utilization of amino acids and polymers, while the microbial communities in the VL2 landraces were responsible for the highest utilization of carbohydrates. On the other hand, the lowest utilization of carbohydrates and carboxylic acids was exhibited in the control (bulk soil). The VBR1 landraces exhibited the lowest utilization of amino acids and polymers, while the VBR2 cultivar exhibited the lowest utilization of amines and aromatic chemicals. The lowest utilization of amides and brominated chemicals was found in the VL1 cultivar, whereas, the lowest utilization of alcohols and phosphorylated chemicals was found in the VL2 cultivar.
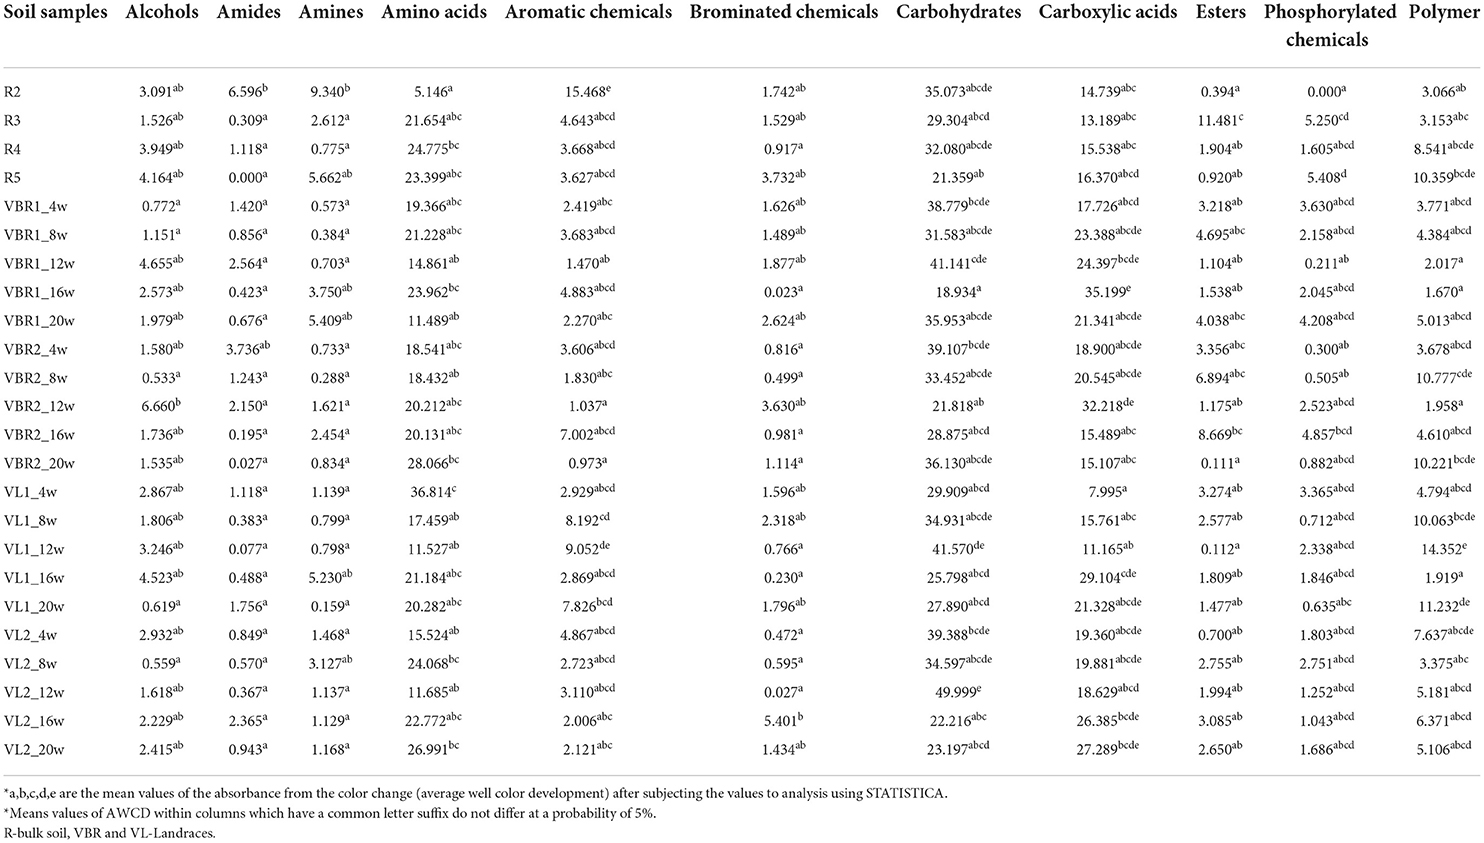
Table 1. Main groups of carbon sources utilized by soil microbial communities in the various soil samples of landraces and over different growth stages over time.
On average, carbohydrates, amino acids and carboxylic acids were the most utilized carbon sources, whereas, amides, brominated chemicals and phosphorylated chemicals were the least utilized. Considering the different landraces, soil microbial communities in the VBR1 and the control exhibited (on average) the lowest overall carbon source utilization, whereas, microbial communities in the VL1 and VL2 landraces exhibited the highest overall carbon source utilization (Supplementary material- https://doi.org/10.6084/m9.figshare.20443149). The number of bacterial species in the soil sample able to utilize specific carbon sources is indicated in the intensity of the color change. This implies that several bacterial species in each soil sample utilize more than one carbon source. This is because each soil sample is inoculated in a carbon source plate having 95 carbon sources. The bacterial species utilize the carbon sources resulting into different intensity of color change.
Diversity indices
Depending on the soil samples from the two landraces of Bambara groundnut sampled, varying percentages of carbon sources were utilized, with values ranging from 2.19 to 4.00 as seen in Table 2. This values show a higher diversity.
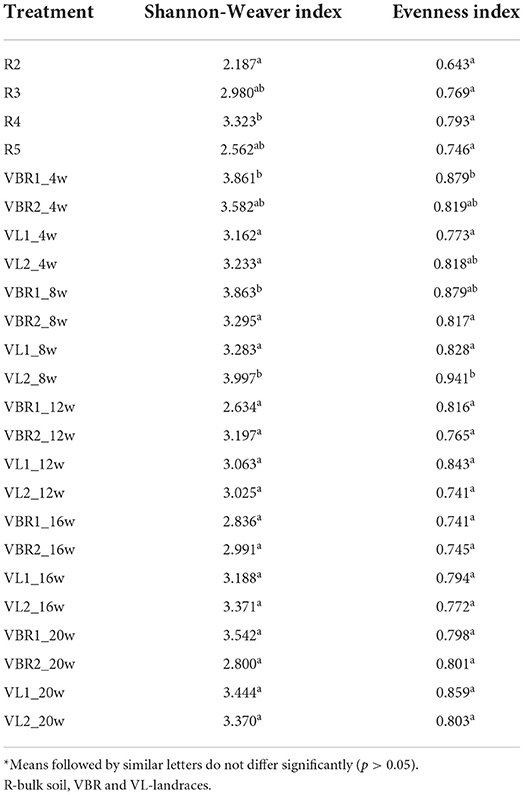
Table 2. The Shannon-Weaver diversity index and the Evenness Index between the bambara groundnut landraces and specific sampling times.
Substrate evenness is assumed to have a value between 0 and 1, with 1 denoting a circumstance in which all species of microbes present in the samples were equally prevalent. Because of reduced interspecies variation in microbial communities, there will be less dominance and more diversity. In this analysis, Substrate evenness indices were moderately high and ranged between 0.64 and 0.94 as seen in Table 2.
Taking a closer look at the microbial richness (Shannon-Weaver Index) and microbial abundance (Evenness index) in Table 2, it is clear that microbial diversity was significantly changed by crops present, as well as the difference in crop growth stages. No significant changes in microbial richness were observed between the VBR1 and VBR2 landraces, irrespective of sampling time. Microbial richness in the VBR1 cultivar changed significantly over time from the fourth and eighth week to the twelfth and sixteenth week; whereas no significant change could be observed between the fourth and twentieth week. Microbial richness in the VBR2 landraces did not change significantly between sampling times.
Microbial richness and evenness in the VL1 cultivar did not change significantly over time, but microbial richness in the VL2 landraces differed significantly between the eighth and twelfth week. Microbial evenness in the VBR1 cultivar, on the other hand, changed significantly over time from the fourth and eighth week to the sixteenth week, but no significant change could be observed between the fourth and twentieth week. Microbial evenness in the VBR2 landraces did not change significantly between sampling times.
Considering the various landraces, the highest average microbial diversity was observed in the VBR1 and VL2 landraces, while the lowest average microbial diversity was observed in the control (bulk soil). Between the VBR and VL landraces, the highest overall microbial diversity was observed in the VL landraces, while the overall lowest microbial diversity was observed in the VBR landraces.
According to the Shannon-Weaver and Evenness Indices, the highest microbial species richness and evenness was associated with the VBR1 landraces during the fourth and eighth week, and the VL 2 cultivar during the eighth week. Microbial species richness and evenness were the lowest in the VBR1 and VBR2 landraces during the twelfth and twentieth week, respectively, as well as in the twelfth week of both the VL1 and VL2 landraces.
Dendrogram constructed to compare microbial richness and evenness over time
Principal Component Analysis (PCA) was used to identify differences in active bacterial functional diversity, but as it was difficult to distinguish between groups clearly, cluster analysis was used as an alternate measure to allow for a 2-D visualization of potential landrace variation. Dendrograms were constructed to assign microbial functions within different landraces into groups, so that similar microbial function will appear in the same cluster, compared to landraces in other clusters as illustrated by the dendrogram in Figure 1.
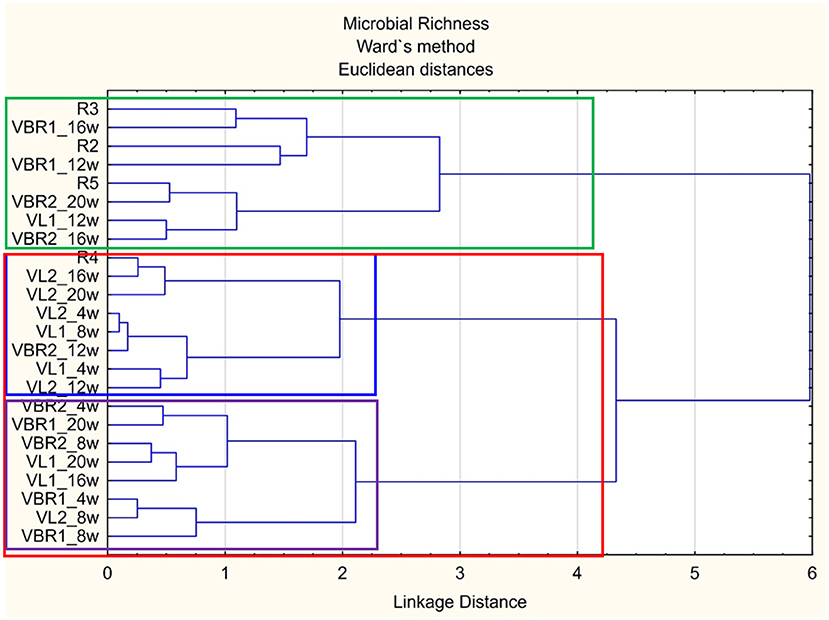
Figure 1. Dendrogram illustrating the differences in microbial richness between landraces and growth stages soil samples over time.
The plants/crops present in the examined landraces had a significant impact on the nutrients released by decomposing plant material as well as the plant root exudates composition (which act as food sources for soil microbial populations close to the plant roots). The composition of the nutrients released through decomposition or the plant root exudates attract microbial populations that were especially well-adapted to utilize the specific compounds rapidly, thus, contributing to the difference in CSUP, i.e., microbial functions, of soil microbial populations. From the dendrogram (Figure 1), two main clusters can be distinguished: groups containing mainly the control samples [green block-(R3-VBR2_16w)] and group containing the different bambara groundnut soils [red block- (R4-VBR1_8w)]. Furthermore, the red block contains two sub-clusters: one representing mainly the VL landraces [blue block-(R4-VL2_12w)], and the other sub-cluster representing mainly the VBR landraces [purple block-(VBR2_4w-VBR1_8w)]. Based on the results obtained, the dendrogram thus, indicates that microbial richness present in the VL and VBR landraces are more similar to each other, compared to the microbial richness present mainly in the bulk soil samples.
When considering the microbial abundance found in the soil samples of the different landraces, two main clusters can be distinguished in the dendrogram (Figure 2).
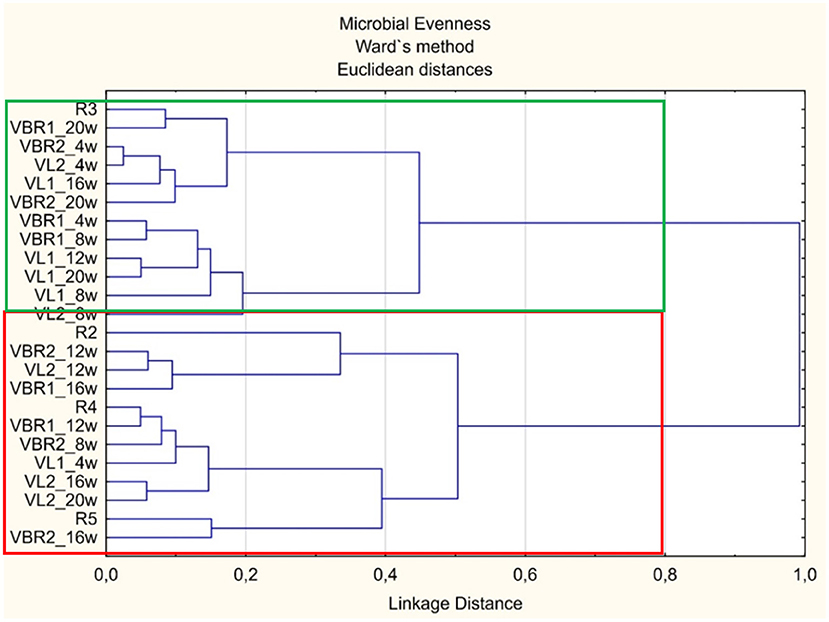
Figure 2. Dendrogram illustrating the differences in microbial evenness between landraces and growth stages soil samples over time.
The top main cluster [green block-(R3-VL2_8w)] consists mainly of the VL1 samples, while most of the control (bulk soil) are present in the bottom main cluster [red block-(R2-VBR2_16w)] with most of the VBR2 and VL2 landraces. Furthermore, the green block contained mostly the samples taken during the fourth, eighth and twentieth week, whereas, the red block contained mostly samples taken during the twelfth (pod filling) and sixteenth week (maturation). Considering the results obtained, the dendrogram thus, indicates that microbial evenness in landraces such as VL1, stabilized, i.e., occurred in a single main cluster, after the eighth week (flowering), whereas VL2 stabilized after the twelfth week. It is interesting to note that both the VBR1 and VBR2 cultivars fourth (vegetative) and twentieth (harvest) weeks occurred in the same main cluster. The microbial evenness in the VBR1 cultivar's initial and final evenness differed slightly from each other since they were present in the same main cluster, but different sub-clusters. The VBR2 cultivar's initial and final evenness indices were present in the same sub-cluster in the same main cluster. This suggests a change in microbial evenness during the different plant growth stages, but might be that microbial evenness returned to its original state.
Cluster analysis to compare microbial functional diversity
From the dendrogram (Figure 3), no clearly distinguishable clusters, according to landraces or sampling times, could be observed. Most of the VBR landraces' fourth and eighth week sampling cluster were found mainly in the red block while the remaining sampling times were found in the green block. Furthermore, the red block also contains most of the VL landraces initial and final sampling times while the intermediate sampling times clustered in the green block. Based on the results obtained, the dendrogram thus indicates that the functions performed by the soil microbial communities in the VBR landraces changed over time as the crop matured. Also, functions performed by the microbial communities in the VL landraces reverted back to their original functions after changing according to the needs of the maturing crops.
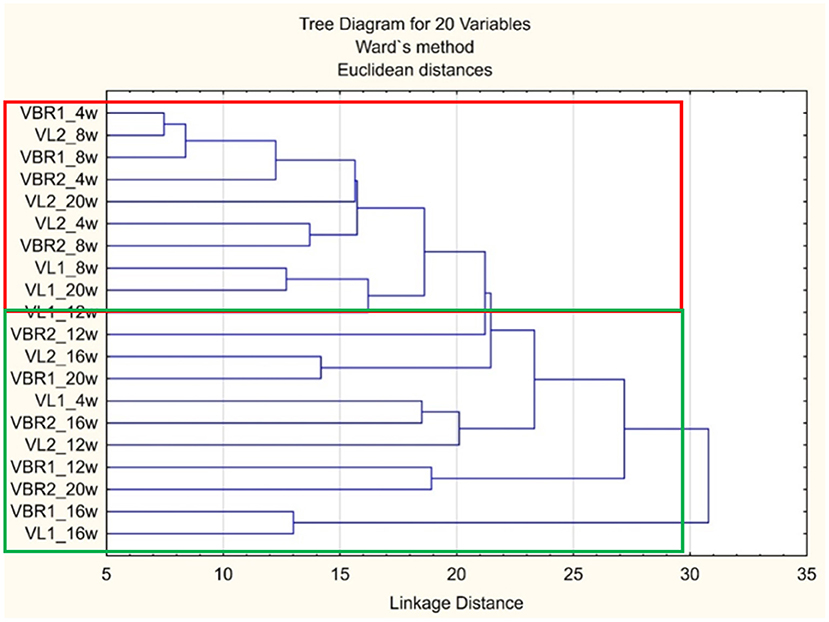
Figure 3. Dendrogram illustrating the differences in microbial functional diversity between different soil samples of landraces and growth stages over time.
To determine significant differences in functional diversity of microbial communities present in the different landraces at various sampling times, a box and whisker plot was constructed (Figure 4A). From the diagram, significant differences in microbial functions were observed between VBR1 and VBR2 during the fourth week, while the microbial function changed significantly from the eighth and twelfth, as well as from the fourth to the twentieth week in the VBR1 cultivar. No significant differences in soil microbial functions were observed in either the VBR2 or VL1 landraces from the fourth to the twentieth week. The VL2 cultivar, on the other hand, differed significantly from the VL1 cultivar during the eighth week. Within the VL2 cultivar, significant differences in microbial functions were observed between the fourth and the eighth week, and again between the eighth and the sixteenth week. It should be noted that, at the twentieth week, no significant difference could be observed in the microbial functions between the VBR1, VBR2, VL1, or VL2 landraces.
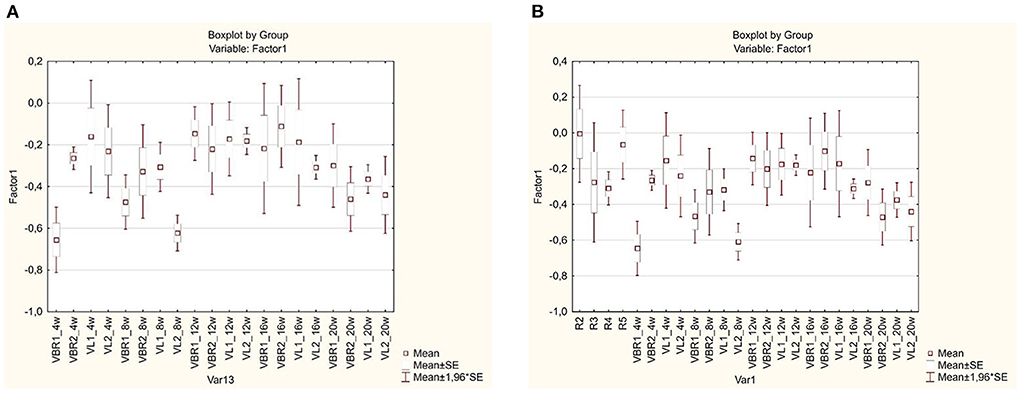
Figure 4. (A) Box and whisker plot of carbon source utilization profiles for microbial communities present in different landraces and growth stages soil samples over time. (B) Box and whiskers plot constructed to determine the significant difference in the functional diversity of the bulk soil (control) and the various landraces at the different growth stages.
Figure 4B, represents the box and whiskers plot constructed to determine the significant difference in the functional diversity of the various landraces at the different growth stages corresponding to the monthly time interval. It was observed that, there was a significant difference between the landrace VBR1 and the others while at 12 weeks there was no significant difference observed in the soil microbial functional diversity. In week 8, there was significant difference between the VL2 landrace and others while in week 16, the significant difference between landraces was not appreciable. In week 20, there was significant difference in the soil microbial function of VBR1 compared with the others while among the control samples or bulk soil, R4 was significantly different from the others. Among the VBR landrace across the sampling time or growth stages, VBR1 at week 4 was significantly different from the rest while VL2 cultivar at week 8 was also different from the others. This box and whiskers plot showed that the microbial activities at weeks 4 and 8 across the growth stages were quite significant compared to others. Microbial activities in bambara groundnut rhizosphere was found to be diverse at both 4 WAP and 8 WAP which relates to the vegetative and reproductive phase of the plant. The box and whiskers plot also revealed groups or clusters found among cultivars across the growth stages. The bulk soil clustered together except for R4, the landraces (VBR and VL) weeks 4 and 8 clustered together, the landraces in weeks 12 and 16 also clustered together while week 20 cultivar clustered on its own. This helps to show the dynamics of diversity across landraces and across growth stages.
Discussion
This study is the first of its kind in South Africa where the influence of bambara groundnut plant growth stages on metabolic activities/functional diversities of microbial community structure is investigated. Other studies have been carried out on maize plants (Baudoin et al., 2002), potato (Van Overbeek and Van Elsas, 2008), sugar beet, wheat and pea (Houlden et al., 2008). Functional diversity of microbes in soil is directly related to the types of agricultural practices carried out which is also influenced by the micronutrients in the soil (Montgomery and Biklé, 2021). These agricultural practices include, the cropping system practiced, application of fertilizer, the types of crops grown and the growth stages of the crop. This functional diversity is evidenced in the type and abundance of carbon utilized in the soil (Habig and Swanepoel, 2015; Zhao et al., 2019).
Carbon source utilization at different growth stages of bambara groundnut
Average well color development observed in carbon sources inoculated with soil samples reflects the ability of the microbes to utilize them and it is directly related to the number of species present in the soil as observed in this study and previous studies (Chen et al., 2008; Yang et al., 2013; Koner et al., 2021).
A decrease in the quantity of carbon utilized from the rhizosphere soil of growth stages to the bulk soil was observed in this study. This shows that metabolic and microbiological activities were higher in the rhizosphere soil compared to the bulk soil (Chaudhary et al., 2012; Sugiyama et al., 2014; Ajilogba et al., 2022c). This is because in the rhizosphere, higher number of bacteria flourishes as a result of availability of nutrients (Bakker et al., 2012; Wang et al., 2022).
According to research, different plant species and plant types have slightly distinct microbiomes. The rhizosphere of plant roots is where these variations are most frequently seen (Cong et al., 2015; Lebeis, 2015; Gałazka et al., 2022). This is necessary because microorganisms are both a fundamental component of soil and the basis of its operations. Microorganisms in the soil are essential for preserving soil fertility and quality (Jezierska-Tys et al., 2020).
The bulk soil had the lowest average microbial diversity while the highest average microbial diversity was observed in the rhizosphere of VBR1 and VL2. The rhizosphere is a hotspot for microbial–plant interactions, with a lot of exchange of energy and nutrients between them (Kong and Liu, 2022; Wang et al., 2022). This is in contrast to the bulk soil with low microbial activity and nutrient cycling and therefore lower metabolic potential (Oberholster et al., 2018; Gałazka et al., 2022). This is also clear that the diversity between bulk soil and rhizospheric soil could be as result of the landraces, cultivars or even crop type as observed also by Oberholster et al. (2018). The H index in this study was 4.00 for soil samples from growth stages VL2 at 8 WAP which corresponds to flowering season and was the highest while that of bulk soil was the least 2.19. These results suggest that the bacterial community present in the rhizosphere at the different growth stages increased in complexity from the bulk soil. This could also mean that the soil was more fertile during the flowering stage enabled by the different carbon source metabolized in this season which includes carbohydrates, carboxylic acids and amino acids. Carbon profile of the soil bacterial communities of Bambara groundnut rhizosphere was different at each growth stages. The growth stage with highest carbon source utilization was between 4 and 12 weeks after planting. However, the study from García-Salamanca et al. (2013) observed that the bulk soil was more complex than the rhizosphere.
The microbial abundance (richness index) in this study ranged from 0.64 to 0.94 with the lowest as the bulk soil. Microbial abundance was highest during the vegetative growth stage (WAP for VL2). Between the 4 WAP and 12 WAP, the abundance of microbial species was high which shows that the different microbial species were reaching a point where they were all present in almost equal amounts—there is a very low level of dominance (Habig and Swanepoel, 2015).
Singh et al. (2007) observed that there was no significant impact of the species of crop planted and the bacterial community, this was only observed in this study with microbial evenness using cultivar VBR2 at the 4 WAP and harvest. There was significant difference in cultivar VL1 and VL2, showing its impact on the bacterial community (Lamb et al., 2011). This is worthy of note as it shows variability within cultivar, landraces (seed vigor) (Finch-Savage and Bassel, 2016), microclimate (rainfall and irrigation), planting pattern (how many per rows) (Ihwan et al., 2019) and soil condition where each cultivar was planted on the field (which were not taken into consideration in this study). Ideally, a healthy and fertile soil is characterized by high microbial species richness, as well as an equal distribution of species throughout a soil microbial community, i.e., a combination of high Shannon-Weaver and Evenness indices (Thompson and Kao-Kniffin, 2016). Plant species or cultivars have been observed to influence the composition of the microbes in the soil community (Berg and Smalla, 2009; Eisenhauer et al., 2010; Reese et al., 2018; Liu et al., 2020). Also, the richness of a plant species is seen in the different influences exerted on soil nutrients and mechanisms of root exudation (Berg and Smalla, 2009; Eisenhauer et al., 2017). This ability of plants to change the diversity, distribution, quantity and functions of microbes in the rhizosphere could be attributed to the ability of microbes to create a microenvironment within the rhizosphere (Liu et al., 2020). This microenvironment is rich in carboxylic acid, carbohydrates and amino acids as a result of the diverse exudates from plants (Uroz et al., 2010; Eisenhauer et al., 2017).
Plant developmental growth stages were observed not to have any detectable influence on the bacterial community of maize at the first sample (Cavaglieri et al., 2009). But in this study, there was significant change overtime which corresponds to growth stages in microbial evenness from the 4 WAP to the 16 WAP in cultivar VBR1 (Ajilogba et al., 2022c). This also agreed with Xiong et al. (2021) who observed that In comparison to soils, plant developmental stage had a far greater impact on the microbial diversity, composition, and interkingdom networks in plant compartments, with the phylloplane showing the greatest influence.
Generally, in this present study, the metabolic functions of the soil significantly changed through the plant growth stages with the lowest in the bulk soil and the highest found between 4 WAP and 8 WAP of landraces VBR1 and VL2, which corresponds to the vegetative, flowering and pod filling season. Microbial richness and evenness varied by growth stages and by landraces (Cavaglieri et al., 2009). Inceoglu et al. (2011) also observed that the relative abundance of microbes in the soil increased from the bulk soil to all the growth stages of potato.
It would seem that the presence of bambara groundnut played a bigger role than the changes in microbial richness over time. The fact that the microbial richness in the near-harvest samples of the VBR landraces grouped with the microbial richness of the control (bulk soil), might indicate that microbial richness in the VBR landraces returned to its original state.
Conclusion
It is evident that carbohydrates, carboxylic acids and amino acids were the most utilized carbon sources and the soil microbial functions was greatly affected by the presence of the bambara groundnut and their development stages. Some of the landraces differed significantly from their duplicate parts (i.e., VL1 and VL2) during the initial weeks and changed during the course of the study. Finally, the physiological activities of the rhizosphere bacterial communities of bambara groundnut measured by BIOLOG™ assay suggested that the metabolic capabilities of the rhizosphere were higher in the soil during the growth stages compared with the control. This capability was also more obvious during the flowering stage (4–8 WAP). Although statistically insignificant, the VL treatments exhibited the highest carbon source utilization, whereas, the VBR treatments exhibiting the lowest carbon source utilization—even lower than the control treatments. This observation is important in agriculture in the sense that planting of landrace VL if encouraged, could increase microbial diversity of the soil which invariably increases soil fertility and crop production.
Although carbon source utilization profiles can be used as indicators of soil quality, these indicators are sensitive to changes in various environmental factors, crops planted, and soil and agricultural management practices. It is inadvisable to analyze composite soil samples, since it could give rise to statistical constraints, which, in turn, could result in limited analyses and incorrect conclusions. Therefore, it is advised that trends in carbon source utilization profiles be observed over time to obtain a more thorough reflection of the potential impact that various agricultural methods may have on microbial diversity as a measure of soil fertility and health.
Delimitation
This study was carried out during the 2014/2015 and 2015/2016 planting season but only samples from 2015/2016 were analyzed. This result will help to be a foundation to which future studies can be compared and to verify if there are changes observed over the years which is not within the scope of the funding of this study.
Data availability statement
The datasets presented in this study can be found in online repositories. The names of the repository/repositories and accession number(s) can be found in the article/supplementary material (https://doi.org/10.6084/m9.figshare.20443149).
Author contributions
CA and OB conceived the study. CA and JH carried out the experiment and data analysis. OB supervised the study. All authors contributed to the writeup and approved the manuscript.
Funding
This work was supported by the National Research Foundation (NRF) incentive funding (Grant Number: UID81192).
Conflict of interest
The authors declare that the research was conducted in the absence of any commercial or financial relationships that could be construed as a potential conflict of interest.
Publisher's note
All claims expressed in this article are solely those of the authors and do not necessarily represent those of their affiliated organizations, or those of the publisher, the editors and the reviewers. Any product that may be evaluated in this article, or claim that may be made by its manufacturer, is not guaranteed or endorsed by the publisher.
References
Ajilogba, C., Babalola, O., Adebola, P., and Adeleke, R. (2016). Evaluation of PGPR and biocontrol activities of bacteria isolated from Bambara groundnut rhizosphere. N. Biotechnol. 2016, S128–S129. doi: 10.1016/j.nbt.2016.06.1169
Ajilogba, C. F., and Babalola, O. O. (2019). GC–MS analysis of volatile organic compounds from Bambara groundnut rhizobacteria and their antibacterial properties. World J. Microbiol. Biotechnol. 35, 1–19. doi: 10.1007/s11274-019-2660-7
Ajilogba, C. F., Babalola, O. O., Adebola, P., and Adeleke, R. (2022a). Bambara groundnut rhizobacteria antimicrobial and biofertilization potential. Front. Plant Sci. 14, 2289. doi: 10.3389/fpls.2022.854937
Ajilogba, C. F., Olanrewaju, O. S., and Babalola, O. O. (2022b). Improving bambara groundnut production: insight into the role of omics and beneficial bacteria. Front. Plant Sci. 13, 836133. doi: 10.3389/fpls.2022.836133
Ajilogba, C. F., Olanrewaju, O. S., and Babalola, O. O. (2022c). Plant growth stage drives the temporal and spatial dynamics of the bacterial microbiome in the rhizosphere of Vigna subterranea. Front. Microbiol. 13, 825377. doi: 10.3389/fmicb.2022.825377
Bakker, M. G., Manter, D. K., Sheflin, A. M., Weir, T. L., and Vivanco, J. M. (2012). Harnessing the rhizosphere microbiome through plant breeding and agricultural management. Plant Soil 360, 1–13. doi: 10.1007/s11104-012-1361-x
Baudoin, E., Benizri, E., and Guckert, A. (2002). Impact of growth stage on the bacterial community structure along maize roots, as determined by metabolic and genetic fingerprinting. Appl. Soil Ecol. 19, 135–145. doi: 10.1016/S0929-1393(01)00185-8
Berg, G., and Smalla, K. (2009). Plant species and soil type cooperatively shape the structure and function of microbial communities in the rhizosphere. FEMS Microbiol. Ecol. 68, 1–13. doi: 10.1111/j.1574-6941.2009.00654.x
Botai, C. M., Botai, J. O., Dlamini, L. C., Zwane, N. S., and Phaduli, E. (2016). Characteristics of droughts in South Africa: A case study of free state and North West provinces. Water 8, 439. doi: 10.3390/w8100439
Campbell, C., Grayston, S., and Hirst, D. (1997). Use of rhizosphere carbon sources in sole carbon source tests to discriminate soil microbial communities. J. Microbiol. Methods 30, 33–41. doi: 10.1016/S0167-7012(97)00041-9
Cavaglieri, L., Orlando, J., and Etcheverry, M. (2009). Rhizosphere microbial community structure at different maize plant growth stages and root locations. Microbiol. Res. 164, 391–399. doi: 10.1016/j.micres.2007.03.006
Chaparro, J., Badri, D., and Vivanco, J. (2014). Rhizosphere microbiome assemblage is affected by plant development. ISME J. 8, 790–803. doi: 10.1038/ismej.2013.196
Chaudhary, D. R., Saxena, J., Lorenz, N., Dick, L. K., and Dick, R. P. (2012). Microbial profiles of rhizosphere and bulk soil microbial communities of biofuel crops switchgrass (Panicum virgatum L.) and Jatropha (Jatropha curcas L.). Appl. Environ. Soil Sci. 2012, 906864. doi: 10.1155/2012/906864
Chen, X. P., Kong, W. D., He, J. Z., Liu, W. J., Smith, S. E., Smith, F. A., et al. (2008). Do water regimes affect iron-plaque formation and microbial communities in the rhizosphere of paddy rice? J. Plant Nutr. Soil Sci. 171, 193–199. doi: 10.1002/jpln.200700018
Cong, J., Yang, Y., Liu, X., Lu, H., Liu, X., Zhou, J., et al. (2015). Analyses of soil microbial community compositions and functional genes reveal potential consequences of natural forest succession. Sci. Rep. 5, 1–11. doi: 10.1038/srep10007
Dang, K., Gong, X., Zhao, G., Wang, H., Ivanistau, A., and Feng, B. (2020). Intercropping alters the soil microbial diversity and community to facilitate nitrogen assimilation: a potential mechanism for increasing proso millet grain yield. Front. Microbiol. 11, 601054. doi: 10.3389/fmicb.2020.601054
Das, B., and Chakrabarti, K. (2013). Assessment of community level physiological profiles and molecular diversity of soil bacteria under different cropping systems. Turkish J. Agriculture Forestry 37, 468–474. doi: 10.3906/tar-1209-52
Dastogeer, K. M., Tumpa, F. H., Sultana, A., Akter, M. A., and Chakraborty, A. (2020). Plant microbiome–an account of the factors that shape community composition and diversity. Curr. Plant Biol. 23, 100161. doi: 10.1016/j.cpb.2020.100161
Dey, S., and Tribedi, P. (2018). Microbial functional diversity plays an important role in the degradation of polyhydroxybutyrate (PHB) in soil. Biotechnology 8, 171. doi: 10.1007/s13205-018-1201-7
Eisenhauer, N., BEßLER, H., Engels, C., Gleixner, G., Habekost, M., Milcu, A., et al. (2010). Plant diversity effects on soil microorganisms support the singular hypothesis. Ecology 91, 485–496. doi: 10.1890/08-2338.1
Eisenhauer, N., Lanoue, A., Strecker, T., Scheu, S., Steinauer, K., Thakur, M. P., et al. (2017). Root biomass and exudates link plant diversity with soil bacterial and fungal biomass. Sci. Rep. 7, 44641. doi: 10.1038/srep44641
Finch-Savage, W. E., and Bassel, G. W. (2016). Seed vigour and crop establishment: extending performance beyond adaptation. J. Exp. Bot. 67, 567–591. doi: 10.1093/jxb/erv490
Gałazka, A., Grzeda, E., and Jończyk, K. (2019). Changes of microbial diversity in rhizosphere soils of new quality varieties of winter wheat cultivation in organic farming. Sustainability 11, 4057. doi: 10.3390/su11154057
Gałazka, A., Marzec-Grzadziel, A., Varsadiya, M., Niedzwiecki, J., Gawryjołek, K., Furtak, K., et al. (2022). Biodiversity and metabolic potential of bacteria in bulk soil from the peri-root zone of black alder (Alnus glutinosa), silver birch (Betula pendula) and scots pine (Pinus sylvestris). Int. J. Mol. Sci. 23, 2633. doi: 10.3390/ijms23052633
García-Salamanca, A., Molina-Henares, M. A., Dillewijn, P., Solano, J., Pizarro-Tobías, P., Roca, A., et al. (2013). Bacterial diversity in the rhizosphere of maize and the surrounding carbonate-rich bulk soil. Microb. Biotechnol. 6, 36–44. doi: 10.1111/j.1751-7915.2012.00358.x
Garland, J. (1999). “Potential and limitations of BIOLOG for microbial community analysis,” in Proceedings of the 8th International Symposium on Microbial Ecology Atlantic Canada Society for Microbial Ecolog, 1–7.
Gryta, A., Frac, M., and Oszust, K. (2014). The application of the Biolog EcoPlate approach in ecotoxicological evaluation of dairy sewage sludge. Appl. Biochem. Biotechnol. 174, 1434–1443. doi: 10.1007/s12010-014-1131-8
Habig, J., and Swanepoel, C. (2015). Effects of conservation agriculture and fertilization on soil microbial diversity and activity. Environments 2, 358–384. doi: 10.3390/environments2030358
Houlden, A., Timms-Wilson, T. M., Day, M. J., and Bailey, M. J. (2008). Influence of plant developmental stage on microbial community structure and activity in the rhizosphere of three field crops. FEMS Microbiol. Ecol. 65, 193–201. doi: 10.1111/j.1574-6941.2008.00535.x
Igiehon, N. O., and Babalola, O. O. (2018). Rhizosphere microbiome modulators: contributions of nitrogen fixing bacteria towards sustainable agriculture. Int. J. Environ. Res. Public Health 15, 574. doi: 10.3390/ijerph15040574
Ihwan, K., Sudika, I. W., and Jaya, I. K. D. (2019). “Effect of two different planting patterns on performance of four maize varieties under rainfed conditions,” in AIP Conference Proceedings, Vol. 2199 (Lombok: AIP Publishing LLC), 040003.
Inceoglu, Ö., Al-Soud, W. A., Salles, J. F., Semenov, A. V., and Van Elsas, J. D. (2011). Comparative analysis of bacterial communities in a potato field as determined by pyrosequencing. PLoS ONE 6, e23321. doi: 10.1371/journal.pone.0023321
Insam, H., Goberna, M., Kowalchuk, G., De Bruijn, F., Head, I., Akkermans, A., et al. (2004). Use of Biolog® for the community level physiological profiling (CLPP) of environmental samples. Mol. Microb. Ecol. Manual 1, 853–860. doi: 10.1007/978-1-4020-2177-0_401
Jezierska-Tys, S., Wesołowska, S., Gałazka, A., Joniec, J., Bednarz, J., and Cierpiała, R. (2020). Biological activity and functional diversity in soil in different cultivation systems. Int. J. Environ. Sci. Technol. 17, 4189–4204. doi: 10.1007/s13762-020-02762-5
Khan, M. M. H., Rafii, M. Y., Ramlee, S. I., Jusoh, M., and Al-Mamun, M. (2021). Bambara groundnut (Vigna subterranea L. Verdc): A crop for the new millennium, its genetic diversity, and improvements to mitigate future food and nutritional challenges. Sustainability 13, 5530. doi: 10.3390/su13105530
Koner, S., Chen, J. S., Hsu, B. M., Tan, C. W., Fan, C. W., Chen, T. H., et al. (2021). Assessment of carbon substrate catabolism pattern and functional metabolic pathway for microbiota of limestone caves. Microorganisms 9, 1789. doi: 10.3390/microorganisms9081789
Kong, Z., and Liu, H. (2022). Modification of rhizosphere microbial communities: a possible mechanism of plant growth promoting rhizobacteria enhancing plant growth and fitness. Front. Plant Sci. 13, 920813. doi: 10.3389/fpls.2022.920813
Lamb, E. G., Kennedy, N., and Siciliano, S. D. (2011). Effects of plant species richness and evenness on soil microbial community diversity and function. Plant Soil 338, 483–495. doi: 10.1007/s11104-010-0560-6
Lebeis, S. L. (2015). Greater than the sum of their parts: characterizing plant microbiomes at the community-level. Curr. Opin. Plant Biol. 24, 82–86. doi: 10.1016/j.pbi.2015.02.004
Liu, L., Zhu, K., Wurzburger, N., and Zhang, J. (2020). Relationships between plant diversity and soil microbial diversity vary across taxonomic groups and spatial scales. Ecosphere 11, e02999. doi: 10.1002/ecs2.2999
Lupwayi, N., Arshad, M., Rice, W., and Clayton, G. (2001). Bacterial diversity in water-stable aggregates of soils under conventional and zero tillage management. Appl. Soil Ecol. 16, 251–261. doi: 10.1016/S0929-1393(00)00123-2
McNear, D. H. Jr. (2013). The rhizosphere-roots, soil and everything in between. Nat. Educ. Knowledge 4, 1. Available online at: https://www.thcfarmer.com/threads/roots-soil-and-everything-in-between.83844/
Mofokeng, M. M., Habig, J., Amoo, S. O., Du Plooy, C. P., Mashela, P. W., Moeletsi, M. E., et al. (2020). Differences in soil microbial communities and enzyme activity due to the application of bioslurry under cultivation. South Afr. J. Plant Soil 37, 283–291. doi: 10.1080/02571862.2020.1761468
Mohammed, S. M. (2014). Pre-breeding of Bambara groundnut (Vigna subterranea [L.] Verdc.) (Doctoral dissertation). Durban: UKZN. Available online at: https://ukzn-dspace.ukzn.ac.za/handle/10413/10989
Montgomery, D. R., and Biklé, A. (2021). Soil health and nutrient density: beyond organic vs. conventional farming. Front. Sustain. Food Syst. 5, 699147. doi: 10.3389/fsufs.2021.699147
Oberholster, T., Vikram, S., Cowan, D., and Valverde, A. (2018). Key microbial taxa in the rhizosphere of sorghum and sunflower grown in crop rotation. Sci. Total Environ. 624, 530–539. doi: 10.1016/j.scitotenv.2017.12.170
Olanrewaju, O. S., Glick, B. R., and Babalola, O. O. (2017). Mechanisms of action of plant growth promoting bacteria. World J. Microbiol. Biotechnol. 33, 1–16. doi: 10.1007/s11274-017-2364-9
Reese, A. T., Lulow, K., David, L. A., and Wright, J. P. (2018). Plant community and soil conditions individually affect soil microbial community assembly in experimental mesocosms. Ecol. Evol. 8, 1196–1205. doi: 10.1002/ece3.3734
Saeed, Q., Xiukang, W., Haider, F. U., Kučerik, J., Mumtaz, M. Z., Holatko, J., et al. (2021). Rhizosphere bacteria in plant growth promotion, biocontrol, and bioremediation of contaminated sites: a comprehensive review of effects and mechanisms. Int. J. Mol. Sci. 22, 10529. doi: 10.3390/ijms221910529
Singh, B. K., Munro, S., Potts, J. M., and Millard, P. (2007). Influence of grass species and soil type on rhizosphere microbial community structure in grassland soils. Appl. Soil Ecol. 36, 147–155. doi: 10.1016/j.apsoil.2007.01.004
Stefanowicz, A. (2006). The Biolog plates technique as a tool in ecological studies of microbial communities. Polish J. Environ. Stud. 15, 669. Available online at: http://www.pjoes.com/pdf-87919-21778filename=The%20Biolog%20Plates.pdf
Sugiyama, A., Ueda, Y., Zushi, T., Takase, H., and Yazaki, K. (2014). Changes in the bacterial community of soybean rhizospheres during growth in the field. PLoS ONE 9, e100709. doi: 10.1371/journal.pone.0100709
Tan, X. L., Azam-Ali, S., Goh, E. V., Mustafa, M., Chai, H. H., Ho, W. K., et al. (2020). Bambara groundnut: An underutilised leguminous crop for global food security and nutrition. Front. Nutr. 7, 601496. doi: 10.3389/fnut.2020.601496
Thompson, G. L., and Kao-Kniffin, J. (2016). Diversity enhances NPP, N retention, and soil microbial diversity in experimental urban grassland assemblages. PLoS ONE 11, e0155986. doi: 10.1371/journal.pone.0155986
Uroz, S., Buée, M., Murat, C., Frey-Klett, P., and Martin, F. (2010). Pyrosequencing reveals a contrasted bacterial diversity between oak rhizosphere and surrounding soil. Environ. Microbiol. Rep. 2, 281–288. doi: 10.1111/j.1758-2229.2009.00117.x
Van Overbeek, L., and Van Elsas, J. D. (2008). Effects of plant genotype and growth stage on the structure of bacterial communities associated with potato (Solanum tuberosum L.). FEMS Microbiol. Ecol. 64, 283–296. doi: 10.1111/j.1574-6941.2008.00469.x
Wang, G., Jin, J., Chen, X., Liu, J., Liu, X., and Herbert, S. (2007). Biomass and catabolic diversity of microbial communities with long-term restoration, bare fallow and cropping history in Chinese Mollisols. Plant Soil Environ. 53, 177. doi: 10.17221/2313-PSE
Wang, P., Marsh, E. L., Ainsworth, E. A., Leakey, A. D. B., Sheflin, A. M., and Schachtman, D. P. (2017). Shifts in microbial communities in soil, rhizosphere and roots of two major crop systems under elevated CO2 and O3. Sci. Rep. 7, 15019. doi: 10.1038/s41598-017-14936-2
Wang, Y., Jiao, P., Guo, W., Du, D., Hu, Y., Tan, X., et al. (2022). Changes in bulk and rhizosphere soil microbial diversity and composition along an age gradient of chinese fir (Cunninghamia lanceolate) plantations in subtropical China. Front. Microbiol. 12, 777862. doi: 10.3389/fmicb.2021.777862
Wolińska, A., Gałazka, A., Kuzniar, A., Goraj, W., Jastrzebska, N., Grzadziel, J., et al. (2018). Catabolic fingerprinting and diversity of bacteria in mollic gleysol contaminated with petroleum substances. Appl. Sci. 8, 1970. doi: 10.3390/app8101970
Xia, L., Zhao, B. Q., Luo, T., Xu, W., Guo, T., and Xia, D. (2022). Microbial functional diversity in rhizosphere and non-rhizosphere soil of different dominant species in a vegetation concrete slope. Biotechnol. Biotechnol. Equip. 36, 379–388. doi: 10.1080/13102818.2022.2082319
Xiong, C., Singh, B. K., He, J.-Z., Han, Y.-L., Li, P.-P., Wan, L.-H., et al. (2021). Plant developmental stage drives the differentiation in ecological role of the maize microbiome. Microbiome 9, 1–15. doi: 10.1186/s40168-021-01118-6
Yang, Q., Wang, X., and Shen, Y. (2013). Comparison of soil microbial community catabolic diversity between rhizosphere and bulk soil induced by tillage or residue retention. J. Soil Sci. Plant Nutr. 13, 187–199. doi: 10.4067/S0718-95162013005000017
Zhang, B. H., Hong, J. P., Zhang, Q., Jin, D. S., and Gao, C. H. (2020). Contrast in soil microbial metabolic functional diversity to fertilization and crop rotation under rhizosphere and non-rhizosphere in the coal gangue landfill reclamation area of Loess Hills. PLoS ONE 15, e0229341. doi: 10.1371/journal.pone.0229341
Zhang, H., Pang, H., Ao, H., Li, X., Teng, Z., Hu, J., et al. (2016). “Effects of forest degradation on soil microbial communities in Daxing'an mountains,” in Sustainable Development: Proceedings of the 2015 International Conference on Sustainable Development (ICSD2015). World Scientific.
Keywords: bambara groundnut, BIOLOG, carbon source, metabolic profile, growth stages
Citation: Ajilogba CF, Habig J and Babalola OO (2022) Carbon source utilization pattern of soil bacterial microbiome of bambara groundnut rhizosphere at the different growth stages determines soil fertility. Front. Sustain. Food Syst. 6:1012818. doi: 10.3389/fsufs.2022.1012818
Received: 05 August 2022; Accepted: 27 October 2022;
Published: 15 November 2022.
Edited by:
Everlon Cid Rigobelo, São Paulo State University, BrazilReviewed by:
Adre Minnaar-Ontong, University of the Free State, South AfricaXingang Zhou, Northeast Agricultural University, China
Siti Fatimah, Trunojoyo University, Indonesia
Copyright © 2022 Ajilogba, Habig and Babalola. This is an open-access article distributed under the terms of the Creative Commons Attribution License (CC BY). The use, distribution or reproduction in other forums is permitted, provided the original author(s) and the copyright owner(s) are credited and that the original publication in this journal is cited, in accordance with accepted academic practice. No use, distribution or reproduction is permitted which does not comply with these terms.
*Correspondence: Olubukola Oluranti Babalola, b2x1YnVrb2xhLmJhYmFsb2xhQG53dS5hYy56YQ==