 Hedda Martina Šola
 Jasenka Gajdoš Kljusurić
 Ivana Rončević
- 1Division for Consumer Behavior and Neuroscience, Institute for Neuromarketing, Zagreb, Croatia
- 2Centre for Applied Research and Entrepreneurship, Oxford Business College, Oxford, United Kingdom
- 3Department of Process Engineering, Faculty of Food Technology and Biotechnology, University of Zagreb, Zagreb, Croatia
- 4Applied Linguistics Research Lab, Linguistics and Translation Department, Prince Sultan University, Riyadh, Saudi Arabia
Unlike traditional research methods used for investigating consumer responses to different stimuli such as surveys, interviews or focus groups, recently, the autonomic neuropsychological measures have been implemented within the neuromarketing field to obtain subconscious preferences from the consumer's brain. In the current study, the webcam-based eye-tracking technology is used to analyze both visual and emotional reflects of the consumer green purchasing behavior, which has grown notably in the last decade. The main interest was to assess whether the color packaging affects the BIO label and if such a label is essential for consumers' purchasing behavior. The packaging designs of the two well-known products from one of Croatia's most prominent food processing companies were manipulated in packaging color and the BIO label placement. The results have shown that regardless of the package design and the placement of the BIO label, participants elicited higher intensities of negative emotion. The eye-tracking metrics showed that for both products the color of the packaging and the BIO label placement matter.
Introduction
Forecasting consumer purchase behavior is a key challenge marketers face across geographies. The continuous consumer exposure to novel technologies and products has made it progressively problematic to investigate consumer purchase behavior. Similarly, consumers product choices are often driven by reasons of which they themselves are not fully aware (Stasi et al., 2018). Understanding the features that drive consumers toward purchase selections is a perilous part of business planning and retailer prediction (Gil et al., 2017).
The multidisciplinary field of neuromarketing empirically measures and perceives consumers emotional and unprompted responses through the tender of neuroscientific procedures to investigate consumer behavior (Stasi et al., 2018). To gain insights about the part that emotions and values play in economic decision-making developments, neuromarketing research focuses on the fundamental neuro-physical and biological processes that are accountable for our choices and conduct (Plassmann et al., 2012; Kopton and Kenning, 2014). According to researchers, neuroscience reveals concealed data such as feelings, emotions, memories, values and judgments that is unobtainable through orthodox approaches (Babutsidze and Chai, 2018; Lim, 2018), and that neural activity can assist in foreseeing consumer preferences for products (Telpaz et al., 2015).
From a fundamental standpoint, packaging holds, guards and presents the product. However, due to the progression of marketing, this notion has been altered, integrating a variety of supplementary roles, placing packaging as a crucial communicator of a brand or products identity, as well as a tool for marketing due to its role in enticing the attention of consumers (Gómez et al., 2015). The role of packaging in the purchase process has been intensely studied (Kuvykaite, 2009; Estiri et al., 2010) with most studies approving that packaging is imperative principally due to it being the core source of data accessible to the consumer. This is then used to not only hypothesize a perception of the product, but also to appraise its professed worth and brand based on the packaging design (Gómez et al., 2015) and subsequently, impact consumers shopping behavior (Silayoi and Speece, 2004; Clement, 2007; Méndez et al., 2011). Consequently, packaging has become a significant driver for marketers to investigate and comprehend how packaging design influences consumers partiality.
The consumer response to diverse stimuli has been studied for decades with the aim of finding new ways to advance packaging, product development, advertising campaigns or product positioning. Consumer decision making about products is prejudiced by a multifaceted range of emotions, feelings, attitudes and values that may be problematic to measure. Previous research on packaging has emphasized the multifunctionality of packaging (Rundh, 2005, 2013; Simms and Trott, 2010; Sims et al., 2014), whereas other studies have explored how dissimilar fundamentals of packaging (e.g., shape, size, color, images) can affect consumer behavior (Silayoi and Speece, 2004; Ares et al., 2013; Mohebbi, 2014). Traditionally, research investigating consumer response to different stimuli used heterogenous methodology such as surveys, interviews or focus groups on their assessment of various concepts related to these subjects, where consumers themselves intentionally account their stimuli evaluation. However recently, autonomic neurophysiological measures have been unified to obtain unconscious evidence from the consumer's brain. The use of functional magnetic resonance imaging, electroencephalography, facial recognition and eye tracking have since been applied in neuromarketing.
Eye tracking is an instrument for the scrutiny of visual attention which pursues to associate visual attention with the cognitive and emotional responses of consumers. Eye tracking measures where the consumer is watching (gaze or fixation point), the period of time that the consumer has looked at this firm point, the movement of their eyes in relation to their head, pupil dilation and, the quantity of blinks (Zurawicki, 2010). The principal of this procedure is the dependence on a source of light (visible or invisible) that brightens the eye, causing extremely measurable reflections which is taken by a camera (Guestrin and Eizenman, 2006). It is a biometric approach to neuromarketing that generates information on behavioral and cognitive responses deprived of unswervingly measuring brain activity. Understanding the apparatuses that chaperon consumers to select certain points of interest in an image have implications to the business word in that it can offer evidence on what is of greater significance to the contribution of attention in diverse marketing concerns (Fitszman et al., 2013).
Present-day research on consumer behavior deliberates that an assortment of variables impact consumer activities beyond purchasing. Such factors commonly include need recognition, data exploration, assessment of substitutes, the act of purchasing and discarding. The first consumer decision model was developed by Howard (1963), providing a cultured incorporation of the numerous social, psychological and marketing stimuli that impact on consumer choice into a comprehensible arrangement of data processing elements. The theory of buyer behavior is an analytic feature of the cognitive consumer behavior model (Moital, 2007) and the common themes of buyer behavior since its proposition include (a) attention—the scale of the buyers data intake, (b) comprehension—the managed and understood data that is used, (c) attitudes—the purchasers appraisal of a particular brands ability to gratify purchase motives (d) intention—the buyers prediction of which product they will purchase (e) purchase behavior—the actual reflection of the consumers predisposition to buy as adapted by any inhibitors. A review of the buyer behavior theory signifies the intricacy of consumer options and identifies the crucial procedures that underwrite consumer behavior.
Cognitive influence on consumer decision making
Cognition and the influence it has on rational and emotional processes have a history in influencing the buying behavior of an individual. Numerous regions of the prefrontal cortex positioned in the frontal lobe of the brain, play an imperative part in the underlying processes of decision making. Some studies in specific emphasize that both the orbitofrontal cortex and the ventromedial prefrontal cortex are intricated in decision making processes by weighing the supposed worth of various choices and probable results (Tremblay and Schultz, 1999; Daw et al., 2006). Importantly, the orbitofrontal cortex has been linked with the assessment of the anticipated capacity of outcomes in terms of the aptitude to gratify a person's desires (Wallis, 2007), particularly because it holds an important dominant part in selecting suitable behaviors predominantly in volatile circumstances (Elliott et al., 2000). Given its participation in cognitive regulation over emotion and, in playing a role in impulse control, the dorsolateral prefrontal cortex holds a grave position in decision making (Rilling et al., 2008). Cognitive Psychologists have suggested that the emotional responses that originate from these cognitive areas may influence consumer preferences decisions.
The role of emotions on consuming decision making
Cognitive Psychological theories have emphasized the impact of emotions in the rational decision making process. In marketing, consumers are exposed to emotion-inducing advertising for example, in the method of commercials, product packaging and positioning (Lee et al., 2013; Chen et al., 2015). Brand and marketing methodically depict and induce emotions that hearten warranted consumer responses and research linked to consumer behavior have profoundly discovered the impact that cognitive psychology and, play a role in forecasting consumer decision making and the consequences (Bettman and Zins, 1979).
Neuroscientific studies have shown that emotional processes and feelings, which can either be unconscious or conscious, contribute to sentimental feedback loops in both cases (Dolcos and Denkova, 2014; Siddharthan et al., 2018), and that this is momentous to decision making, learning, and problem solving. According to research, emotions also have an influence on attention and therefore act as a key contributor in consumer choice and decision making processes. For example, research by Shiv and Fedorikhin (1999) suggests that consumer decisions are influenced by unprompted unconscious sentimental responses from stimuli that involve little or no cognitive effort. Additionally, research by Reimann et al. (2010) reported that aesthetic packaging activates these sentimental brain areas, positively activating product choice.
The role of packaging design on consumer decision making
Images are recurrently used as effective design apparatuses. They can be illustrative, photographic, or on some occasions, come in the form of icons or symbols (Klimchuk and Krasovec, 2013). A high-level review of research suggests that images tend to have greater influencing effects on the assessment of a product than other elements such as size (Klimchuk and Krasovec, 2013), and, that they have a more robust impact on consumers emotional responses (Larsen and Grunert, 2003). Furthermore, researchers have also suggested that packaging containing pictures act as an essential cue in positively influencing a series of consumer responses including attitudes toward the package, as well as beliefs about sensory brand characteristics.
Another important packaging component is color which is habitually used to transport diverse messages such as price quality, gender and age (Klimchuk and Krasovec, 2013) to the consumer. For example, researchers have established that black is regularly connected with luxury and green to organic and ecological products (Klimchuk and Krasovec, 2013). Correspondingly, Goldberg et al. (1999) observed that when color contemplation was prioritized in product development, the attention of consumers amplified. Likewise, research has also shown that colors also aid in assigning packaging differentiation and thus, have the authority to gain the attention of the consumer (Klimchuk and Krasovec, 2013). Moreover, colors have historically been found to impact and scientifically narrate to consumers emotional responses (Gao and Xin, 2006). These researchers established for example, that high wavelength colors (e.g., yellow, red and orange) are more exhilarating and stimulating than colors of lower wavelengths (e.g., blue and green), and have thereby been observed to induce more elevated moods.
Visual stimuli in consumer buying behavior theory
Literature on consumer buying behavior discusses multifaceted processes comprising internal and external variables that together impact decision making. A product package also has a visual appeal that can be attractive or unattractive to customers and a high-level review of the evidence suggests that stimuli from graphic features employ an effect on exploration strategy and response time and, that an exclusive packaging tactic can be a prevailing benefit in capturing attention and driving consumer purchases (Clement, 2007). This concept has been thoroughly investigated and researched. One example comes from a study which suggested consumer behavior to be a range of physical, emotional and mental actions, in which they are involved with selecting, procuring or using products to please their longing (Cherubino et al., 2019). This concept has been mirrored by further studies which accentuate the importance of producing packaging that create optimistic assessments after purchase rather than those which only increase consumer attention.
Bio products and consumer purchase behavior
In recent years, research on consumer green purchasing behavior has grown notably, attracting curiosity from researchers and practitioners (Prothero et al., 2011). This concentration on the consumer has been considered supreme, since they are driving the expansion of the green product market due to their knowledge, well-being apprehensions and buying volume (Kautish et al., 2019). It has been suggested that in this instance, consumer confidence in product integrity is of critical standing, particularly if the feature demands a price premium as is the case for organic food or sustainably packed goods.
Endres and Siebert-Raths (2011) outline bio-based packaging as biodegradable or non-biodegradable materials used to package a product which are obtained from renewable raw materials. Such packaging can be fashioned from diverse natural materials such as sugar cane, starch, cellulose or plant oil (Barker and Safford, 2009). As bio-based packaging comes from renewable and sustainable materials the dependence on non-renewable materials can be condensed, and, depending upon the crop type, how the crop is refined, the manufacture of bio-based plastic could also possibly lessen the CO2-emissions associated with production (Álvarez-Chávez et al., 2012). One study on green purchasing behavior found that worries regarding the deterioration of the natural atmosphere (e.g., through climate alteration and waste production) are progressively transforming consumer buying behavior to green goods as alternatives to more orthodox goods (Zaremohzzabieh et al., 2020). A supporting study conducted among 18–75-year-old consumers in Ireland and the Netherlands found that consumers in both countries had comparatively optimistic viewpoints about bio-based or packed products (Gaffey et al., 2021). In this study, Irish consumers showed a significantly added optimistic outlook and preference for purchasing bio based or packaged products when compared to packaging made from other less environmentally friendly packaging or fossil-based products.
According to researchers, the consumer drive to purchase more green products has been guided by (a) the environmental impact of manufacture and consumption (Ertz et al., 2016), (b) the simulation of noticeable green behavior (Babutsidze and Chai, 2018), (c) the perceived need to modify behaviors to positively affect the environment (Vita et al., 2019), (d) personal consumer values, green self-identity and ethical motivations (Barbarossa et al., 2017). Understanding the drive of consumer behavior and preparedness to purchase has been studied by Zwicker et al. (2020) who reported that feelings of guilt toward environmental issues was associated with a higher inclination to procure bio-packaged products. Interestingly, research on the role of personal consumer value on purchasing behavior of bio-packed products found that exceedingly indecisive consumers are inclined to being more sensitive to the potential risks of bio-packaged products than less uncertain consumers (Onwezen et al., 2017).
While prior researches have revealed variables that might impact consumer purchasing decisions with respect to bio-labeled products, to the best of our knowledge, no prior studies have provided biometric evidence using eye tracking equipment to investigate physiological responses to bio-labeled packaging. Similarly, there is also limited evidence regarding consumer preferences for bio-labeled packaging and while several studies have investigated the price premium that consumers were willing to pay for bio-packaged products, or their attraction toward bio-packaged products, most of these studies have focused on organic foods. In this study, we aim to observe whether bio-label affects decision making processes and, if the color of the bio-packaging is important. Understanding the influence of the consumers subconscious on the decision making process for the purchase of products with bio-labels is crucial, such that the evidence gained may assist designers and marketers in providing consumers with products that are essentially desired.
Materials and methods
Materials
Images of the two well-known products from one of the biggest food processing companies in Croatia, Podravka, were used. The first product was the mashed tomato—Passata (original packaging of mashed tomato under the name “Podravka Passata, Istarska rajčica”), while the other was the mix of spices—Vegeta (Vegeta Original). Vegeta is used in cooking and it ranks first in terms of volume sales in the category of dehydrated food additives within 31 European countries1.
Both of these products have the bio line (light brown color packaging with a prominent bio label; Vegeta Bio and BIO passata). In addition to the original bio packaging images (Figures 1A, 2A), two additional images were used in the study for each product. One image showed the actual color of the bio packaging but without the bio label (Figures 1B, 2B). In contrast, in the case of Vegeta, the other image consisted of the bio label and manipulated packaging color (Figure 2C), while in the case of Passata, the other image consisted of manipulated packaging color without the bio label (Figure 1C). In both cases, the manipulated color (blue) resembled the packaging color from the non-bio line. The color manipulation was done to assess whether the packaging color is crucial for consumers when deciding to purchase products with BIO label.
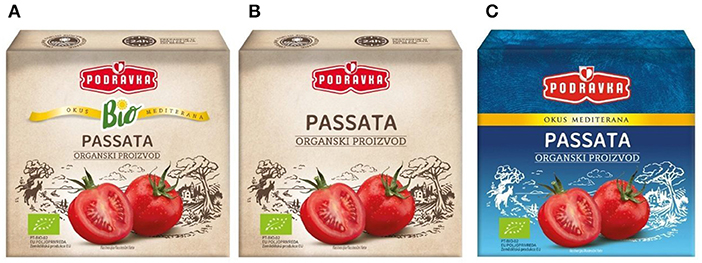
Figure 1. Passata in original BIO packaging, sold in stores (A), original color combination but without the BIO label, not sold in stores (B), and manipulated color combination, not sold in stores (C). Images copyright protected by Podravka. All manipulations with color and color inversions on products were made by Podravka exclusively for the purposes of this research.
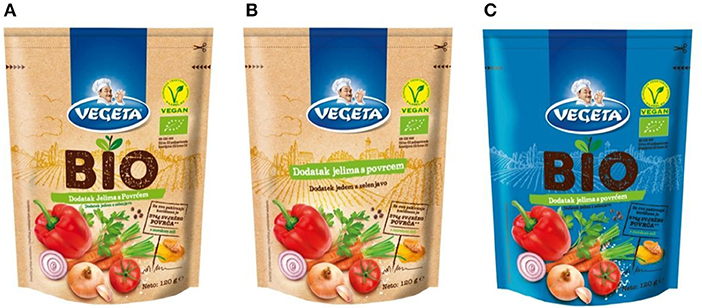
Figure 2. Vegeta in original BIO packaging, sold in stores (A), original color combination but without the BIO label, not sold in stores (B), and manipulated color combination, not sold in stores (C). Images copyright protected by Podravka. All manipulations with color and color inversions on products were made by Podravka exclusively for the purposes of this research.
The online platform for advanced quantitative neuromarketing research, “Tobii Sticky,” was utilized for webcam-based eye tracking (15 Hz) and facial coding to assess visual behavior and emotional reaction to the different product designs. Based on previous testing's, Sticky's average gaze error in a real-world environment is 1.6 to 1.8 degrees, equivalent to ~5% of the screen width and 7% of the screen height on a computer, which suffices this type of neuromarketing research for obtaining a robust outcome. Participants were given calibration instructions to ensure that the technical requirements were met before data collection. Since the study was conducted outside a controlled laboratory environment, there was no physical control over the ISO eye tracking standards. Hence, only recordings marked as “usable” in Tobii Sticky were used as they suggest that these participants met the technical requirements (i.e., proper lightning, controlled movement) entirely. At the end of the experiment, participants were also asked to answer questions assessing the likelihood of purchasing the product with the BIO label, the importance of the BIO label when deciding on what to purchase, and whether the color of the packaging and its design plays a role in their decision-making process (Table 4).
Methods
Participants
One hundred and sixty-eight participants from Croatia (18–65, both gender) were involved in the testing. Eighty seven participants completed the entire experiment from which we get 33 usable recordings whose gaze and/or emotion was trackable during their session (i.e., had proper lighting and did not move). Fifty four participants partially were involved in study (participants who started the experiment but closed the browser or had timed out before reaching the end), 1 participant was excluded from study and 26 where screen out (participants that ended their session based on a screen out question or did not meet technical requirements). To ensure that the desired level of power and significant results are achieved, the required sample size was calculated a priori using G*Power (Faul et al., 2007). Based on the G*Power output, a sample size of n = 84 was required to detect the effect with a power of 80% and a two-sided significance level of 5% (Supplementary Figure S1).
Tested subjects were recruited from the database of Podravka customers who regularly buy their products, as well as from the database of students of the Faculty of Food Technology and Biotechnology (students with a master's degree in nutrition) in the Republic of Croatia. The age range of participants varied from 18 to 65 years. More than 60 percent of participants were 36–55, while the others were 18–35 years old. The majority of the participants were either entirely or partially responsible for procuring groceries in their households, while 3 participants were not.
Participation in the study was voluntary, and no incentives were given.
Following the European Code of Ethics for Research, all participants were informed about the study and gave their written, informed consent in digital form before taking part in the study. Otherwise, they were no able to participate. Participants' data were treated according to standard practice and compliance with GDPR. The Ethics Committee of the Institute for Neuromarketing approved this research and supervised the study in order to be underlined with local and international ethical guidelines which are officially published at the official Institute's website.
Statistical power analysis program G*Power (version 3.1.9.7) was used for the calculation of the sample size (Faul et al., 2009) by use of the one-way analysis of variance (ANOVA) and fixed effects, using the F-test. Selected parameters used for the recall results were as follows: an average effect size f = 0.4; alpha (α) error probability = 0.05; power (1-β) = 0.95 for two groups. The calculation, based on the input parameters, required 84 subjects, but to avoid any losses (as failures in recording, not finishing the task), a minimum of 150 subjects was defined as the total sample, which resulting in a representative pool of 87 respondents who fully completed the survey.
General procedure
An “HTML” link was distributed to all participants. Only participants with access to computer devices with a working webcam were able to participate. We have limited participants to access from computer devices only, to avoid possible distractions (fuzzy environment, lack of concentration, more had movements, low lighting conditions, etc.), when they are exposed to different design which often happens with mobile device testing. The task started with a 5-point-eye-tracker calibration which is a standard procedure when using eye-tracking device. Afterwards, participants were given instructions to assume that they were currently in the store and that they would like to buy Passata/Vegeta. To inspect the item better, they would take that item from the shelf and during the inspection, they would decide whether they would buy it or not, given that the price is not an issue. Then, they were shown three different images per product category. To control for the order effect, the order of the images was counterbalanced across participants for both products, and each image was displayed for 5 s, during which webcam-based eye-tracking measured participants' gaze behavior and emotional expression. Participants were also instructed to skip any product image with the mouse click at any time. On this was of doing was able to capture the overall interest of participants during the experiment. After each image, participants were given four statements to rate assessing their conscious preferences and opinions about the seen packaging. They had 10 s to do that. The total duration of the study was 3 min and 22 s.
Statistical analyses
The obtained raw data were processed with Tobii Sticky software. Eye movement data for each visual stimulus were categorized into three areas of interest (AOIs): the whole packaging design, the BIO label, and the EU organic logo area. The BIO label and EU organic logo areas were selected given the main research aim of investigating the impact of bio-label on decision-making behavior and both need to be displayed on the BIO packaging.
The three AOIs were used in the statistical analyses as a within-subjects factor. The indicators of visual attention were eye-tracking metrics, including dwell time (average amount of time in seconds participants spent looking at a specific AOI), time to first fixation (TTFF) (average amount of time in seconds participants needed to notice specific AOI from the stimulus onset), and the number of fixations. Statistical analyses of tests of within-subject effects were performed with IBM SPSS for eye-tracking metrics of attention for both products to analyze the difference in the visual attention between the three different package designs. In addition, the eye tracking qualitative data was used to assess what participants do not see at all on the packaging. This was a great asset what we can provide with this testing as the traditional marketing testing methods cannot capture subliminal activity.
To investigate the relationship between the results collected by the questionnaire and the neuromarketing approach, multivariate approach, by use of partial least squares (PLS) regression was conducted. The efficiency of the input/output variables was quantified with the regression coefficients (Rc). The multivariate analysis was carried out in the program XLSTAT Version 2014.5.03.
Results
A color gradient overlay visualization (heat map) was used to show the general distribution of gaze points (where the eyes were looking at) and to inspect which packaging design elements attract attention the most.
A higher number of gaze points are illustrated in red, while green color indicates lower number of gaze points directed to specific parts of the packaging design. As indicated in Figure 3, participants spent most of the time looking at the BIO label area regardless of the packaging design. At the same time, the EU organic logo was barely (Figures 3A,B) or not at all noticed (Figure 3C). The same pattern was also observed for Passata (Figure 4).
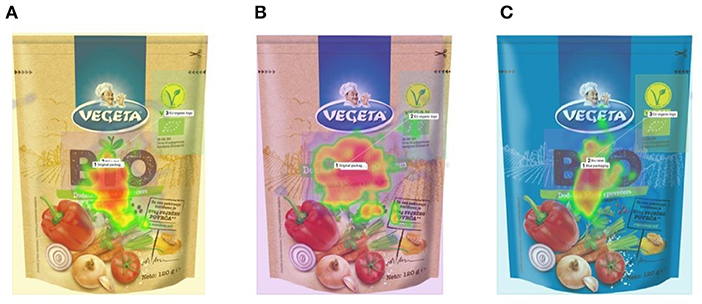
Figure 3. Attention results based on the heat map for Vegeta original packaging with BIO label (A), original packaging without the BIO label (B), and manipulated blue packaging (C).
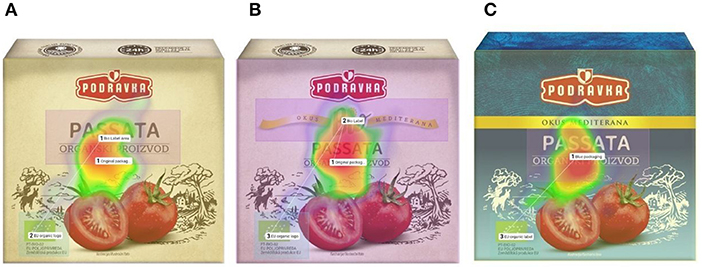
Figure 4. Attention results based on the heat map for Passata original packaging with BIO label (A), original packaging without the BIO label (B), and manipulated blue packaging (C).
Vegeta
Color manipulation
A test of within-subject effects was conducted to inspect any differences in visual attention within the AOIs if the packaging colors were changed. In the case of Vegeta, the ANOVA results showed that there was not a significant difference in the dwell time between the original packaging with the BIO label and color-manipulated blue packaging [F(1,32) = 1.70, p = 0.20]. No significant difference in the dwell time was also not found between the BIO label area at the original packaging with the BIO label and the BIO label area from the blue packaging [F(1,32) = 3.86, p = 0.06] nor between the EU organic logo area from the original packaging with the BIO label and the EU organic logo area from the blue packaging [F(1,32) = 0.68, p = 0.42] was found (Table 1). The EU organic logo is located on the upper right part of the packaging.
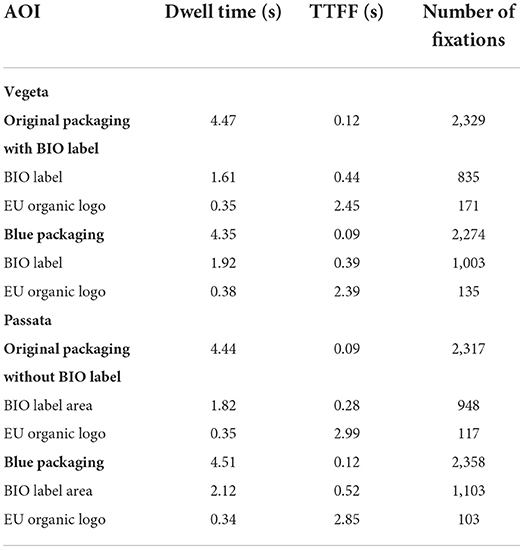
Table 1. Eye-tracking metrics assessing visual attention during color manipulation for both products.
The same results pattern was found when it comes to the visual saliency of both packaging designs. No significant difference in the time to first fixation was found between the original packaging with the BIO label and the blue packaging [F(1,32) = 1.05, p = 0.31]. Moreover, no significant statistical difference was found between the BIO label area of the original packaging with the BIO label and the BIO label area of the blue packaging [F(1,32) = 0.68, p = 0.42], nor between the EU organic logo area from the original packaging with the BIO label and EU organic logo area from the blue packaging [F(1,32) = 1.54, p = 0.22]. A statistical comparison of the number of fixations revealed no significant difference between the original packaging with the BIO label and blue packaging [F(1,32) = 1.40, p = 0.25], nor between the EU organic logo areas of the two packaging options [F(1,32) = 0.80, p = 0.38]. However, a significant statistical difference was found in the number of fixations for the BIO label areas [F(1,32) = 4.00, p = 0.05]. The BIO label area of the blue packaging had a significantly higher number of fixations when compared to the BIO label area from the original packaging with the BIO label.
Bio-label manipulation
The obtained results (Table 2) reveal no significant statistical difference in the dwell time between the original packaging with the BIO label and the original packaging without the BIO label [F(1,32) = 0.33, p = 0.57], nor between the EU organic logo areas of the two designs [F(1,32) = 0.83, p = 0.37]. When it comes to the BIO label areas, participants spent significantly more time looking at the BIO label area on the original packaging without the BIO label than on the packaging with the BIO label [F(1,32) = 29.36, p = 0.00]. The assessment of visual saliency has shown no significant statistical difference in time to first fixation between the original packaging with the BIO label and original packaging without the BIO label [F(1,32) = 1.20, p = 0.28], nor between the BIO label areas of two packages [F(1,32) = 1.29, p = 0.26] or the EU organic logo areas of two packages [F(1,32) = 0.20, p = 0.66]. Furthermore, no significant statistical difference was found in the number of fixations between the original BIO packaging with the BIO label and without the BIO label [F(1,32) = 0.34, p = 0.56], nor in the EU organic logo areas of the two package designs [F(1,32) = 0.72, p = 0.40]. However, significantly more fixations were directed toward the BIO label area of the original packaging without the BIO label than at the same area of the original packaging with the BIO label [F(1,32) = 30.38, p = 0.00].
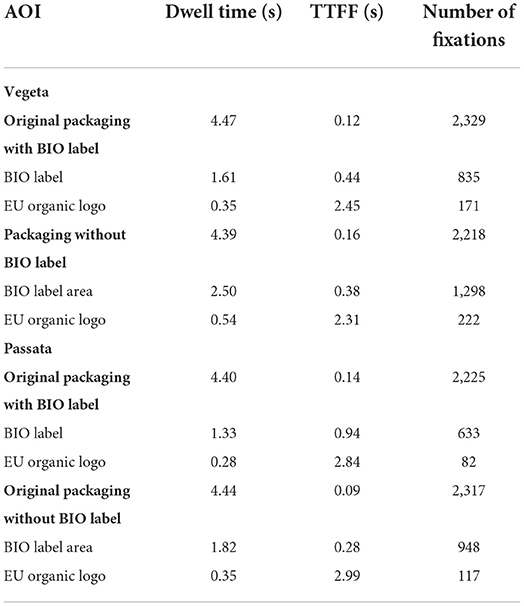
Table 2. Eye-tracking metrics assessing visual attention during bio-label manipulation for both products.
Passata
Color manipulation
When assessing the difference in visual attention for the manipulated color packaging for Passata, no significant statistical difference in dwell time was found between the original packaging without the BIO label and the blue packaging [F(1,32) = 2.08, p = 0.16] nor between the EU organic logo areas for the two packaging options [F(1,32) = 1.16, p = 0.29]. Furthermore, no significant statistical difference in dwell time was found for the BIO label areas [F(1,32) = 3.83, p = 0.06] (Table 1). The comparison of time to first fixation parameter showed no significant statistical difference between the two packaging options [F(1,32) = 0.27, p = 0.61] nor between the EU organic logo areas for both packages [F(1,32) = 0.31, p = 0.59]. However, the BIO label area from the original packaging without the BIO label was visually more salient since the participants required less time to notice it than the BIO label area from the blue packaging [F(1,32) = 6.22, p = 0.02]. No significant statistical difference was observed for the number of fixations between the original packaging without the BIO label and blue packaging [F(1,32) = 2.44, p = 0.13], nor between the EU organic logo areas of the two package designs [F(1,32) = 0.80, p = 0.38]. On the other hand, a significantly higher number of fixations was observed for the BIO label area on the blue packaging than on the original packaging without the BIO label [F(1,32) = 5.07, p = 0.03].
Bio-label manipulation
No significant statistical difference was observed in dwell time between the original packaging with the bio label and original packaging without the bio label [F(1,32) = 0.13, p = 0.72] nor between the EU organic logo areas between the two package designs [F(1,32) = 1.23, p = 0.28]. However, a statistical difference was found between the BIO label areas [F(1,32) = 6.01, p = 0.02], where participants spent more time looking at the BIO label area on the original packaging without the BIO label than on the original packaging with the BIO label. A similar pattern was observed for the time to first fixation. No significant statistical difference was found in time to first fixation between the original packaging with the BIO label and original packaging without the bio label [F(1,32) = 0.91, p = 0.35] nor between the EU organic logo areas for the two packaging designs [F(1,32) = 0.32, p = 0.58]. In contrast, a significant statistical difference was found in TTFF for the BIO label areas [F(1,32) = 17.03, p = 0.00]. Participants noticed the BIO label area faster on the original packaging design without the BIO label than on the original packaging with the BIO label. No significant difference in the number of fixations was observed between the original packaging with the BIO label and the original packaging without the BIO label [F(1,32) = 0.14, p = 0.71] or between the EU organic logo areas of the two package designs [F(1,32) = 1.27, p = 0.27]. A significant statistical difference in the number of fixations was found for the BIO label areas [F(1,32) = 5.97, p = 0.02]. Participants had more fixations at the BIO label area on the original packaging without the BIO label than on the original packaging with the BIO label (Table 2).
Emotional response for all product packaging options (with and without BIO labels)
The facial coding data for Vegeta reveals that regardless of the packaging design, participants mostly elicited higher levels of neutral emotion (original packaging with the BIO label −35.1%, original packaging without the BIO label −36%, blue packaging −35.1%) and sadness (original packaging with the BIO label −29.3%, original packaging without the BIO label −33.2%, blue packaging −34%). Even though they were puzzled the most with the original packaging with the BIO label (10.6%), for the same packaging design, they showed a slightly higher level of joy (3.4%) when compared to other packaging designs (original packaging without the BIO label −2.6%, blue packaging −3.2%).
Another essential metric of emotion analysis is valence associated with the visual stimulus. Emotional valence is a measure of emotional responses indicating the relative hedonic evaluation, ranging from positive to neutral and negative emotions. This covers the spectrum from strong negative fear responses to extreme positive experience of euphoria (Ramsøy, 2015). As with arousal, valence is one-dimensional and can only point to the direction (-from positive to negative of an emotion). What does it not tell us is the amplitude of emotion, and that's why we have conducted the probability of elicted emotion when looking at Vegeta (Figure 5). A value between −1 and +1 describes the intensity of elicited emotion. Positive values are associated with pleasantness and attractiveness while negative values suggest aversiveness and unpleasantness. Regarding Vegeta, Figure 6 suggests that the intensity of negative emotion increased with time for blue packaging (−0.348 to −0.381) and original packaging without the BIO label (−0.366 to −0.376). In contrast, the opposite pattern is observed for the original packaging with the BIO label. In this case, the intensity of negative emotion decreased with time (−0.363 to −0.327).
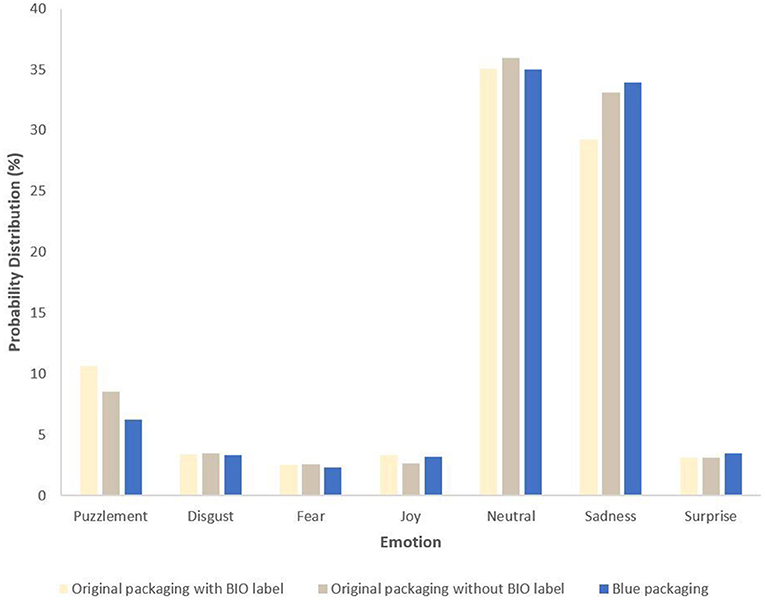
Figure 5. Probability of elicited emotion when looking at Vegeta.
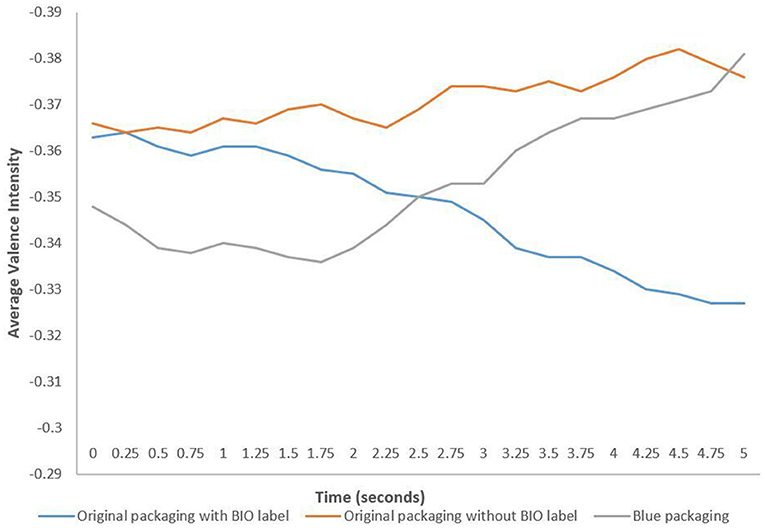
Figure 6. Average emotional valence intensity when looking at Vegeta.
In the case of Passata, participants showed a similar pattern to the one of Vegeta (Figure 7). The facial coding data showed that participants generally elicited higher neutral emotion (original packaging with the BIO label −31.3%, original packaging without the BIO label −31.5%, blue packaging −32.1%) and sadness levels (original packaging with the BIO label −33.2%, original packaging without the BIO label −32.7%, blue packaging −34.8%), regardless of the packaging design.
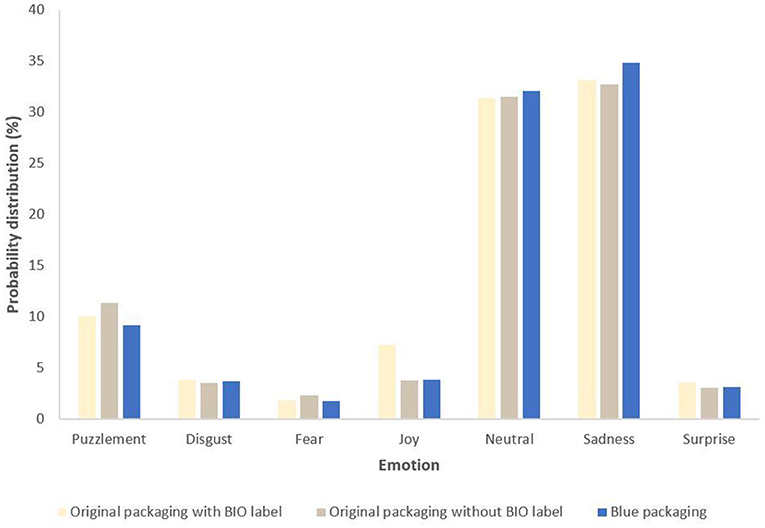
Figure 7. Probability of elicited emotion when looking at Passata.
The average valence intensity metric, on the other hand, showed that for all of the packaging designs, participants elicited higher intensities of negative emotion (Figure 8). However, regarding the original packaging with the BIO label, a slight drop in the intensity of negative emotion occurred after the 2 s of watching that product (from −0.353 to −0.311). At that moment, a deeper inspection of the gaze plot and heat map recordings showed that participants were looking at the area around the BIO label and the product name.
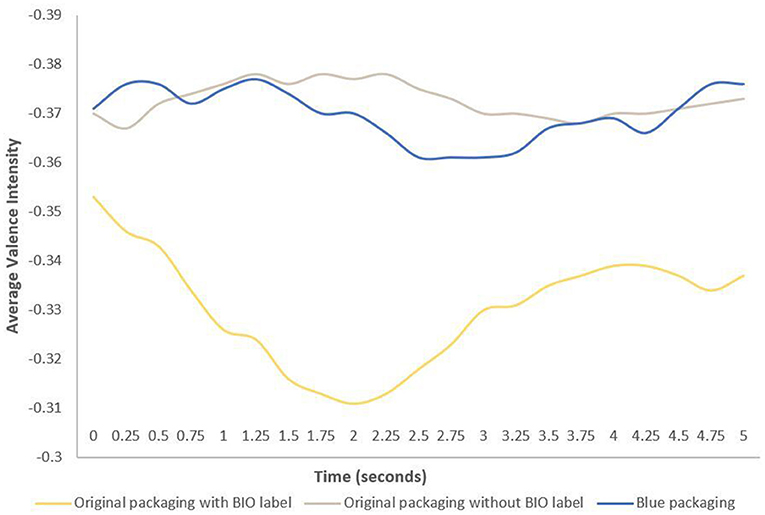
Figure 8. Average emotional valence intensity when looking at Passata.
Cognitive testing
In addition to the subconscious eye-tracking measurements, a cognitive testing was conducted to learn about the conscious preferences of the participants and to be sure of the validity of the results. In the case of Vegeta, a relatively high percentage of participants for all the package designs said that they are visually appealing; however small percentage of people would buy them or consider that they are for someone like them (Table 3). On the other hand, in the case of Passata, a relatively low percentage of participants said that package designs are visually appealing, but still, a higher percentage would buy those products (Table 3).
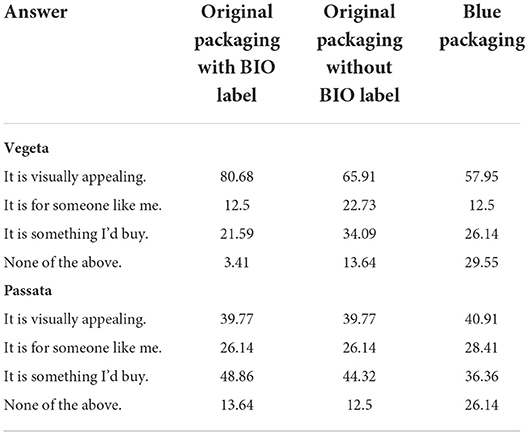
Table 3. Participants answers in percentage (%) to the question “What of the following applies to the product you just saw?”
The survey assessment of the participants' conscious preferences revealed that color of the packaging and the visual appearance of the product are one of the key reasons for buying the product (Table 4). On the other hand, for 48.9% of participants, the BIO/ECO label is somewhat important on the product packaging, while 31.8% claim such label is neither important nor unimportant. The majority of the participants periodically buy products with BIO/ECO labels (53.4%), while 2.3% always and 1.1% never.
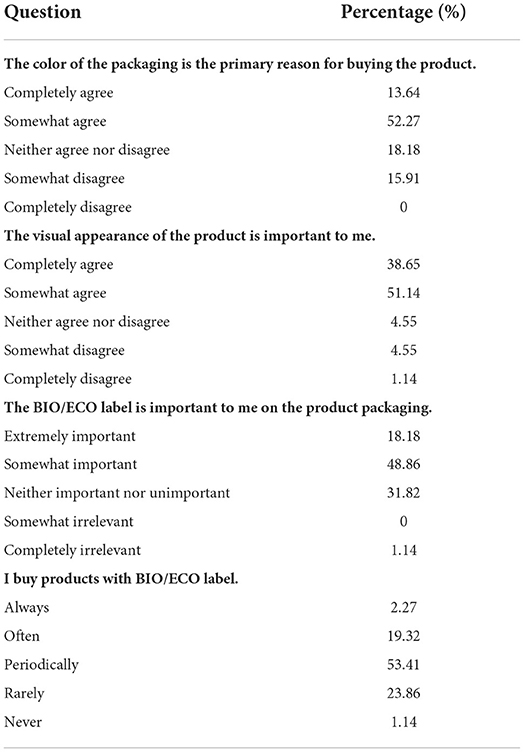
Table 4. Participants answers in percentage to the survey questions assessing conscious preferences.
In order to examine the relationship of the emotional response and the results of cognitive testing, multivariate tool, rather the partial least squares (PLS) regression, was performed. The data of emotional response (Puzzlement; Disgust; Fear; Joy; Neutral; Sadness and Surprise) were used as input data set, while the monitored cognitive parameters (It is visually appealing; It is for someone like me; It is something I'd buy and None of the above) were set as output parameters. All data (regardless of the product; Passata or Vegeta) were used as a data matrix on which PLS analysis was performed. Regression models has a linear form:
Where;
yi—represents the four observed cognitive parameters (i = 1, …,4);
i = 1: It is visually appealing
i = 2: It is for someone like me
i = 3: It is something I'd buy
i = 4: None of the above.
All model parameters (ai to gi) are presented in Table 5.
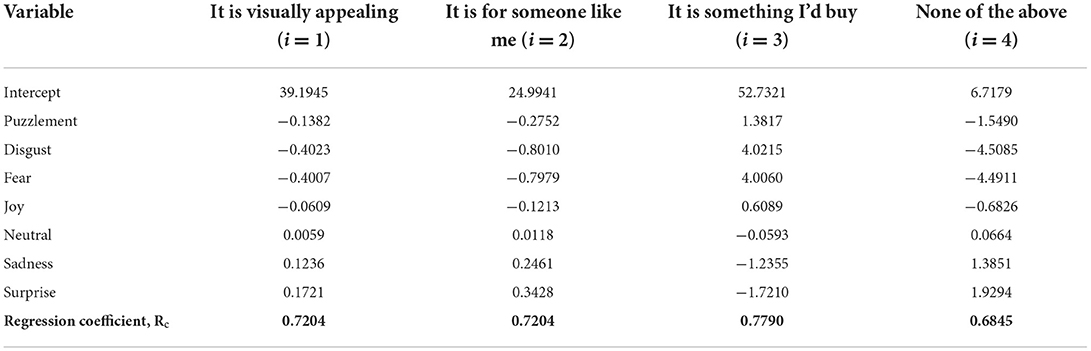
Table 5. Model parameters with the corresponding regression coefficient (Rc).
From the analyses of input variables are presented with their standard coefficients and the 95% confidence interval (Supplementary Figure S2), low impact is evident for the variable “Neutral” and the PLS analysis was conducted also without this input parameter and the Regression coefficient (Rc) increased for approximately 0.65 % (Supplementary Table S1).
Discussion
To the best of our knowledge, this is the first study using remote eye tracking measurements to assess the underlying physiological responses of BIO-labeled products on the consumer purchasing decisions. The aim of the current study was to observe whether BIO label affects decision making processes, and if the color of the BIO packaging is important with the help of online webcam-based eye-tracking and facial coding. The eye-tracking results from both tested products reveal that the color of the packaging and the BIO label placement matter. Namely, in the case of Vegeta, the higher number of fixations and the longer dwell time at the BIO label on the blue packaging indicates that such higher levels of visual attention are associated with processing difficulty which can be explained with the color of the packaging. Vegeta Original is a well-known product which consumers for decades associate with the blue color and without the additional labeling such as BIO. A similar pattern was also observed for Passata. The shorter time to first fixation to the BIO label area on the original packaging without the BIO label than to the same area on the blue packaging suggests that such area was visually more salient since the consumers were used to seeing such article on the store shelfs in blue color. On the other hand, a higher number of fixations and longer dwell time at the BIO label area on the blue packaging indicate that such higher levels of visual attention are again associated with processing difficulty, as it was the case with Vegeta.
When it comes to the BIO label placement on the packaging, in the case of Vegeta, longer dwell time and the higher number of fixations directed to the BIO label area on the original packaging without the BIO label suggests again that such packaging was confusing for the consumers as the BIO label area was different than expected. The same pattern was also observed for the Passata. More visual attention was directed toward the original packaging without the BIO label which was the direct result of lower processing fluency. In addition, the emotional analysis via facial coding has also revealed that regardless of the packaging design for both products, a higher intensity of negative emotion was present when looking at the products. However, in the case of Vegeta, the intensity of negative emotion decreased with time for the original packaging with the BIO label and in the case of Passata, a slight drop in the intensity of negative emotion occurred after the 2 s of watching the original packaging with the BIO label. At that moment, a deeper inspection of the gaze plot and heat map recording showed that participants were looking at the area around the BIO label and the product name. Taken together, these results indicate that the BIO label is essential part of the BIO packaging and should be visually highlighted on the packaging. Moreover, the color of the BIO packaging is important parameter and should reflect the earthy-color tones. Even the survey assessment of consumers' conscious preferences revealed that the color of the packaging and the visual appearance of the product are one of the key reasons for buying the product. However, a discrepancy between the survey answers and neuromarketing testing was observed. Almost half of consumers claimed that the BIO/ECO label is somewhat important on the product packaging but they all failed to notice the EU organic logo on products.
The results of the current study serve not only to designers and marketers in creating the products that are subconsciously desired on the market, but as well as the evidence how traditional marketing approaches focused on surveys and group discussions fail to show the full-picture. On the other hand, utilizing neuromarketing methods such as eye tracking and facial coding can yield valuable insights of consumer behavior. Despite the use of online research with the webcam-based eye tracking solution (15 Hz), the obtained results are the example of how very accurate and useful marketing insights of the consumers subconscious on the decision making process and preferences can be obtained. Limitation of the study was the big screen out (26 subjects) where we presume this is due to the reason what participants did not receive any incentives for attending to this research. In addition, the software used is highly sensitive and discredits the participant at a slight shift of the head, which gives us a merit results at the very end. Since the research was limited to the computer device to achieve the best results possible, the total sample size needed to be increased which resulted in obtaining a better percentage of quality recordings.
Based on the regression coefficients that reflect the quantitative measure of the importance of the relationship inseparable from the qualitative characteristics of the relationship being studied, there is a clear strong connection between the results collected by the questionnaire and the neuromarketing approach.
Data availability statement
The original contributions presented in the study are included in the article/Supplementary material, further inquiries can be directed to the corresponding author/s.
Ethics statement
The studies involving human participants were reviewed and approved by Following the European Code of Ethics for Research, all participants were informed about the study and gave their written, informed consent in digital form before taking part in the study. Otherwise, they were no table to participate. Participants' data were treated according to standard practice and compliance with GDPR. The Ethics Committee of the Institute for Neuromarketing approved this research and supervised the study in order to be underlined with local and international ethical guidelines which are officially published at the official Institute's website. The participants provided their written informed consent to participate in this study.
Author contributions
HMŠ: conceptualization, study propose, supervision, experimental and written methodology development, data analysis, and writing and reviewing. IR: written methodology development and writing and reviewing. JGK: application of statistical, math methods, and writing and reviewing. All authors contributed to the article finalization, review, and approved the submitted version.
Funding
The authors would like to acknowledge the support of Prince Sultan University for paying the Article Processing Charges (APC) for this publication and Institute for Neuromarketing for covering all neuromarketing research costs.
Acknowledgments
The authors would like to acknowledge the support of Mr. Sc. Lenkica Penava, dipl.ing. on behalf of Belupo d.d. and Sunčana Grüngold on behalf of Podravka for providing the consent to publish the findings. This study was done in collaboration with the Institute for Neuromarketing, Zagreb, Croatia, which supported the research with neuromarketing equipment and data analysis. The research was conducted exclusively for the development and scientific advancement.
Conflict of interest
The authors declare that the research was conducted in the absence of any commercial or financial relationships that could be construed as a potential conflict of interest.
Publisher's note
All claims expressed in this article are solely those of the authors and do not necessarily represent those of their affiliated organizations, or those of the publisher, the editors and the reviewers. Any product that may be evaluated in this article, or claim that may be made by its manufacturer, is not guaranteed or endorsed by the publisher.
Supplementary material
The Supplementary Material for this article can be found online at: https://www.frontiersin.org/articles/10.3389/fsufs.2022.1002521/full#supplementary-material
Footnotes
1. ^This statement is based on Nielsen's panel data from trade in 31 European countries (Austria, Belarus, Belgium, Bosnia and Herzegovina, Bulgaria, the Czech Republic, Denmark, Estonia, France, Greece, Croatia, Ireland, Italy, Latvia, Lithuania, the Netherlands, Norway, Germany, Hungary, Poland, Portugal, Romania, Russia, Northern Macedonia, Slovakia, Slovenia, Serbia, Spain, Sweden, Switzerland, and Ukraine), according to which Vegeta is the leading brand in terms of volume sales in the category dehydrated (dry) food additives in the period October 2020–September 2021 (copyright © 2021, The Nielsen Company, all rights reserved). “Link: https://www.vegeta.hr/hr/aktualnosti/vegeta-najprodavaniji~-dehydrated-food-supplement-in-europe.”
References
Álvarez-Chávez, C. R., Edwards, S., Moure-Eraso, R., and Geiser, K. (2012). Sustainability of bio-based plastics: general comparative analysis and recommendations for improvement. J. Cleaner Prod. 23, 47–56. doi: 10.1016/j.jclepro.2011.10.003
Ares, G., Giménez, A., Bruzzone, F., and Vidal, L. (2013). Consumer visual processing of food labels: results from an eye-tracking study. J. Sens. Stud. 28, 138–153. doi: 10.1111/joss.12031
Babutsidze, Z., and Chai, A. (2018). Look at me saving the planet! The imitation of visible green behavior and its impact on the climate value-action gap. Ecol. Econ. 146, 290–303. doi: 10.1016/j.ecolecon.2017.10.017
Barbarossa, C., Pelsmacker, P. D., and Moons, I. (2017). Personal values, green self-identity and electric car adoption. Ecol. Econ. 140, 190–200. doi: 10.1016/j.ecolecon.2017.05.015
Barker, M., and Safford, R. (2009). Industrial Uses for Crops: Markets for Bioplastics. http://archive.hgca.com/publications/documents/Bioplastics_web28409.pdf (accessed May 1, 2022).
Bettman, J. R., and Zins, M. (1979). Information format and choice task effects in consumer decision making. J. Consum. Res. 6, 141–153.
Chen, C. Y., Mathur, P., and Maheswaran, D. (2015). The effects of country-related affect on product evaluation. J. Con. Res. 41, 1033–1046. doi: 10.1086/678194
Cherubino, P., Martinez-Levy, A. C., Carat,ù, M., Cartocci, G., Di Flumeri, G., Modica, E., et al. (2019). Consumer behaviour through the eyes of neurophysiological measures: state-of-the-art and future trends. Comput. Intell. Neurosci. 18, 1976847. doi: 10.1155/2019/1976847
Clement, J. (2007). Visual influence on in-store buying decisions: an eye-track experiment on the visual influence of packaging design. J. Mark. Manag. 23, 917–928. doi: 10.1362/026725707X250395
Daw, N. D., O'Doherty, J. P., Dayan, P., Seymour, B., and Dolan, R. J. (2006). Cortical substrates for exploratory decisions in humans. Nature 441, 876–879. doi: 10.1038/nature04766
Dolcos, F., and Denkova, E. (2014). Current emotion research in cognitive neuroscience: linking enhancing and impairing effects of emotion on cognition. Emot. Rev. 6, 362–375. doi: 10.1177/1754073914536449
Elliott, R., Dolan, R. J., and Frith, C. D. (2000). Dissociable functions in the medial and lateral orbitofrontal cortex: evidence from human neuroimaging studies. Cerebral Cortex 10, 308–317. doi: 10.1093/cercor/10.3.308
Elliott, S. N., Kratochwill, T. R., Littlefield-Cook, J., and Travers, J. (2000). Educational Psychology: Effective Teaching, Effective Learning, 3rd Edn. Boston, MA: McGraw-Hill College.
Endres, H. J., and Siebert-Raths, A. (2011). Manufacture and Chemical Structure of Biopolymers, Engineering Biopolymers: Markets, Manufacturing, Properties and Applications. Munich: Hanser, 71–148.
Ertz, M., Karakas, F., and Sarigöllü, E. (2016). Exploring proenvironmental behaviors of consumers: an analysis of contextual factors, attitude, and behaviors. J. Bus Res. 69, 3971–3980. doi: 10.1016/j.jbusres.2016.06.010
Estiri, M., Hasangholipour, T., Yazdani, H. R., Njad, H. J., and Rayej, H. (2010). Food products consumer behaviors: the role of packaging elements. J Appl. Sci. 10, 535–543. doi: 10.3923/jas.2010.535.543
Faul, F., Erdfelder, E., Buchner, A., and Lang, A.-G. (2009). Statistical power analyses using G*Power 3.1: tests for correlation and regression analyses. Behav. Res. Methods 41, 1149–1160. doi: 10.3758/BRM.41.4.1149
Fitszman, B. P., Giboreau, A., and Spence, C. (2013). Assessing the influence of the color of the plate on the perception of a complex food in a restaurant setting. Flavour 2, 24. doi: 10.1186/2044-7248-2-24
Gaffey, J., Mcmahon, H., Marsh, E., and Vehmas, K. (2021). Understanding consumer perspectives of bio-based products- a comparative case study from Ireland and the Netherlands. Sustainability 13, 6062. doi: 10.3390/su13116062
Gao, X. P., and Xin, J. H. (2006). Investigation of human's emotional responses on colors. Color Res. Appl. 31, 411–417. doi: 10.1002/col.20246
Gil, R., Rebollar, I., Lidón, J., and Martín, J. (2017). Study on the Influence of Fresh White Cheese Packaging Design Variables on Users' Perception. Cham: Springer, 37–49.
Goldberg, M. E., Liefield, J., Madill, J., and Vredenburg, H. (1999). The effect of plain packaging on response to health warnings. Am. J. Public Health 89, 1434–1435. doi: 10.2105/AJPH.89.9.1434
Gómez, M., Martín-Consuegra, G., and Molina, A. (2015). The importance of packaging in purchase and usage behaviour. Int. J. Consum. Stud. 39, 203–211. doi: 10.1111/ijcs.12168
Guestrin, E. D., and Eizenman, M. (2006). General theory of remote gaze estimation using the pupil center and corneal reflections. IEEE Trans. Biomed. Eng. 53, 1124–1133. doi: 10.1109/TBME.2005.863952
Kautish, P., Paul, J., and Sharma, R. (2019). The moderating influence of environmental consciousness and recycling intentions on green purchase behavior. J. Clean. Prod. 228, 1425–1436. doi: 10.1016/j.jclepro.2019.04.389
Klimchuk, M. R., and Krasovec, S. A. (2013). Packaging Design: Successful Product Branding From Concept to Shelf . New York. NY: John Wiley and Sons.
Kopton, I. M., and Kenning, P. (2014). Near-infrared spectroscopy (NIRS) as a new tool for neuroeconomic research. Front. Human Neurosci. 8, 5–10. doi: 10.3389/fnhum.2014.00549
Kuvykaite, R. (2009). Impact of package elements on consumers purchase decision. Econ. Manag. 14, 441–447. doi: 10.5755/J01.EM.0.14.9405
Larsen, T. B., and Grunert, K. G. (2003). The perceived healthiness of functional foods: a conjoint study of Danish, Finnish and American consumers' perception of functional foods. Appetite 40, 1–14. doi: 10.1016/S0195-6663(02)00171-X
Lee, C. J., Andrade, E. B., and Palmer, S. E. (2013). Interpersonal relationships and preferences for mood-congruency in aesthetic experience. J. Cons. Res. 40, 382–390. doi: 10.1086/670609
Lim, W. M. (2018). Demystifying neuromarketing, J Bus. Res. 91, 205–220, doi: 10.1016/j.jbusres.2018.05.036
Méndez, J. L., Oubiña, J., and Rubio, N. (2011). The relative importance of brand-packaging, price and taste in affecting brand preferences. Br. Food J. 113, 1229–1251. doi: 10.1108/00070701111177665
Mohebbi, B. (2014). The art of packaging: an investigation into the role of color in packaging, marketing, and branding. Int. J. Organ. Leadersh. 3, 92–102. doi: 10.33844/ijol.2014.60248
Moital, M. L. (2007). An Evaluation of the Factors Influencing the Adoption of Ecommerce in the Purchasing of Leisure Travel by the Residents of Cascais. Libon, Portugal: Bournemouth University.
Onwezen, M. C., Reinders, M. J., and Sijtsema, S. J. (2017). Understanding intentions to purchase bio-based products: the role of subjective ambivalence. J. Environ. Psychol. 52, 26–36. doi: 10.1016/j.jenvp.2017.05.001
Plassmann, H., Ramsøy, T. Z., and Milosavljevic, M. (2012). Branding the brain: a critical review and outlook. J. Consum. Psychol. 22, 18–36. doi: 10.1016/j.jcps.2011.11.010
Prothero, A., Dobscha, S., Freund, J., William, E., Luchs, M. G., and Ozanne, L. K. (2011). Sustainable Consumption: Opportunities for Consumer Research and Public Policy. J. Public Policy Mark. 30, 31–38.
Ramsøy, T. Z. (2015). Introduction to Neuromarketing and Consumer Neuroscience, 1st Edn. Denmark: Neurons Inc, 108–109.
Reimann, M., Zaichkowsky, J., Neuhaus, C., Bender, T., and Weber, B. (2010). Aesthetic package design: a behavioral, neural, and psychological investigation. J. Consum. Psychol. 20, 431–441. doi: 10.1016/j.jcps.2010.06.009
Rilling, J. K., King-Casas, B., and Sanfey, A. G. (2008). The neurobiology of social decision-making. Curr. Opin. Neurobiol. 18, 159–165. doi: 10.1016/j.conb.2008.06.003
Rundh, B. (2005). The multi-faceted dimension of packaging: marketing logistic or marketing tool? Br. Food J. 107, 670–684. doi: 10.1108/00070700510615053
Rundh, B. (2013). Linking packaging to marketing: how packaging is influencing the marketing strategy. Br. Food J. 115, 1547–1563. doi: 10.1108/BFJ-12-2011-0297
Shiv, B., and Fedorikhin, A. (1999). Heart and mind in conflict: the interplay of affect and cognition in consumer decision making. J. Consum. Res. 26, 278–292. doi: 10.1086/209563
Siddharthan, A., Cherbuin, N., Eslinger, P. J., Kozlowska, K., Murphy, N. A., and Lowe, L. (2018). WordNet-feelings: a linguistic categorisation of human feeling, 1–22. arXiv:1811.02435.
Silayoi, P., and Speece, M. (2004). Packaging and purchase decisions: an exploratory study on the impact of involvement level and time pressure. Brit. Food J. 106, 607–628. doi: 10.1108/00070700410553602
Simms, C., and Trott, P. (2009). Conceptualizing the management of packaging within new product development: a grounded investigation in the UK fast moving consumer goods industry. Eur. J. Market. 48, 2009–2032. doi: 10.1108/EJM-12-2012-0733
Simms, C., and Trott, P. (2010). Packaging development: a conceptual framework for identifying new product opportunities. Mark. Theory 10, 397–415. doi: 10.1177/1470593110382826
Sims, M , Salway, R, Langley, T, Lewis, S, McNeill, A, and Szatkowski, L.. (2014). Effectiveness of tobacco control television advertising in changing tobacco use in England: a population-based cross-sectional study. Addiction. 109, 986–94.
Stasi, A., Songa, G., Mauri, M., Ciceri, A., Diotallevi, F., Nardone, G., et al. (2018). Neuromarketing empirical approaches and food choice: a systematic review. Food Res. Int. 108, 650–664. doi: 10.1016/j.foodres.2017.11.049
Telpaz, A., Webb, R., and Levy, D. J. (2015). Using eeg to predict consumers' future choices. J. Mark. Res. 52, 511–529. doi: 10.1509/jmr.13.0564
Tremblay, L., and Schultz, W. (1999). Relative reward preference in primate orbitofrontal cortex. Nature 398, 704–708. doi: 10.1038/19525
Vita, G., Lundström, J. R., Hertwich, E. G., Quist, J., Ivanova, D., Stadler, K., et al. (2019). The environmental impact of green consumption and sufficiency lifestyles scenarios in Europe: connecting local visions to global consequences. Ecol. Econ. 164, 106322. doi: 10.1016/j.ecolecon.2019.05.002
Wallis, J. D. (2007). Orbitofrontal cortex and its contribution to decision-making. Annu. Rev. Neurosci. 30, 31–56. doi: 10.1146/annurev.neuro.30.051606.094334
Zaremohzzabieh, Z., Ismail, N., Ahrari, S., and Abu Samah, A. (2020). The effects of consumer attitude on green purchase intention: a meta-analytic path analysis. J. Bus. Res. 132,732–743. doi: 10.1016/j.jbusres.2020.10.053
Keywords: food packaging design, eye-tracking, neuromarketing, decision-making, bio-production of hydrogen
Citation: Šola HM, Gajdoš Kljusurić J and Rončević I (2022) The impact of bio-label on the decision-making behavior. Front. Sustain. Food Syst. 6:1002521. doi: 10.3389/fsufs.2022.1002521
Received: 25 July 2022; Accepted: 15 August 2022;
Published: 01 September 2022.
Edited by:
B. N. Dar, Islamic University of Science and Technology, IndiaReviewed by:
Patrizia Cherubino, Sapienza University of Rome, ItalySyed Anwar, University of Dhaka, Bangladesh
Copyright © 2022 Šola, Gajdoš Kljusurić and Rončević. This is an open-access article distributed under the terms of the Creative Commons Attribution License (CC BY). The use, distribution or reproduction in other forums is permitted, provided the original author(s) and the copyright owner(s) are credited and that the original publication in this journal is cited, in accordance with accepted academic practice. No use, distribution or reproduction is permitted which does not comply with these terms.
*Correspondence: Hedda Martina Šola, aGVkZGFtYXJ0aW5hLnNvbGFAbmV1cm9tYXJrZXRpbmdpbnN0aXR1dC5jb20=