 Rusyan Jill Mamiit
 John Yanagida
 Tomoaki Miura
- Department of Natural Resources and Environmental Management, College of Tropical Agriculture and Human Resources, University of Hawaii at Manoa, Honolulu, HI, United States
Rice is the most important staple food in the Philippines as it provides almost half of the calorie requirements of the population. The domestic supply of rice, however, is inadequate to meet local demand, making the Philippines one of the top five rice-importing countries in the world. To close the domestic supply-and-demand gap, agricultural planners and policymakers in the Philippines have been promoting interventions to increase farm-level productivity. In support of the government efforts to increase rice productivity, a stochastic frontier analysis combined with an optimized spatial hot spot analysis was conducted to determine the factors that may influence the increase in rice farm efficiency and also identify candidate areas for relevant geographic-specific rice production interventions. Results show that enhancing access to irrigation and farm inputs and increasing the producers' technical capacity can help address the local supply deficiency by potentially increasing yield per hectare to as high as 5.50 metric tons per hectare. The approach to potentially increase rice farm technical efficiency and productivity must consider the spatial nature of rice production as suggested by the findings from the optimized hot spot analysis. It is important that policy interventions consider areas with a high incidence of low levels of productivity and technical efficiency. These are the locations where agricultural planners and policymakers can make greater impacts on rice yields. Relevant policies and initiatives, therefore, should take into account the geographical location of farms to ensure the greatest contribution to attaining food production targets.
Introduction
Rice is an important staple to the Philippines and a food constant to millions of Filipinos. Meals in the Philippines will not be complete without some form of rice on the table. Across the Philippines, about one-third of the country's alienable and disposable lands cultivates rice (Navata and Turingan, 2013). Because of its importance, rice has become the most socially, culturally, economically, and politically sensitive commodity in the Philippines, and ensuring adequate, stable, and affordable supply is paramount.
For the above reasons, the government launched various programs with the main objective to attain rice self-sufficiency. The programs, however, fell short and the Philippines continue to import rice to meet domestic demand. Dawe (2006) argued that the Philippines is a rice importer mainly because of geography. As an island nation with less arable land per capita and varying landscape compared to its regional neighbors such as Thailand and Viet Nam, the Philippines has limited land endowments and expansive river deltas, which make it challenging for the country to compete with the rice exporting countries in Southeast Asia.
Being consistent with historical paths in agriculture—the era of expansion, the age of productivity, and the emerging epoch of connectivity—the Philippines has been pursuing rice self-sufficiency, with limited success. Despite more than doubling the per hectare rice production between 1987 and 2019, local supply has not been able to keep up with local demand, making the Philippines a net importer of rice since 1995. In 2018, the Philippines had a rice self-sufficiency ratio (i.e., the proportion of domestic food produced to the total food consumed locally) of about 86%, the lowest since 2013 (Simeon, 2019). Bruinsma (2009) estimated that only a 20% increase in production may come from land expansion, and increased productivity can generate the remaining 80%. Therefore, if the Philippines is serious about attaining rice self-sufficiency, stimulating an upward shift in the production function by increasing efficiency levels is crucial.
Because improvements in farmer agricultural efficiency enable producing more given the same resource constraints, in this paper, we seek to examine the economic geography of rice yields and technical efficiency levels of farmers in Central Luzon, Philippines, as well as the factors that influence the variation in these levels. To complement the technical efficiency assessment and to provide better guidance to decision makers, we evaluate how the distribution of productivity and inefficiency estimates can help design policy that addresses the specific geographical production needs of rice farmers. With these objectives, we organized the paper with the second and third sections describing the data and analytical approach. The fourth section presents the key findings of the analysis, and the final section concludes the paper, recognizing the key results as well as their implications for domestic food production policy and decision making.
Data and Analytical Approach
To estimate the technical efficiency levels of rice farmers and to illustrate how geoeconomic information can help identify priority initiatives to achieve food production targets, we collected cross-sectional data from rice farming villages in the provinces of Nueva Ecija and Tarlac in Central Luzon, Philippines. Using an objective-oriented structured questionnaire, the household survey elicited sociodemographic, farm production, and geoeconomic data for 2013 dry (December to May) and wet (June to November) seasons. The data collected allowed us to assess the geographic distribution of rice productivity and technical efficiency across the provinces.
Study Area
Central Luzon is the largest rice-producing region in the Philippines. There are 12 cities and 118 municipalities from the seven provinces of Central Luzon, namely, Aurora, Bataan, Bulacan, Nueva Ecija, Pampanga, Tarlac, and Zambales (Lugos, 2009; DENR, 2014). Of these provinces, the Philippine Rice Research Institute (PhilRice) ranked Nueva Ecija, Tarlac, Bulacan, Pampanga, Aurora as five of the country's major rice-producing provinces based on average rice harvest area (Bordey and Malasa, (n.d.)).
To determine the specific study sites, we followed the approach that Mamiit et al. (2020) employed by considering the rice harvest areas at the provincial, municipal, and village levels. With the approach, we selected the municipalities of Guimba in Nueva Ecija and Tarlac City in Tarlac. The Barangay Agricultural Profiling Survey (BAPS) shows that out of the 32 municipalities in Nueva Ecija, 8% of the province's rice area and 10% of rice farmers are in Guimba (BAS, 2012). In comparison to 17 other municipalities, Tarlac City accounts for 13% of the total provincial rice farmers and 11% of the rice area. These two municipalities also have a wide representation of different farm sizes as well as a diversity of irrigation sources.
Guimba is about 153 kilometers northwest of Manila, with a land area of 25,853 hectares. There are 64 villages in Guimba lying on relatively flat areas with slopes of 0–3% and elevation of 0 to 500 m above sea level. More than 90% of the villages in Guimba are rural farming villages, with rice as the main crop. From the 2010 census, 104,894 people reside in Guimba (National Statistics Office, 2010; Municipality of Guimba, 2012).
The city of Tarlac is the provincial capital, with a land area of 27,466 hectares, and has a population of 318,332 according to the 2010 census (National Statistics Office, 2010). The city is approximately 110 kilometers north of Manila. Although categorized as an urban municipality, about 46% of Tarlac City's 76 villages have a rural classification (National Statistics Office, 2010). These rural villages are still very agricultural, with rice and sugarcane as the main products.
Farming Households
In choosing the sample villages, we adopted the right coverage approach described in Mamiit et al. (2020). Through random selection, that was contingent on the proportional zonal distribution of the villages as well as the number of rice farming households in the northeast, southeast, southwest, and northwest regions of the two municipalities, we collected information from 471 rice farming households−301 in Guimba and 170 in Tarlac City. We determined from the collected data that 294 (Guimba) and 150 (Tarlac City) rice farm households constituted valid household data. These data from 27 sample villages: 18 from Guimba (Agcano, Balingog East, Banitan, Bantug, Caballero, Caingin Tabing Ilog, Catimon, Cawayan Bugtong, Macatcatuit, Manacsac, Nagpandayan, San Bernardino, Santa Cruz, Subol, and Tampac I, II, and III) and 9 from Tarlac City (Armenia, Atioc, Balibago II, Banaba, Care, De La Paz, Sapanag Maragul, Tibag, and Tibagan).
In all villages, males are the dominant head of households, with an average age of 54 years in Guimba and 51 years in Tarlac City. Most of the male farmers attained 8 years of formal schooling, which is equivalent to 2 years of high school education. In terms of rice farming experience, farmers in Guimba have (on average) 4 additional years of farming practice compared to 28 years of farming experience for Tarlac City farmers. A typical rice farming household of five members in Guimba generates about USD 1,000 more in annual income from rice production than similar households in Tarlac City.
Agricultural land accounts for more than 90% of total landholding for most farmers in the two municipalities, who are small-scale producers with an average rice landholding of <2 hectares per household. The largest rice parcels in Guimba and Tarlac range from 1 to 1.35 hectares. With modest-sized rice land parcels, farmers in Guimba produced 6.76 metric tons of rice per hectare during the 2013 dry season and 4.63 metric tons per hectare in the wet season. For Tarlac, rice farms produced 3.85 and 2.96 metric tons of rice per hectare during the dry and wet seasons, respectively.
Stochastic Production Frontier Analysis
Globally, there are different methodologies proposed to measure productivity and efficiency in terms of yield and inputs used (Kumbhakar and Lovell, 2003; Coelli et al., 2005; Bravo-Ureta et al., 2007; Iliyasu et al., 2014; Ogundari, 2014). One technique is the stochastic frontier analysis (SFA), which Aigner et al. (1977) and Meeusen and van den Broeck (1977) simultaneously yet independently developed. As described in Mamiit et al. (2020), this study also adopted an output-oriented stochastic production frontier model [Eq. (1)] with an exponential distribution assumption following a maximum likelihood framework to estimate technical efficiency. This implies that with ui measuring the output shortfall from its maximum possible value given by the stochastic frontier, this study employs the estimation that Jondrow et al. (1982) suggested in determining the level of producer-specific inefficiency.
The variable yi denotes the potential output of a production unit i, Xj is the inputs or resources used to produce yi, and βj is the parameter for estimation. This model assumes that production data are subject to some form of measurement errors, statistical noise, and random shocks that are beyond the control of the producer, such as weather, natural disasters, and political instability. The variable vi captures the presence of the measurement errors and noise in the data, which follows the identical, independent, and normal distribution assumption, . The random variable ui, which is independent of vi and exponentially distributed, ui~ξ(σu), refers to the technical inefficiency of the producer (Belotti et al., 2012).
In the SFA, we used the Cobb-Douglas production function following Bhanumurthy (2002), who revisited the applicability of the Cobb-Douglas production function in stochastic frontier analysis and found it to be an appropriate specification in its handling of multiple inputs, market imperfections and simultaneity. Bhanumurthy (2002) further noted that the Cobb-Douglas production function exhibits explicit uniformity, parsimony, and flexibility. As explained in Mamiit et al. (2020), this study performed the likelihood-ratio (LR) test as well as the Akaike and Bayesian information criteria (AIC and BIC) to determine that the Cobb-Douglas production function is the most suitable functional form for all the study sites.
The analysis specified Cobb-Douglas stochastic production frontier functions for the dry and wet cropping seasons [Eqs. (2) and (3)], where captures the farm-specific technical inefficiency in production. The terms δi and ωi respectively denote parameters to be estimated and unobservable random variables assumed to be independently distributed. Table 1 presents the descriptive statistics of the production and inefficiency variables. Given that the expression of the aforementioned Xjvariables is in different units, we transformed Eqs. (2) and (3) into the logarithmic form for the dry and wet seasons,
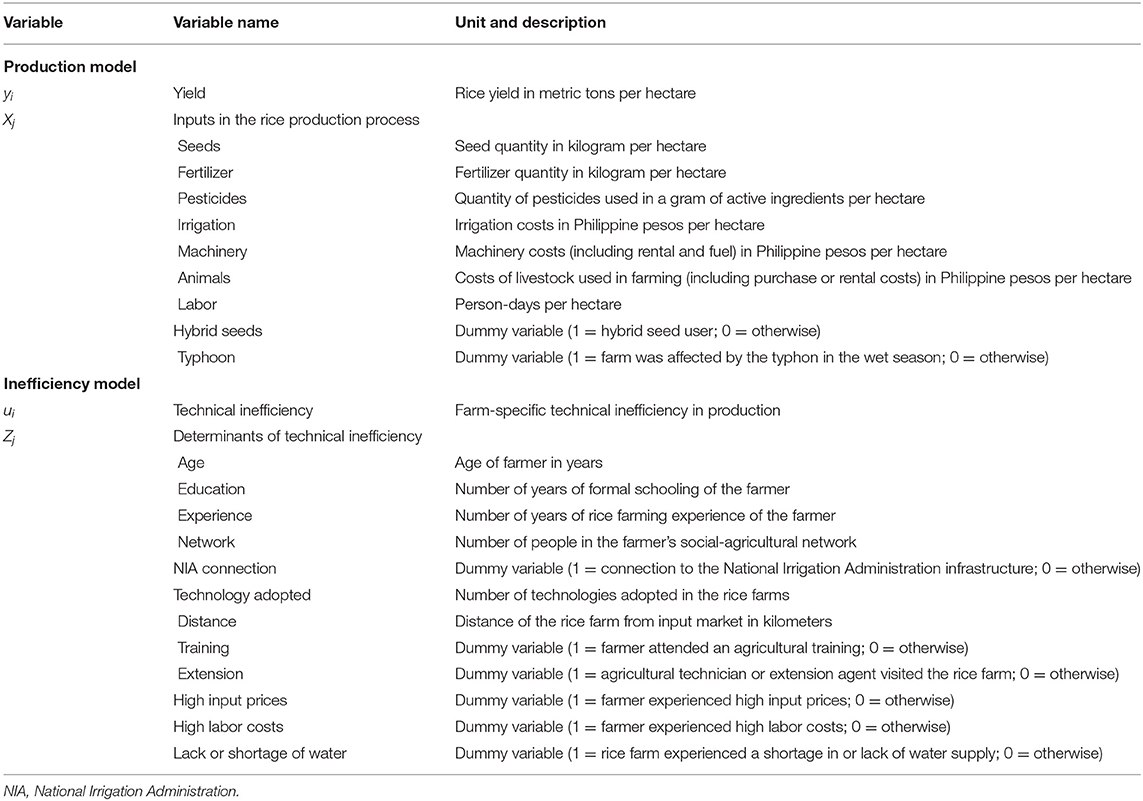
Table 1. Description of the variables in the production and technical efficiency models.
Optimized Hot Spot Analysis
The notion of how location factors influence agricultural production has its roots from agricultural location theory that started with the classical work of von Thunen (1826). Under the limiting assumptions that (1) land is uniformly fertile, (2) there is only a single population cluster in its center, (3) factors of production are available at a given location with prices that linearly increase with distance from input markets, and (4) fixed agricultural product price and demand for all products are the norms, von Thunen (1826) argued that for farmers to maximize profit, the location of the farms must be at a strategic distance from the market center. With these conditions and at certain distances, the clustering of profit-maximizing farmers is likely to occur.
Cognizant that rice production is a dynamic process that takes place in areas with varying fertility levels, soil types, and production resource endowments such as water, this study contends that productive, efficient, and even inefficient farms cluster in areas considered as hot spot or cold spot locations for high or low yields or technical efficiency levels. Following the complementarity argument made by Porter (1990, 1998, 2000) on industrial clustering that the performance of a firm in a cluster affects the performance of the other cluster members, this study assumes that increased productivity at the farm level would be similar to that of the agglomerated industries. Transmission of information, as well as access to specialized inputs and labor, is presumably more fluid in neighboring farms or dwellings than those distant from one another.
Areal and Pede (2021) demonstrated that failing to account for commonly overlooked spatial heterogeneity aspects of farm production influences farm efficiency estimates and ranking. In Bohol, Philippines, Aida (2018) used a spatial panel econometric model to assess how farm-level pesticide use affects neighboring farms pesticide utilization. The study found that pesticide use depends not on the intensity of infestation but on the behavior of neighboring farms. In the same region, Pede et al. (2018) investigated spatial dependency in the technical efficiency estimates and determined a decrease in technical inefficiency when the analysis considers spatial effects.
To complement the results from the stochastic production frontier analysis and to provide better guidance to policymakers, we carried out the optimized hot spot (OHS) analysis. OHS analysis is a spatial statistics tool available from ArcGIS 10.2. It is a tool that can help delineate areas having a high incidence of data points representing specific ranges of productivity and efficiency estimates. The focus of this analysis is the assessment of the presence or absence of a range of estimates in a geographical area rather than measured attributes associated with each observation. OHS is a suitable tool for the production and technical efficiency estimates since they are incident point data.
As described in ArcGIS 10.2, the OHS analysis is a tool that uses the Getis-Ord Gi* statistic [Eq. (4)] to estimate the associated Z-score for each feature. A high Z-score indicates a higher potential of being part of the hot spot areas. To aggregate the Z-scores, OHS applies the average and the median nearest-neighbor calculations given incremental distances between observations as estimated using the incremental spatial autocorrelation tool. In the Getis-Ord Gi* statistic, xjis the attribute value for the feature under consideration for observation j, wi, j represents the spatial weights between observations, n is the total number of observations, X is equal to , and S is equivalent to .
To determine spatial weights representing spatial relationships between observations and amongst attributes of interest (Anselin, 1988; Getis and Aldstadt, 2004; Getis, 2009), we used the geo-referenced data—latitude and longitude of farm and dwelling coordinates—collected during the field survey and adopted a row-standardized inverse distance spatial weights matrix. Row standardization means that we divided each weight by the row sum of the weights given a certain distance band. As noted by Getis and Aldstadt (2004), row standardization is helpful in weighting observations equally. This selection of the matrix form is mainly in support of the hypothesis that productivity and efficiency at the farm level decrease with distance from the best-performing producers.
The focus of the OHS analysis for yield estimates is the identification of hot spot locations and warm spot zones to identify areas with enhanced productivity and at the same time determine the cold spots, the sites that may need support to enhance productivity. Cold spot locations refer to sites with a high incidence of low production. Warm spot areas are zones exhibiting a mix of high and low values of yield per hectare.
In terms of the technical efficiency levels, cold spot zones are areas where there is an agglomeration of high inefficiency levels. Hot spot areas, on the other hand, are the sites where there is clustering of farms with high technical efficiency estimates. Areas with mixed levels of high inefficiency and efficiency are the warm spot locations.
Results and Discussion
The following sections describe the empirical results of the stochastic production frontier analysis. Specifically, we present the estimation of yield and technical efficiency levels for the study sites and identify the hot spot areas for production and levels of technical efficiency in Tarlac and Guimba in the dry and wet seasons. These sections also further investigate the geographic effects of farm and dwelling locations on the productivity and technical efficiency of rice farms and present findings from the OHS analysis.
Productivity and Efficiency
We interpreted the estimated coefficients of inputs measured in physical units from the stochastic Cobb-Douglas production frontier as output elasticities. By using Stata 14.0 software and the one-step maximum likelihood approach as proposed in Wang and Schmidt (2002), findings show that in Guimba, a 10% increase in machinery expenditure resulted in yield per hectare increasing by 1% during the dry season and by 0.80% in the wet season, ceteris paribus (Table 2). Liu (2006) noted that the one-step procedure reduces bias and provides more consistent estimates as compared with the two-step process where one estimates the frontier model first, followed by the estimation of a linear regression of the inefficiency term as a function of a set of explanatory variables. Bias results from the lack of consistency in the assumptions about the distribution of the inefficiency term, which leads to misspecification of the model in the two-step procedure.
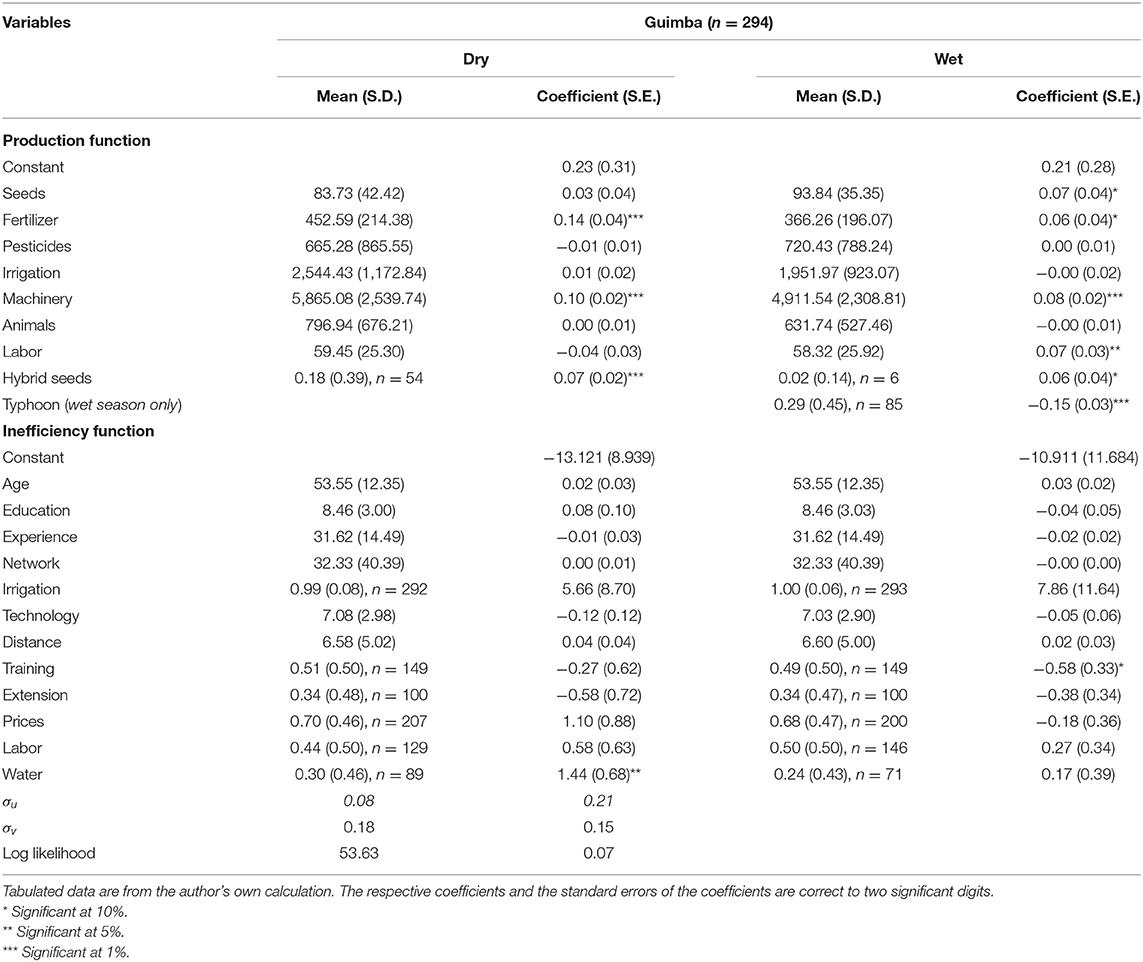
Table 2. Mean statistics and maximum likelihood estimates of the stochastic production and technical inefficiency models in Guimba.
For the same level of increase in machinery expenditure at 10%, per hectare production in Tarlac increased by 3.70% and 3.80%, respectively, in the dry and wet seasons (Table 3). Other than machinery, the use of fertilizer and hybrid seeds were statistically significant, with positive coefficients, for both the dry and wet cropping seasons in Guimba, implying that an increase in the use of fertilizer and farms using hybrid seeds generated an increase in production. On average, farmers in Guimba used almost 200 kg more fertilizer than farmers in Tarlac.
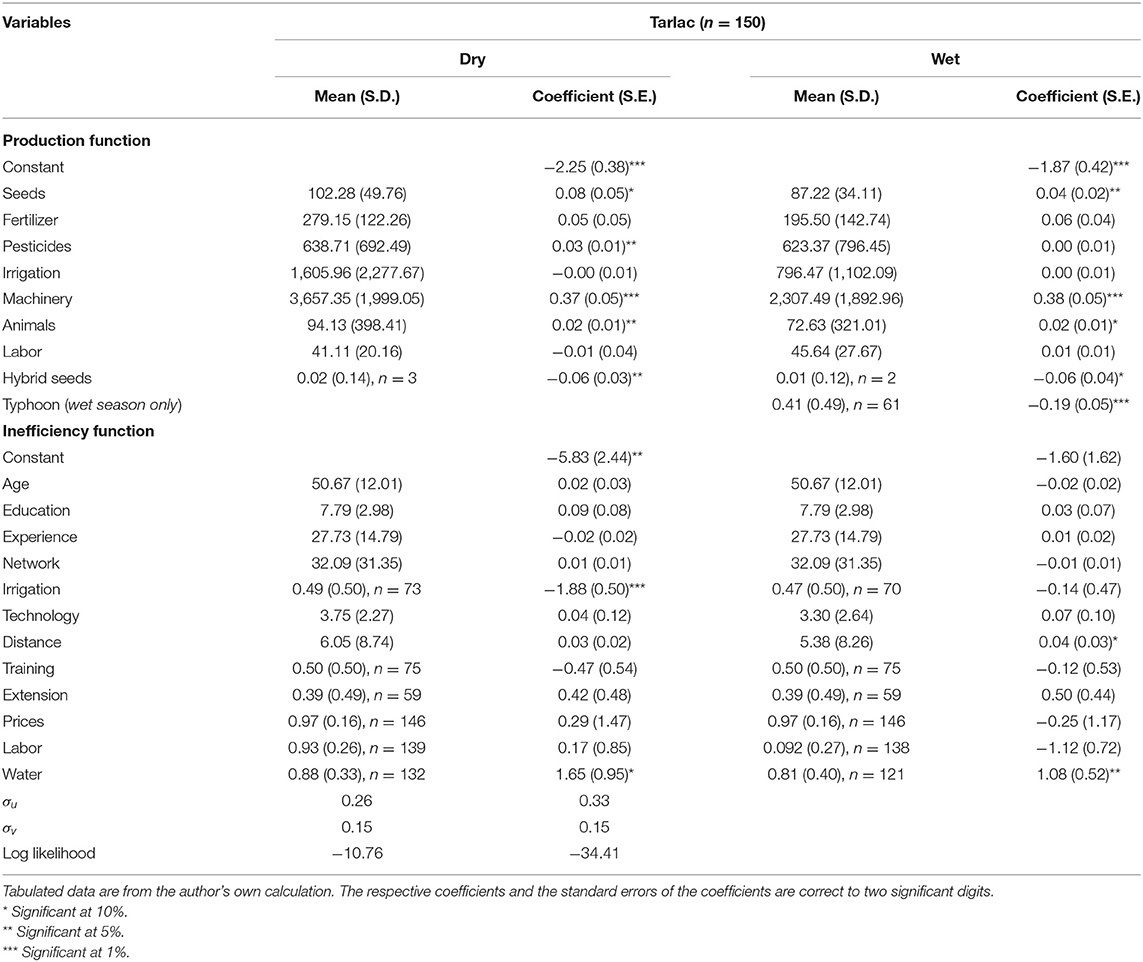
Table 3. Mean statistics and maximum likelihood estimates of the stochastic production and technical inefficiency models in Tarlac.
The utilization of hybrid seeds or those rice cultivars that are a product of crossbreeding, although significant, had negative coefficients for Tarlac. One possible reason is the low adoption of hybrid seeds in Tarlac, with only 2% of the farmers using hybrid varieties, and that the varieties of hybrid rice cultivated are not well adapted to the farm conditions in the area, resulting in lower yields than expected. The use of hybrid rice seed varieties in Guimba, however, exhibited positive and significant coefficients. For Guimba, a 10% increase in the use of hybrid rice cultivars can result in a 0.70% increase in yield per hectare in the dry season and a 0.60% increase in yield per hectare in the wet season.
As expected, typhoons or some form of climate-related devastation during the wet season significantly affected yield per hectare, as shown by a 1.50% and 1.90% decline in yield per hectare for a 10% increase in the number of farmers affected by a typhoon in Guimba and Tarlac, respectively. In the cropping period considered, there were 31 tropical depressions detected in the Philippine Area of Responsibility, of which 13 formed into full-blown typhoons. Two strong typhoons hit various parts of Central Luzon during the wet season, leaving the region with a combined total of almost PhP3 billion worth of agricultural damages (Flora, 2013; Suarez, 2013).
The results also indicated that labor in person-days was significant during the wet cropping season in Guimba. In Tarlac, we found that the use of pesticides significantly influenced yield during the dry season, whereas animal draft power was significant for both seasons. In the field survey, Tarlac farmers expressed problems with rodents and snails during the dry season. The use of pesticides, although not directly influencing yield growth, helps reduce losses from pest infestations, as expressed by Rola and Pingali (1993) and Magallona (1989) in investigations of the effects of pesticides in rice ecosystems.
In both the dry and wet seasons for the two municipalities, the returns to scale were less than unity, suggesting a decreasing return to scale to the production process. This implies that if all inputs increased by k percent, production increases by less than k percent. In Guimba, a 10% increase in all inputs would result in a 3% and 3.40% change in yield for the dry and wet seasons, respectively. Correspondingly, the quantitative change in yield per hectare in Tarlac is higher given the same proportionate change in the level of inputs. In the dry season, the returns to scale for Tarlac farmers imply a 4.80% increase in yield, whereas in the wet season, the change in yield is 4.50%.
In light of supporting staple food production targets, the findings of the present analysis support initiatives that may help domestic rice production improve. For one, to raise productivity and competitiveness, the country's Department of Agriculture (DA) advocates the adoption of suitable high-quality seeds and increased use of fertilizers (Department of Agriculture, 2012). The DA also promotes the mechanization of on-farm and postharvest operations to help increase yield. As the results show, fertilizer and hybrid seed utilization can increase rice yields. Increased mechanization of rice production as expressed by higher machinery utilization costs compared to all other factors of production, as shown by the present analysis, has the largest effect of increasing rice production.
Because of decreasing returns to scale observed in the two municipalities, as well as to assess the actual potential of farmers in supporting domestic rice production, it is necessary to examine their levels of efficiency. Based on current production practices, Guimba farmers are operating more efficiently than Tarlac farmers, with an average technical efficiency of 0.92 in the dry season and 0.82 in the wet season (Figure 1). The efficiency levels of rice farms in Tarlac are lower by 0.07 and 0.12 points for the wet and dry seasons, respectively. These efficiency differences are statistically significant at the means. Despite the relatively high average efficiency levels in the two municipalities, there remains a number of rice farms that can make substantial improvements in their production operation and farm management to increase their efficiency levels. In Guimba, for instance, during the wet season, about 28% of the rice farms have efficiency levels lower than 0.80. In Tarlac, this number grows to 35 and 48%, respectively, in the dry and wet seasons.Given the variation in the levels of technical efficiency among Guimba and Tarlac farmers, there is definitely potential and opportunity for them to produce more efficiently and improve their productivity. For instance, farms in Guimba can potentially increase production to 7.32 and 5.63 metric tons per hectare at the maximum in the dry and wet seasons, respectively. Equivalently, in Tarlac, farmers can increase rice yield to 4.78 metric tons per hectare in the dry cropping season and 3.90 metric tons in the wet cropping season.
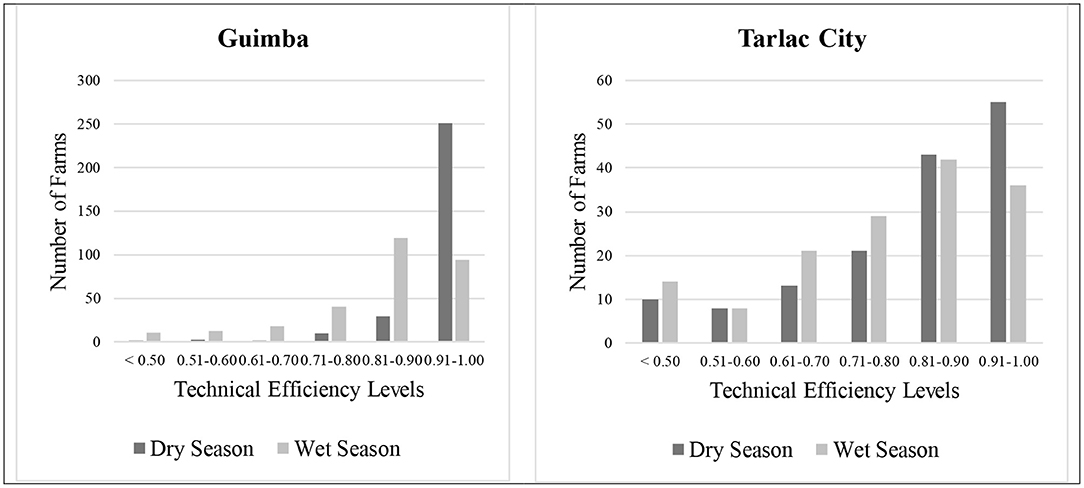
Figure 1. Distribution of levels of technical efficiency of farms in Guimba and Tarlac during the dry and wet cropping seasons.
Farm-specific technical efficiency estimates are important because they can provide information to farmers and policymakers on the nature of operation and management practices implemented in various farm locations. This allows farmers and decision makers to assess ways to increase productivity without increasing the levels of input application. As the findings show, there is variation in the range of technical efficiencies of farmers in Guimba and Tarlac. To understand the divergence in the efficiency rankings, it is imperative to examine factors that could be causing the inefficiency of the farms across the two municipalities.
From Tables 2 and 3, it is apparent that farm operation and management practices, as well as production-specific problems, greatly influence the inefficiency of farmers in the two municipalities. Across Guimba and Tarlac, water shortage during the two cropping seasons increased farmer inefficiencies. In Tarlac, rice farms not connected to the National Irrigation Administration's (NIA) water infrastructure amplified this finding. Consistent with the finding of Rola and Quintana-Alejandrino (1993), the present analysis shows that in the dry season, the inefficiency of Tarlac farmers significantly decreased when more farms have connection with the NIA irrigation systems. This implies the possibility of increasing rice production in the Philippines and the achievability of domestic rice production targets are more likely since improved water availability can help manage two or more cropping per year.
Rice production in the Philippines has two cropping seasons, the wet or rainy season and the dry season. Typically, rice production for the wet season commences at the beginning of the summer monsoon, which is around May of each year. Right after the harvest for the wet season, the dry season production immediately follows as farmers want to utilize the rainfall at the end of the wet season (Koide et al., 2013). The year-round multicropping production, particularly during the dry season, is possible only if there is a sufficient water supply (Hafeez et al., 2007; Antiporda, 2014). The acceleration of irrigation service areas under the plans of the DA is therefore very relevant and promising as far as reducing the inefficiencies of farmers.
Farm distances to input markets and attendance in agricultural training programs also significantly affected farmer inefficiency in the wet season in Tarlac and Guimba. The influence of distance is consistent with the findings of DeSilva (2011) and Evenson et al. (2000) in Bicol, Philippines. In the present analysis, if farms are 6 km or more away from the input market, inefficiency increases. This is particularly important in Tarlac during the wet season because the locations of most input markets are in the city center while farms are on the outskirts. In support of the domestic rice production targets, the government may want to introduce some form of mobile agricultural input store program that is similar to the mobile library program that some municipalities promote. With this program, farmers in remote areas need not go to the city center to acquire the most needed inputs, which in turn can help reduce the overall transportation and hauling costs of inputs.
The noticeable significance of attendance at agricultural training sessions, specifically during the wet season in Guimba, is interesting. As the results indicate, attendance at training programs decreased inefficiency. Speculation suggests that the pertinence of such a factor during the wet season is due to the possibility that there were more training programs offered to the farmers in the cropping year of interest relative to other periods.
The results of the one-step stochastic production frontier analysis are in accord with the findings from similar studies on rice in the Philippines, such as that of Rola and Quintana-Alejandrino (1993); Villano and Fleming (2004, 2006); Odchimar and Tan-Cruz (2007); Pate and Tan-Cruz (2007); Yao and Shively (2007); Gomez and Neyra (2010); Mariano et al. (2011); Koirala et al. (2014a,b); Michler and Shively (2015); Villano et al. (2015). As shown in the current analysis, increasing the technical efficiency of farmers in Guimba and Tarlac can lead to an increase in rice yield per hectare. Under the DA's rice production program, the campaign to construct and modernize new irrigation systems should continue, as well as strengthen rehabilitation and restoration of existing irrigation facilities as access to reliable water sources can help increase farmers' efficiency, especially in Tarlac.
Geographic Priorities for Productivity and Efficiency
With the application of the OHS analysis, we determined the areas where there are incidences of high values of yield per hectare in the dry and wet seasons given farm and dwelling locations. The separation of geolocation is crucial for dwellings or residence and farms because during the data collection, it became apparent that farmers who are residential neighbors are not necessarily farm neighbors. There were cases where farmers are farm plot neighbors but reside in separate and distant villages. The approach is similar to the separate geolocation assessment that Pede et al. (2018) and Tsusaka et al. (2015) conducted to examine spatial dependency and technical efficiency as well as the neighborhood effects among irrigated and rainfed farmers in Bohol, Philippines.
From these geographical representations, we derived three categories—hot spot areas, warm spot locations, and cold spot sites. With the yield per hectare attribute, hot spot areas are the residential or farm neighborhoods where there is a prevalence of high production values. The determination of these high-value areas is with respect to the local yield average as compared to the overall average for all the observations.
Villages that are hot, warm, and cold spots vary depending on geolocation reference—farm or dwelling areas. As such, in the dry season for Guimba, for instance, we detected that farm neighborhoods in the villages of Agcano, Balingog West, Banitan, Bantug, Cawayan Bugtong, Manacsac, Nagpandayan, San Bernardino, Tampac II and III, and Triala are in cold spot areas, which signifies the presence or high incidence of relatively lower yields. For dwelling neighborhoods, these cold spot villages are in three areas—Agcano, Banitan, and Tampac II and III (Figure 2).
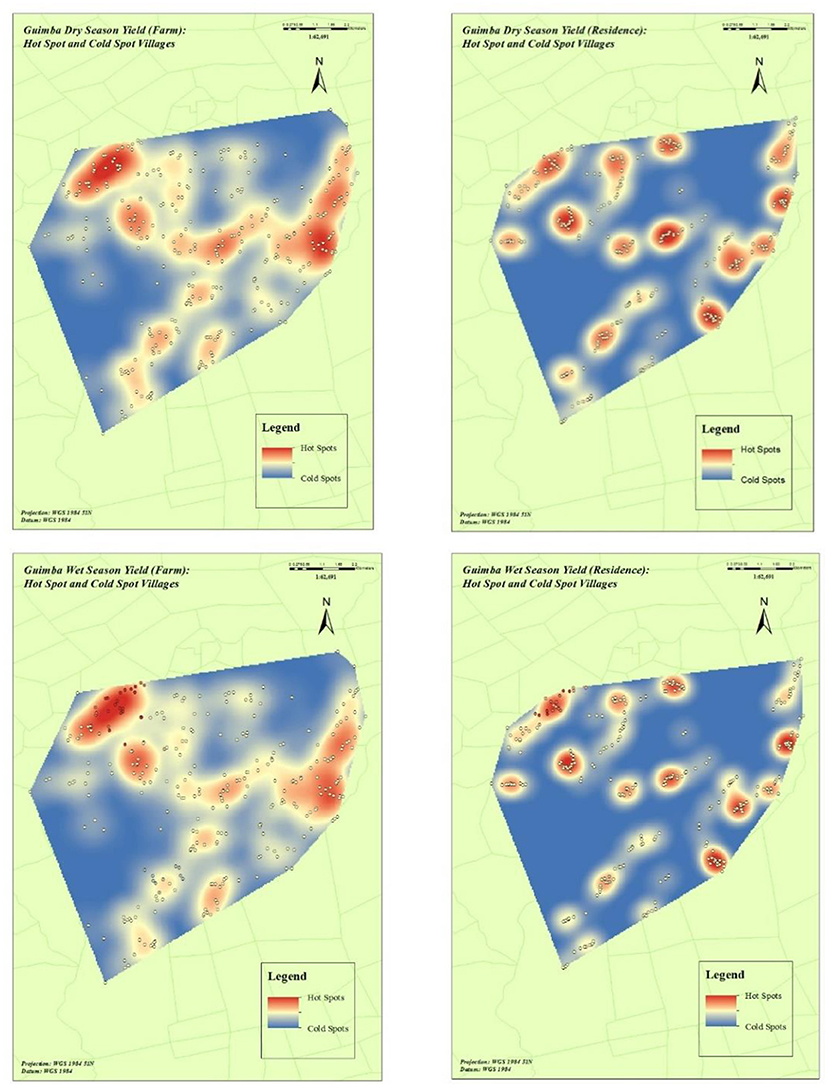
Figure 2. Production (yield per hectare) hot spot and cold spot for farm areas (left) and dwelling places (right) in Guimba for the dry (top) and wet (bottom) seasons. Although the maps are visually distinct, the locational and seasonal difference between the yield hot spot maps in Guimba is statistically not significant.
Conversely, the results of the OHS analysis are consistent for Tarlac across seasons and geolocations. The villages of Armenia, Care, De La Paz, and Tibag are the cold spot localities regardless of which geolocation is under consideration, farm or dwelling areas. Despite these coherent findings in terms of cold spot locations, geolocation discrepancy persists with hot spot and warm spot areas in Tarlac (Figure 3).
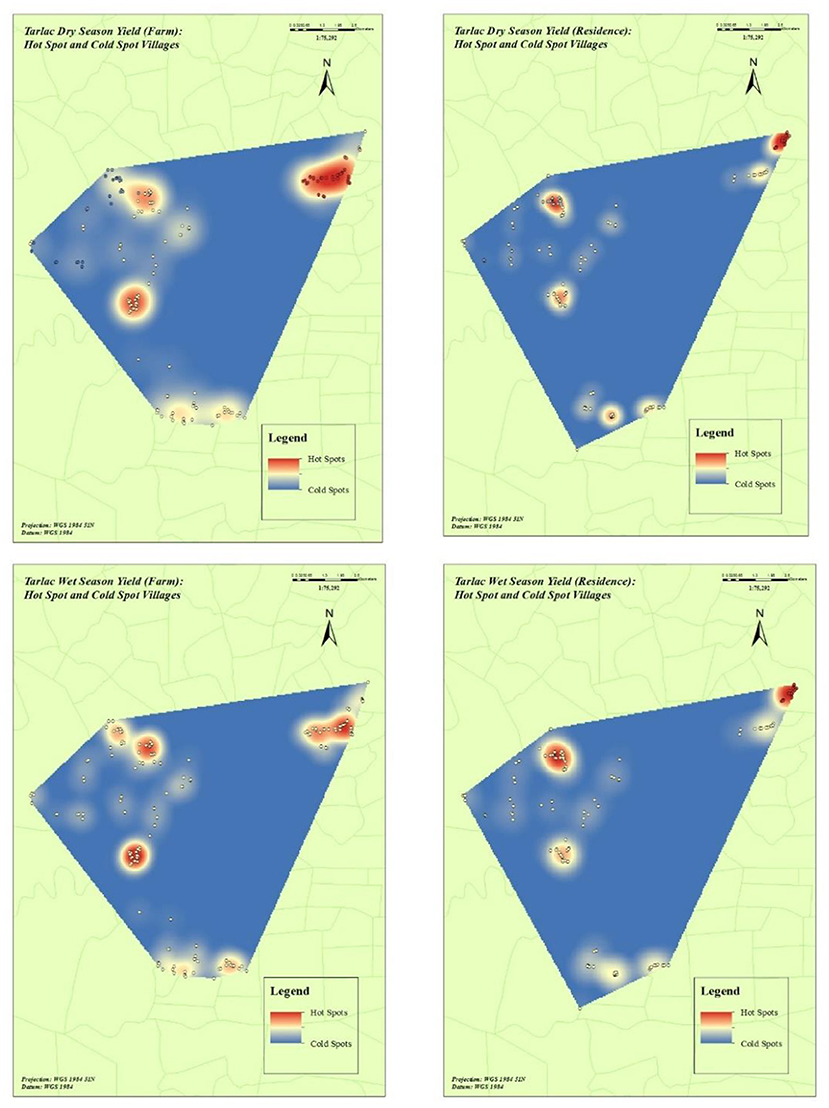
Figure 3. Production (yield per hectare) hot spot and cold spot for farm areas (left) and dwelling places (right) in Tarlac for the dry (top) and wet (bottom) seasons. Although the maps are visually distinct, the locational and seasonal difference between the yield hot spot maps in Tarlac is statistically not significant.
It is evident from Supplementary Appendix Tables 1 and 2 that the decision on which geolocation to consider is crucial, as this will influence the development of policies and geographical prioritization, particularly in Guimba, where the discrepancy is very striking. If the intent is to enhance farm production relative to the production rate of the leading farms, policies should take into consideration the geographic patterns of cold spot areas given the rice field geolocations in Guimba. Targeting cold spot villages may have a greater effect on production than focusing on areas where yield is already high.
As previously argued, achieving the domestic rice production target is contingent on improving the overall levels of technical efficiency of farmers. In this regard, it is necessary to develop programs and initiatives that target areas exhibiting high levels of inefficiency. To guide such policy, decision makers need to know the areas where to implement the needed technical support. Figures 4 and 5 spatially show the distribution of technical inefficiency hot spots in the dry and wet seasons in Guimba and Tarlac given farm and dwelling geolocations. These locations are areas for potential government intervention or assistance that likely requires location-specific strategies.
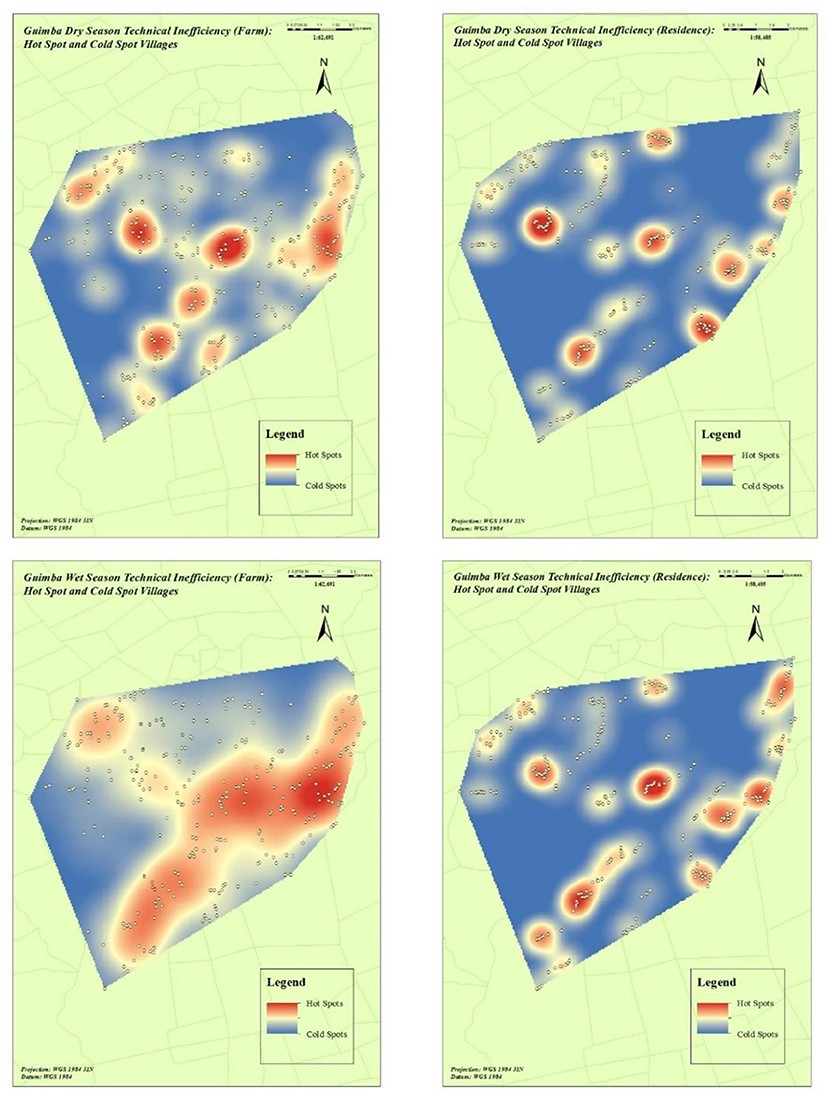
Figure 4. Technical inefficiency hot spot and cold spot for farm areas (left) and dwelling places (right) in Guimba for the dry (top) and wet (bottom) seasons. The visually distinct features between the hot spot maps for technical inefficiency according to geolocations and seasons in Guimba are statistically not significant.
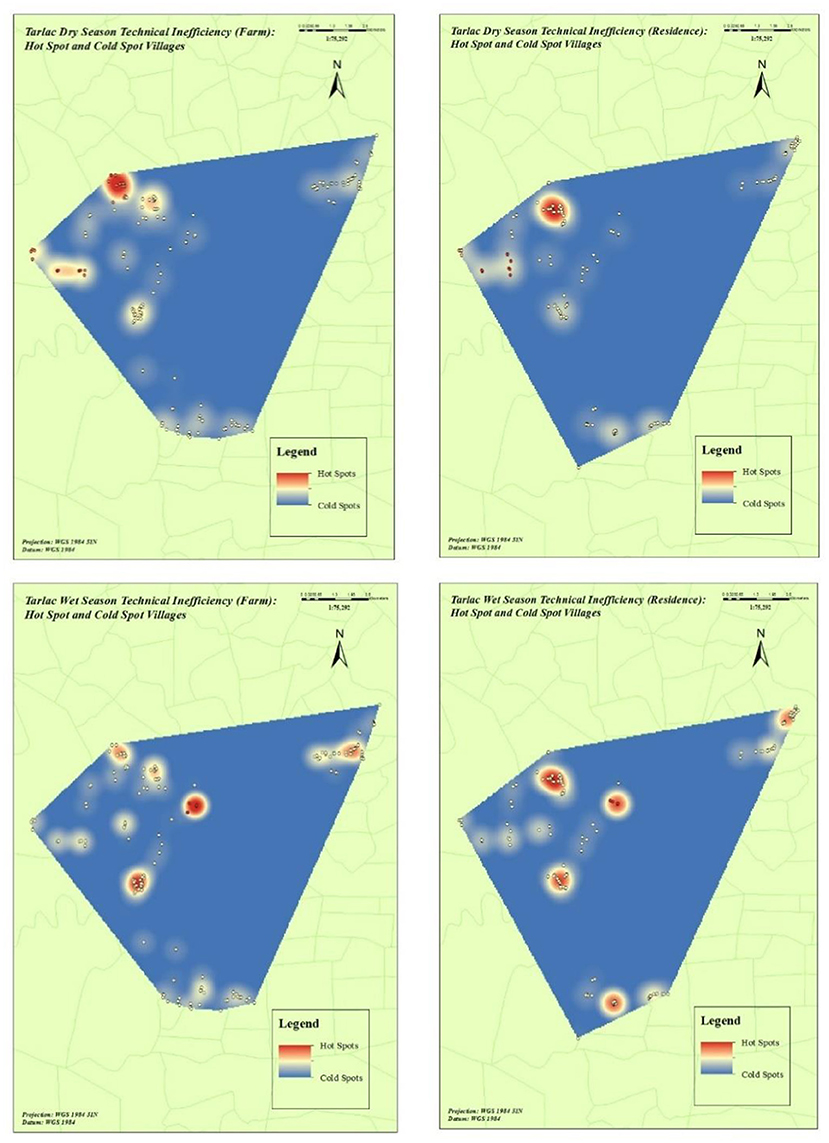
Figure 5. Technical inefficiency hot spot and cold spot for farm areas (left) and dwelling places (right) in Tarlac for the dry (top) and wet (bottom) seasons. Note: The visual difference in the technical inefficiency hot spot maps in Tarlac according to geolocations and seasons is statistically not significant.
In contrast with the degree of variation found in the production cold spot regions, the results of the OHS analysis for the technical inefficiency attribute conform across seasons and geolocations. For the two seasons in Guimba, considering farm and dwelling locations, the villages of Balingog East, Caballero, Santa Cruz, and Tampac I are consistent locations for producers with high inefficiency rates. The villages of Sapang Maragul, Tibag, and Tibagan in Tarlac are technically inefficient hot spot areas. If the policy goal is to increase farm-level efficiency, then priority interventions should primarily target these hot spot locations, followed by the warm spot areas.
It is interesting to note from the results of the OHS analysis that in certain villages, low production does not necessarily imply high inefficiency. The villages with high incidences of low yields are not necessarily the same as the hot spot locations for technical inefficiency. Taking note of this location-specific disassociation between production and efficiency hot spots is important and can affect policy design. Considering the results of the stochastic production frontier, for instance, the findings clearly suggest the potential for improving efficiency in the two study areas, which can eventually lead to yield increases that help achieve the domestic rice production target. In this regard, the suitable policy may be one that accounts for inefficiency that specifically addresses the needs of those villages in the inefficiency hot spot locations.
Conclusion and Recommendations
In the last two decades, rice demand in the Philippines has exceeded local supply, making the Philippines one of the top five rice-importing countries in the world. Because of this reliance on imports to sustain domestic rice demand, the Philippines has become vulnerable to the volatility of the global rice market. To address the domestic supply-and-demand gap, the Government of the Philippines has been promoting classical approaches such as expanding land and irrigation areas, increasing productivity through cropping intensification and introducing high-yielding varieties, and strengthening food system connectivity by reducing rice wastes.
In support of increasing productivity and farm efficiency, we performed a stochastic frontier analysis showing that there is potential among farmers to produce more efficiently and improve yields to increase rice production. It is apparent that farm operation and management practices as well as production-specific problems greatly influence the efficiency of farmers. The findings show the relevance of access to irrigation water in increasing farm efficiency. This implies a need to improve water availability for rice production if the Philippines is to close the rice supply-and-demand gap as year-round multicropping production, particularly during the dry season, is possible only if there is a sufficient water supply.
By addressing the inefficiencies related to access to water and relevant inputs as well as technical capacity development of farmers, it is important to note that in the Municipality of Guimba, farms can potentially increase production to 7.32 and 5.63 metric tons per hectare at the maximum in the dry and wet seasons, respectively. On the other hand, Tarlac City farmers can respectively maximize rice yield at 4.78 and 3.90 metric tons per hectare in the dry and wet cropping seasons. With these site-level potentials, with adequate provision of agricultural water to farmers and training programs, it is possible to increase yield to 6.52 metric tons per hectare in Nueva Ecija and to 4.35 metric tons per hectare in Tarlac.
While increasing the level of farmer efficiency is imperative, policy and decision makers must take a prudent approach in implementing the relevant interventions. As shown in this study, it is important to account for the dwelling and farm locations in strategically addressing the production gaps and variation in inefficiency levels. By considering the geolocations of rice producers, agricultural planners and stakeholders may be able to identify specific geographical locations where enhanced production is possible without increasing resource allocation. With the limited resources available to catalyze wide-scale agricultural development specifically for rice production, it is reasonable to envisage a more targeted approach at the geographic level. As this study demonstrated, in Tarlac province, for instance, instead of rolling out interventions across its 76 villages, agricultural decision makers may want to prioritize the villages of Balingog East, Santa Cruz, and Tampac I, where there are much-needed rice production interventions. In Guimba, the priority villages are Sapang Maragul and Tibagan.
The OHS analysis makes a compelling case for policies aimed at enhancing both yield and production efficiency i,e., to take into account the appropriate geographical planning level. Policies need not necessarily be all-encompassing strategies that are implementable from a national scale. Instead, farm- or village-specific interventions might be more pertinent.
Data Availability Statement
The raw data supporting the conclusions of this article will be made available by the authors, without undue reservation.
Ethics Statement
The studies involving human participants were reviewed and approved by Office of Research Compliance, Human Studies Program, University of Hawaii at Manoa (Approval No.: CHS #21746). The patients/participants provided their written informed consent to participate in this study.
Author Contributions
RM conceptualized the research topic as well as the development of the methodology, formal analysis, and writing of the original draft. JY helped conceptualized the research and provided supervision throughout the study. TM also provided writing, review, and editing support in developing the original draft. All authors contributed to the article and approved the submitted version.
Funding
We thank the International Rice Research Institute for providing the funding for the data collection in Nueva Ecija. We are equally grateful for the financial support from the Corky Trinidad Endowment Scholarship administered by the Center for Philippines Studies of the University of Hawaii at Manoa. The Endowment Scholarship made it possible to do part of the spatial analysis.
Conflict of Interest
The authors declare that the research was conducted in the absence of any commercial or financial relationships that could be construed as a potential conflict of interest.
Publisher's Note
All claims expressed in this article are solely those of the authors and do not necessarily represent those of their affiliated organizations, or those of the publisher, the editors and the reviewers. Any product that may be evaluated in this article, or claim that may be made by its manufacturer, is not guaranteed or endorsed by the publisher.
Supplementary Material
The Supplementary Material for this article can be found online at: https://www.frontiersin.org/articles/10.3389/fsufs.2021.727484/full#supplementary-material
References
Aida, T. (2018). Neighbourhood effects in pesticide use: evidence from the rural philippines. J. Agric. Econ. 69, 163–181. doi: 10.1111/1477-9552.12230
Aigner, D., Lovell, A., and Schmidt, P. (1977). Formation and estimation of stochastic frontier production function models. J. Econom. 6, 21–37.
Antiporda, J. (2014). Lack of water systems hampers rice production. The Manila Times. http://www.manilatimes.net/lack-of-water-systems-hampers-rice-production/73397/ (accessed March 18, 2014).
Areal, F., and Pede, V. (2021). Modeling spatial interaction in stochastic frontier analysis. Front. Sustain. Food Syst. 5:673039. doi: 10.3389/fsufs.2021.673039
BAS (2012). Barangay Agricultural Profiling Survey, Central Luzon. Quezon City: Department of Agriculture.
Belotti, F., Daidone, S., Ilardi, G., and Atella, V. (2012). Stochastic frontier analysis using Stata. Stata J. 13, 1–39. doi: 10.1177/1536867X1301300404
Bhanumurthy, K. (2002). Arguing a case for the Cobb-Douglas production function. Rev. Commerce Stud. 20, 75–91. Available online at: https://ssrn.com/abstract=598082
Bordey, F., and Malasa, R. (n.d.). The Rice-Based Farm Household Survey 1996–2007. Science City of Muñoz, Nueva Ecija: Philippine Rice Research Institute.
Bravo-Ureta, B., Solis, D., Moreira López, V., Maripani, J., Thiam, A., and Rivas, T. (2007). Technical efficiency in farming: a meta-regression analysis. J. Prod. Anal. 27, 57–72. doi: 10.1007/s11123-006-0025-3
Bruinsma, J. (2009). “The resource outlook to 2050: by how much do land, water, and crop yields need to increase by 2050?,” in Expert Meeting on How to Feed the World in 2050. Rome, Italy: Food and Agriculture Organization of the United Nations. http://www.fao.org/3/ak971e/ak971e.pdf (accessed April 18, 2015).
Coelli, T., Rao, D., O'Donnell, C., and Battese, G. (2005). An Introduction to Efficiency and Productivity Analysis. 2nd ed. Berlin, Germany: Springer.
Dawe, D. (2006). “The Philippines imports rice because it is an island nation,” in Why does the Philippines import rice?: meeting the challenge of trade liberalization, eds. D. C. Dawe, P. Moya, and C. Casiwan (Los Banos: International Rice Research Institute), 3–8.
DENR (2014). About us. Regional profile. Department of Environment and Natural Resources, Region 3—Central Luzon. Available online at: http://r3.denr.gov.ph/index.php/about-us/regional-profile (accessed October 8, 2014).
Department of Agriculture (2012). Food Staples Sufficiency Program 2011–2016—Enhancing Agricultural Productivity and Global Competitiveness. Diliman, Quezon City, Philippines: Department of Agriculture, Government of the Philippines. https://www.pinoyrice.com/wp-content/uploads/Food-Staples-Sufficiency-Program.pdf (accessed August 15, 2014).
DeSilva, S. (2011). Access to Markets and Farm Efficiency: A Study of Rice Farms in the Bicol Region, Philippines. Working Paper No. 687. Annandale-on-Hudson, NY: Levy Economics Institute of Bard College.
Evenson, R., Kimhi, A., and DeSilva, S. (2000). Supervision and Transaction Costs: Evidence from Rice Farms in Bicol, the Philippines. Economic Growth Center Discussion Paper No. 814. New Haven, CT: Yale University.
Flora, I. O. (2013). Typhoon Santi Leaves Central Luzon with P2.9B Damages. Sunstar. Available online at: https://www.sunstar.com.ph/article/310806/Business/Typhoon-Santi-leaves-Central-Luzon-with-P29B-damages#::text=9B%20damages,-%2Bandtext=CITY%20OF%20SAN%20FERNANDO%20%2D%2D,agriculture%20in%20Central%20Luzon%20provinces (accessed May 25, 2015).
Getis, A. (2009). Spatial weights matrices. Geogr. Anal. 41, 404–410. doi: 10.1111/j.1538-4632.2009.00768.x
Getis, A., and Aldstadt, J. (2004). Constructing the spatial weights matrix using a local statistic. Geogr. Anal. 36, 90–104. doi: 10.1111/j.1538-4632.2004.tb01127.x
Gomez, N., and Neyra, R. (2010). Technical efficiency of rice farmers using groundwater irrigation in North Cotabato, Philippines. USM R D. 18, 133–142.
Hafeez, M., Bouman, B., Van De Giesen, N., and Vlek, P. (2007). Scale effects on water use and water productivity in a rice-based irrigation system (UPRIIS) in the Philippines. J. Agric. Water Manage. 92, 81–89. doi: 10.1016/j.agwat.2007.05.006
Iliyasu, A., Mohamed, Z., Ismail, M., and Abdullah, A. (2014). A meta-analysis of technical efficiency in aquaculture. J. Appl. Aquacult. 26, 329–339. doi: 10.1080/10454438.2014.959829
Jondrow, J., Lovell, C., Materov, I., and Schmidt, P. (1982). On the estimation of technical inefficiency in the stochastic production function model. J. Econ. 19, 233–238. doi: 10.1016/0304-4076(82)90004-5
Koide, N., Robertson, A. W., Ines, A. V., Qian, J.-H., DeWitt, D. G., and Lucero, A. (2013). Prediction of rice production in the Philippines using seasonal climate forecasts. J. Appl. Meteorol. Climatol. 52, 552–569. doi: 10.1175/JAMC-D-11-0254.1
Koirala, K., Mishra, A., and Mohanty, S. (2014a). “Determinants of rice productivity and technical efficiency in the Philippines,” in Paper presented at the Southern Agricultural Economics Association (SAEA) Annual Meeting (Southern Agricultural Economics Association, Dallas, TX)
Koirala, K., Mishra, A., and Mohanty, S. (2014b). “Impact of land ownership on productivity and efficiency of rice farmers: a simulated maximum likelihood approach,” in Paper presented at the Agricultural and Applied Economics Association (AAEA) Annual Meeting (Agricultural and Applied Economics Association, Minneapolis, MN).
Kumbhakar, S., and Lovell, C. (2003). Stochastic Frontier Analysis. Cambridge: Cambridge University Press.
Liu, Y. (2006). “Model Selection in Stochastic Frontier Analysis: Maize Production in Kenya,” in Paper presented at the American Agricultural Economics Association Annual Meeting (AAEA, Long Beach, CA). Available online at: http://ageconsearch.umn.edu/bitstream/21281/1/sp06li01.pdf (accessed May 25, 2015).
Lugos, M. (2009). “A test for people's participation in Central Luzon,” in Rapid Field Appraisal of Decentralization, Central Luzon, Region 3. Manila, Philippines: Asia Rice Foundation. Available online at: http://asiafoundation.org/resources/pdfs/05CentralLuzon.pdf (accessed August 15, 2014).
Magallona, D. (1989). “Effects of insecticides in rice ecosystems in Southeast Asia,” in Ecotoxicology and Climate, eds. P. Bourdeau, J. A. Haines, W. Klein, and C. R. Krishna Murti (Hoboken, NJ: John Wiley and Sons Ltd), 265–297.
Mamiit, R. J., Yanagida, J., and Villanueva, D. (2020). Farm locations and dwelling clusters: do they make production and technical efficiency spatially contagious? Food Policy 92:101883. doi: 10.1016/j.foodpol.2020.101883
Mariano, M. J., Villano, R., and Fleming, E. (2011). Technical efficiency of rice farms in different agroclimatic zones in the Philippines: an application of a stochastic metafrontier model. Asian Econ. J. 25, 245–269.doi: 10.1111/j.1467-8381.2011.02060.x
Meeusen, W., and van den Broeck, J. (1977). Efficiency estimation from Cobb-Douglas production functions with composed error. Int. Econ. Rev. 18, 435–444.
Michler, J., and Shively, G. (2015). Land tenure, tenure security and farm efficiency: panel evidence from the Philippines. J. Agric. Econ. 66, 155–169. doi: 10.1111/1477-9552.12082
Municipality of Guimba (2012). About Guimba. Available online at: https://guimba.gov.ph/about-guimba/ (accessed May 8, 2015).
National Statistics Office (2010). 2010 Census of population and housing. Available online at: https://psa.gov.ph/statistics/census/population-and-housing/2010-CPH (accessed May 8, 2015).
Navata, P., and Turingan, P. (2013). Breaking New Ground: Enacting a National Land Use Policy. Policy Brief, Senate Economic Planning Office, PB-13-01. Manila, Philippines: Senate Economic Planning Office.
Odchimar, H., and Tan-Cruz, A. (2007). “Technical efficiency and environmental-technological gaps in rice production in Mindanao using a metafrontier analysis” in Paper presented at the 10th National Convention on Statistics (NCS), Mandaluyong, Philippines.
Ogundari, K. (2014). The paradigm of agricultural efficiency and its implication on food security in Africa: what does meta-analysis reveal? World Dev. 64, 690–702. doi: 10.1016/j.worlddev.2014.07.005
Pate, N., and Tan-Cruz, A. (2007). “Technical efficiency of philippine rice-producing regions: an econometric approach,” in Paper presented at the 10th National Convention on Statistics (NCS), Mandaluyong, Philippines.
Pede, V. O., Areal, F. J., Singbo, A., McKinley, J., and Kajisa, K. (2018). Spatial dependency and technical efficiency: an application of a Bayesian stochastic frontier model to irrigated and rainfed rice farmers in Bohol, Philippines. Agric. Econ. 49, 301–312. doi: 10.1111/agec.12417
Porter, M. (1998). The Adam Smith address: location, clusters, and the new microeconomics of competition. Bus. Econ. 33, 7–13.
Porter, M. (2000). “Locations, clusters, and company strategy,” in The Oxford Handbook of Economic Geography, eds. G. Clark, M. Feldman, and M. Gertler (Oxford: Oxford University Press), 253–274.
Rola, A., and Pingali, P. (1993). Pesticides, Rice Productivity, and Farmers' Health—An Economic Assessment. Laguna, Philippines: International Rice Research Institute.
Rola, A., and Quintana-Alejandrino, J. T. Q. (1993). Technical efficiency of Philippine rice farmers in irrigated, rainfed lowland and upland environments: a frontier production function analysis. Philos. J. Crop Sci. 18, 56–69.
Simeon, L. M. (2019). Philippines Rice Self-Sufficiency Dips to 86% in 2018. The Philippine Star. Available online at: https://www.philstar.com/business/2019/10/31/1964689/philippines-rice-self-sufficiency-dips-86-2018#:~:text=In%20the%20latest%20report%20of,from%20its%20own%20domestic%20production (accessed January 8, 2020).
Suarez, K. (2013). Typhoon Labuyo: 4 dead; P69-M Houses, P438-M crops Damaged. Rappler. http://www.rappler.com/nation/36288-20130813-labuyo-casualties-damage (accessed May 25, 2015).
Tsusaka, T., Kajisa, K., Pede, V., and Aoyagi, K. (2015). Neighborhood effects and social behavior: The case of irrigated and rainfed farmers in Bohol, the Philippines. J. Econ. Behav. Organ. 118, 227–246. doi: 10.1016/j.jebo.2015.04.022
Villano, R., Bravo-Ureta, B., Solis, D., and Fleming, E. (2015). Modern rice technologies and productivity in the Philippines: disentangling technology from managerial gaps. J. Agric. Econ. 66, 129–154. doi: 10.1111/1477-9552.12081
Villano, R., and Fleming, E. (2004). Analysis of Technical Efficiency in a Rainfed Lowland Rice Environment in Central Luzon Philippines Using a Stochastic Frontier Production Function with a Heteroskedastic Error Structure. Working Paper Series in Agricultural and Resource Economics No. 2004-15. Armidale, New South Wales, Australia: University of New England.
Villano, R., and Fleming, E. (2006). Technical inefficiency and production risk in rice farming: evidence from Central Luzon, Philippines. Asian Econ. J. 20, 29–46. doi: 10.1111/j.1467-8381.2006.00223.x
von Thunen, J. H. (1826). Der Isolierte Staat in Beziehung auf Landwirtschaftu nd Nationalokonomie. Hamburg: Perthes Verlag.
Wang, H. J., and Schmidt, P. (2002). One-Step and two-step estimation of the effects of exogenous variables on technical efficiency levels. J. Product. Anal. 18, 129–144. doi: 10.1023/A:1016565719882
Keywords: food security, optimized hot spot analysis, Philippines, rice production, technical efficiency
Citation: Mamiit RJ, Yanagida J and Miura T (2021) Productivity Hot Spots and Cold Spots: Setting Geographic Priorities for Achieving Food Production Targets. Front. Sustain. Food Syst. 5:727484. doi: 10.3389/fsufs.2021.727484
Received: 18 June 2021; Accepted: 19 August 2021;
Published: 21 September 2021.
Edited by:
Valerien Pede, International Rice Research Institute (IRRI), PhilippinesReviewed by:
Alphonse Singbo, Laval University, CanadaJustin McKinley, Melbourne School of Population and Global Health, Australia
Copyright © 2021 Mamiit, Yanagida and Miura. This is an open-access article distributed under the terms of the Creative Commons Attribution License (CC BY). The use, distribution or reproduction in other forums is permitted, provided the original author(s) and the copyright owner(s) are credited and that the original publication in this journal is cited, in accordance with accepted academic practice. No use, distribution or reproduction is permitted which does not comply with these terms.
*Correspondence: Rusyan Jill Mamiit, cnVzeWFuQGhhd2FpaS5lZHU=