 Grazia Pacillo1*
 Nguyen-Vu Bao-Nam2
 Dharani Dhar Burra2
 Huong T. Trinh3
 Tuyen Danh Le4Mai Tuyet Truong4Son Duy Nguyen4Do Thanh Tran4
 Peter Läderach1
- 1Alliance of Bioversity International and International Center for Tropical Agriculture (CIAT), Rome, Italy
- 2Alliance of Bioversity International and International Center for Tropical Agriculture (CIAT), Hanoi, Vietnam
- 3Department of Mathematics and Statistics, Thuongmai University, Hanoi, Vietnam
- 4National Institute of Nutrition, Hanoi, Vietnam
The current climate crisis poses new uncertainties, risks, and vulnerabilities, and is leading to losses for millions of people depending on fragile food systems. Food systems are, however, vastly different across landscapes and communities, and their capacities to respond to climate impacts evolve and change through time. Humanitarian and development organizations are struggling to keep pace with these changes. Monitoring a large number of diverse food systems during an evolving climate crisis can be expensive and time-consuming. This paper introduces a monitoring approach that uses a combination of open-source earth observations along with national data sources to produce highly contextualized metrics for monitoring Food And Nutrition Security under Climate Evolution (FANSCE). Entirely data-driven, the FANSCE approach has been designed to produce policy recommendations to help monitor, assess, and mitigate climatic impacts on food systems. We developed and tested this approach in Vietnam, where climate variability has become a growing threat to food systems. Our results show that predictors of food and nutrition security differ drastically with the intensity of climate variability. More specifically, our analyses suggest that in areas of high climate variability, levels of food and nutrition security can be significantly predicted based on economic activities, ethnicity, education, health of mothers, and the level of readiness and preparedness to climate impacts of villages and communities. On the other hand, in areas of low climate variability, food and nutrition security are mostly predictable based on the ability of households to access essential services (such as education, health) and communal resources (water, storage, etc.). To support the resilience of food systems, policymakers must regularly monitor how these dimensions react to the changing climate. Addition critical actions to increase food system sustainability in Vietnam include 1) enhanced coordination of institutional responses and capacities across governmental and non-governmental agencies, and 2) better integration of scientific knowledge into national and sub-national decision-making processes.
Introduction
The impacts of climate events on food and nutrition security among the most vulnerable people are remarkable and often devastating. Rising temperature, increased temperature fluctuation, changes in rainfall timing and patterns, and an increase in unseasonal weather events undermine all four dimensions of food and nutrition security: availability, access, utilization, and stability (IPCC, 1998; Krishnamurthy et al., 2012; FAO, 2018). Increased climate variability and increased frequency and intensity of extreme climate events will have long-term impacts on food availability, access, and utilization (Thornton et al., 2014; IPCC, 2019). Specifically, changes in seasonality and unpredictable ecosystem productivity may increase risks in food supply (Lloyd et al., 2011; FAO, 2015; Leng and Huang, 2017) further, the fluctuating income of those dependent on agriculture as well as higher and fluctuating food prices will threaten economic access to food (Yohe et al., 2007; Field et al., 2014). Finally, events such as droughts and floods mean that climate variability will have long-term impacts on nutrition (Myers et al., 2014; Porter et al., 2014). These effects are contextual and differ across landscapes and localities (IPCC, 1998). They are also dynamic and constantly evolving together with the evolution of climate change itself (Le Treut et al., 2007; National Research Council, 2010; Easterling et al., 2012; FAO, 2017). This creates new uncertainties, risks, vulnerabilities, and losses for millions of vulnerable people (IPCC, 1998; FAO, 2015). Humanitarian and development organizations and governments are struggling to keep pace with these changes, as monitoring and evaluating how food and nutrition security can be ensured under these conditions is an expensive, time-consuming and, overall, daunting process (FAO, 2010).
In this paper, we propose an analytical framework that aims to ease these challenges (Robertson, 2021). We do so by using an entirely data-driven and relatively time-efficient and inexpensive approach that has been specifically designed to produce contextualized monitoring metrics. The Food And Nutrition Security under Climate Evolution (FANSCE) approach differs substantially from common monitoring methods, which require extensive and regular data collection. A standard impact evaluation exercise, for example, would require from about 6 months to more than a year from the study design to the main data collection. If additional data collection rounds are needed, the evaluation time would be multiplied by the number of rounds. Depending on the size and location of the study sample, the cost for an evaluation can range from one hundred thousand USD to a few million dollars, as in the case of randomized-control trials (MEASURE Evaluation). In this paper, we use publicly available socio-economic and climate data sets and link these data to the opinions of local key experts and practitioners. Our timeline was about 4 months from start to finish, with a budget of less than one hundred thousand USD. Another advantage vis-à-vis traditional evaluative frameworks is that we do not use any pre-determined food and nutrition security analytical framework, which would a-priori identify a set of monitoring indicators for insecurity due to climate change. Instead, we leave it to the data to derive the indicators. Through this approach, the framework identifies a unique set of indicators that is highly contextual, can easily adapt to the evolution of climatic events and inform policymakers in a timely manner.
Data-driven policymaking is not new. For example, the use of sophisticated data-driven approaches for decision making in precision agriculture is common. The complexity of agriculture systems, where a variety of interrelated factors influence production, has driven the need for an integrated evidence elicitation approach that combines data from different sources and exploits different methodological advances, including machine learning (Lambert et al., 2004; Sadler et al., 2007; Ali et al., 2015; Drummond et al., n.d.). These approaches have, however, been significantly criticized due, among other reasons, to the complexity and lack of transparency of the Integrated Assessment Models (Gambhir et al., 2019). Our approach differs from these models and builds on these criticisms by 1) integrating data-driven approaches with qualitative and expert elicitation techniques and 2) not making any assumption regarding the relationship between climate and food and nutrition insecurity and thereby ensuring transparency and clarity from start to finish. Another major criticism of data-driven approaches is the so-called street light effect (Hendrix, 2017), whereby analysis is only conducted in a data-rich environment. Although this is sometimes inevitable, we believe that this data availability is not the problem in most countries. In fact, national governments and international organizations do collect a significant amount of data, which are often underutilized (IPCC, 1998). The strength of our approach relies on the ability to leverage upon frequently and regularly produced data by national governments and institutions such as nutritional profiles and living standard surveys, that are often not fully exploited. Therefore, more often than not the issue is not one of data availability. It is quite the opposite: how do we make the best use of the vast wealth of data for informing policy decisions? In this paper, we show how data that is regularly collected by national stakeholders can be reused and re-analyzed to monitor complexities, circumventing the need to invest and maintain the collection of additional data sources. Our final major contribution of our approach is the use of climate data to inform food and nutrition security decisions, an approach that is currently limited in use (Weaver et al., 2013). These, coupled with the little evidence on the effects of climate variability on food systems, food, and nutrition security (specifically stunting) at sub-national level, constitutes this paper's main contributions to the literature.
We tested the FANSCE approach in Vietnam, where (Lambert et al., 2004; Sadler et al., 2007; Ali et al., 2015; Drummond et al., n.d.) more than 70 per cent of the population is exposed to risk from multiple climate hazards (Center for Excellence in Disaster Management, 2018). In 2017 alone, the country has been ranked the 6th most affected country by extreme weather events, where 298 people died, the country suffered $4,052 million in loss and damages, equating to 0.6% of its GDP (Eckstein et al., 2019). Furthermore, extreme climate events have been steadily becoming more frequent and severe, bringing enormous impacts upon humans, property, and agricultural production. In 2017, agriculture loss from rice, vegetables, perennial crops and annual crops due to natural disasters equated to over 500,000 hectares (VNDMA, 2017). Along with natural disasters, erratic rainfall has posed additional challenges to the agricultural sector, as shifts in cropping seasons and rainfall can have strong impacts throughout the cropping value chain. Without adequate adaptation measures to climate change, World Bank (2010a) has estimated that Vietnam's total agricultural production added value to the national GDP may decrease by 5.8–13.9% by 2050.
As climate change will directly impact agricultural production and individual property, this raises concern how these interactions will affect human health, especially for the most vulnerable, i.e., those with poor access to resources, poor social security, and those living in poverty. Children, women, ethnic minorities and disabled people are expected to disproportionately bear heavier impacts in Vietnam (World Bank, 2010b). In an exploratory study, Huong et al. (2014) show that stunting and underweight prevalence of children in the Vietnam Northern mountainous region, from 2 to 5 years old differs by season, being higher in summer and autumn while wasting had a higher prevalence during spring and autumn. While these results do now present causality between climate and food and nutrition security, they suggest a temporal significance between agricultural production and climate variability. Hence, further examining this nexus between climate and child nutritional outcomes through monitoring the impact of climate on food and nutritional security will be critical.
The rest of the paper is organized as follows. Section Materials and Methods presents the FANSCE framework and the data used for the case study of Vietnam. Section Result summarizes the main findings of the analysis and provides a set of recommendations on monitoring indicators for areas with low and high climate variability and the final section concludes with some insights on the replicability of this approach in other countries.
Materials and Methods
The FANSCE Framework
The FANSCE approach leverages local knowledge from key experts and practitioners and combines it with publicly available socio-economic and nutrition datasets as well as satellite data. There are six critical steps to implement this method.
Step 1: Understand the Level of Awareness and Perception of Decision-Makers and Experts on Climate Variability Exposure and Impacts on Essential Needs and Outcomes (Such as Stunting) in the Country
Expert elicitation techniques can be used for this step to obtain information from people who are knowledgeable on a subject where data are not directly available and translate this knowledge into probabilistic data to solve a predetermined uncertainty. These tools are often used in those cases where there are insufficient data, it is difficult if not impossible to access information or when there are not enough resources for carrying our primary data collection (Knol et al., 2010). Knowledge is extracted together with experts' insights into the existing limitations, strengths and weaknesses of the available data and information regarding the uncertainty under evaluation. The main output of this exercise is an aggregated subjective probability density function that reflects experts' beliefs as accurately as possible (Hemming et al., 2018). Probabilistic expert elicitation, however, comes with its own challenges. Firstly, it can be quite an expensive exercise as face-to-face meetings or workshops imply high costs of transportation and allowances. In addition, experts can make mistakes (Kuhnert et al., 2010). This can be due to potential biases, such as anchoring, availability, and representativeness (Kahneman and Tversky, 1973), groupthink (Janis, 1971), and overconfidence (Soll and Klayman, 2004). Moreover, experts may experience significant difficulties specifically with the translation of their knowledge into numbers and probabilities (Gigerenzer and Edwards, 2003). Considering these limitations, less structured techniques, such as key informant interviews (KIIs), can be used. KIIs are very flexible and allow the interviewer to move across different subjects during the exercise. In the context of climate change exposure and its impact on essential needs, several different types of stakeholders, with different roles, functions, views, skills, and expertise, may need to be involved in the elicitation process. Therefore, using techniques such as KIIs ensures that a comprehensive landscape of expertise and knowledge from government, international NGOs and civil society working on climate change and resilience can be captured. In our case study, we have interviewed a selection of stakeholders in Vietnam.
Step 2: Map Available Data to Existing Conceptual Frameworks on Climate Variability and Food and Nutrition Security
This step aims to identify what data are available to 1) inform the design of the empirical analysis in step 3, and 2) identify which food and nutrition security domains and subdomains which could be monitored using available datasets. In this step, it is critical to leverage or create new partnerships with local research institutions working on climate change and variability, food, and nutrition security and with those governmental agencies responsible for household level socio-economic data collection. To inform the model specification for the analysis in step 3 and the selection of the potential monitoring indicators in step 4, an extensive literature review of the existing conceptual frameworks on building climate change resilience is needed to identify which of the multiple domains and subdomains often used for the empirical analysis of climate impact on food and nutrition security can be matched to existing datasets. To reflect the assumption that monitoring food and nutrition security under climate evolution requires a system-wide, multi-dimensional approach, Living Standard Measurement Surveys can be used. The main gap in these datasets is usually the lack of specific information on agricultural practices and technologies used by the farmers which can provide insights on their current adaptation and mitigation strategies. For these data, the living standard measurement survey can be complemented using agricultural censuses where available. Specific food security measures, such as per capita calorie intake and stunting prevalence, can be mapped to nutritional surveillance profiles datasets or Demographic Health Surveys (DHS), where available. These are usually very comprehensive surveys that collect data from a large sample of children and mothers on a periodical basis. Finally, climate variability data can be mapped to the Climate Hazards group Infrared Precipitation with Stations (CHIRPS) (Funk et al., 2015). CHIRPS is a global dataset that uses remote sensing to capture key climatic variables (including precipitation) daily since 1960, at 10 square kilometer resolution.
Step 3: Define Climate Metrics
The core of a large proportion of agro-climatological stress indicators consists of precipitation variability across time and space. For this analysis, we suggest choosing three indicators: cumulative dry days (CDD), cumulative wet days (CWD), and standardized daily intensity index (SDII), whose relationship with agro-climatological stress has been well-researched in past literature (Ge et al., 2019). To calculate these indicators, daily precipitation data must be extracted from CHIRPS at 0.05-degree arc seconds spatial resolution, between the years 2011 to 2015, with a reading of <0.1 mm considered as a dry day, and >1 mm precipitation as a wet day. This specific period was chosen because of the time frame for when the Nutrition Surveillance Profile (NSP; which was collected in 2015), and the Vietnam Household Living Standard Survey (VHLSS; which was collected in the year 2014) were collected (Vietnam National Institute of Nutrition, 2015; General Statistics Office of Vietnam, 2016). We assume that precipitation variability is bound to have time-dependent lagged impacts on child nutrition, both at the individual and at the household level (derived from NSP). In other words, the observation of nutritional deficiencies at a particular point in time (that is 2015 for NSP and 2014 for VHLSS), is the cumulative resultant of historic precipitation variability (that is between 2011 and 2015). For each pixel, daily precipitation data are extracted, and the three indicators are calculated separately. For each indicator, pixel-specific values were averaged and extracted to the lowest administrative unit for each year. The highest and lowest value across the years of the analysis for each locality is then used to calculate the range, which captures the lagged impacts of precipitation variability and to place all the administrative units on a continuum of precipitation variability across time. Therefore, for each indicator, the higher the value, the larger the variability in the respective indicator. Since each indicator reflects precipitation variability, the range values are used as proxies for precipitation variability. The range values for each administrative unit are subjected to univariate clustering analysis to cluster localities with similar range values into single clusters. Univariate clustering can be performed using the mClust package in R (v 3.4.1) (Scrucca et al., 2016). Statistical validation with respect to the total number of clusters is assessed using Bayesian information criterion (BIC), within the mCLUST package. In addition, a non-parametric Kruskal-Wallis test is further conducted to assess significant differences in SDII, CWD and CDD between clusters. Chi-square analysis, and assessment of the distribution of households between stunting and no stunting as outcomes across each cluster for each indicator is used to assess whether any significant relationship exists between SDII, CWD and CDD and the proportion of households with stunted children. Chi-square analysis was performed in R (v 3.4.1).
Step 4: Define Food and Nutrition Security Metrics
There exist several indicators of food and nutrition security in the literature (Haddad et al., 1994). Child stunting as a nutritional outcome indicator is recommended as it can be easily obtained from national nutritional surveys or DHS. Using the 2014 Nutrition Surveillance Profiles data for Vietnam (Vietnam National Institute of Nutrition, 2015; Beal et al., 2019), height for z-score (HAZ, HAZ score below−2 as stunting, and above as no stunting), as a stunting metric (i.e., the response variable), can be estimated separately for children below and above 2 years. A chi square test is then performed separately for the three precipitation indicators (SDII, CWD and CDD) to assess whether they differ across the precipitation variability clusters. Specifically, the Chi-square test is performed to assess significant deviation (p-value < 0.05) in the distribution of households, between stunting or no stunting outcomes within each precipitation variability cluster. The precipitation indicator which shows a significant deviation in distribution across all precipitation clusters is then used for subsequent analysis. The Chi-square test is performed using VCD package in R (v 3.4.1) statistical environment (Meyer et al., 2020).
Step 5: Identify Main Drivers of Food and Nutrition Insecurity in Areas of Higher and Lower Climate Variability
The impact of precipitation variability on household nutritional outcomes such as stunting is mediated through household agriculture and incomes derived through agricultural activities. This relationship is more pronounced in countries where a major proportion of the population is still dependent on agriculture and related activities. Although national nutritional surveys capture critical information on food and nutrition security, they often do not capture household-level characteristics related to agricultural productivity and incomes. Living standard measurement surveys such as the Vietnam Household Living Standard Survey (VHLSS), agricultural censuses, etc., that capture household and/or plot level agricultural characteristics and related incomes are better suited as a source for this type of information.
To assess the relative contribution of each variable to stunting (i.e., a binomial class of stunting and no stunting), a tree-based feature selection approach is applied separately for each precipitation variability cluster to assess whether the contributions differ between clusters. Feature selection approach is performed separately for children above and below the age of two. Feature selection approach was applied using the Boruta package in R (v 3.4.1) (Kursa and Rudnicki, 2010).
A generalized additive regression modeling approach is then used, wherein the proportion of households with stunted children in comparison to those without stunted children in each commune, derived from the Nutrition Surveillance Profiles, is used as the response variable. Locality-level explanatory variables are obtained from the VHLSS, including the following household and locality characteristics: geography, remoteness, poverty status, income from non-farming activities, presence of nursery and kindergarten, sources of water in the dry and wet seasons, area under perennial and/or annual crops, most predominant ethnicity at locality level, history of shocks/stresses on human health such as a major epidemic, and on crop health such as a major crop disease and insect stress, and the precipitation variability cluster to which the locality belongs to. The generalized additive regression model is ideal for this analysis as it enables modeling of complex, non-linear relationships between the response and explanatory variables by assessing the fit of a wide variety of distributions, incorporation of multiple parameters of the distribution as additive terms, as well use of random effects. In this case, the precipitation variability cluster is used as a random effect in the regression equation. This regression analysis is performed separately for children below and above 2 years old. In both cases, beta distribution is assessed and used to fit the regression models with precipitation variability clusters as the random effect. The use of beta distribution to fit the regression models is further assessed by comparing a range of goodness-of-fit statistical indicators (namely Kolmogorov-Smirnov, Cramer-von Mises and Anderson-Darling statistic) between beta, gamma and log-normal distribution using the fitdistrplus package in R statistical environment (v 3.4.1). For the regression modeling, a full model that included all the explanatory variables and a null model that includes only the intercept are estimated, and a stepwise (forward and backward) approach was used to identify a model with relatively fewer independent variables based on the Global Akaike information criterion (GAIC), and the Bayesian information criterion (BIC). Since additive regression models do not consider the effects of interactions between the independent variables on the response variable, further tests were performed to assess potential collinearities between independent variables. In the case of collinearities between categorical independent variables, a chi-square test was employed, while a non-parametric Kruskal-Wallis test was employed to assess potential collinearities between categorical and continuous independent variables. Only those sets of independent variables that obtained p-values < 0.05 in the Chi-square test and obtained p-values above 0.05 in the Kruskal-Wallis test were selected for the final model. Regression analysis is carried out using the GAMLSS package in R statistical environment (v 3.4.1) (Rigby et al., 2005). Ggplot2 (Wickham, 2007) and ggstatsplot (Patil, 2021) in R statistical environment (v 3.4.1) was used to produce plots that aid in interpretation of the regression outcomes. All the maps for analysis and visualization were produced using QGIS (v 3.10).
Step 6: Define Policy Recommendations and Indicators for the Monitoring and Assessment of the Impact of Climate Variability on Food Security and Nutrition
Building on the qualitative and quantitative information gathered in the previous analyses, we are now able to propose specific policy recommendations and identify a set of monitoring indicators for each climatic cluster. A validation exercise needs to be carried out to understand how the selected indicators fit common analytical frameworks for monitoring food and nutrition security. For this purpose, an extensive literature review is needed to collate information on domains, sub-domains and indicators that reflect the complexity of the relationship between climate evolution and food and nutrition security.
Data
Qualitative data was collected via a set of key informant interviews. Supplementary Table 1 lists the stakeholders involved in the analysis. As many other countries, Vietnam has a wealth of datasets that are collected regularly and are publicly available. Building on CIAT's partnerships with local institutions and governmental agencies, we have also been able to access a very exclusive set of data that covers a wide spectrum of potential drivers of food and nutrition insecurity. Table 1 lists the type of datasets and the time coverage for data CIAT has accessed. We have used the Vietnam Household Living Standard Survey as a reference for this exercise due to its long time and subject coverage. As a result, 10 household level and 11 community level domains, sub-domains and related indicators have been matched to existing data, with a perfect match for the rounds of 2010 to 2016 (Table 2; the full data matrix can be found in Annex 1). The main limitation of this dataset is the lack of specific information on agricultural practices and technologies used by farmers which can provide insights on the adaptation and mitigation strategies used. For these data, the VHLSS has been complemented using the Agricultural Census. Specific food security measures, such as per capita calorie intake and stunting prevalence, were mapped to the Nutritional Surveillance Profile (NSP) datasets. These are very comprehensive surveys that collect data from a large sample of children and mothers on an annual basis. We use per capita calorie intake, calculated from regular food acquisition in 30 days for household, based on VHLSS survey. This survey is one kind of household survey then the figure also includes food waste and addition components. The per capita calorie intake in this study is a proxy of access to food, which is one of 4 pillars of food security (CFS, 2017; Trinh Thi et al., 2018). The main limitation of these datasets is related to measurement error. Values, especially for the per capita calorie intake, are extremely high across all the four rounds used for this analysis (i.e., average per capita calorie intake higher than 3,000 calories per day). From previous literature, we expect that these values also include food waste and additional components of food consumption that would increase the calorie intake by 5–30 per cent of its real value (Muth et al., 2011).
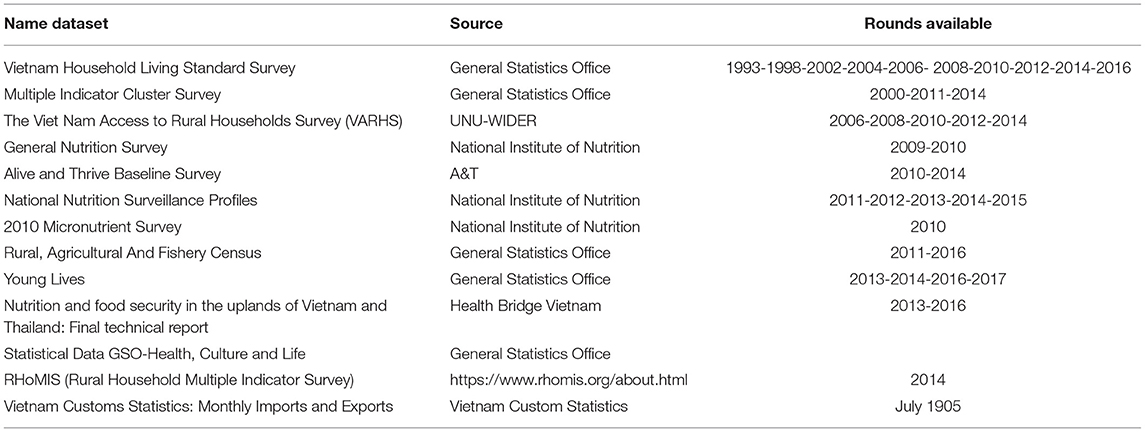
Table 1. Compendium of available relevant datasets in Vietnam.
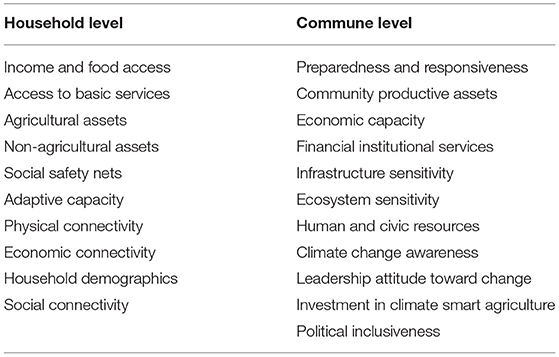
Table 2. Domains of food and nutrition security under climate evolutions mapped to the Vietnam Household Living Standard Survey (VHLSS) 2010–2016.
For the climate variability indicators, three indicators – the Simple Daily Intensity Index (SDII), Consecutive Wet Days (CWD) and Consecutive Dry Days (CDD) were examined. Following the methodology for selection of the most suitable climate indicator, detailed under step 3, the results suggested that the SDII was best suited for the analysis. The chi-square results indicate that the best bet precipitation anomaly indicator would be SDII, with the larger the range values (larger variability) in SDII, the higher the chances for households to have stunted children (refer to Supplementary Figures 1, 2). This trend was not consistent for the CWD and CDD indicators. To balance and bring relative comparability in terms of the number of households between the five clusters of the SDII precipitation variability indicator for subsequent analysis, we reclassified the five clusters, into three, wherein, communes within clusters 3, 4, and 5 were combined into high precipitation variability, while communes in cluster 1 represent low precipitation variability, and communes in cluster 2 represent, medium precipitation variability (Figure 1).
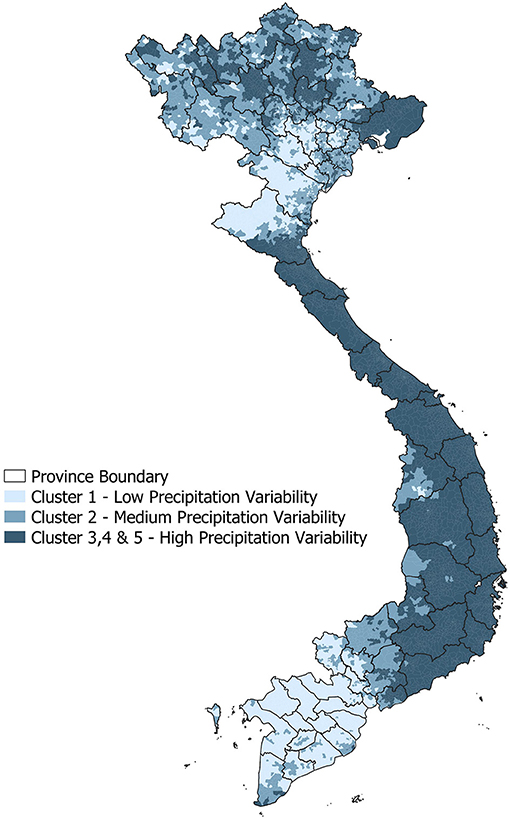
Figure 1. Mapping of precipitation variability in Vietnam using the Simple Daily Intensity Index. Cluster 1 is represented as low precipitation variability (0.51–2.86 mm), cluster 2 as medium precipitation variability (2.86–4.52 mm) and cluster 3, 4, and 5 are grouped into high precipitation variability (4.52–20.57 mm).
Results
Our analysis shows that exposure and vulnerability to climate hazards vary enormously across Vietnam and that food and nutrition security is driven by vastly different factors, depending on the extent to which households are exposed and vulnerable to climate variability and hazards. In the following sub-sections, we first describe the findings of our expert elicitation activities and complement them with existing data (step 1). We then discuss the results of our quantitative analysis (step 4) and, finally, present the main policy recommendations (step 5).
What Are the Levels of Impact, Exposure, and Vulnerability to Climate Variability in Vietnam?
There was a consensus among the respondents that the major climate hazards occurring in the past few years were the 2015–2016 El Nino Drought, the 2017 Typhoon DAMRE and the annual Northern Mountains Region flash floods and landslides. However, the exposure to and impact of these hazards significantly differs across regions in Vietnam. Figure 2 shows geographical distribution of these major climate hazards as identified by local experts.
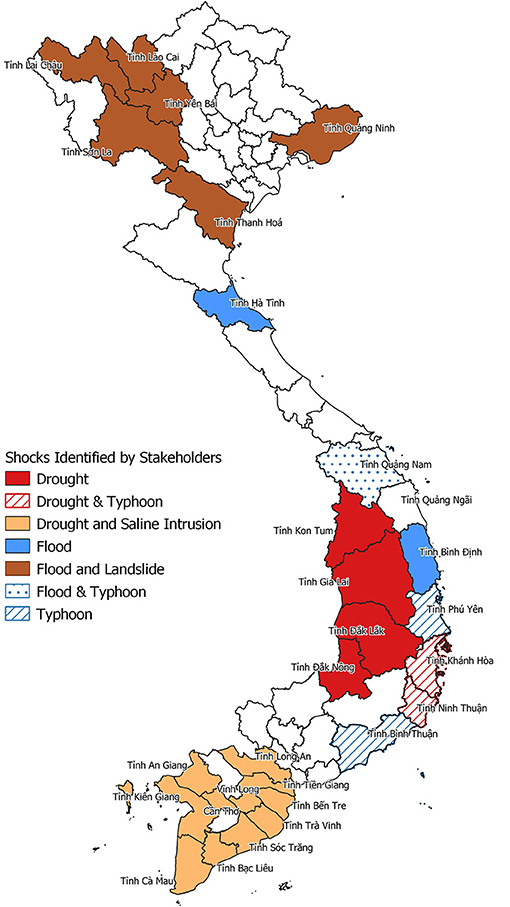
Figure 2. Geographical distribution of major climate hazards, identified from the key informant interview results.
More specifically, our experts stated that the 2015–2016 El Nino had severe impacts on most provinces in the Central Highlands and especially the Mekong Delta, where drought impacts were compounded by the saline intrusion. According to our respondents, the El Nino severely decreased food and water security needs for communes located in the Mekong Delta area, whilst no remarkable effect was reported for other essential needs (e.g., housing security, access to basic infrastructure and services, etc.). This is confirmed by existing data. VHLSS show that Soc Trang and Ca Mau provinces in Southern Vietnam experienced a significant reduction in their Dietary Diversity Score in 2016. No major change in food security is, however, observed in the Central Highlands.
Respondents also argued that the impact of the 2015–2016 El Nino drought on drivers of health such as water and sanitation security varied significantly in the Mekong Delta before and after the occurrence of the drought. Nonetheless, the experts agreed that water and sanitation security in the Central Highlands remained at low levels both before and after the shock. VHLSS data reveals that a large portion of toilets in the Mekong Delta is fishing bridges – a rudimentary toilet that protrudes out into a water body. During periods of water shortage, defecation into low water levels contributes to enhancing the incidence of diseases, further reducing water and sanitation security through growing pollution.
Furthermore, experts agreed that the 2017 Damrey Typhoon impacted mostly the South-Central Coastal provinces. Reportedly, this was the strongest typhoon to hit the region over the past two decades. Communities here largely depend on aquaculture as a major source of income. Khanh Hoa, one of the more economically productive provinces in the region, endured the most damage from the typhoon. But food security levels before and after the typhoon were reportedly not affected by the shock as they did not vary. VHLSS data for 2014 and 2016 also show an improvement of the Dietary Diversity Score just before the occurrence of the shock. Levels of housing security, however, tend to be consistently low but not significantly affected by the typhoon. Finally, the water and sanitation security levels slightly worsened after the typhoon. VHLSS data, however, shows that a reduction in sanitation security was already ongoing before the occurrence of the typhoon. Since 2014 the use of very precarious toilet facilities has increased in this province.
Our respondents also argued that the most destructive floods usually occur in Yen Bai, Thanh Hoa and Son La. Muong Lat and Thanh Hoa communes are the hardest hit by these recurrent climate hazards. The vulnerability of these areas is due to a combination of treacherous geographical location, low economic output, low coping capacity and reoccurring extreme events. While the government has assisted these communities in rebuilding essential infrastructure such as roads, upcoming flood seasons constantly challenge their durability. This leaves communities trapped in a vicious cycle of food, housing, essential infrastructure, health and water and sanitation insecurity.
Finally, the respondents agreed that the capacity to respond and adapt to the increasing climate crisis in Vietnam is heavily undermined by a lack of coordination between local and national agencies in dealing with emergency responses, which is now highly fragmented, and responsibilities are not at all assigned. The experts also revealed that Vietnam lacks mechanisms for knowledge sharing across multiple agencies and institutions working toward the increase of climate resilience, whose efforts are further affected by the lack of awareness and knowledge of local communities of the expected climate impacts.
Are Determinants of Stunting Different in Areas With Low, Medium, and High Precipitation Variability in Vietnam?
The results of the features selection approach, utilizing the SDII cluster mapping (Figure 1) and 2015 Nutrition Surveillance Profiles, show that stunting is significantly associated with location-specific characteristics such as region and mountainous communes (MouCom) in Cluster 1 (low precipitation variability). These results apply specifically to the cohort of children older than 2 years (Figure 3A). For households with stunted children younger than 2 years, specific individual demographic characteristics of the child and the mother, such as ethnicity, health, and education (Figure 3B). These findings are similar to those observed in communes that belong to the higher precipitation variability cluster (cluster 3, 4, and 5), where stunting among households with children above (Figure 4A) or below 2 years old age (Figure 4B) is largely influenced by household demographic, social characteristics and mothers' health characteristics. In these clusters, a combination of mothers' height, mothers' education, the ethnic minority status of households, and agricultural activities carried out by the mother of the stunted child show larger relative contributions to nutrition insecurity. Notably, health-related variables such as whether the child had a fever, diarrhea, deworming or access to iodized salts are also associated with stunting, whereas this relationship did not exist among communes within low precipitation variability clusters. Feature selection analysis of the medium precipitation cluster yielded results similar to the high precipitation cluster for households with children below and above 2 years old.
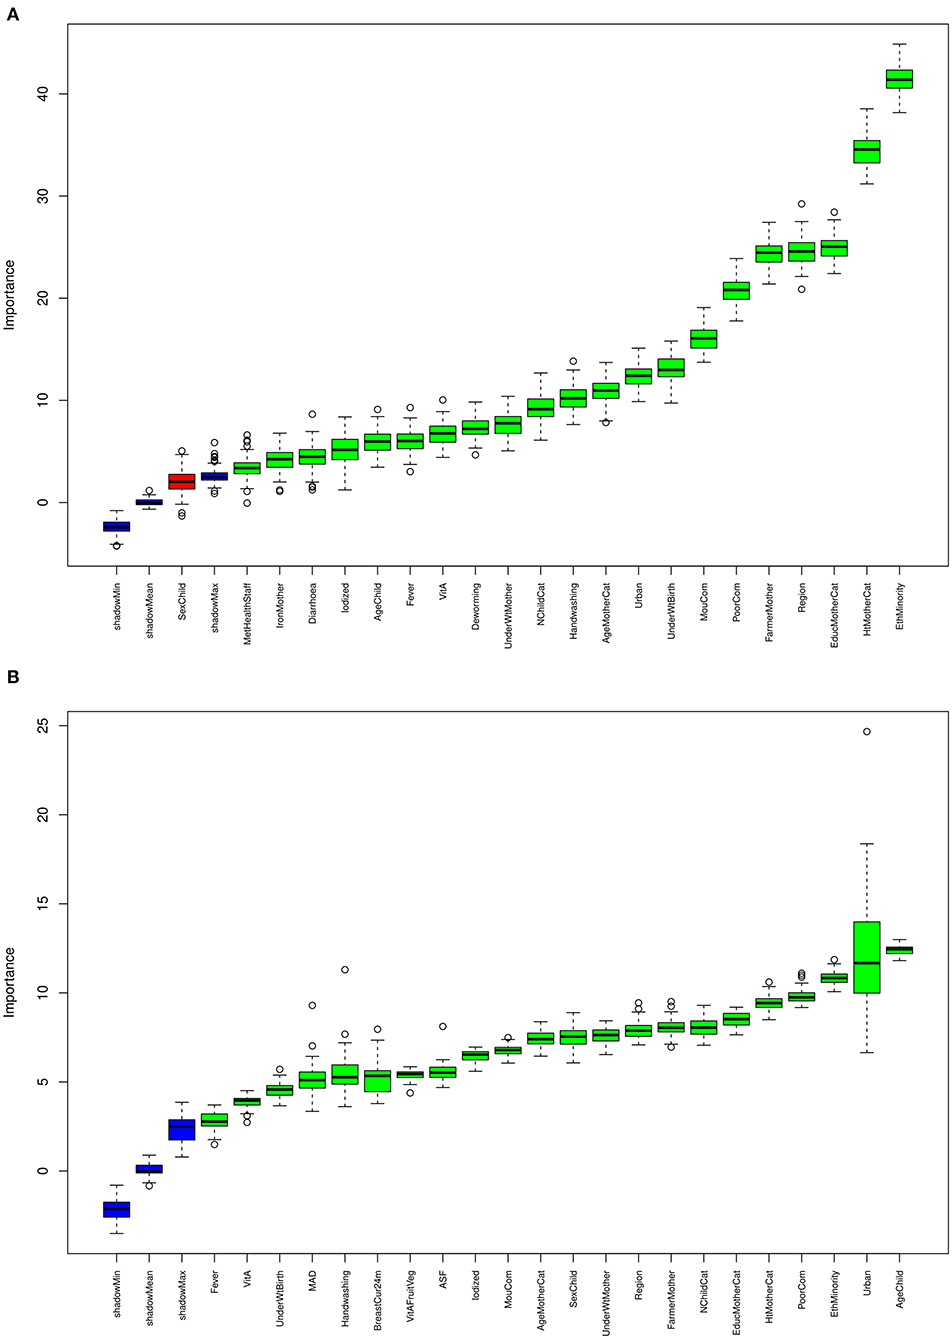
Figure 3. Determinants of stunting for children (A) below and (B) above 2 years old for communes belonging in the low precipitation variability cluster. Indicators used as determinants in the X-axis are derived 2015 Nutrition Surveillance Profiles of Vietnam. The Y-axis represents the importance score, which corresponds to the z-score obtained using a random forest classifier within the Boruta algorithm. Indicators with higher importance suggests that they have a stronger influence on child stunting. Each box-plot represents minimum, maximum and mean importance scores for the corresponding determinant after 100 iterations across the entire dataset. Blue colored box plots correspond to minimum (Shadow Min), mean (Shadow Mean) and maximum (Shadow Max) importance score of “shadow” features, obtained from training a random forest classifier on a duplicated dataset with a set of shadow features in each column, whose corresponding values have been shuffled in comparison to the original dataset. Green colored box plots represent determinants that attained higher importance score in comparison to Shadow Max, while red colored box plots correspond to determinants that obtained lower importance scores in comparison to Shadow Max.
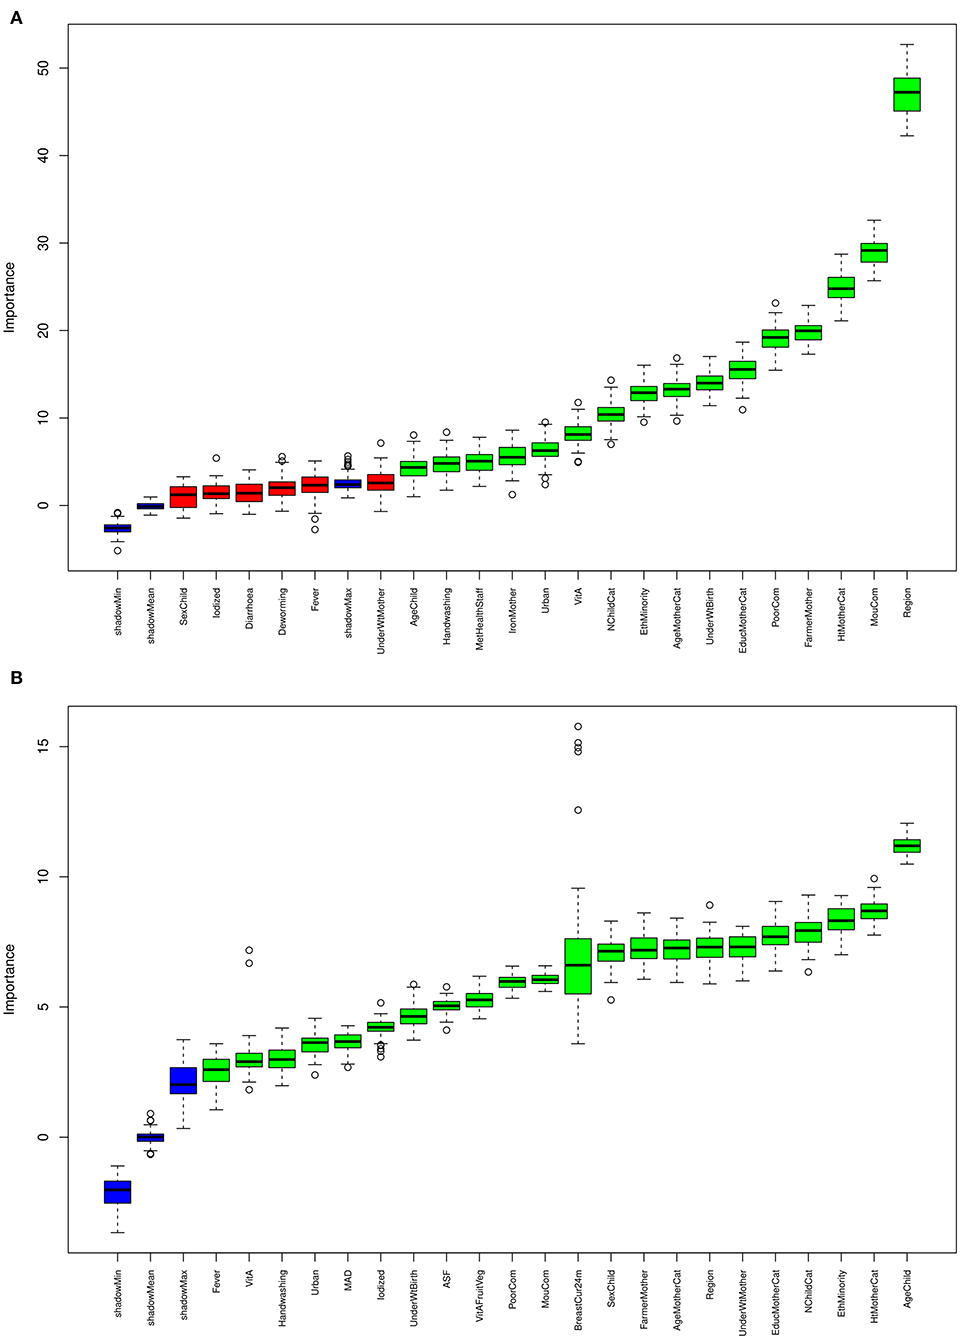
Figure 4. Determinants of stunting for children (A) below and (B) above 2 years old for communes belonging in the high precipitation variability cluster. Factors used as determinants in the X-axis are derived the 2015 Nutrition Surveillance Profiles of Vietnam. The Y-axis represents the importance score, which corresponds to the z-score obtained using a random forest classifier within the Boruta algorithm. Indicators with higher importance suggests that they have a stronger influence on child stunting. Each box-plot represents minimum, maximum and mean importance scores for the corresponding determinant after 100 iterations across the entire dataset. Blue colored box plots correspond to minimum (Shadow Min), mean (Shadow Mean) and maximum (Shadow Max) importance score of “shadow” features, obtained from training a random forest classifier on a duplicated dataset with a set of shadow features in each column whose corresponding values have been shuffled in comparison to the original dataset. Green colored box plots represent determinants that attained higher importance score in comparison to Shadow Max, while red colored box plots correspond to determinants that obtained lower importance scores in comparison to Shadow Max.
To further elucidate the linkages between agriculture, livelihoods, climate variability and stunting, we performed an additional analysis by combining the commune level agriculture, economics, and demographic module of the living standard survey (VHLSS) (albeit implemented in 2014), and the NSP (implemented in 2015), and precipitation variability cluster information. Generalized additive regression modeling revealed further evidence of precipitation variability impacts on stunting outcomes, mediated by differential agriculture-related livelihood characteristics of communes (for GAMLSS model diagnostics, please refer to Supplementary Figure 3). Communes in the higher precipitation variability cluster were found to have a significantly larger proportion of households with stunted children, compared to those in the low and medium precipitation variability clusters (Table 3; Supplementary Figure 4). In the case of children below 2 years old, communes in the higher precipitation variability cluster that do not have access to a nursery and where households have no access to non-farm incomes, have a significantly higher proportion of stunted children compared to communes where households have access to nurseries as well as non-farm. Similarly, communes that reported larger areas under perennial crop production have a significantly lower proportion of households with stunted children in comparison to those that did not, across all the three precipitation variability clusters.
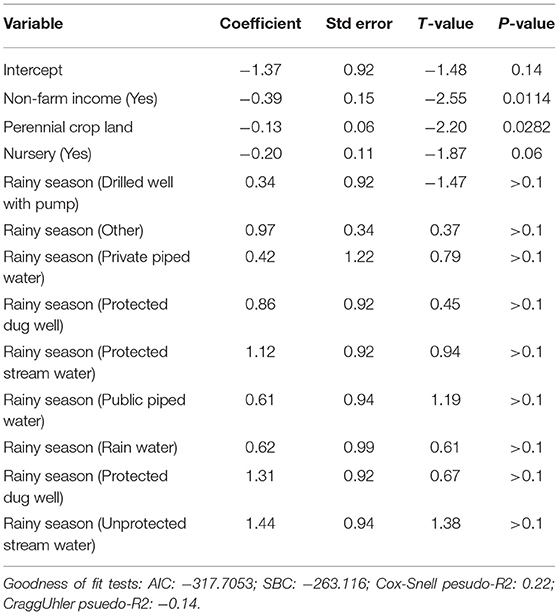
Table 3. Regression analysis of the best performing model with commune-level variables from the Vietnam Household Living Standard Survey (VHLSS) 2014 as explanatory variables, and commune-level frequency of households with stunted children for children below the age of two.
Regression results for children above 2 years old revealed that communes that reported non-Kinh (minority ethnicities) as the most predominant ethnicity had significantly higher proportions of households with stunted children, in comparison to those that reported Kinh ethnicity (Table 4; Supplementary Figure 5). Similarly, communes in high and low mountainous areas showed significantly higher numbers of households with stunted children compared to communes in coastal, inland delta and midland areas (Table 4; Supplementary Figure 5). Additionally, communes that do not have access to kindergarten also had significantly more households with stunted children, in comparison to those that had access to a kindergarten (Table 4; Supplementary Figure 5). Independent of ethnicity, geography and kindergarten access, the prevalence of stunting was higher in communes with higher precipitation variability (Supplementary Figure 5). Similar to children below 2 years old, communes with larger areas under perennial crop production had significantly lower proportions of households with stunted children. This was consistent across all precipitation variability clusters.
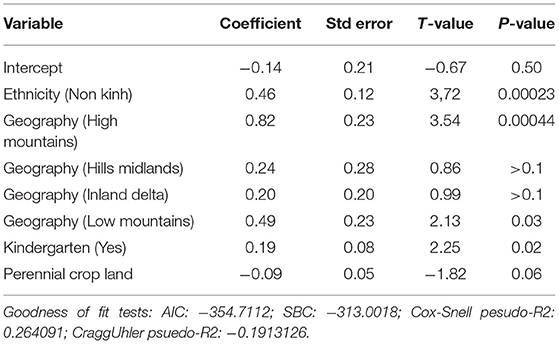
Table 4. Regression analysis of the best performing model with commune-level variables from the Vietnam Household Living Standard Survey (VHLSS) 2014 as explanatory variables, and commune-level frequency of households with stunted children for children above the age of two.
What Can Decision-Makers Do to Mitigate the Impact of Climate Variability on Food and Nutrition Security?
The results of our expert elicitation show that the coordination of institutional capacity across governmental and non-governmental agencies working in climate adaptation and mitigation should be strengthened. Experts on climate variability and resilience raised a shared concern that efforts across multiple agencies are highly fragmented and uncoordinated. For this purpose, there is an urgent need to:
1) Produce guidelines to assign responsibilities for effective implementation and coordination, following the Decision No. 553/QD-TTg approving the “Project for community awareness-raising and community-based natural disaster risk management, with a vision toward 2030” issued on April 06, 2021.
2) Enhance mechanisms to integrate scientific knowledge into national and sub-national decision-making processes. Despite governmental agencies' explicit efforts to enhance the adaptive capacity of the population, mechanisms to share scientific knowledge at sub-national, commune and village levels are still weak. Strengthening the coordination between implementing agencies and researchers should be a priority in the years to come. And
3) Increase emphasis on soft measures of climate adaptation, particularly community awareness-raising. Most of the interventions to mitigate the impact of climate variability have resulted in hard measures, such as rebuilding infrastructure. Very few attempts have been made in Vietnam to build climate readiness and preparedness at the household and community level. Financial and non-financial resources to support soft adaptation strategies are needed, with a specific focus on those groups that are most vulnerable to climate impacts.
Moreover, our results show that there are no “one size fits all” solutions when it comes to anticipating, monitoring, and assessing climate impacts on food and nutrition insecurities. Rather, to significantly increase our chance to understand climate impact on food and nutrition insecurities a set of specific indicators should be monitored, and climate adaptation efforts targeted to specific areas depending on their level of exposure and vulnerability to climate variability.
More specifically, in areas of low climate variability, monitoring nutrition insecurities and climate resilience capacities of households and communities should be focused on mountainous areas, especially where stunting rates among younger children (<2 years old) are higher. Typically, remote, and mountainous areas lack sufficient access to basic services, such as education, health, and infrastructure. This may be exacerbating the incidence of nutrition insecurity. The lack of access to basic services may also limit the opportunities of vulnerable populations to diversify their livelihood strategies via access to non-farm and off-farm sources of income to strengthen their resilience to climate variability. Finally, the limited transport and communication infrastructure and overall lack of physical connectivity often hinder the ability of households to access formal and informal safety nets in case of need. The economic development of the villages where such vulnerable households live can offset some of these constraints and help them to better respond and adapt to climate evolution. Particularly important is the diversity of ownership of communal assets, wherein the case of extreme climate events households in need can use common resources. This form of localized safety net could be crucial for the food and nutrition security of the most vulnerable groups. Indicators to be monitored for these areas should focus on the ability of households and communities to access essential services (such as education, health, etc.) and communal resources (water, storage, etc.). Specifically,
• Access to education and health
• Access to non-farm and off-farm paid employment.
• Access to transport and communication infrastructure
• GDP per capita of the smallest administrative unit
• Diversity of ownership of communal resources.
In areas with higher climate variability, monitoring climate resilience capacities of households and communities should be carried out on a selection of socio-demographic factors and less on location-specific drivers. Where climate variability is higher, our analysis shows that the level of education, health, economic activity of the mother, and ethnicity of the household are the most important drivers of food and nutrition insecurity. These socio-demographic factors suggest that inequality of opportunities and access might be at the root of the higher stunting prevalence in these areas. More specifically, most disadvantaged groups, such as mothers with low education and poor health, working in agriculture and generally ethnic minority households, may lack non-farm or off-farm employment opportunities, or maybe socially marginalized and therefore have limited access to formal and informal social safety nets These factors hinder their ability to respond and adapt to climate variability effectively. Village-level mechanisms to ensure inclusion are critical to offsetting these barriers. To protect the most vulnerable and most marginalized groups, communities must have effective conflict resolution mechanisms which give an equal voice to each part of the population (social inclusiveness) and have institutions that listen and represent their rights and interests (political inclusiveness). Inclusive value chains can also reduce vulnerable groups' dependence on subsistence farming activities. Therefore, for areas with high climate variability, the following monitoring indicators are suggested:
• Gender of the head of the household
• Education and health of the mother
• Access to non-farm employment of the mother
• Access to basic education services such as nurseries and kindergartens
• Production of perennial cash crops that provide sustained income and employment opportunities
• Improved availability and access to basic health services
• Households' and mothers' participation in community groups
• Access to formal and informal safety nets
• Village investment in climate-resilient infrastructure
• Existence of conflict resolution mechanisms at village level
• Degree of political inclusiveness at village level
• Degree of inclusiveness of agricultural value chains.
Conclusion
A “wicked” problem is one whose complexity and shifting requirements makes it difficult or near impossible to solve. The ever-changing, “wicked” challenges that millions of vulnerable people face because of the climate crisis demand both innovative and disruptive approaches that support decision making processes. Monitoring food security and nutrition under climate change is often a daunting process, demanding extensive data collection and time-consuming sophisticated analytics. To save and change lives, it is often critical to be able to use timely and efficient solutions.
We designed an empirical approach that links conventional and non-conventional analytics to identify unique, highly contextualized indicators that can be used to monitor food security and nutrition: the FANSCE (Food And Nutrition Security under Climate Evolution) solution. Entirely data-driven, the FANSCE approach has been specifically designed to produce quick policy recommendations and reduce the number of indicators that are used for food and nutrition monitoring. Combining local knowledge from key experts and practitioners with publicly available socio-economic and nutrition datasets and satellite data with the help of machine learning and simulation techniques, the FANSCE approach generates, in a timely and efficient fashion, a concise list of monitoring indicators that can help target and programming decisions toward those areas and groups that are most vulnerable to climate impacts.
The limited time and resources needed to acquire the insights gained is a critical advantage of this method. Decision making often struggles to keep up with the continuously evolving peculiarity of climate shocks and stressors across different landscapes and localities. Governments need to act fast and dynamically respond to hazards. Highly context-specific scientific approaches are needed which build on local expertise and intelligence. These principles are at the heart of the FANSCE solution.
We tested this approach in Vietnam, where climate variability is a growing threat to food and nutrition security. For example, the recent El Nino weather event has caused the worst drought in 90 years. The Ministry for Agriculture and Rural Development estimated that the “worst-affected households have lost between 30 and 70 per cent or above of their annual paddy yields and, in some provinces, this is as high as 90 per cent” (FAO, 2015). This raises critical concerns on food security and the overall capacities of the general population to face future similar events. The application of the FANSCE method to the case of Vietnam has unveiled important drivers of the climate impacts on food and nutrition insecurity. These, if properly addressed, could significantly enhance the ability of governmental and non-governmental agencies to tackle the impacts of climate change, where it is most needed.
This approach could be easily replicated in other countries located in regions with high climate variability. Publicly available datasets are increasingly accessible. To give an example, the DHS has collected more than 300 surveys since 1984 in more than 90 countries, most of them open access and with geo-located data. In addition to this, World Bank Living National Measurement surveys, collected regularly in more than thirty countries since the 1980s, annual national population census, agricultural censuses, the thousands of impact evaluations surveys carried out by research organizations are similarly becoming available and almost ready to be used. Applying the FANSCE approach to this vast wealth of data would significantly increase our understanding of what drives food and nutrition insecurities under different climate exposure and vulnerability and help policymakers in taking informed based decisions to increase climate resilience.
Data Availability Statement
The data analyzed in this study is subject to the following licenses/restrictions: providers gave exclusive use to the authors for this study. Requests to access these datasets should be directed to http://viendinhduong.vn/vi/hop-tac-quoc-te/national-institute-of-nutrition-159.html.
Ethics Statement
Ethical review and approval was not required for the study on human participants in accordance with the local legislation and institutional requirements. The patients/participants provided their written informed consent to participate in this study.
Author Contributions
GP: conceptualization, methodology, validation, investigation, writing—original draft, writing—review and editing, supervision, and project administration. N-VB-N: methodology, formal analysis, data curation, investigation, writing—original draft, writing—review and editing, and visualization. DB: conceptualization, methodology, formal analysis, data curation, writing—original draft, and writing—review and editing. HT: methodology, formal analysis, data curation, writing—original draft, and writing—review and editing. TL, MT, SN, and DT: resources. PL: funding acquisition, conceptualization, and writing—review and editing. All authors contributed to the article and approved the submitted version.
Funding
This work was funded by the World Food Programme - Regional Bureau for Asia and the Pacific in Bangkok.
Conflict of Interest
The authors declare that the research was conducted in the absence of any commercial or financial relationships that could be construed as a potential conflict of interest.
Publisher's Note
All claims expressed in this article are solely those of the authors and do not necessarily represent those of their affiliated organizations, or those of the publisher, the editors and the reviewers. Any product that may be evaluated in this article, or claim that may be made by its manufacturer, is not guaranteed or endorsed by the publisher.
Acknowledgments
We are extremely grateful to Nicolas Bidault from WFP who provided guidance and support in the design and implementation of this project. We are also thankful to the National Institute of Nutrition of Vietnam which kindly provided the datasets used in this analysis.
Supplementary Material
The Supplementary Material for this article can be found online at: https://www.frontiersin.org/articles/10.3389/fsufs.2021.726779/full#supplementary-material
References
Ali, I., Greifeneder, F., Stamenkovic, J., Neumann, M., and Notarnicola, C. (2015). Review of machine learning approaches for biomass and soil moisture retrievals from remote sensing data. Remote Sens. 7, 16398–16421. doi: 10.3390/rs71215841
Beal, T., Le, D. T., Trinh, T. H., Burra, D. D., Huynh, T., Duong, T. T., et al. (2019). Child stunting is associated with child, maternal, and environmental factors in Vietnam. Matern. Child Nutr. 15:e12826. doi: 10.1111/mcn.12826
Center for Excellence in Disaster Management (2018). Vietnam Disaster Management Reference Handbook. Center for Excellence in Disaster Management & Humanitarian Assistance. Available online at: https://reliefweb.int/sites/reliefweb.int/files/resources/2018VietnamDisasterManagementReferenceHandbook.pdf (accessed June 10, 2021).
CFS (2017). Global Strategic Framework for Food Security and Nutrition (GSF). Available online at: www.fao.org (accessed June 10, 2021).
Drummond, S. T., Sudduth, K. A., Joshi, A, Birrell, S. J., and Kitchen, N. R. (n.d.). Statistical Neural Methods for Site-Specific Yield Prediction. Available online at: http://lib.dr.iastate.edu/abe_eng_pubs (access June 17, 2021).
Easterling, D., Rusticucci, M., Semenov, V., Alexander, L. V., Allen, S., Benito, G., Cavazos, T., et al. (2012). “Changes in climate extremes and their impacts on the natural physical environment,” in Managing the Risks of Extreme Events and Disasters to Advance Climate Change Adaptation, editors C. B. Field, V. Barros, T. F. Stocker, D. Qin, D. J. Dokken, K. L. Ebi. A Special Report of Working Groups I and II of the Intergovernmental Panel on Climate Change (IPCC). Cambridge: Cambridge University Press.
Eckstein, D., Hutfils, M.L., Winges, M., and Index, G. C. R. (2019). Global Climate Risk Index 2019. Available online at: https://germanwatch.org/sites/default/files/GlobalClimateRiskIndex2019_2.pdf (accessed June 10, 2021).
FAO (2010). The State of Food Insecurity in the World: Addressing Food Insecurity in Protracted Crises. Rome.
FAO IFAD UNICEF, WFP, WHO. (2018). The State of Food Security and Nutrition in the World. FAO. Available online at: https://www.fao.org/3/I9553EN/i9553en.pdf (accessed June 10, 2021).
Field, C. B., Barros, V. R., Dokken, D. J., Mach, K. J., Mastrandrea, M. D., Bilir, T. E., et al. (2014). “Climate change 2014: impacts, adaptation, and vulnerability. Part A: global and sectoral aspects,” in Contribution of Working Group II to the Fifth Assessment Report of the Intergovernmental Panel on Climate Change. In Josef Settele. Cambridge: Cambridge University Press.
Funk, C., Peterson, P., Landsfeld, M., Pedreros, D., Verdin, J., Shukla, S., et al. (2015). The climate hazards infrared precipitation with stations—a new environmental record for monitoring extremes. Sci. Data 2, 1–21. doi: 10.1038/sdata.2015.66
Gambhir, A., Butnar, I., Li, P. H., Smith, P., and Strachan, N. (2019). A review of criticisms of integrated assessment models and proposed approaches to address these, through the lens of BECCS. Energies 12:1747. doi: 10.3390/en12091747
Ge, F., Zhu, S., Peng, T., Zhao, Y., Sielmann, F., Fraedrich, K., et al. (2019). Risks of precipitation extremes over Southeast Asia: does 1.5° C or 2° C global warming make a difference? Environ. Res. Lett. 14:044015. doi: 10.1088/1748-9326/aaff7e
Gigerenzer, G., and Edwards, A. (2003). Simple tools for understanding risks: From innumeracy to insight. Br. Med. J. 327, 741–744. doi: 10.1136/bmj.327.7417.741
Haddad, L., Kennedy, E., and Sullivan, J. (1994). Choice of indicators for food security and nutrition monitoring. Food Policy 19, 329–343. doi: 10.1016/0306-9192(94)90079-5
Hemming, V., Burgman, M. A., Hanea, A. M., McBride, M. F., and Wintle, B. C. (2018). A practical guide to structured expert elicitation using the IDEA protocol. Methods Ecol Evol. 9, 169–180. doi: 10.1111/2041-210X.12857
Hendrix, C. S (2017). The streetlight effect in climate change research on Africa. Global Environ. Change 43, 137–147. doi: 10.1016/j.gloenvcha.2017.01.009
Huong, L. T., Xuan, L. T. T., Phuong, L. H., Huyen, D. T. T., and Rocklöv, J. (2014). Diet and nutritional status among children 24-59 months by seasons in a mountainous area of Northern Vietnam in 2012. Global Health Act. 7, 4. doi: 10.3402/gha.v7.23121
IPCC (1998). The Regional Impacts of Climate Change: An Assessment of Vulnerability. Cambridge: Cambridge University Press.
IPCC (2019). “Summary for policy makers,” in Climate Change and Land. An IPCC Special Report on Climate Change, Desertification, Land Degradation, Sustainable Land Management, Food Security, and Greenhouse Gas Fluxes in Terrestrial Ecosystems Climate Change and Land.
Kahneman, D., and Tversky, A. (1973). On the psychology of prediction. Psychol. Rev. 80, 237–251. doi: 10.1037/h0034747
Knol, A. B., Slottje, P., Van Der Sluijs, J. P., and Lebret, E. (2010). The use of expert elicitation in environmental health impact assessment: a seven step procedure. Environ.Health Global Access Sci. Source 9, 1–16. doi: 10.1186/1476-069X-9-19
Krishnamurthy, K., Lewis, K., and Choularton, R. (2012). Climate Impacts on Food Security and Nutrition. WFP's Office for Climate Change, Environment and Disaster Risk Reduction, Devon, United Kingdom. Available Online at: https://documents.wfp.org/stellent/groups/public/documents/communications/wfp258981.pdf
Kuhnert, P. M., Martin, T. G., and Griffiths, S. P. (2010). A guide to eliciting and using expert knowledge in Bayesian ecological models. Ecol. Lett. 13, 900–914. doi: 10.1111/j.1461-0248.2010.01477.x
Kursa, M. B., and Rudnicki, W. R. (2010). Feature selection with the boruta package. J. Stat. Software 36, 1–13. doi: 10.18637/jss.v036.i11
Lambert, D. M., Lowenberg-Deboer, J., and Bongiovanni, R. (2004). A comparison of four spatial regression models for yield monitor data: a case study from Argentina. Precis. Agricul. 5, 579–600. doi: 10.1007/s11119-004-6344-3
Le Treut, H., Somerville, R., Cubasch, U., Allen, M., Treut, L., Somerville, R., et al. (2007). “Historical overview of climate change,” in Climate Change 2007: The Physical Science Basis. Contribution of Working Group I to the Fourth Assessment Report of the Intergovernmental Panel on Climate Change.
Leng, G., and Huang, M. (2017). Crop yield response to climate change varies with crop spatial distribution pattern. Sci. Rep. 7, 1–10. doi: 10.1038/s41598-017-01599-2
Lloyd, S. J., Sari Kovats, R., and Chalabi, Z. (2011). Climate change, crop yields, and undernutrition: development of a model to quantify the impact of climate scenarios on child undernutrition. Environ. Health Perspect. 119, 1817–1823. doi: 10.1289/ehp.1003311
Meyer, D., Zeileis, A., and Hornik, K. (2020). Visualizing Categorical Data. Available online at: https://cran.r-project.org/web/packages/vcd/vcd.pdf (accessed June 10, 2021).
Muth, M. K., Karns, S. A., Nielsen, S. J., Buzby, J. C., and Wells, H. F. (2011). Consumer-Level Food Loss Estimates and Their Use in the ERS Loss-Adjusted Food Availability Data. Available online at: www.ers.usda.gov/data/ (accessed June 10, 2021).
Myers, S. S., Zanobetti, A., Kloog, I., Huybers, P., Leakey, A. D. B., Bloom, A. J., et al. (2014). Increasing CO2 threatens human nutrition. Nature 510, 139–142. doi: 10.1038/nature13179
National Research Council (2010). “Advancing the science of climate change. Chapter Two: what we know about climate change and its interactions with people and ecosystems,” in Advancing the Science of Climate Change. Washington, DC: National Academies Press.
Patil, I (2021). Visualizations with statistical details: the “ggstatsplot” approach. J. Open Source Software 6:3167. doi: 10.21105/joss.03167
Porter, J., Xie, L., Challinor, A., Cochrane, K., Howden, S., Iqbal, M., et al (2014). Chapter 7: Food Security and Food Production Systems. United Nations World Food Programme 2012, New York, NY, USA. p. 485–533. Available Online at: https://www.ipcc.ch/site/assets/uploads/2018/02/WGIIAR5-Chap7_FINAL.pdf
Rigby, R. A., Stasinopoulos, D. M., and Lane, P. W. (2005). Generalized additive models for location, scale and shape. J. R. Stat. Soc. Series C Appl. Stat. 54, 507–554. doi: 10.1111/j.1467-9876.2005.00510.x
Robertson, S (2021). Transparency, trust, and integrated assessment models: an ethical consideration for the Intergovernmental Panel on Climate Change. Wiley Interdiscip. Rev. Clim. Change 12:e679. doi: 10.1002/wcc.679
Sadler, E. J., Jones, J. W., and Sudduth, K. A. (2007). “Modeling for precision agriculture: how good is good enough, and how can we tell?,” in Precision Agriculture '07. Papers Presented at the 6th European Conference on Precision Agriculture, Skiathos, Greece, 3-6 June, 2007, 241–248.
Scrucca, L., Fop, M., Murphy, T. B., and Raftery, A. E. (2016). mclust 5: clustering, classification and density estimation using Gaussian finite mixture models. R J. 8:289. doi: 10.32614/RJ-2016-021
Soll, J. B., and Klayman, J. (2004). Overconfidence in interval estimates. J. Exp. Psychol. Learn. Mem. Cogn. 30, 299–314. doi: 10.1037/0278-7393.30.2.299
Thornton, P., Ericksen, P., Herrero, M., and Challinor, A. (2014). Climate variability and vulnerability to climate change: a review. Glob. Change Biol. 20, 3313–3328. doi: 10.1111/gcb.12581
Trinh Thi, H., Simioni, M., and Thomas-Agnan, C. (2018). Assessing the nonlinearity of the calorie-income relationship: an estimation strategy – With new insights on nutritional transition in Vietnam. World Dev. 110, 192–204. doi: 10.1016/j.worlddev.2018.05.030
Vietnam National Institute of Nutrition UNICEF, and Alive and Thrive. (2015). Nutrition Surveillance Profiles 2015. Hanoi.
VNDMA (2017). Tông họ́p thiệt hại do thiên tai năm 2017 - Summary of Loss and Damage Due to Natural Disasters in 2017. Available online at: http://phongchongthientai.mard.gov.vn/FileUpload/2019-08/u4fxaVGl-kKJ8YgF2017-00. (accessed June 10, 2021). THIET HAI NAM 2017_tinh, tp_ngay 31.12.2017.pdf
Weaver, C. P., Lempert, R. J., Brown, C., Hall, J. A., Revell, D., and Sarewitz, D. (2013). Improving the contribution of climate model information to decision making: The value and demands of robust decision frameworks. Wiley Interdiscip. Rev. Clim. Change 4, 39–60. doi: 10.1002/wcc.202
Wickham, H (2007). The ggplot Package. Available online at: http://had.co.nz/ggplot/ (accessed June 10, 2021).
World Bank (2010a). Economics of Adaptation to Climate Change – Vietnam. Available online at: www.worldbank.org (accessed June 10, 2021).
World Bank (2010b). The Social Dimensions of Adaptation to Climate Change in Vietnam. Available online at: www.copyright.com (accessed June 10, 2021).
Yohe, G. W., Lasco, R. D., Ahmad, Q. K., Arnell, N. W., Cohen, S. J., Hope, C., et al. (2007). “Perspectives on climate change and sustainability. Climate Change 2007: Impacts, Adaptation and Vulnerability,” in Contribution of Working Group II to the Fourth Assessment Report of the Intergovernmental Panel on Climate Change, eds M. L. Parry, O. F. Canziani, J. P. Palutikof, P. J. van der Linden, and C. E. Hanson (Cambridge: Cambridge University Press), 811–841. Available Online at: https://www.ipcc.ch/site/assets/uploads/2018/02/ar4-wg2-chapter20-1.pdf
Keywords: food and nutrition security, climate change, Vietnam, data-driven monitoring, quantitative analysis
Citation: Pacillo G, Bao-Nam N-V, Burra DD, Trinh HT, Le TD, Truong MT, Nguyen SD, Tran DT and Läderach P (2022) Disruptive Innovations for Well-Functioning Food Systems: The Data-Driven “Food and Nutrition Security Under Climate Evolution” Framework. Front. Sustain. Food Syst. 5:726779. doi: 10.3389/fsufs.2021.726779
Received: 17 June 2021; Accepted: 08 December 2021;
Published: 03 January 2022.
Edited by:
Els Lecoutere, CGIAR Gender Platform - International Livestock Research Institute (ILRI), KenyaReviewed by:
Aida Turrini, Independent Researcher, Rome, ItalyDouglas Merrey, Natural Resources Management, United States
Copyright © 2022 Pacillo, Bao-Nam, Burra, Trinh, Le, Truong, Nguyen, Tran and Läderach. This is an open-access article distributed under the terms of the Creative Commons Attribution License (CC BY). The use, distribution or reproduction in other forums is permitted, provided the original author(s) and the copyright owner(s) are credited and that the original publication in this journal is cited, in accordance with accepted academic practice. No use, distribution or reproduction is permitted which does not comply with these terms.
*Correspondence: Grazia Pacillo, Zy5wYWNpbGxvQGNnaWFyLm9yZw==