
95% of researchers rate our articles as excellent or good
Learn more about the work of our research integrity team to safeguard the quality of each article we publish.
Find out more
TECHNOLOGY AND CODE article
Front. Sustain. Food Syst. , 11 October 2021
Sec. Land, Livelihoods and Food Security
Volume 5 - 2021 | https://doi.org/10.3389/fsufs.2021.726646
This article is part of the Research Topic Agile Data-Oriented Research Tools to Support Smallholder Farm System Transformation View all 17 articles
 Medha Devare1*
 Céline Aubert2
 Omar Eduardo Benites Alfaro2
 Ivan Omar Perez Masias2
 Marie-Angélique Laporte3
Agricultural research has been traditionally driven by linear approaches dictated by hypothesis-testing. With the advent of powerful data science capabilities, predictive, empirical approaches are possible that operate over large data pools to discern patterns. Such data pools need to contain well-described, machine-interpretable, and openly available data (represented by high-scoring Findable, Accessible, Interoperable, and Reusable—or FAIR—resources). CGIAR's Platform for Big Data in Agriculture has developed several solutions to help researchers generate open and FAIR outputs, determine their FAIRness in quantitative terms1, and to create high-value data products drawing on these outputs. By accelerating the speed and efficiency of research, these approaches facilitate innovation, allowing the agricultural sector to respond agilely to farmer challenges. In this paper, we describe the Agronomy Field Information Management System or AgroFIMS, a web-based, open-source tool that helps generate data that is “born FAIRer” by addressing data interoperability to enable aggregation and easier value derivation from data. Although license choice to determine accessibility is at the discretion of the user, AgroFIMS provides consistent and rich metadata helping users more easily comply with institutional, founder and publisher FAIR mandates. The tool enables the creation of fieldbooks through a user-friendly interface that allows the entry of metadata tied to the Dublin Core standard schema, and trial details via picklists or autocomplete that are based on semantic standards like the Agronomy Ontology (AgrO). Choices are organized by field operations or measurements of relevance to an agronomist, with specific terms drawn from ontologies. Once the user has stepped through required fields and desired modules to describe their trial management practices and measurement parameters, they can download the fieldbook to use as a standalone Excel-driven file, or employ via free Android-based KDSmart, Fieldbook, or ODK applications for digital data collection. Collected data can be imported back to AgroFIMS for statistical analysis and reports. Development plans for 2021 include new features such ability to clone fieldbooks and the creation of agronomic questionnaires. AgroFIMS will also allow archiving of FAIR data after collection and analysis from a database and to repository platforms for wider sharing.
Agricultural researchers are increasingly exploring machine learning and other predictive approaches to formulate appropriate interventions. Technology developments such as Internet of Things and Cloud Computing together with Big Data capabilities are driving “Smart Farming” (Sundmaeker et al., 2016; Nidhi, 2020), enabling decision-making based on location and other contextual and situational data in real-time (Wolfert et al., 2017). These capabilities and aspirations require that complex and often inter-disciplinary datasets—small and “big”—be easily queried, mined, aggregated and analyzed to derive insights and actionable options (Hashem et al., 2015). By accelerating the speed and efficiency of research, these approaches can facilitate innovation, allowing agile responses to challenges in the agricultural sector.
Farmer access to timely, accurate, hyperlocal recommendations is one such challenge; in response, agriculture is becoming increasingly digitized, and digital advisories are blossoming, particularly in low- and middle-income countries (Tsan et al., 2021). In 2020 the GSMA AgriTech program was tracking over 700 active digital agriculture services that supported and provided services to smallholder farmers, up from just 53 in 2009. These included digital advisories focused on best management practices, as well as financial, procurement, e-commerce, and other options either as individual or bundled services (Phatty-Jobe, 2020). Digital advisory services depend on reliable, location-specific data to offer management options that can improve crop yields and profitability, taking into account local biophysical conditions. While big data capabilities can offer analytics to power digital advisories and facilitate innovation in agricultural research, and agility and impact in the solutions space for farmers and other stakeholders, they rely on standardized, machine-interpretable agronomic data.
An exemplar of the power of open, interoperable data is the COVID-19 Open Research Dataset (Semantic Scholar, 2021) with the use of widely accepted standards such as mature biomedical ontologies (Bodenreider et al., 2005) enabling such advances. The collaborative application of massive computing power to this shared data and standards enabled researchers to model and identify promising compounds for treatment in just under two days—a result that would otherwise have taken years (Quitzau, 2021). This is a powerful demonstration of in silico analysis over vast data pools enhancing the speed and scale of scientific innovation, and a similar model could be just as ground-breaking for millions of agricultural practitioners. This necessitates mining pools of agriculture-related publications, data, and data products that are fully open, interoperable and reusable, adhering to the FAIR Data Principles (Wilkinson et al., 2016). With the exception of the genomic/genetic disciplines, the agricultural domain in general has lagged in this regard. Most agronomic datasets are collected as activities under individual projects, following project recommendations at best, resulting in bespoke data terminologies and annotations, uneven or non-existent metadata, and other issues that make it difficult to share, reuse, or aggregate such data.
CGIAR2 is a large network of global agricultural research for development centers working globally with partners and farmers in several of the poorest nations. CGIAR's Platform for Big Data in Agriculture3 has developed many open-source tools and solutions to help agricultural researchers anywhere generate open and FAIR outputs easily and quickly, and to create high-value data products drawing on these outputs. Its GARDIAN data ecosystem4 includes a toolkit with a FAIR data workflow, for instance, that helps make legacy data assets FAIR. In these endeavors data interoperability tends to be the more difficult aspect to address, and it has become clear that it is most efficient to generate data that is interoperable “at birth” and also as findable as possible. The CGIAR Platform for Big Data in Agriculture developed the Agronomy Field Information Management System or AgroFIMS5 in response, to enable the collection of agronomic data that is highly interoperable and findable, helping users with some of the more challenging aspects of FAIR data.
AgroFIMS is a web-based, open-source tool that allows users to create fieldbooks which can be exported to several free digital collection Android apps, including KDSmart6, Open Data Kit7 (Hartung et al., 2010), and Fieldbook8 (Rife and Poland, 2014). The fieldbooks include metadata already tied to a standard [the CG Core Metadata Schema,9 aligned with the industry standard Dublin Core (Apps, 2005)], and data variables that are linked to concepts in semantic standards like the Agronomy Ontology 10 (AgrO). Users do not need to know details about standards such as ontologies, as the terms they choose are part of their normal scientific and agronomic domain vocabulary. By employing these data standards toward annotation a priori, AgroFIMS helps to create a semantic pool of data for easy aggregation and leveraging by machine learning and other technologies. AgroFIMS also generates rich metadata that largely adheres to semantic standards and controlled vocabularies, facilitating compliance with growing institutional, founder and publisher mandates for FAIR data through this focus on interoperability and findability. Although users are encouraged to use the least restrictive licensing possible, the tool itself does not force licensing choices on users. In-development efforts will make it easier for users to choose appropriate standard licenses for access and data reuse. To further encourage more accessible and reusable data, by the end of 2021 AgroFIMS will call on aspects of the GARDIAN FAIRscribe to provide a score indicating how FAIR data is, allowing the user to address low-scoring dimensions.
AgroFIMS allows users to easily design and create fieldbooks to collect agronomic data already tied to a metadata standard, the CG Core Metadata Schema, and calling on ontologies to populate metadata fields. The tool was first developed in 2018, but its features and user interface have undergone iterative improvements based on testing and feedback by agronomists, crop modelers and developers. It now offers an intuitive platform to guide users through different screens following the schema of a typical agronomic experiment. AgroFIMS then aggregates this information in an easily usable data collection form or fieldbook.
The general workflow for an AgroFIMS user starts with fieldbook creation and ends with data publication in one of many repository platforms (Figure 1). The first step of this workflow, the design of a fieldbook, is done online on the AgroFIMS website (Figure 2), and involves filling the Metadata module that allows users to specify where the agronomic trial will be conducted by defining one or more sites via the Sites tab. The tab allows users to specify and manage trial locations, with site metadata (including latitude, longitude, elevation, administration level names etc.) introduced in a web form that displays and zooms a map. To add a new site, users enter administrative division names, the GPS coordinates or pinpoint the site on this map (Figure 3). GADM Maps and Data11 is used to define administrative levels (countries and their sub-divisions). The newly created site is then saved in AgroFIMS and can be connected to experiments. A site is the entry point for any fieldbook in AgroFIMS.
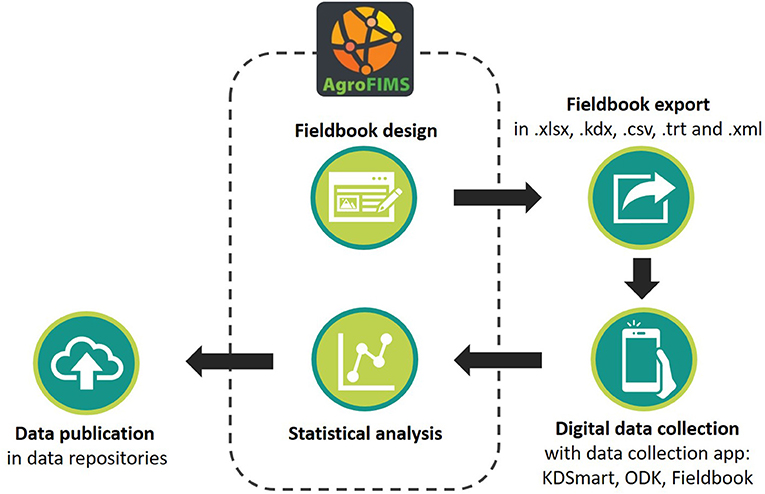
Figure 1. Steps to design a fieldbook and manage agronomic dataset using AgroFIMS.
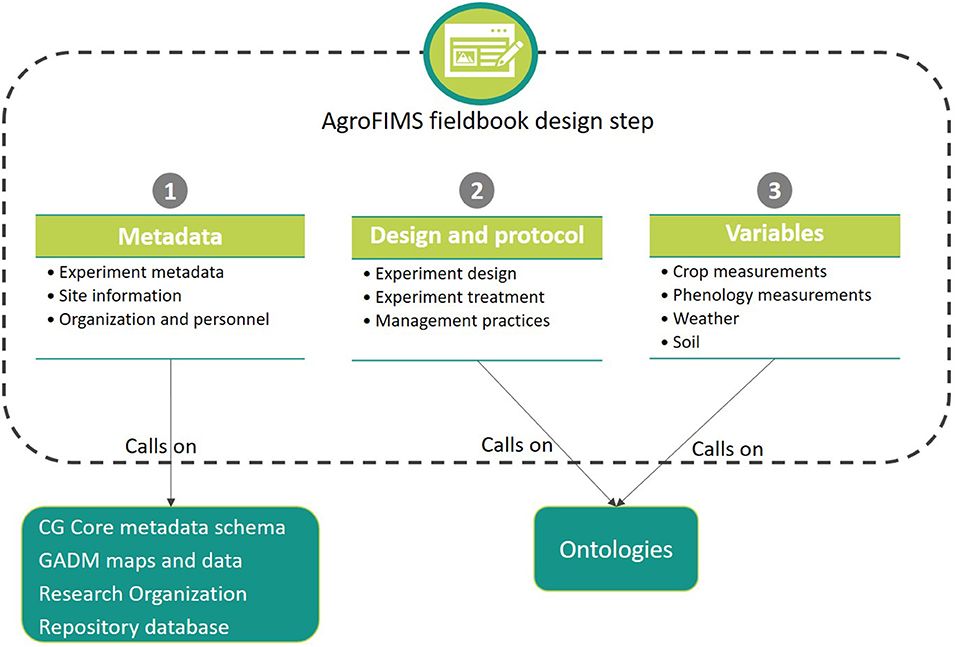
Figure 2. Main modules and their subcomponents of AgroFIMS ‘’fieldbook design” step.
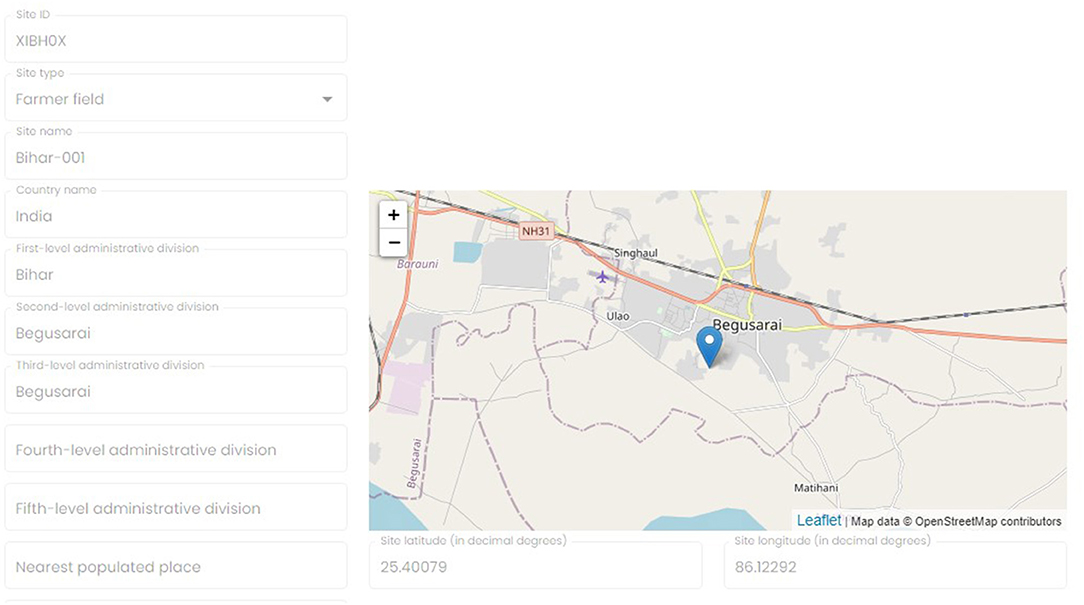
Figure 3. Sites can be specified by choosing country and administrative divisions from an authoritative database connected into AgroFIMS, or by dropping a pin on a map.
The next step of the Metadata module involves defining an agronomic experiment or trial with experiment details, representing trial metadata (Figure 4). The experiments are assigned unique identifiers by the system and are accessible only to the person who designed them, they are not shared across AgroFIMS users. To create an experiment, users give it a name and add details about the project and its objectives, grant information, funding agency, management entity and/or lead. A tab dedicated to personnel working on the experiment auto-loads the user's information and allows registration of different team members and their roles in the trial.
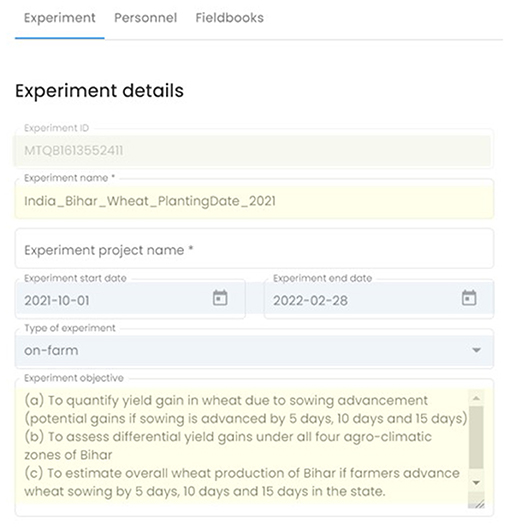
Figure 4. Example of experimental details form in AgroFIMS, showing a mix of system-generated information (light green); standardized choices (light blue); and user-entered text (pale yellow).
A new fieldbook can now be added to the experiment. One or more fieldbooks may be included in the same experiment as part of a project, allowing multisite and multiyear experiments. For each new fieldbook, a suite of tabs allows the user to describe the experiment in standardized terms. For instance, a Crops tab lists 21 possibilities (cereal crops, root and tuber crops, and more), allowing users to choose one or more crops from existing ontologies that will be part of the experiment—or to specify a crop not in the list. Users can also indicate varieties of the crop/s chosen and whether the trial will involve a monocrop, intercrop or relay crop.
Subsequently, in the Design and protoocl module (Figure 2) the user can define a statistical design from a list of 7 common agronomy-relevant designs (Figure 5), and specify experimental unit (plot, field, pot), treatment description and factors.
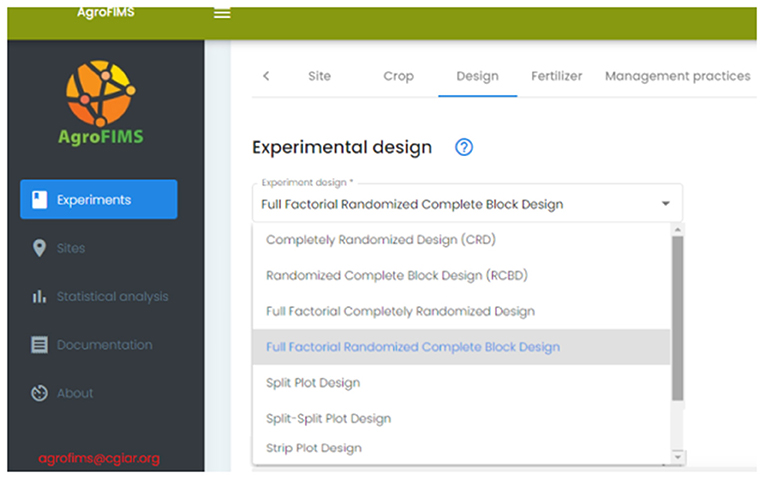
Figure 5. Selection of experimental design choices currently available in AgroFIMS.
The Variables module of AgroFIMS (Figure 2) is the foundation for tabs allowing the user to define the data they want to collect in the field, and how these data should be collected: sampling points/applications per season and/or plot (e.g., for irrigation), unit of measurement, plant part to be sampled, sampling time interval (e.g., plant growth stage, days after planting, frequency, or other). Measurements to be made in the field or in the lab are specified, organized by crop, phenology, weather and soil. Where relevant, the number of measurements to be made per plot and/or per season can be indicated, with sampling timing as described earlier. Protocol details can be indicated via auto-complete functionality from picklists organized by operation type, and including information like the number of tillage passes, type of implement, depth and timing of tillage, and more. The user can also toggle an “actual” vs. “planned” protocol button to indicate how certain operations are to be done. A separate Fertilizer tab is defined to specify product or nutrient types, formulations, and amounts to be applied from a list of 130 possible fertilizer products. A special pop-up module facilitates the calculation of fertilizer quantity to apply, along with implements to be used, timing of application/s and more. This feature is described in the Results section (Figure 7).
AgroFIMS supports either spreadsheet or mobile-based data collection, and once a fieldbook is completed it can be downloaded in different formats: .xlsx, .kdx, .csv, .trt and .xml. The mobile format is tailored for three freely available Android applications: KDSmart,12 Fieldbook13 (Rife and Poland, 2014), and ODK Collect14 (Hartung et al., 2010). Excel displays the metadata added in the AgroFIMS website as the first tab, with other tabs based on field protocols, crop, soil, and weather measurements, and traits specified. Digital data collection eliminates the need to transcribe from paper to digital format and reduces errors thanks to the validity range applied to each measurement. Collected data can be uploaded every day making it possible to assure and course-correct to ensure that an experiment follows the planned trajectory.
Once data is collected, files can be exported in a Google spreadsheet from ODK, and as a zip file from Fieldbook. Users of KDSmart can export collected data back to AgroFIMS for analysis using a statistical analysis module compatible with the application (Figure 1). File outputs from KDSmart are uploaded to AgroFIMS to generate a statistical report in a Word format and based on R scripts. Datasets can then be saved in institutional repositories (Figure 1). This step is currently done manually, but direct upload from AgroFIMS to repositories through an Application Program Interface (API) will soon be available. A help page15 has been designed to support the use of AgroFIMS (Aubert et al., 2020).
The AgroFIMS platform initially began as an interactive analytics platform for breeding trials, developed in the R statistical language. It was expanded to be a more complex data collection tool that is developed on top of Angular 11.0, a single web-based page application framework maintained by Google and compatible with multiple browsers (Google, 2020). The application source code is maintained on GitHub,16 where all commits, changes, and enhancements in the source code are tracked.
The single web-based page application permits building data-driven and form-intensive applications such as AgroFIMS. The AgroFIMS frontend comprises one to multiple complex forms and auto-save forms functionality, everything based on Angular. The frontend communicates with the backend, which is developed in PHP and TypeScript (NodeJS), via web services establishing a connection to the database. The backend contains the queries that bring the required data from the database. This data is presented in the user interface through AgrAPI. APIs are configured to carry the information through URLs in JSON. The database uses MySQL as the database engine to manage data through tables, using a relational model. The database stores information from the auto-save functionality to restore sessions, and agronomic data dictionaries.
The web architecture of AgroFIMS follows REST (REpresentational State Transfer) specifications, widely supported by modern web services (Fielding and Taylor, 2002). An API is defined over this for data exchange between users and services to handle agronomic data in the platform. This REST API called AgrAPI addresses the problem of accessing large and complex datasets, enabling access, integration and exchange of FAIR agronomic data across systems and applications (Leonelli et al., 2013). AgrAPI calls have been organized to mirror the operational structure of AgroFIMS via categories such as experiment details, site details, crop, design, fertilizer, management practices, field measurements and environmental variables (Table 1).

Table 1. AgrAPI calls per category.
AgrAPI calls are implemented through an R-package called ragrapi17 This package is aimed at accessing all the relevant data defined in AgrAPI, retrieving information about an experiment, getting field layouts, searching for fertilizer data, and accessing the different variables of the agronomic experiment.
Data interoperability between fieldbooks from the same experiment and across experiments is a critical need to enable the creation of data pools that can be easily mined and harnessed to analytics. Interoperability tends to be the biggest challenge in data FAIRification, requiring standardization that can be achieved with semantic technologies, including ontologies. An ontology is a formalized organization schema that allows classification and organization of concepts in a knowledge domain, and that makes explicit the relationships and hierarchies amongst these concepts to provide semantic context. Every term is associated with a Uniform Resource Identifier or URI, a short string of characters that identify resources in the web, making it clear to machines what the term means, and the broader context in which it resides based on the hierarchy it is part of. While ontologies offer powerful capabilities, they are not easy to leverage. AgroFIMS makes it easy for agronomists to use these and metadata standards without necessarily knowing the particulars of the standards themselves, as described below.
AgroFIMS relies on the Agronomy Ontology18 (AgrO) to enable standardization of data variables and parameters, and thus, interoperability across multiple datasets. AgrO includes approximately 2270 terms depicting the agronomy domain (as of June 2021). These are semantically organized and can facilitate the collection, management, understanding, sharing and use of agronomic data, enabling easy interpretation and reuse of the data by humans and machines alike. AgrO follows OBO Foundry principles,19 and therefore builds on existing standards. It relies on traits and parameters identified by agronomists and avoids replication of concepts already in other ontologies and vocabularies by including them with their native URIs. Some indicative standards that AgrO draws from include the ICASA Data Dictionary (White et al., 2013), and other existing ontologies such as the Environment Ontology (Buttigieg et al., 2016), the Unit Ontology,20 the Trait Ontology (Cooper et al., 2020) and the Crop Ontologies (Shrestha et al., 2012), as illustrated in Figure 6, which shows a small part of AgrO. Like many other ontologies, AgrO is enriched through knowledge provided by scientists working in the agronomy domain, allowing it to realistically describe and model agronomic experiments including agricultural practices and implements, and variables that are typically measured during the experiment, from soil and weather to crop and fertilizer.
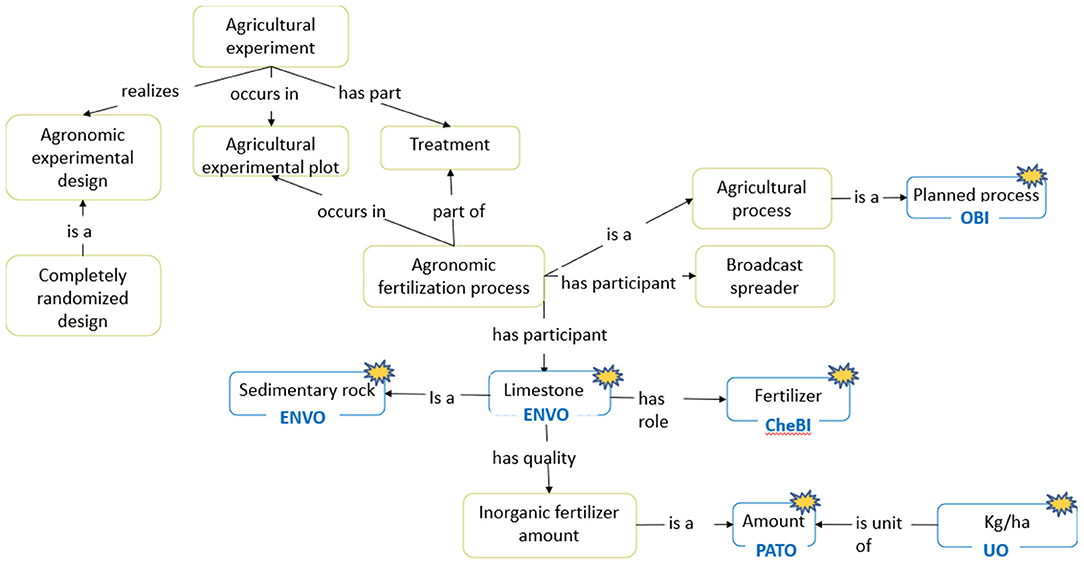
Figure 6. A small part of the Agronomy Ontology, showing key relationships and hierarchies, and reliance on terms from other ontologies (asterisked, and in blue).
All terms that a user selects in AgroFIMS are linked to AgrO classes. For instance, when the plot length is given in meters on the web interface, the value is automatically annotated to both the AgrO class AGRO:00000337 (“plot length”) and the Unit Ontology UO:0000008 (meter). The user does not have to know anything about ontologies to end up getting annotated data. In the near term, when a user downloads an Excel fieldbook, the annotations would be available in the column header, in addition to the variable name. To flag a parameter that is not in AgroFIMS or AgrO, a request would be sent from AgroFIMS to an issue tracker being built to link with AgrO. The data will not be annotated immediately as the request would need to be processed by ontology curators, but the requested term will be made available via AgrO and thence in AgroFIMS, once verified.
AgrO is maintained using the OBO Foundry suite of tools [Ontology Development Kit21 and ROBOT22 (Jackson et al., 2019)] for the release process and with the Protégé tool (Noy and Mcguinness, 2001) for adding new terms. The ontology is openly maintained on GitHub,23 allowing anyone to contribute. It is open source and available through several ontology registries including EBI-Ontology Lookup Service,24 AgroPortal,25 and Ontobee.26 Although AgroFIMS was the first use case of the Agronomy Ontology, its continued growth and maintenance ensures wider relevance (e.g., to the agroforestry sector), and greater interoperability with existing standards in the life sciences. Annotations can be used to guide data entry in a database or when publishing to a data repository. As already mentioned, reliance on ontologies means that humans and machines understand the meaning behind data produced during an experiment designed using AgroFIMS. Thus, by relying on community standards to enable rich metadata and widely interpretable data, the tool generates data that is FAIRer than it would otherwise be and that requires minimal metadata cleaning before the use and publication of datasets.
AgroFIMS is conceived to be intuitive for agronomists through its alignment with typical operations involved in running an agronomic experiment and the use of terms that are part of the agronomist's research vocabulary, rather than the underlying semantic schema of its ontologies. The tool is organized internally in three modules as indicated in Figure 2: metadata, design and protocol, and variables.
AgroFIMS helps produce interoperable and findable data by tying data variables and metadata to industry standards for increased discoverability and interoperability such as the Dublin Core Metadata schema, the Agronomy Ontology, and the Unit Ontology. These are community-developed and agreed standards. Through the Platform for Big Data in Agriculture mediated efforts across the 15 CGIAR Centers, it is clear that the biggest hurdle to data FAIRification tends to be interoperability. We are addressing this challenge in the agronomy domain by linking data to ontology terms through AgroFIMS to make it interoperable, with great benefits for data curation, analysis and storage, thanks to the URIs associated with each ontology term. Additional benefits include rich data and metadata annotations, more data accuracy and reliability due to digital collection and in-built on-site validation, and increased interpretability by both humans and machines.
A concrete example of the advantages conferred by the ontology capabilities of AgroFIMS follows. The term “urea” which is part of the Agronomy Ontology is associated with the URI: http://purl.obolibrary.org/obo/CHEBI_16199 rendering it understandable to a machine and to a human. Further, because this term is part of an ontology, its relationships with other associated terms are inherited, allowing what is known as “inferencing.” This means that users keying in “fertilizer” in a search engine will find this dataset even if it does not reference the term “fertilizer” because the ontology relationships specify that “urea” belongs to a class of things called “fertilizer.” That is, the machine is able to infer through the ontology that urea is a fertilizer, rendering that dataset more easily findable and interoperable. Regarding the access and reuse concerns of FAIR, AgroFIMS recommends that data authors make their datasets as open as possible. However, the tool does not manage the accessibility of data or mandate licenses. This entirely depends on data authors and the particular policies or regulations they are governed by, but AgroFIMS is being developed to make it easier for data authors to choose appropriate open licenses and check FAIR assets against actionable FAIR metrics, as already mentioned.
Apart from the value addition of born-FAIRer data recognized by the agronomist, crop modeler, and developer participants of user testing workshops at different phases of development, feedback has been positive concerning the user interface and navigation, and features including the provision of statistical scripts and analysis reports, direct upload from the AgroFIMS database to a variety of repositories, and plans to provide users with authoritative picklists (e.g., institution names from the Research Organization Repository or ROR27 database). Some illustrative examples of efforts to enhance usability of AgroFIMS follow:
Crop measurements. Crop measurements listed in AgroFIMS are displayed depending on the crop selected earlier in the workflow. Thus, parameters such as “marketable yield” will be available as measurement choices for root and tuber crops, but not for cereals. Users can currently choose from 21 crops, including CGIAR mandate crops. If the crop used in the experiment is not listed, users may add one in a text field, and will then see a selection of standard measurements when specifying these.
Experimental design. Seven experimental designs are currently available in AgroFIMS. Once a design is selected, the treatment description is adapted to the number of repetitions or blocks, and AgroFIMS randomizes treatments, assigning plots to these.
Fertilizer calculation. Based on user feedback from workshops, a fertilizer tab was designed to support users in managing nutrient additions and determining the quantity of fertilizer or nutrient to apply in the field. The tab provides a calculation tool to either determine the quantity of fertilizer to apply or the quantity of nutrient that will be added to the field. This feature aims to reduce time and calculation errors by quickly providing users with the right amount of fertilizer or nutrient required in their trial.
To calculate fertilizer via this tool, users select if they are specifying a fertilizer product amount (e.g., diammonium phosphate, as illustrated in Figure 7) or nutrient amount (e.g., N, P, K). If fertilizer is selected, users choose from among a list of about 130 pre-registered products. For each product chosen, the system auto-loads nutrient content in the product (e.g., 18.0 and 20.1% N and P for standard diammonium phosphate); however, this content can be updated to fit a particular product blend, if different from the standard. Then users indicate the amount of fertilizer they wish to apply and the number of splits or applications (e.g., 2 applications each of 20 kg/ha and 30 kg/ha for the treatments specified in Figure 7). The timing, technique, and method of application can also be indicated, and the amount of nutrient calculated via an R script initiated via the “calculate” button (Figure 7). If nutrient is selected rather than product, users indicate the nutrient amount they want to apply (e.g., 40 kg/ha N; 20 kg/ha P; 10kg/ha K etc.) and select the fertilizer products. The tool then calculates the quantity of fertilizer to needed to deliver the desired nutrient amount.
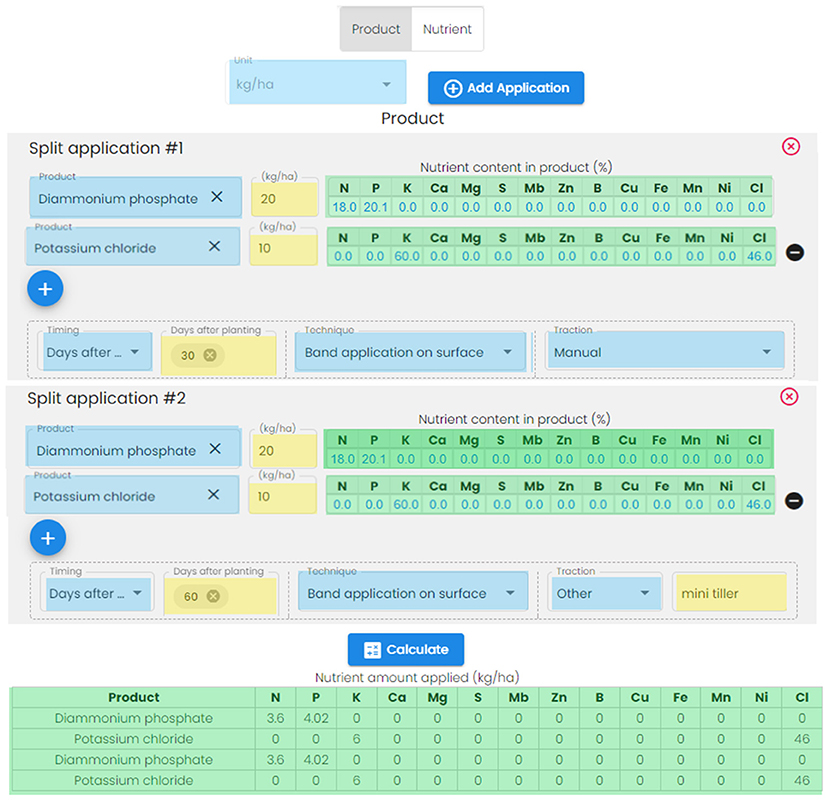
Figure 7. Fertilizer pop-up window, showing system-generated information (light green); standardized choices (light blue); and user-entered text (pale yellow).
Statistical analysis. Once data has been collected, those using the KDSmart application have the option to export their data and download them to the statistical analysis module of AgroFIMS. The module provides a statistical report of the data through R scripts to assess such measures as the analysis of variances (ANOVA), Least Significant Difference (LSD) and Tukey tests. This provides a quick view of trial results and a validity check of the data, and a report that can be used in publications if needed.
In this paper we have presented AgroFIMS, an online tool allowing users to design agronomic trials through an intuitive user interface and to collect standardized data that eases aggregation and analysis. To these ends, AgroFIMS integrates the Agronomy Ontology and aligns metadata with ontology and other standards, ensuring more interoperable and findable agronomic data at collection. In order to design a demand-driven tool, user workshops and demonstrations were organized at various stages in the development of AgroFIMS. Feedback from potential users has highlighted the advantages and the limits of the tool, allowing its continuous improvement.
The key advantage acknowledged through user feedback is the ability to harmonize data collected through fieldbooks with standardized variables and parameters across projects and organizations, reducing data cleaning and processing time and allowing easier data sharing, aggregation, and reuse. The digital collection of data is also recognized as an advantage because this reduces human error and time for data to be available for analysis—and allows quick field validation and correction if needed. Therefore, the potential advantage of a tool like AgroFIMS is not just to the data (re)user, but to the data generator as well. Projects can be large multi-locational endeavors, operational in many locations within a country or many countries. Different data collectors are often tasked with data collection, and no matter how stringent the data collection templates, and data collectors' trainings, collected data is typically inconsistent (in terms of data variable names, methodologies used to manage aspects of field trials, units, and more). In instances where digital data collection is not used the data can have errors, which are often only noticed days, weeks or months after the data has been collected, making it virtually impossible to revisit and/or redo the measurement. This means that the project manager and others associated with the project must spend more time and effort than necessary to standardize data for their own analyses and meta-analyses—when they could instead use a tool that enables digital collection of standardized data in trials subject to relatively standard management and data collection methodology (via protocols bundled into the data collection tool). Another advantage of a tool like AgroFIMS is that coding skills are often necessary to use and set up electronic collection tools. Using AgroFIMS, any scientist can go through user-friendly web interfaces to set up their experiments and load the AgroFIMS output directly into mobile collection apps, such as KDSmart.
In recent years, digital data collection tools are gaining prominence in agricultural research. These tools usually provide some statistical analysis capabilities, which are important for scientists and save them time. Such tools exist primarily in the plant breeding world, with notable examples being the Breeding Management System28 of the Integrated Breeding Platform and the BreedBase29 system developed by the Boyce Thompson Institute. These approaches focus on standardizing plant phenotype data with links to ontologies such as the Crop Ontology, but management practices are often not standardized or shared. Further, breeding experiments follow experimental designs that are generally simpler than in agronomic experiments, usually involving one unique treatment with several factors, and using only the crop genetic material as an entry point. In contrast, agronomy trials are concerned with a large variety of management practices and treatments, much less so with the germplasm.
Other examples of digital data collection in the agricultural domain are ClimMob30 which facilitates the design of agricultural citizen science experiments, and RhoMIS, for the creation of household surveys (Hammond et al., 2017). These tools are based on ODK forms, where users create questions that are recorded in the fields. These tools embed a set of recommended questions in pursuit of standardization, but the data generated are not necessarily standardized, which is a barrier to its reuse. These limitations led us to developing an approach which focuses on standardizing data from the start, taking into consideration experimental design, including treatments and management practices, and crop phenotype data.
Despite the advantages of AgroFIMS, there remain cultural and technical issues to its adoption, the former of which is the more difficult to address. Using the tool requires users to change how they are used to collecting data, often with large numbers of partners trained to do so in particular ways. In addition, the pre-filled lists are based on standard vocabularies that employ commonly used terms, measures, and their synonyms. However, this harmonization is complex as some measures may have many names; a measure may therefore be missing or be represented by a name other than the one most often used by the user, which can be frustrating.
From the technical standpoint, at least one important agronomic concept has not yet been tackled: While AgroFIMS covers a season with one or more crops as monocrop or intercrop systems, the complexity of long-term rotation experiments is still being conceptualized and developed. AgroFIMS works for controlled trials such as those occurring on agricultural experiment stations, with well-defined and replicated designs. Further, trials implemented by CGIAR scientists are increasingly on farmer fields, with hundreds of farmers, in sites for which location information is unknown prior to data collection. The current version of AgroFIMS cannot accommodate this, as its workflow begins with site specification. Some or several aspects of these trials may be managed by farmers, and data may be collected by enumerators who question farmers on their management practices and are responsible for several tens or more of farmers.
Development efforts for 2021 are therefore focused on exploring the development of ODK forms with key parts of questions or instructions recognized by built-in semantic engines to be part of an ontology. These engines will enable links to proposed ontology terms and URIs that a human can verify. That is, for the question: “Has cassava been grown in the past in this field as a monocrop?” the tool will recognize the standardizable terms of the question (the words in italics), and link these to the correct ontology terms. Through these direct links to data standards, the generated ODK forms and fieldbook will therefore begin to enable standardization of datasets.
The goal for the next version of AgroFIMS is to overcome such current limitations and offer a solution that more fully supports data management. The vision for this improved tool includes data collection that can handle data collection from different agronomic trial types; pipelines to the FAIR workflow currently in alpha version to strengthen user ability to easily address aspects of data accessibilty and reuse, a database integrated with CGIAR's collaborative analytical CG Labs31 environment built on Jupyter notebooks for teams to work together on data processing; access rights and roles at project level; and the possibility to push data to repositories and the GARDIAN discovery portal once project teams are ready to do so. Team members and enumerators will access data collection forms via CG Labs or other sharing platforms, with the goal of ultimately providing access through a single database. Once data is collected by enumerators, they will be able to upload the forms back to CG Labs or any ODK-compliant platform that offers an API for data to be pulled/synced into CG Labs (e.g., ONA32). CG Labs provides easy access to Git repositories, R libraries, crop model pipelines (e.g., WOFOST, Ecocrop, DSSAT), and a large number of data services, including very large (7-10 TB) datasets. This environment therefore makes it easy to clean, process, and analyze data with other team members, interoperating at the same time with other datasets of relevance.
An infrastructure is therefore envisaged by 2022 that allows researchers to design survey forms and fieldbooks, share these with enumerators, and frequently upload and assess the data collected. It will facilitate easy aggregation, processing, analysis and saving of the final dataset to a global database, also allowing easy uploads of well-annotated, interoperable datasets to an institutional or global repository.
The original contributions presented in the study are included in the article/supplementary material, further inquiries can be directed to the corresponding author.
MD conceived the idea based on a data dictionary she developed for her research. OB and IP developed the AgroFIMS backend and user interface. MD and CA established the content of the tool and organized user testing workshops. MA-L investigated linkages with ontologies. M-AL and CA added terms used by the tool to relevant ontologies. All authors brainstormed to help conceptualize key features, navigation, UI, other elements of the tool, and contributed to the final manuscript.
Funding for AgroFIMS was provided by the Bill and Melinda Gates Foundation's Open Access, Open Data Initiative, and the CGIAR Platform for Big Data in Agriculture.
The authors declare that the research was conducted in the absence of any commercial or financial relationships that could be construed as a potential conflict of interest.
All claims expressed in this article are solely those of the authors and do not necessarily represent those of their affiliated organizations, or those of the publisher, the editors and the reviewers. Any product that may be evaluated in this article, or claim that may be made by its manufacturer, is not guaranteed or endorsed by the publisher.
We gratefully acknowledge Pieter Pypers and Meklit Chernet (IITA), Myriam Adam (CIRAD), Cheryl Porter and Christopher Villalobos (University of Florida), Richard Ostler and Aislinn Pearson (Rothamsted Research), Peter Craufurd, Balwinder Singh, and Anurag Ajay (CIMMYT), Robert Hijmans (University of Davis), Elizabeth Arnaud (Alliance Bioversity-CIAT), Abhishek Rathore, Anil Kumar, Sravani Mana and Praveen Reddy (ICRISAT), Sylvain Delerce (CIAT), and Brian Lowe (Ontocale). They provided insight and expertise that greatly assisted the development of the tool. We also thank Brian Pearce (Diversity Arrays Technology) and the Diversity Arrays Technology team for making the KDSmart application compliant with our tool. We are also indebted to our colleagues from CIP: Henry Juarez, Elisa Salas, Raul Eyzaguirre, Vilma Hualla, Peter Juro, and Jazmin Molano who offered their time and support in building the tool.
1. ^https://gardian.bigdata.cgiar.org/metrics.php#!/
3. ^https://bigdata.cgiar.org/
4. ^https://gardian.bigdata.cgiar.org/
6. ^http://www.kddart.org/kdsmart.html
8. ^https://play.google.com/store/apps/details?id=com.fieldbook.tracker&hl=en&gl=US
9. ^https://github.com/AgriculturalSemantics/cg-core
10. ^https://bigdata.cgiar.org/resources/agronomy-ontology/
12. ^http://www.kddart.org/kdsmart.html
13. ^https://play.google.com/store/apps/details?id=com.fieldbook.tracker&hl=en&gl=US
15. ^https://agrofims.github.io/helpdocs/
16. ^https://github.com/AGROFIMS/agrofims-angular-code
17. ^https://github.com/AGROFIMS/ragapi.
18. ^https://bigdata.cgiar.org/resources/agronomy-ontology/
19. ^http://www.obofoundry.org/principles/fp-000-summary.html
20. ^http://www.obofoundry.org/ontology/uo.html
21. ^https://github.com/INCATools/ontology-development-kit
22. ^http://robot.obolibrary.org/
23. ^https://github.com/AgriculturalSemantics/agro
24. ^https://www.ebi.ac.uk/ols/index
25. ^http://agroportal.lirmm.fr/
28. ^https://www.integratedbreeding.net/
29. ^https://breedbase.org/about
Apps, A. (2005). Guidelines for Encoding Bibliographic Citation Information in Dublin CoreTM Metadata. DublinCore. Available online at: https://www.dublincore.org/specifications/dublin-core/dc-citation-guidelines/ (accessed June 9, 2021).
Aubert, C., Benites-Alfaro, O. E., Perez, I., Laporte, M. A., and Devare, M. (2020). AgroFIMS v.2.0—User Manual, 32. Available online at: https://hdl.handle.net/10568/110884
Bodenreider, O., Mitchell, J. A., and McRay, A. T. (2005). “Biomedical Ontologies,” in Pacific Symposium on Biocomputing. Pacific Symposium on Biocomputing, 76–78. Available online at: https://www.ncbi.nlm.nih.gov/pmc/articles/PMC4300097/ (accessed June 9, 2021).
Buttigieg, P. L., Pafilis, E., Lewis, S. E., Schildhauer, M. P., Walls, R. L., and Mungall, C. J. (2016). The environment ontology in 2016: bridging domains with increased scope, semantic density, and interoperation. J. Biomed. Semant. 7:57. doi: 10.1186/s13326-016-0097-6
Cooper, L., Laporte, M.-A., Elser, J., Carollo Blake, V., Sen, T. Z., Mungall, C., et al. (2020). “The plant trait ontology links wheat traits for crop improvement and genomics (Short Paper),” in Proceedings of the 11th International Conference on Biomedical Ontologies (ICBO) Joint with the 10th Workshop on Ontologies and Data in Life Sciences (ODLS) and Part of the Bolzano Summer of Knowledge (BoSK 2020), Virtual Conference Hosted in Bolzano, Italy, September 17, 2020, 1–2. Available online at: http://ceur-ws.org/Vol-2807/abstractT.pdf (accessed June 8, 2021).
Fielding, R. T., and Taylor, R. N. (2002). Principled design of the modern web architecture. ACM Trans. Internet Technol. 2, 115–150. doi: 10.1145/514183.514185
Google, L. L. C. (2020). Angular: A Single Web-Based Application Framework. Available online at: https://angular.io/docs
Hammond, J., Fraval, S., van Etten, J., Suchini, J. G., Mercado, L., Pagella, T., et al. (2017). The rural household multi-indicator survey (RHoMIS) for rapid characterisation of households to inform climate smart agriculture interventions: description and applications in East Africa and Central America. Agric. Syst. 151, 225–233. doi: 10.1016/j.agsy.2016.05.003
Hartung, C., Lerer, A., Anokwa, Y., Tseng, C., Brunette, W., and Borriello, G. (2010). “Open Data Kit: tools to build information services for developing regions,” in Proceedings of the 4th ACM/IEEE International Conference on Information and Communication Technologies and Development, 1–12. ICTD'10. New York, NY: Association for Computing Machinery. doi: 10.1145/2369220.2369236
Hashem, I. A. T., Yaqoob, I., Anuar, N. B., Mokhtar, S., Gani, A., and Khan, S.U. (2015). The rise of “Big Data” on cloud computing: review and open research issues. Inf. Syst. 47, 98–115. doi: 10.1016/j.is.2014.07.006
Jackson, R. C., Balhoff, J. P., Douglass, E., Harris, N. L., Mungall, C. J., and Overton, J. A. (2019). ROBOT: a tool for automating ontology workflows. BMC Bioinform. 20:407. doi: 10.1186/s12859-019-3002-3
Leonelli, S., Smirnoff, N., Moore, J., Cook, C., and Bastow, R. (2013). Making open data work for plant scientists. J. Exp. Bot. 64, 4109–4117. doi: 10.1093/jxb/ert273
Nidhi (2020). “Big data for smart agriculture,” in Smart Village Technology: Concepts and Developments. Modeling and Optimization in Science and Technologies, eds S. Patnaik, S. Sen, and M. S. Mahmoud (Cham: Springer International Publishing), 181–89. doi: 10.1007/978-3-030-37794-6_9
Noy, N., and Mcguinness, D. (2001). Ontology Development 101: A Guide to Creating Your First Ontolog, Vol. 32. Stanford: Knowledge Systems Laboratory
Phatty-Jobe, A. (2020). Digital Agriculture Maps 2020 State of the Sector in Low and Middle-Income Countries. GSMA AgriTech and IDH Farmfit. Available online at: https://www.gsma.com/r/wp-content/uploads/2020/10/GSMA-Agritech-Digital-Agriculture-Maps-2020-1.pdf (accessed May 14, 2021).
Quitzau, A. (2021). “IBM Supercomputer Summit Attacks Coronavirus.” IBM Digital Nordic. IBM Supercomputer Summit Attacks Coronavirus. (blog). Available online at: https://www.ibm.com/blogs/nordic-msp/ibm-supercomputer-summit-attacks-coronavirus/ (accessed on April 7, 2021).
Rife, T. W., and Poland, J. A. (2014). Field book: an open-source application for field data collection on android. Crop Sci. 54, 1624–1627. doi: 10.2135/cropsci2013.08.0579
Semantic Scholar (2021). CORD-19|COVID-19 Open Research Dataset. Available online at: https://www.semanticscholar.org/cord19 (accessed May 2021).
Shrestha, R., Matteis, L., Skofic, M., Portugal, A., McLaren, G., Hyman, G., et al. (2012). Bridging the phenotypic and genetic data useful for integrated breeding through a data annotation using the crop ontology developed by the crop communities of practice. Front. Physiol. 3:326. doi: 10.3389/fphys.2012.00326
Sundmaeker, H., Verdouw, C., Wolfert, J., and Perez Freire, L. (2016). “Internet of Food and Farm 2020,” in Digitising the Industry: Internet of Things Connecting the Physical, Digital and Virtual Worlds, Ovidiu Vermesan and Peter Friess, (River Publishers), 129–150. Available online at: https://research.wur.nl/en/publications/internet-of-food-and-farm-2020 (accessed May 14, 2021).
Tsan, M., Totapally, S., Hailu, M., and Addom, B. (2021). The Digitalisation of African Agriculture Report 2018-2019. CTA. Available online at: https://www.cta.int/en/digitalisation-agriculture-africa (accessed June 9, 2021).
White, J. W., Hunt, L. A., Boote, K. J., Jones, J. W., Koo, J., Kim, S., et al. (2013). Integrated description of agricultural field experiments and production: the ICASA version 2.0 data standards. Comput. Electron. Agric. 96, 1–12. doi: 10.1016/j.compag.2013.04.003
Wilkinson, M. D., Dumontier, M., Aalbersberg, I. J., Appleton, G., Axton, M., Baak, A., et al. (2016). The FAIR guiding principles for scientific data management and stewardship. Sci. Data 3:160018. doi: 10.1038/sdata.2016.18
Keywords: agriculture, fieldbook, standardization, digital, FAIR
Citation: Devare M, Aubert C, Benites Alfaro OE, Perez Masias IO and Laporte M-A (2021) AgroFIMS: A Tool to Enable Digital Collection of Standards-Compliant FAIR Data. Front. Sustain. Food Syst. 5:726646. doi: 10.3389/fsufs.2021.726646
Received: 17 June 2021; Accepted: 06 September 2021;
Published: 11 October 2021.
Edited by:
James Hammond, International Livestock Research Institute (ILRI), KenyaReviewed by:
Richard Coe, World Agroforestry Centre, KenyaCopyright © 2021 Devare, Aubert, Benites Alfaro, Perez Masias and Laporte. This is an open-access article distributed under the terms of the Creative Commons Attribution License (CC BY). The use, distribution or reproduction in other forums is permitted, provided the original author(s) and the copyright owner(s) are credited and that the original publication in this journal is cited, in accordance with accepted academic practice. No use, distribution or reproduction is permitted which does not comply with these terms.
*Correspondence: Medha Devare, bS5kZXZhcmVAY2dpYXIub3Jn
Disclaimer: All claims expressed in this article are solely those of the authors and do not necessarily represent those of their affiliated organizations, or those of the publisher, the editors and the reviewers. Any product that may be evaluated in this article or claim that may be made by its manufacturer is not guaranteed or endorsed by the publisher.
Research integrity at Frontiers
Learn more about the work of our research integrity team to safeguard the quality of each article we publish.