 Pauline Sophie Rummel
 Lukas Beule
 Michael Hemkemeyer
 Sanja Annabell Schwalb3
 Florian Wichern
95% of researchers rate our articles as excellent or good
Learn more about the work of our research integrity team to safeguard the quality of each article we publish.
Find out more
ORIGINAL RESEARCH article
Front. Sustain. Food Syst. , 19 August 2021
Sec. Waste Management in Agroecosystems
Volume 5 - 2021 | https://doi.org/10.3389/fsufs.2021.709993
This article is part of the Research Topic Frass: the Legacy of Larvae – Benefits and Risks of Residues from Insect Production View all 6 articles
Increased global production of animal-based protein results in high greenhouse gas (GHG) emissions and other adverse consequences for human and planetary health. Recently, commercial insect rearing has been claimed a more sustainable source of animal protein. However, this system also leaves residues called frass, which—depending on the insect diet—is rich in carbon (C) and nitrogen (N), and could thus be used as fertilizer in agriculture. The impact of this kind of fertilizer on soil GHG emissions is yet unknown. Therefore, we investigated the effect of black soldier fly (Hermetia illucens L.) frass derived from a carbohydrate (Carb-) or a protein (Prot-) based diet applied at two different application rates to an arable soil on C and N fluxes and microbial properties in a 40-day incubation experiment. CO2, N2O, NO, N2, CH4, water extractable organic C (WEOC), and inorganic N were continuously measured quantitatively. At the end of the incubation, microbial biomass (MB), stoichiometry, community composition, and abundance of functional genes were assessed. Along with a strong increase in WEOC and CO2, Carb-frass caused strong initial N2O emissions associated with high N and C availability. In contrast, Prot-frass showed lower CO2 emissions and N2O release, although soil nitrate levels were higher. At the end of incubation, MB was significantly increased, which was more pronounced following Carb-frass as compared to Prot-frass application, and at higher amendment rates. Fungal abundance increased most from both frass types with an even stronger response at higher application rates, whereas bacterial abundance rose following Carb-frass as compared to Prot-application. Abundance of functional genes related to ammonia-oxidizing bacteria and archaea were enhanced by high frass application but did not clearly differ between frass types. C use efficiency of microorganisms, as revealed by the metabolic quotient, was most strongly reduced in the high Prot-frass application rate. Overall, insect diet influenced available C and N in frass and thus affected mineralization dynamics, GHG emissions, and microbial growth. Overall, emissions were very high undermining the potential environmental benefit of insect based protein production and calling for more detailed analyses before frass is widely applied in agriculture.
Global meat consumption has quintupled during the last five decades due to increasing incomes and population growth (Godfray et al., 2018). To meet the demand of animal feed, insect protein is increasingly used as feedstuff for fish, poultry, pigs, crustaceans, and as pet food. Insects have a good conversion of protein, fast growth rates, and can be reared on a number of different materials including agricultural and food wastes (Berggren et al., 2019). After the larvae have been harvested, a waste product remains. This so-called “frass” is a by-product of insect production consisting of feed for the insects, their shed exoskeletons, and feces. It contains many essential plant nutrients and is considered a potential organic soil amendment or fertilizer to promote plant growth (Barragán-Fonseca et al., 2020; Poveda, 2021).
The chemical composition of frass and its nutrient content mostly depend on the insect species and its diet (Berggren et al., 2019; Poveda et al., 2019; Barragán-Fonseca et al., 2020; Quilliam et al., 2020) with the N concentration of frass being directly proportional to diet N (Fielding et al., 2013). Accordingly, C:N ratios of frass can vary largely from 3.3 (Kagata and Ohgushi, 2012) to 20.1 (Lovett and Ruesink, 1995) depending on insect species and feeding regime. A number of studies has assessed the potential use of frass as organic fertilizer and reported rapid mineralization of nitrogen (N) and carbon (C) from mealworm (Tenebrio molitor L.) (Houben et al., 2020) and grasshopper (Melanoplus borealis FIEBER and Chorthippus curtipennis HARRIS) frass (Fielding et al., 2013). When compared to mineral fertilizers, frass of black soldier fly (Hermetia illucens L.) has produced similar yields in maize (Zea mays L.) (Beesigamukama et al., 2020), cabbage (Brassica oleracea L.) (Choi et al., 2009), ryegrass (Lolium perenne L.) (Klammsteiner et al., 2020), bok choi (Brassica rapa subspec. chinensis (L.) HANELT), lettuce (Lactuca sativa L.), and potatoes (Solanum tuberosum L.) (Temple et al., 2013).
While fast mineralization of organic materials and the resulting release of plant nutrients is beneficial to plant growth, it also increases the risk of nutrient losses to the environment. Organic fertilizers such as slurry and biogas digestate, lead to increased CO2 and N2O emissions after application which has been attributed to the simultaneous application of high amounts of easily available C and N (Köster et al., 2011; Zhu et al., 2015). Application of manure with a larger content of easily degradable organic C substrates tended to generate higher N2O emissions than those with more recalcitrant organic C, confirming that both C and N are major controls of N2O emissions from agricultural soils (Zhou et al., 2017). Increased losses of greenhouse gases from soils after frass application are likely, due to its high share of easily available N and C. Accordingly, increased CO2 and N2O fluxes from forest soil amended with feces of the nun moth (Lymantria monacha L.) or feces and Scots pine needles (Pinus sylvestris L.) have been measured under laboratory conditions (Grüning et al., 2018). Information about CO2 and N2O emissions of frass from commercially reared insects applied to soils is lacking. However, for a complete life cycle assessment and environmental evaluation of protein production from insects, assessment of the CO2 and N2O release is essential.
The rapid mineralization of frass and release of greenhouse gases is facilitated by a growing microbial community after application of easily available N and C from frass to soil. Derived from larval exoskeletons, chitin is one main component of frass. It can serve as an N and C source for soil microorganisms and has been shown to be degraded especially by bacteria (Kielak et al., 2013), whereas fungal chitin degradation has also been observed (Sarathchandra et al., 1996). Recently, frass originating from different commercially reared insect species has been shown to promote fungal over bacterial growth (Watson et al., 2021). The same study also showed an increase in archaeal abundance relative to bacterial abundance for some frass types and application rates and at the same time observed accumulation of , which was believed to derive from archaeal oxidation of ammonium (Watson et al., 2021). Consequently, frass application seems to alter the microbial community composition in soil, which has consequences for N and C fluxes. Thus, the impact of frass on the soil microbial community composition and microbial functions needs to be included in investigations to understand the underlying mechanisms of N and C cycling.
Therefore, this study aimed to assess the risk of greenhouse gas emissions (CO2, N2O, CH4) after application of frass of different qualities and quantities to an agricultural soil. We expected that the chemical quality of frass controls C and N turnover processes in soil and hypothesized (I) that CO2 emissions will increase with increasing availability of organic C (Corg) and (II) highest N2O emissions will occur when both Corg and availability is high. Furthermore, we hypothesized (III) that fungal abundance increases more strongly with higher C availability and (IV) that bacteria in general and bacterial nitrifiers are more abundant when N availability is high.
We set up an automatized incubation experiment under controlled laboratory conditions simulating organic fertilizer application in summer before sowing of the next winter crop. Frass from black soldier fly was applied to an agricultural soil. CO2, N2O, NO, N2, and CH4 fluxes from soil were measured continuously, and soil samples were collected to analyze soil mineral N and Corg dynamics. At the end of the incubation experiment, main soil microbial domains as well as functional genes related to N cycling were analyzed and the microbial biomass (MB) and its stoichiometry was quantitatively assessed.
The soil for the experiment was collected from a field site of the Höhere Landbauschule Rotthalmünster, Germany (latitude N48°21′, longitude E13°11′, elevation 360 m above sea level). It was sieved to 10 mm, air dried, and stored at 4°C until setup of the experiment. The soil was classified as a Haplic Luvisol with a silty loam texture (19% clay, 71% silt, 10% sand). Soil properties were: total C 1.23%, total N 0.14%, C:N 8.76, pH (CaCl2) 6.74. Prior to the experimental setup, soil was rewetted to 50% water-holding capacity (WHC, equivalent to 18.3% gravimetric water content) and preincubated for 4 weeks at 20°C.
For this experiment, we compared two types of frass from black soldier fly (H. illucens) differing in their feeding regime. In the carbohydrate-based feeding regime (Carb), larvae were reared on pre-consumer vegetable wastes; in the protein-based feeding regime (Prot), larvae were reared on brewer's spent grains and spent coffee grounds. Frass was frozen and dried at 70°C for 10 h as it is required for sterilization before application in agriculture.
We applied both frass samples in two application rates: 0.13 g N kg−1 equivalent to 170 kg N ha−1 (−170), the maximum organic fertilization per year according to the German Fertiliser Ordinance (DüV, 2017), based on the EU's Nitrates Directive (Council directive of 12 December 1991 concerning the protection of waters against pollution caused by nitrates from agricultural sources, 2008). The second dose was 0.39 g N kg−1 (equivalent to 510 kg N ha−1, −510), the maximum fertilization rate for compost for a three year period according to the German Fertiliser Ordinance (DüV, 2017). Even when lower amounts of N are used, spots with high fertilization are likely to occur when organic fertilizers are not evenly incorporated on a field site. An overview of treatments and added amounts of N and C is presented in Table 1. A more detailed analysis of nutrients in frass is included in the Supplementary Table 1.

Table 1. Chemical composition of frass types and added amounts of N and C.
The 40 days incubation experiment was carried out under fully controlled conditions using an automated soil incubation system with artificial atmosphere described in detail by Rummel et al. (2021a). Three kg pre-incubated soil (dry mass equivalent) was evenly mixed with frass. Then, soil moisture was adjusted to 70% water-filled pore space (WFPS, equivalent to 75% WHC or 27.4% gravimetric water content) by spraying H2Odest. onto the soil-frass-mixture and thoroughly stirring it with a spoon. The equivalent of 2.5 kg dry soil was filled into acrylic glass pots (inner diameter 172 mm, total height 210 mm) with a porous ceramic plate at the bottom. Soil height in the pots was 8.5 cm, and bulk density was 1.3 g cm−3. The remaining soil-frass-mixture was filled into plastic boxes (bulk density 1.3 g cm−3) and closed with lids. All treatments were replicated four times.
Pots were tightly closed with transparent acrylic glass lids with rubber seals, and the outside of pots was covered with dark plastic sheets to prevent algal growth. To replace headspace atmosphere, pots were alternately evacuated using a rotary vacuum pump (Pfeiffer Vacuum GmbH, Asslar, Germany) and flushed with a gas mixture (82% He, 18% O2) for 12 h. The gas mixture was prepared by using stainless steel capillaries of different length and inner diameter. The outlet of each pot was connected to flow-through multi-position valves (16 ports, Vici Valco Instruments, Houston, TX, USA) with multi-position actuator control modules (Vici Valco Instruments) controlled by Trilution Software (Gilson Inc., Middleton, WI, USA) via an interface module (506C System Interface, Gilson Inc., Middleton, WI, USA). The selected stream outlet tube of the multi-position valve was connected to a gas chromatograph (GC-450, Bruker, Billerica, USA) equipped with a thermal conductivity detector (TCD) for measurement of CO2, O2, and high concentrations of N2O, and a pulsed discharge detector (PDD, Vici AG International, Schenkon, Switzerland) for measurement of N2O, N2, and CH4. The sample gas outlet of the GC was connected to a flow-through massflowmeter (Alicat Scientific, Tucson, AZ, USA), and a trace-level gas analyzer (CLD 88Yp, Eco Physics AG, Dürnten, Switzerland) equipped with a chemoluminescence detector (CLD) to analyze NO concentrations. During the incubation experiment, the headspace of the pots was flushed at a flow rate of ~40 ml min−1. To add up to the required 300-mL-flow of the NO analyzer, samples were diluted with synthetic air. Processing of GC data was done using CompassCDS software (SCION Instruments, Livingston, UK). Data from the NO analyzer and flowmeter were read out every 10 sec via a serial port. The analytical precision of the GC was determined by repeated measurements of standard gases (CO2, N2O, N2, CH4) and was consistently <2%. Detection limits were 0.2 μg N2O-N kg−1 h−1, 1.1 μg N2-N kg−1 h−1, and 0.4 μg CH4–C kg−1 h−1.
One pot was not airtight leading to drying out of soil and non-evaluable measurements. Therefore, treatment Prot-170 only had three replicates for gas measurements and final soil sampling.
Samples of pre-incubated soil were taken prior to experimental setup. After opening pots at the end of the experiment, soil from each pot was homogenized and a sample was taken for analyses. During the incubation experiment, soil samples were taken from the plastic boxes every 2–5 days. Subsamples were analyzed for soil mineral N, water-extractable Corg (WEOC), and soil water content. For analysis of mineral N (, , and ), fresh soil was extracted with 2 M KCl solution (1:4 w:v) for 60 min. The pH of the extraction solution was adjusted to pH = 7 by addition of 0.1% 2 M KOH. Samples were filtered with 615 ¼ filter paper (Macherey—Nagel GmbH and Co. KG, Düren, Germany) and extracts were analyzed colorimetrically using the San++Continuous-Flow Analyzer (Skalar Analytical B.V., Breda, The Netherlands). To determine WEOC, fresh soil was homogenized with H2Obidest (1:5 w:v) (Burford and Bremner, 1975). Samples were centrifuged, filtered with 0.45 μm polyether sulfone filters (Labsolute, Renningen, Germany), and stored at −20°C. The extracts were analyzed for organic C and total N content using a multi N/C® 2100 S Analyzer (Analytik Jena, Jena, Germany). Soil water content was determined by oven drying at 105°C. Soil pH was measured in 0.0125 M CaCl2 solution.
C and N in microbial biomass (MBC and MBN respectively) was estimated using the chloroform fumigation extraction (CFE) method from a subsample of fresh 2 mm-sieved soil (Brookes et al., 1985; Vance et al., 1987; Joergensen and Brookes, 2005). Subsamples of 10 g of fresh soil were used as non-fumigated sample (nF), a second was fumigated (FUM), and a third was oven dried at 105°C for dry matter analysis. nF and FUM samples were extracted with 0.5 M K2SO4 (1:4 w/v) and filtered. Extracts were analyzed for total organic C (TOC) and total N (tN) using a multi N/C® 2100 S Analyzer. MBC is calculated as the difference between the organic C in the extracts of fumigated and non-fumigated soils divided by a constant conversion factor kEC = 0.45 (Vance et al., 1987; Joergensen, 1996) to account for non-extractable fractions of MBC:
MBN is calculated as the difference of total N extracted from fumigated and non-fumigated soils divided by a constant conversion factor kEN = 0.54 (Brookes et al., 1985; Joergensen and Mueller, 1996) to account for non-extractable fractions of MBN:
Microbial elements beyond C and N, such as P, S, K, Na, Mg, Fe, Mn, and Cu (collectively referred to as MBX) were estimated based on the same principle as MBC and MBN using CFE with extraction in 0.01 M CaCl2 (1:20 w/v) for one hour at 200 rev min−1 (HS 501 digital, IDA), followed by filtration (2-3 μm particle retention, qualitative filter paper 305, VWR International GmbH, Darmstadt, Germany) and subsequent analysis in an inductively coupled argon plasma optical emission spectrometer (ICP-OES, Optima 8000; Perkin Elmer, Waltham, USA) in combination with the WinLab32 Software (Version 5.5.0.0714, Perkin Elmer). Conversion factors for MBX are not yet available. No microbial B, Cd, Co, Mo, Ni, Se, Si, V, and Zn fractions were detectable.
Soil DNA was extracted from fresh, 2 mm-sieved soil with the FastDNA® Spin Kit for Soil (MP Biomedicals, Santa Ana, USA) following the manufacturer's instructions but with modifications according to Hemkemeyer et al. (2014). Briefly, 0.5 g fresh soil was bead beaten twice at 6.5 m s−1 for 45 s in a FastPrep® Instrument (MP Biomedicals) and subsequently centrifuged at 14,000 × g. After protein precipitation of the supernatant, the solution was mixed with binding matrix, which, in addition, was washed twice with 1 ml 5.5 M guanidine thiocyanate (Carl Roth, Karlsruhe, Germany) in order to remove soil contaminants. After transfer to spin filters and washing twice with kit-derived “SWS-M,” DNA was eluted with 100 μl PCR-grade water (kit's “DES”). Subsequently the eluate was added back to the binding matrix and centrifuged again to increase DNA elution yield. Soil DNA extracts were tested for PCR inhibitors using a DNA amplification inhibition test as described previously by Guerra et al. (2020) and diluted fifty-fold prior to quantitative real-time PCR (qPCR).
Quantification of microbial domains/kingdoms was done targeting the Internal Transcribed Spacer 1 region (ITS1) for fungal quantification and the small ribosomal subunit (16S rRNA) for quantification of bacteria and archaea. Cloning fragments for bacterial and archaeal qPCR standards originated from the following species Bacillus subtilis (bacteria) and Methanobacterium oryzae (archaea) and were produced from DNA via conventional PCR with the primers F27 and 1391R (bacteria; Lane, 1991; Blackwood et al., 2005, respectively) and A109f and Ar1384r (archaea; Großkopf et al., 1998; Lueders et al., 2004, respectively). Plasmids containing the cloning fragment were produced by molecular cloning with the pGEM®-T Vector System II Kit (Promega Corporation, Madison, USA) utilizing Escherichia coli JM109 High Efficiency Competent Cells. Plasmid purification from transformed cells was done with the HiYield® Plasmid Mini DNA Kit (Süd-Laborbedarf GmbH). Standard serial dilutions were made as follows: 1 × 10⁸−1 × 10² copies μl−1 (bacteria), and 1 × 10⁷−1 × 101 copies μl−1 (archaea). Fungal qPCR standards were produced via conventional PCR with the primers NSA3 and NLC2 (Martin and Rygiewicz, 2005) using the fungal species Metarhizium brunneum, and directly used in the qPCR omitting the molecular cloning step. The serial dilution for the fungal standards was 1 × 10⁸−1 × 101 copies μl−1. Detection of microbial domains/kingdoms was performed in duplicates with a sample dilution of 1:50 in a Light Cycler® 480 Instrument II (Roche Diagnostics, Mannheim, Germany) with a total reaction volume of 20 μl containing 2 μl of the 1:50 diluted sample volume. Fungal ITS1 region amplification was performed using the primers NSI1 and 58A2R (0.4 μM) (Martin and Rygiewicz, 2005) in a SYBR Green I HRM dye system (1 × concentrated, LightCycler® 480 SYBR Green I Master, Roche Diagnostics). Cycling conditions were as follows: Initial denaturing at 95°C for 10 min, followed by 40 amplification cycles of denaturing at 95°C for 15 s, annealing at 52°C for 30 s, extension at 72°C for 30 s and fluorescence acquisition at 79°C for 15 s. Melt curve analysis was done by initial denaturing at 95°C for 15 s, followed by annealing at 60°C for 60 s and a final melting step up to 95°C in 0.11°C s−1 increments with 5 acquisitions °C−1. Bacterial 16S rRNA amplification was done using the primers BAC338F and BAC805R (0.5 μM) in combination with the probe BAC516F (0.2 μM), for archaeal 16S rRNA the primers ARC787F and ARC1059R (0.5 μM) and the probe ARC915F (0.2 μM) were used (Yu et al., 2005). For bacterial and archaeal qPCRs the LightCycler® 480 Probes Master (1x concentrated, Roche Diagnostics) was used. Cycling conditions for bacterial and archaeal 16S rRNA amplification were the same: Initial denaturing at 95°C for 10 min, followed by 45 cycles of denaturing at 95°C for 15 s, annealing at 60°C for 50 s and an extension and acquisition step at 72°C for 1 s. Ammonia-oxidizing archaea (AOA) and bacteria (AOB) amoA, nirK, nirS, nosZ clade I and II genes were quantified using qPCR. Amplifications were performed in 4 μl reaction volumes in a CFX 384 Thermocycler (Biorad, Rüdigheim, Germany). Primers used, the composition of the reaction volumes, and the thermocycling conditions correspond to those of Beule et al. (2019).
For all calculations and statistical analyses, the statistical software R (R Core Team, 2019) was used. Fluxes of CO2, N2O, N2, and NO (F, μg kg−1 h−1) were calculated using the dynamic chamber approach:
where Co is the concentration at the outflow and Ci is the concentration at the inflow of each vessel (mg N m−3, or mg C m−3), Q is the flow rate through the headspace (m3 h−1) and m is the dry mass of soil per vessel (kg).
Mean fluxes and standard deviations were calculated using the SlidingWindow function from the package evobiR v.1.1 (Blackmon and Adams, 2015). Cumulative emissions were calculated by interpolation between measured fluxes. To test for differences between treatments, a one-way ANOVA was calculated when data was normally distributed or the Kruskal-Wallis rank sum test for non-normally distributed data followed by the LSD post-hoc test at p ≤ 0.05. Simple linear regression models were tested to analyze the relationship between CO2, N2O, NO, and N2 fluxes. To analyze the effect of soil C and N availability on CO2 and N2O fluxes, regression models were fitted between soil , , and WEOC content and mean daily CO2 and N2O fluxes on soil sampling days. Due to the very strong differences in flux dynamics before and after 5 DAO (days after onset of incubation), regression models were tested separately for the whole incubation period and the incubation period after 5 DAO. In all plots, color schemes from the R package viridisLite v0.3.0 (Garnier, 2018) were used.
Net mineralization was calculated as the difference in mineral N before and at the end of the incubation experiment and cumulative gaseous N losses:
Emission factors were calculated for CO2 and N2O losses:
Where ETreatment are the mean cumulative CO2 or N2O emissions (mg kg−1) from the respective treatment, EControl are the mean cumulative CO2 or N2O emissions from the Control (mg kg−1), and Input is the amount of N or C that was added with frass (mg kg−1).
The metabolic quotient (qCO2) was calculated from the average daily basal respiration of the last seven days of incubation, as the quotient of mg CO2-C d−1 kg−1 soil dry matter and the microbial biomass carbon (g MBC kg−1 soil dry matter) at the end of incubation, and is expressed as mg CO2-C g−1 MBC.
Microbial biomass elements, metabolic quotient, and molecular data were checked for homoscedasticity and normal distribution using residual-vs.-fitted- and q-q-plots, respectively. If necessary, data were Box-Cox-transformed using R package MASS (Venables and Ripley, 2002) prior to calculating one-way ANOVA using car (Fox and Weisberg, 2011). If requirements were still not met, the Kruskal-Wallis test was performed. As post hoc tests either estimated marginal means using eammeans (Lenth, 2019) or Dunn test using FSA (Ogle et al., 2018) were employed and supported by cld command from multcomp (Hothorn et al., 2008) and cldList command from rcompanion (Mangiafico, 2018), respectively.
Chemical composition of frass types controlled C and N mineralization dynamics. Water extractable organic C (WEOC) content increased directly after addition of frass to soil (Figure 1). WEOC content was highest in Carb-170 and Carb-510, reaching maximum values of 120 and 301 mg C kg−1 on 2 DAO, respectively, then rapidly decreased. WEOC dynamics then followed a similar pattern in all treatments with smaller increases between 16 and 24 DAO and after 33 DAO.
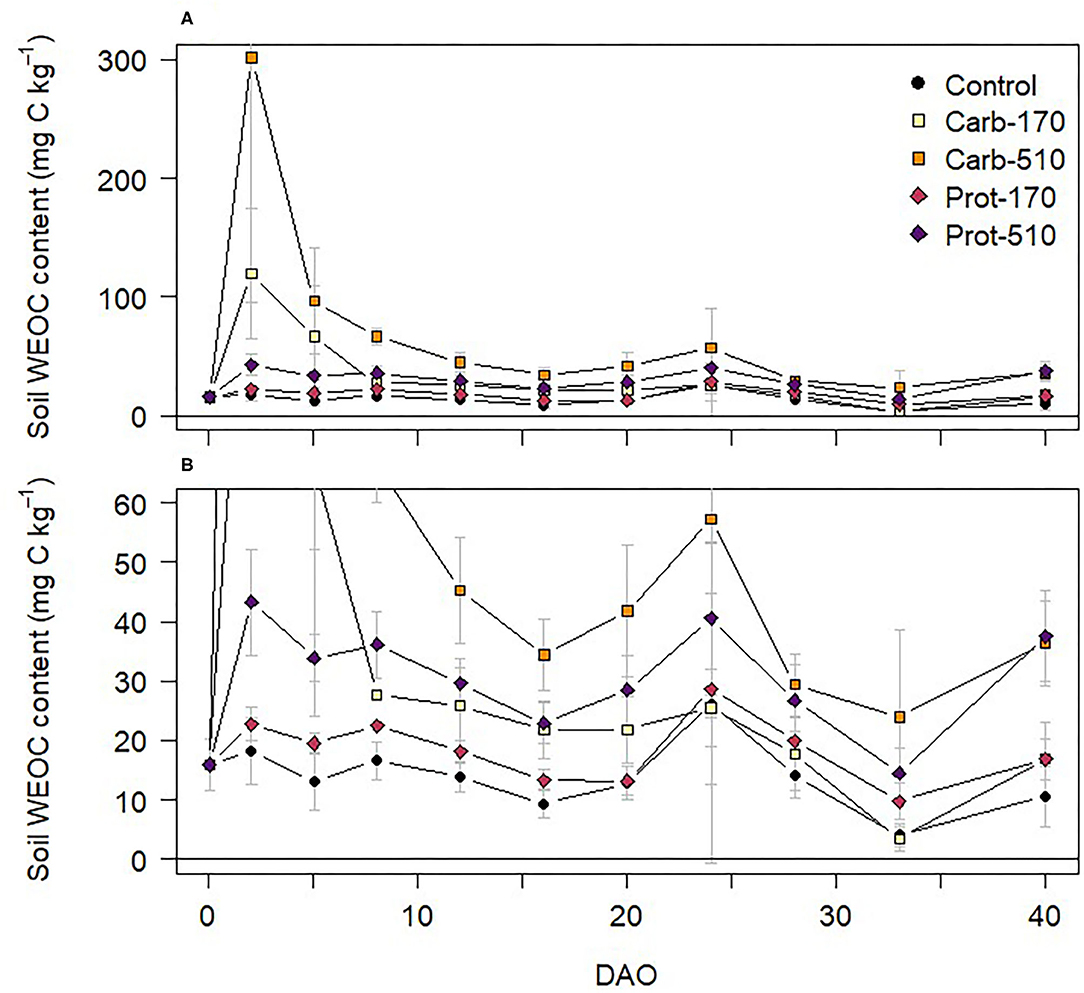
Figure 1. (A,B) Water-extractable organic C (WEOC) content in soil during the incubation experiment (mean ± standard deviation for n = 4, for Prot-170 n = 3). Data of (B) are excerpts from (A) and are shown with a different scaling.
Soil mineral N content was 42.68 mg -N kg−1 and 0.58 mg -N kg−1 at onset of the incubation experiment (Figure 2). In the unamended Control treatment, soil content stayed on a similar level throughout the experiment. Both frass types had contrasting effects on soil mineral N dynamics. In treatments amended with Prot-170 and Prot-510, soil content increased after frass application, reaching maximum values in Prot-510 on 8 DAO. In Carb-170 and Carb-510, soil content decreased after frass application and was below detection on 2 and 5 DAO in Carb-170. Toward the end of the incubation experiment, soil content increased in Carb-treatments.
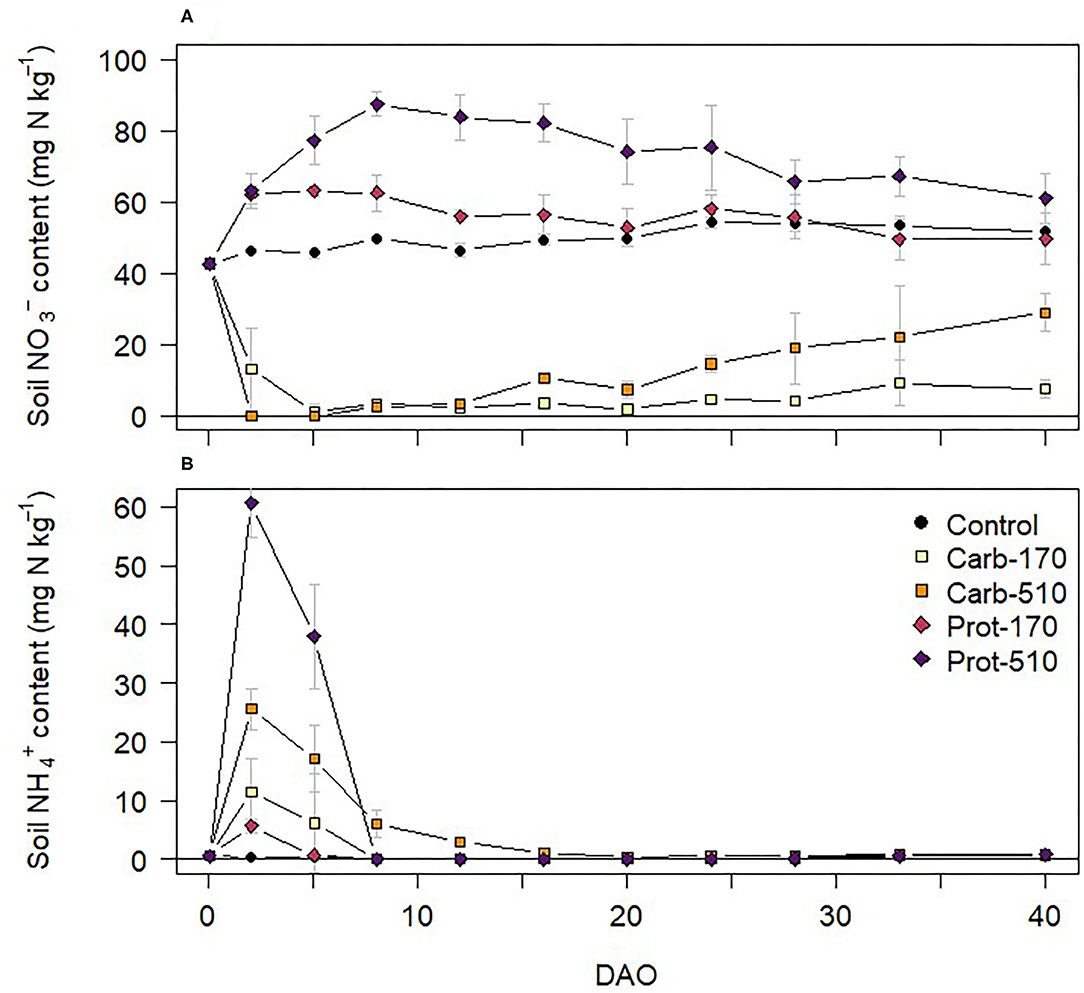
Figure 2. (A) and (B) content in soil during the incubation experiment (mean ± standard deviation for n = 4, for Prot-170 n = 3).
Soil content increased in all frass treatments directly after onset of incubation (Figure 2B). Highest content was measured in the treatments with triple frass addition (Carb-510, Prot-510) on 2 and 5 DAO, after which soil decreased below detection limits (<0.16 mg N kg−1). Toward the end of the incubation experiment, content slightly increased in all treatments reaching values around 1 mg N kg −1. content was below detection (<1.16 mg N kg−1) in all treatments at all sampling dates.
In Control, Carb-170, and Prot-170, there was slight net N immobilization (−6 to −3 mg kg−1), while addition of Carb-510 and Prot-510 led to net N mineralization (41 and 10 mg N kg−1, respectively, Table 2).
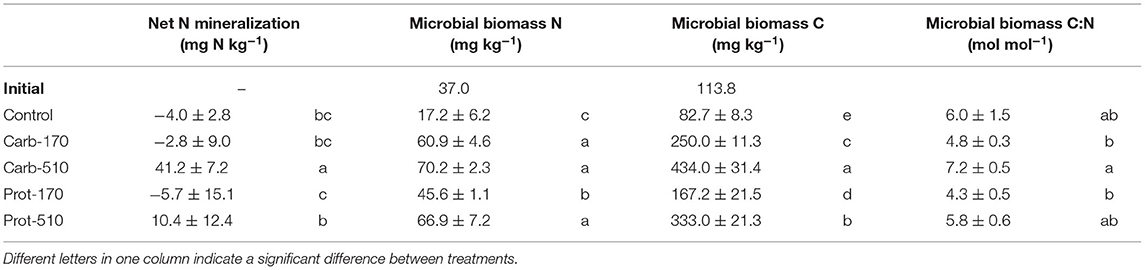
Table 2. Microbial biomass and net N mineralization (mean ± standard deviation for n = 4, net mineralization for Prot-170 n = 3).
CO2 fluxes from soil were higher in all frass treatments compared to the unamended Control treatment (Figure 3). In Control, CO2 fluxes of around 0.1 mg CO2-C kg−1 h−1 were constant throughout the incubation experiment. The highest CO2 fluxes (11 mg CO2-C kg−1 h−1) were measured in Carb-510 during the first days after onset of incubation. After the initial peak, CO2 fluxes decreased throughout the incubation experiment in all treatments. CO2 fluxes from Carb-510 and Carb-170 were higher than from Prot-510 and Prot-170, respectively. CO2 fluxes were positively correlated with soil WEOC content over the total incubation period (R2 = 0.8, p < 0.001).
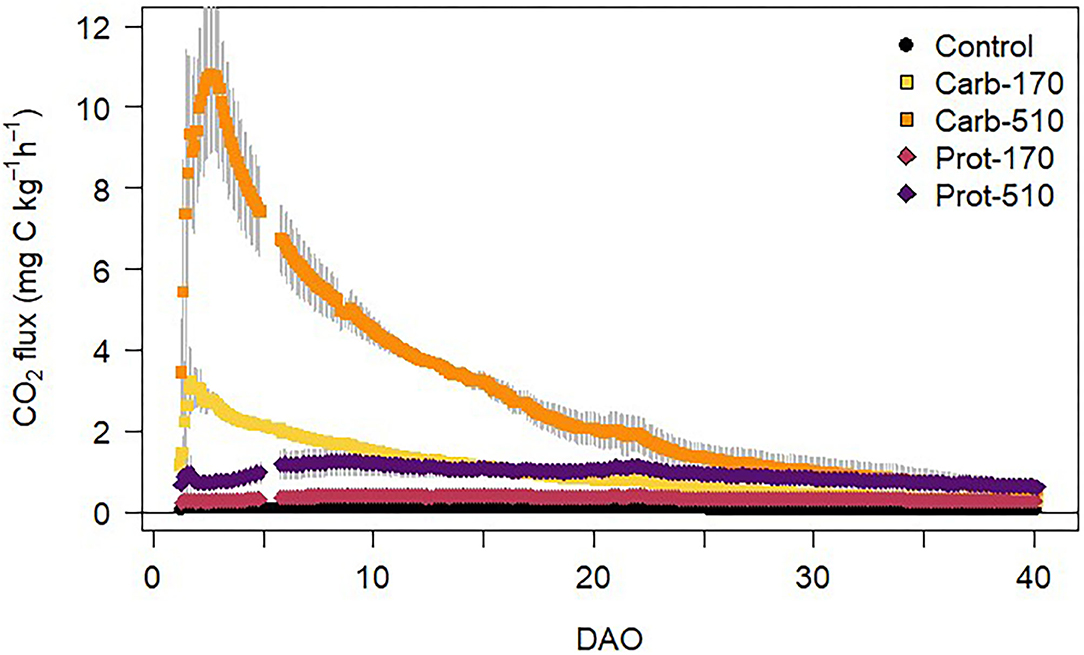
Figure 3. CO2 fluxes from soil during the incubation experiment (mean ± standard deviation for n = 4, for Prot-170 n = 3).
Cumulative CO2 emissions were higher in frass-amended treatments compared to the unamended Control treatment and higher in the treatments with higher frass input (Table 3). When triple amounts of C were added, cumulative CO2 emissions increased by a factor of 2.8–2.9 for both frass types. Accordingly, emission factors (EF) for C lost as CO2 were stable within one frass type but about three times higher in Carb than in Prot (EF: 13–13.5% and 4.5–5%, respectively). Cumulative CO2 emissions were positively correlated with MBC at the end of the experiment (Supplementary Figure 4A).
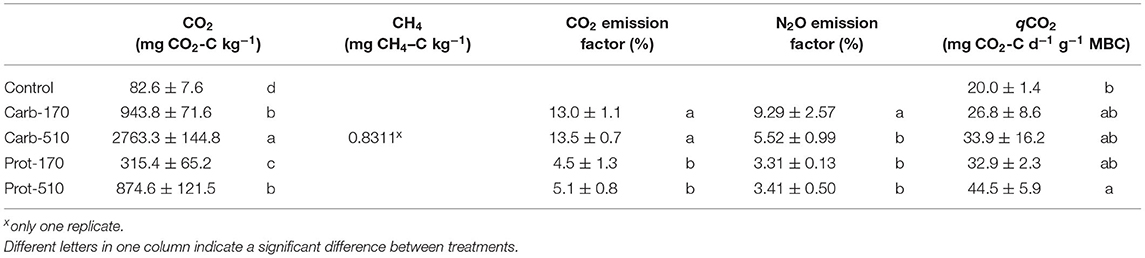
Table 3. CO2, CH4 emissions, emission factors for N2O and CO2, and CO2 emissions per unit of microbial biomass (qCO2) (mean ± standard deviation for n = 4, net mineralization for Prot-170 n = 3).
In one replicate of Carb-510, CH4 fluxes were measured from 27 to 30 DAO reaching maximum fluxes of 4.2 μg CH4–C kg−1 h−1 and 0.83 mg CH4–C kg−1 in total (Supplementary Figure 1).
N2O fluxes increased in all treatments immediately after onset of incubation reaching maximum fluxes within 48 h after frass addition and then decreased rapidly (Figure 4A). In Carb-510, N2O fluxes ranged between 1 and 2 mg N2O-N kg−1 h−1 for a short period of less than 24 h and in Carb-170, maximum N2O fluxes were 0.8 mg N2O-N kg−1 h−1. In contrast, in Prot-170 and Prot-510, maximum N2O fluxes were 0.3 mg N2O-N kg−1 h−1. In the unamended Control treatment, N2O fluxes decreased after its initial peak until 10 DAO after which they were close to zero (Figure 4B). In the frass-amended treatments, N2O fluxes stayed on a similar level in Carb-170 and Prot-170 after 5 DAO. In Prot-510, N2O fluxes increased again to ~12 μg N2O-N kg−1 h−1 until 22 DAO after which they decreased until the end of the incubation experiment. In Carb-510, N2O fluxes increased after 10 DAO with small peaks around 17-20 DAO and 33 DAO.
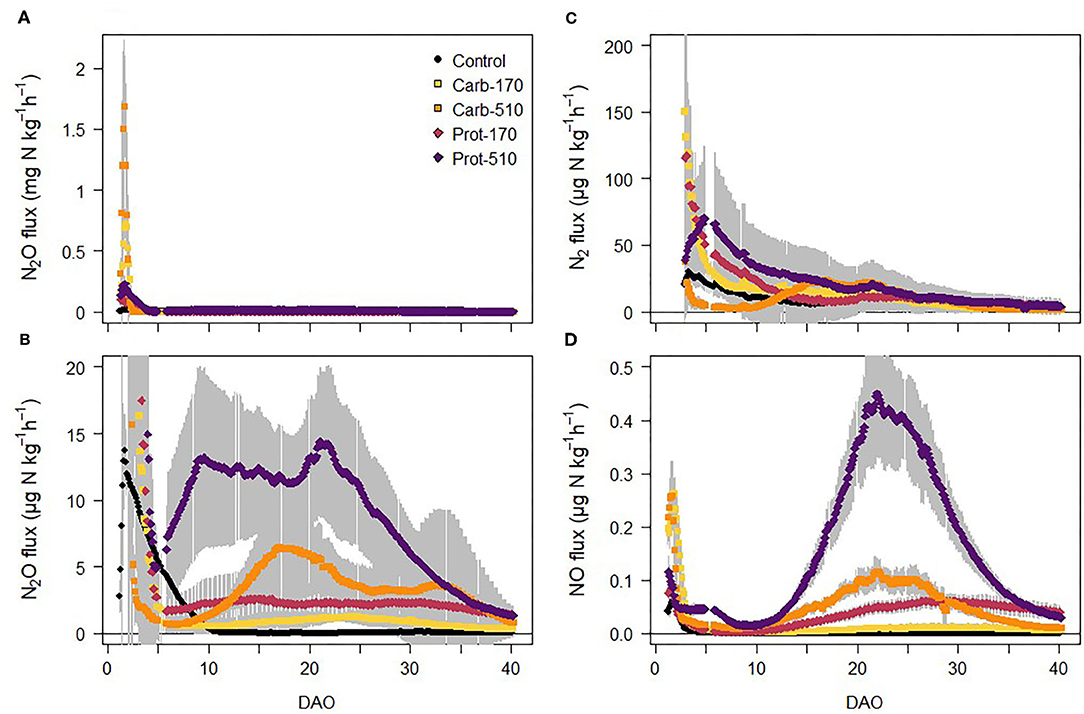
Figure 4. (A,B) N2O fluxes, (C) N2 fluxes, and (D) NO fluxes from soil during the incubation experiment (mean ± standard deviation for n = 4, for Prot-170 n = 3).
NO fluxes followed similar patterns as N2O fluxes, but on a much lower scale (Figure 4C). NO fluxes showed a first peak directly after onset of incubation with a subsequent decrease to values <0.1 μg NO-N kg−1 h−1 in most treatments. In Prot-510, NO fluxes increased after 10 DAO reaching highest values of ~0.45 μg NO-N kg−1 h−1 around 20 DAO. After 5 DAO, NO fluxes showed a strong positive relationship with N2O fluxes (R2 = 0.45, p < 0.001). Measurements of N2 fluxes were started 48 h after onset of incubation to avoid contamination with N2 of the soil air. In Carb-170, Prot-170, and Control, N2 fluxes decreased throughout the incubation experiment (Figure 4D). N2 fluxes increased in Prot-510, where they peaked around 5 DAO. In Carb-510, N2 fluxes were lowest from 4 to 10 DAO, after which they increased to a similar level as Prot-510.
Cumulative N2O emissions were higher in all frass-amended treatments compared to the Control (Table 4). During the first 5 days, cumulative N2O losses were highest in Carb-510 and Carb-170, while cumulative N2O losses were highest in Prot-510 and Prot-170 from 5 DAO until the end of the incubation experiment. Over the whole incubation period, cumulative N2O losses were highest in Carb-510. Losses from −510 treatments were always higher compared to the −170 treatments. The N2O EF was highest for Carb-170 and Carb-510 (EF = 9.3% and 5.5%, respectively). For Prot-170 and Prot-510, EF did not change with added amounts and was 3.3–3.4%.
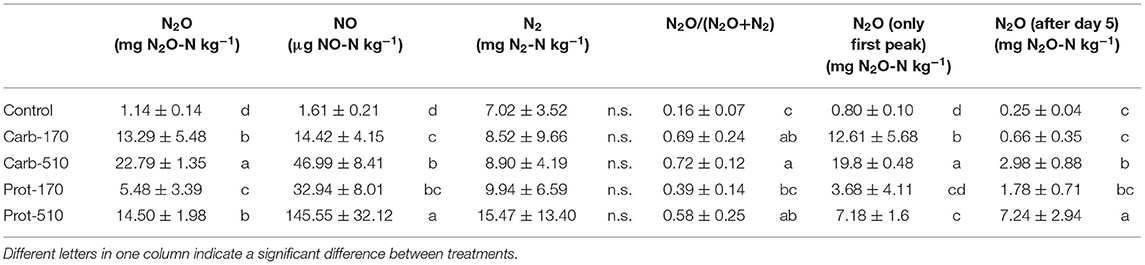
Table 4. Cumulative N gas emissions (mean ± standard deviation for n = 4, for Prot-170 n = 3).
Cumulative NO emissions were higher in frass-amended treatments than in the Control with highest NO losses in Prot-510. NO losses from −510 treatments were always higher compared to −170 treatments. Differences between cumulative N2 losses were small and not statistically significant.
At the end of the incubation, microbial biomass C and N (MBC, MBN) were higher in frass-amended soils compared to the Control (Table 2, Supplementary Figures 2A,B). Treatments that received 510 kg N ha−1 of frass showed four to five-fold higher MBC, those with 170 kg N were two to three-fold higher (Table 2). Carb-treatments had higher MBC, than Prot-treatments. MBN was about 3 to 4 times higher compared to the Control, but differences between frass amendments were less pronounced (Table 2). Interestingly, within frass amendments higher application rates led to higher molar microbial biomass C:N though this was not always significant (Table 2, Supplementary Figure 2C).
Compared to the Control, frass addition with 170 kg N ha−1 increased the abundance of bacteria and fungi 1.5- and seven-fold, respectively (Supplementary Figure 3; Supplementary Table 2). Frass addition to supply 510 kg ha−1 of frass-N, led also to a three-fold higher fungal abundance compared to 170 kg N ha−1, while in the case of bacteria this was just 1.5-fold. Accordingly, the fungi-to-bacteria ratio increased following frass application and was highest in treatments with 510 kg N ha−1 (Figure 5A). In contrast, archaea did not respond to frass addition at all (Supplementary Figure 3B) and, thus, the archaea-to-bacteria ratio decreased. This decline was stronger in carbohydrate-based treatments (Figure 5B). The same patterns were reflected by bacterial and archaeal amoA gene copy numbers though less pronounced (Figure 5C).
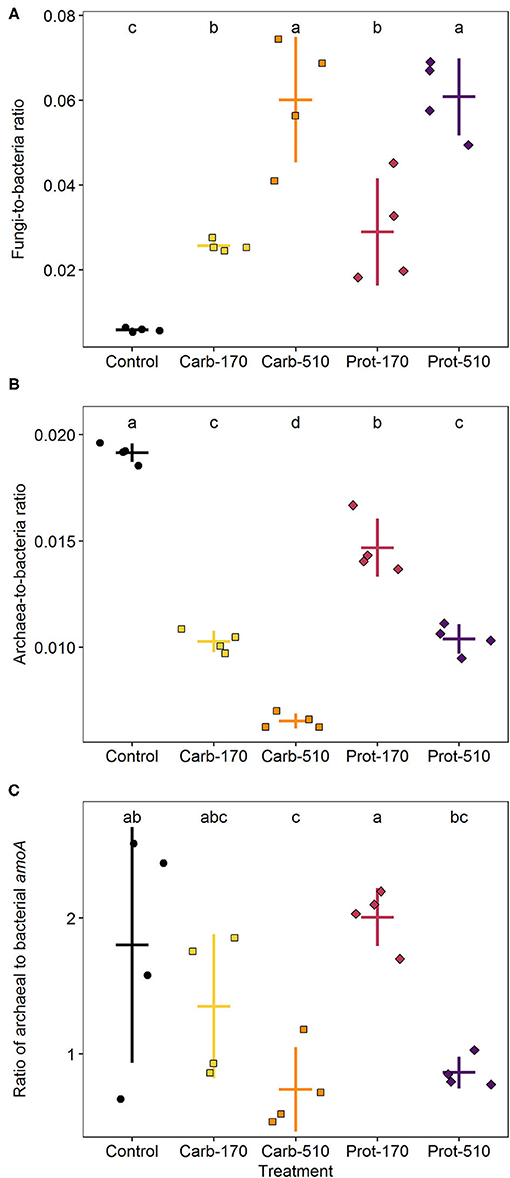
Figure 5. Ratios of fungi to bacteria (A), archaea to bacteria (B), and archaeal to bacterial amoA gene copies (C) at the end of incubation. Means ± standard deviation (n = 4) and letters indicating significant differences (for statistical data see Supplementary Table 2) are shown.
AOA amoA were not affected by the addition of frass, whereas gene copy numbers of AOB amoA were promoted by the Carb-510 treatment as compared to the Control (Figures 6A,B; Supplementary Table 2). The copies of nirK genes doubled in both treatments that added 510 kg N ha−1 compared to Control (Figure 6C). The copies of nirS genes were only promoted by frass obtained from the carbohydrate-based feeding regime at both concentrations, where their abundance increased about five-fold (Figure 6D). Though the higher application rate of protein-based frass led to two-fold higher abundances, this was not reflected in the Dunn test. All four treatments increased nosZ clade I gene copies. The treatments with 510 kg N ha−1 showed 2.6-fold higher nosZ clade I gene abundance, while in the treatments with 170 kg N ha−1 this was 2.1-fold (Figure 6E). Gene copies of nosZ clade II were promoted in the Carb-510 treatments as compared to the Control without frass addition (Figure 6F).
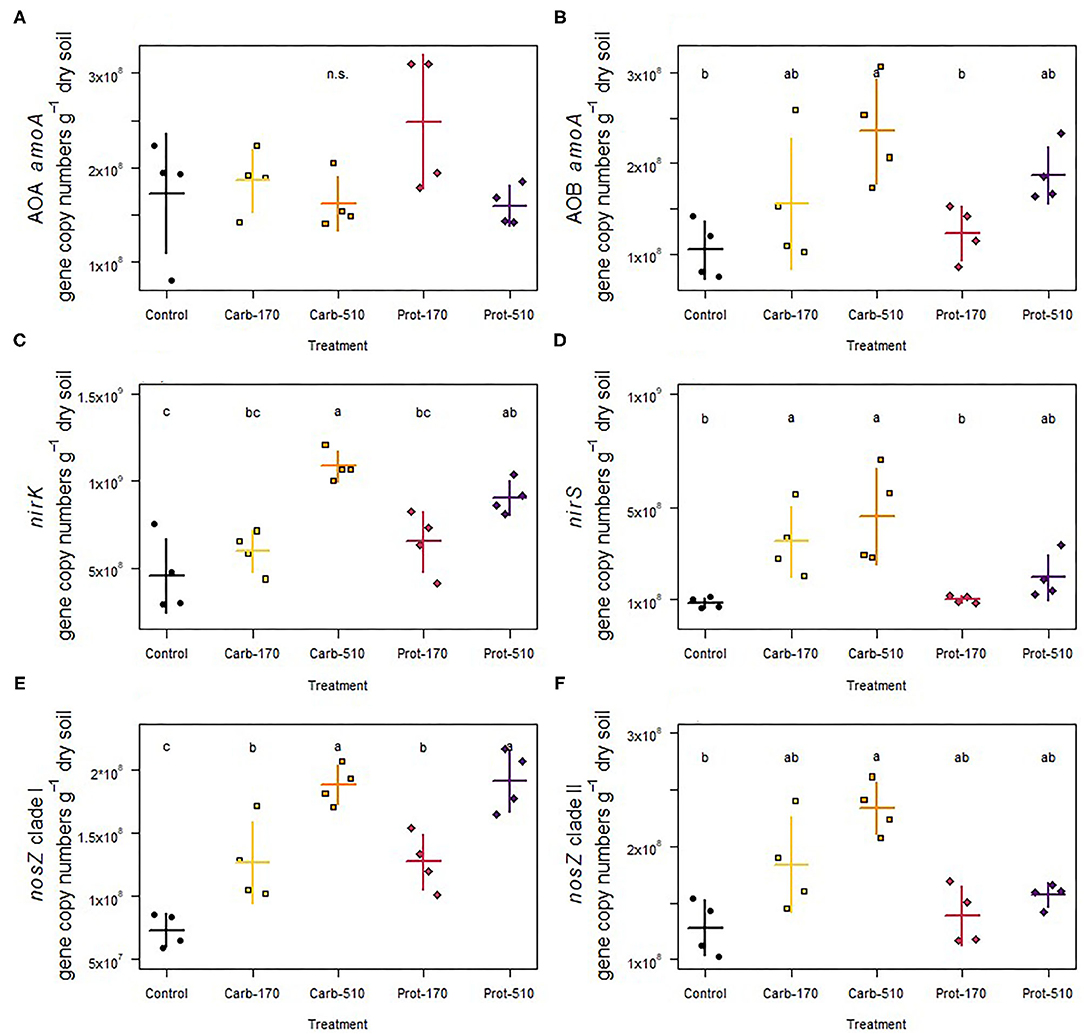
Figure 6. (A,B) Abundance of functional genes involved in ammonia oxidation, (C,D) nitrite reduction, and (E,F) nitrous oxide reduction. Means ± standard deviation (n = 4) and letters indicating significant differences (for statistical data see Supplementary Table 2) are shown.
Cumulative soil CO2 and N2O emissions were positively correlated with measurements of soil microbial population size (i.e., MBC, MBN, bacterial 16S rRNA, and fungal ITS gene abundance) (Supplementary Figures 4, 5). Furthermore, increased cumulative soil N2O emissions were associated with increased denitrifier gene abundance (i.e., nir and nos genes) (r = 0.73–0.79, p ≤ 0.0005).
The Prot-510 treatment had the highest mean CO2-C emissions per unit of microbial biomass carbon (qCO2) and the control treatment had the lowest, with the other treatments being intermediate between the two, but not being statistically separable from the control and Prot-510 treatments by the estimated marginal means post-hoc test (Table 3; Supplementary Table 2).
Further chloroform-labile elements derived from the microbial biomass were P, S, K, Na, Mg, Fe, Mn, and Cu, which broadly followed CaCl2-extractable elements (Supplementary Tables 3 and 3.1). Accordingly, MBP followed the pattern of available P with highest MBP in Prot-510 followed by Prot-170 (Supplementary Table 3.1). MBS was significantly increased in the Carb-170 and Prot-510 treatments compared to the control, with Carb-510 and Prot-170 being intermediate. MBK and MBMg did not differ significantly between treatments, whereas MBNa was highest in the two Carb treatments, but the Dunn post hoc test was unable to discern any differences (Supplementary Table 3.1). MBFe was only measurable in the Carb-510 treatment, similarly to MBCu, which was mainly measurable in the Carb-510 treatment, but also in two replicates of the Carb-170 and Prot-510 treatments (Supplementary Table 3.1). MBMn was significantly increased in the Carb-510 treatment, on average thirteen-fold compared to the other treatments (Supplementary Table 3.1). The MB-C:N ratio was highest in the Carb-510 treatment, followed by the control and Prot-510 treatments, and was lowest in both 170 kg N ha−1 application treatments (Supplementary Table 3.2). The MB-C:P ratio was highest in the Carb-510 treatment and decreased in the order > Carb-170 > Prot-510 > Prot-170 > Control treatment (Supplementary Table 3.2). The MB-C:S ratio was also highest in the Carb-510 treatment, followed by the control and was lowest in the remaining treatments (Supplementary Table 3.2). MB-C:K, MB-C:Na and MB-C:Mg did not differ significantly between treatments (Supplementary Table 3.2). The MB-C:Mn ratio was significantly reduced in the Carb-510 treatment compared to all other treatments (Supplementary Table 3.2).
The chemical composition of black soldier fly frass is largely dependent on the insects' feeding regime and diet N content (Fielding et al., 2013; Barragán-Fonseca et al., 2020; Quilliam et al., 2020). The two frass types compared in this incubation study were obtained from different feeding systems, a carbohydrate-based diet (Carb-) and a protein-based diet (Prot-). Prot-samples had a higher total N content and lower C:N ratio compared to the carbohydrate-based feeding system (Carb-) leading to strong differences in N mineralization dynamics between both frass types. In the Prot-treatment, low C:N ratio of frass led to mineralization and nitrification of organic N and increasing soil and content. The effect was stronger with higher N application rate in Prot-510 than in Prot-170. In the Carb-treatments, soil content increased immediately after incorporation of frass to soil, while content decreased leading to net N immobilization. C:N ratio of organic material is known to be a primary control whether N is mineralized or immobilized during decomposition (Robertson and Groffman, 2015). Accordingly, both rapid N mineralization (Temple et al., 2013; Houben et al., 2020; Klammsteiner et al., 2020) and N immobilization (Lovett and Ruesink, 1995; Kagata and Ohgushi, 2013) have been reported after frass application depending on frass C:N ratio. However, we measured net N immobilization in Control, Carb-170, and Prot-170 and net N mineralization in Carb-510 and Prot-510 over the whole incubation period of 40 days irrespective of frass C:N ratio.
C mineralization dynamics depended on both amount of C input and C quality. Carb-frass was characterized by a high share of water-soluble Corg leading to increases in water-extractable organic C (WEOC) content in soil directly after application with higher values in Carb-510 than Carb-170. A similar effect was visible in Prot-treatments, but on a much lower level, which is consistent with the very low content of water-soluble Corg in the Prot-frass. Water-soluble C compounds are the first to be leached from decomposing organic material and are directly available for soil microorganisms (Kögel-Knabner, 2002). High shares of soluble and labile Corg and high C mineralization rates have been reported for mealworm, gypsy moth, and grasshopper frass (Christenson et al., 2002; Fielding et al., 2013; Houben et al., 2020). Accordingly, soil CO2 fluxes increased strongly in frass amended treatments and showed similar dynamics as WEOC. The very good correlation between CO2 fluxes and WEOC content confirms that C quality was the main driver of C turnover. C addition was slightly higher in Carb treatments than in Prot-treatments, as frass addition was based on providing equal amounts of N. To compare the amount of C lost as CO2 irrespective of C input, CO2 emission factors can be used. In our study, CO2 emission factors were similar within one frass treatment and roughly 2.5 times higher for Carb- than Prot-frass, confirming that C quality was most important in controlling C mineralization and turnover in our study. Thus, our results confirm that diet is a crucial factor controlling chemical composition of frass and its mineralization dynamics.
N2O fluxes were highly dynamic and followed different patterns between the first 5 days after onset (DAO) of incubation and the incubation period after 5 DAO. During the first days of incubation, N2O emissions were mostly driven by high availability of easily degradable C and N leading to highest N2O fluxes in Carb-510 and Carb-170. During peak N2O emissions, the highest WEOC and high content in soil were measured in Carb-510 and Carb-170, while content was very low. In Prot-170 and Prot-510, N2O fluxes also increased strongly, but on a lower magnitude, which can be attributed to the lower availability of Corg.
After 5 DAO, N2O fluxes stayed on a stable level in Carb-170 and Prot-170 with higher emissions in Prot-170 reflecting the higher soil availability. In Carb-510 and Prot-510, N2O fluxes increased again. The interaction of C and N availability on controlling N2O fluxes was validated by analysis of regression, highlighting a strong positive interaction between soil and WEOC concentrations after 5 DAO. It is known, that denitrification in soil is largely controlled by the supply of readily decomposable organic matter (Azam et al., 2002; Chantigny et al., 2007; Loecke and Robertson, 2009). Thus, high N2O losses have been explained by combined availability of C and N after incorporation of organic fertilizers (Köster et al., 2011; Zhu et al., 2015, Zhou et al., 2017) or plant litter (Rummel et al., 2020). This rapid mineralization makes nitrification and coupled nitrification-denitrification potential pathways of N2O production, while nitrifier denitrification is unlikely due to high C availability (Wrage et al., 2001; Wrage-Mönnig et al., 2018). Furthermore, contribution of fungal denitrification is likely as increasing contribution of fungal denitrification has been reported under conditions of high C and N availability after litter application (Laughlin and Stevens, 2002; Wu et al., 2017; Senbayram et al., 2018; Zhong et al., 2018; Rummel et al., 2021a). This is in accordance with the promotion of fungi in our study and other studies with frass application (Lovett and Ruesink, 1995; Temple et al., 2013). To reliably distinguish between N2O emission pathways, analysis of the N2O isotopic signature is recommended in future studies (Yu et al., 2020).
In contrast to many other studies (Azam et al., 2002; Huang et al., 2004; Millar and Baggs, 2004, 2005; Frimpong and Baggs, 2010; Rummel et al., 2020), we did not find a correlation between CO2 and N2O fluxes in our study. Nevertheless, we did measure both high CO2 and N2O fluxes indicating that oxic and anoxic decomposition processes took place at the same time. Our results show that the N2O emission dynamics are highly variable and N2O fluxes may change rapidly within few hours. Therefore, peak emissions may easily be missed when only sampling once a day and continuous measurements are important to estimate the real gas losses to the environment and to allow for a reliable assessment of the environmental effects of frass.
NO fluxes followed a similar pattern as N2O fluxes after 5 DAO and were positively correlated. The NO/N2O emission ratio was always < 0.2 (Supplementary Figure 6A) indicating that NO was mostly produced from bacterial denitrification as the NO/N2O emission ratio of bacterial denitrification is mostly around 0.01, while emission ratios of NO/N2O from nitrification are often higher than 1 (Skiba et al., 1997; Cheng et al., 2004).
However, contribution of fungal denitrification to NO production has also been reported (Senbayram et al., 2018). N2 fluxes decreased throughout the incubation experiment, with the exception of Prot-510, where the highest N2 fluxes were measured on 5 DAO when N2O fluxes were low. The product ratio of denitrification N2O/(N2O+N2) was mostly < 0.5 (Supplementary Figure 6B) as more N2 than N2O was produced. Similar denitrification product ratios have been measured in studies using the same soil and similar soil moisture conditions (Rohe et al., 2021; Rummel et al., 2021b).
Cumulative N2O emissions where higher in Carb-treatments than in Prot-treatments and higher in treatments receiving higher amounts of N. In Carb-treatments, the first 5 days contributed the largest part to the cumulative emissions, while in Prot-treatments, the second peak also largely contributed to cumulative emissions. The N2O emission factors differed between frass types and application rates. In Prot treatments, EF were lower compared to Carb and did not change with application rate. This indicates that the amount of N lost as N2O depended on the amount of available N and increased with higher N availability. In the Carb treatments, EF decreased with increasing frass input.
Compared to N2O emissions from similar incubation studies with application rates of 150-160 kg N ha−1, N2O losses can be ranked as following: Prot-170 (3.4 mg N2O-N kg−1) < biogas digestate (12.6 mg N2O-N kg−1, Köster et al., 2015) < Carb-170 (13.3 mg N2O-N kg−1) < ammonium sulfate (14.1 mg N2O-N kg−1, Senbayram et al., 2012) < Prot-510 (14.5, mg N2O-N kg−1) < biogas residue (16.3 mg N2O-N kg−1, Senbayram et al., 2012) < Carb-510 (22.8 mg N2O-N kg−1) < cattle slurry (34.1 mg N2O-N kg−1, Köster et al., 2015). As soil type, incubation conditions, and especially soil moisture strongly affect N2O emissions and dynamics, standardized values such as EF are better to compare emissions between studies. EF in our study were much higher than the emission factor of 1% of applied N estimated by the IPCC (IPCC, 2006). Actual emission factors in our study ranged between 3 and 9% of applied N, more similar to digestates (0-5.1%, Walling and Vaneeckhaute, 2020) and manures (0.05-13.9%, Walling and Vaneeckhaute, 2020). Thus, black soldier fly frass cannot be considered a ‘compost-like’ organic fertilizer or soil amendment, but should be treated similar to highly available organic fertilizers such as fresh manure or biogas digestates.
Both frass types increased MBC and MBN with Carb-frass and higher amounts both showing stronger increases. These results show the potential of frass for sequestering C as MBC is eventually converted into soil organic matter, which consists to a large part of microbial necromass (Khan et al., 2016). The high correlation between cumulative CO2 and MBC was expected, as a larger microbial community releases more CO2. When considering the metabolic quotient (qCO2), which indicates the respiration per unit of microbial biomass and can be used as a first proxy of C use efficiency, it can be seen that the Prot-510 treatment, had a higher respiration per unit of MBC. Consequently, high Prot-frass application leads to less efficient conversion into microbial C and thus may less well contribute to SOC sequestration, as microbial physiology and efficient C use is key (Kallenbach et al., 2015). Carbon and nitrogen are well correlated in the soil microbial biomass (Xu et al., 2013), as both are required proportionally, explaining the higher N immobilization in the Carb-treatments by a community utilizing a resource with high C availability and a higher loss of N by mineralization in the Prot-treatments by a C-limited microbial community. Losses of C or N could be reduced by more balanced C to nutrient ratios, closer to microbial demand, of the frass applied. This should be tested in future studies by a simultaneous application of other nutrients in combination with frass, complementing the nutrient availability of the frass.
The addition of frass clearly stimulated fungi and the higher the application rate the greater their abundance. This was not just indicated by an increased fungi-to-bacteria ratio, but also by higher microbial biomass C:N in 510 kg N treatments compared to 170 kg N reflecting higher fungal compared to bacterial C:N as often observed (Mouginot et al., 2014). Promotion of fungi by frass application have also been reported elsewhere (Lovett and Ruesink, 1995; Temple et al., 2013; Watson et al., 2021). Higher MBC to microbial element ratios were also reflected in the MBC:MBP and MBC:MBS ratios. Higher MBC:MBP ratios may be associated with fungal biomass (Mouginot et al., 2014). Although investigations into soil MBC:MBS ratios and concurrent changes in fungal to bacterial ratios are few, a reduced MBC:MBS ratio with increased fungal contribution to soil microbial biomass has been observed (Heinze et al., 2010), which contradicts the findings of the current study where an increased MBC:MBS ratio is associated with a higher fungal to bacterial ratio. However, recently, it has been shown, that fungi have quite flexible C:N and C:P ratios, which may well be true for other elements (Camenzind et al., 2021). A reduced MBC:MBMn ratio in the Carb-510 treatment may be due to involvement of Mn in glycolysis and lignin degradation (Jakubovics and Jenkinson, 2001; Datta et al., 2017; Hemkemeyer et al., 2021) which may be of higher importance in the Carb frass. Homeostatic behavior of MBC:K, MBC:Na and MBC:Mg ratios could be observed in this study, indicating relatively stable requirements of K, Na and Mg, per microbial C, across a changing soil microbial community composition, supplied with substrates differing in availability of K and Na, but not in the availability of Mg.
Interestingly, archaeal 16S rRNA and amoA genes did not respond at all to type and amount of frass. This contrasted findings of a study by Watson et al. (2021) in which application of frass derived from other insect species (mealworm, buffalo worm) stimulated archaeal abundance, which was linked with nitrite accumulation (high ammonium oxidation rates). In our study, despite increases in bacterial 16S rRNA and amoA gene abundances, frass addition only led to small differences in ratios of archaeal and bacterial amoA gene copy numbers at the end of incubation. Future studies need to consider the potentially relevant role of archaea in N cycling to improve our understanding of N fluxes in frass amended soils.
With few exceptions, the abundance of denitrification genes showed a positive response to both frass types, revealing the promotion of the overall denitrifier community size. Furthermore, if the community size was increased, the increment depended on the amount of frass added, especially for nirK and nosZ clade I denitrifiers, indicating that these groups strongly respond to frass addition, regardless of the type of frass. In contrast to their nirK counterpart, nirS-carrying microorganisms did not respond to addition of frass obtained from the protein-based feeding regime, indicating that the quality of the added organic material is important for nirS denitrifiers. Different responses of nirK and nirS denitrifiers to fertilization have frequently been reported (e.g., Yang et al., 2017), supporting the idea of niche differentiation of nir-type denitrifiers (Jones and Hallin, 2010). Similarly to nirS denitrifiers, nosZ clade II denitrifiers did not respond to frass from the protein feeding regime, while clade I types were strongly promoted, again pointing to different ecological niches (Hallin et al., 2018).
To focus on frass turnover processes and C and N fluxes between soil and atmosphere, no plants were included in our study. However, as insect frass has been portrayed as an organic fertilizer to be applied similarly to compost or manure, it is not unlikely that frass would be applied during the fallow period before sowing/planting. In accordance with previous studies (Fielding et al., 2013; Houben et al., 2020), we found rapid mineralization of C and N from frass. While fast release of plant nutrients may be beneficial to promote plant growth, our results show clearly that there is a high risk of greenhouse gas losses including CO2 and N2O. In addition to very high fluxes of CO2, NO, N2O, and N2, we measured substantial CH4 emissions from one replicate of Carb-510. Thus, CH4 emissions after frass application are possible—most likely when high amounts of Corg are added, mineral N content is low, and soil moisture is very high such as after heavy rainfall. To better understand greenhouse gas emission dynamics and potential CH4 emissions after frass application, we recommend further laboratory and field studies with different soils and moisture conditions and varying levels of frass addition. High content of soil further increases the risk of N losses through NH3 volatilization when soil pH is high. Thus, we do not recommend this type of frass to be used as a “compost-like” fertilizer before planting/sowing, as, besides C lost as CO2 from mineralization N losses can cause distinctly negative environmental effects to the detriment of the proposed environmentally friendly protein production using insects. Application of frass as a nutrient source to growing plants may be one strategy to reduce N losses, as will be quickly taken up minimizing the potential of N2O emissions. However, effects of frass on plant growth also need more thorough evaluation, as high amounts of frass added can inhibit growth of plants (Newton et al., 2005; Temple et al., 2013; Alattar et al., 2016). As an alternative, frass may be mixed with C-rich material to facilitate microbial N immobilization and N conservation. This at the same time can shed further light on the potential of frass to sequester C in the soil, which is required for a full life cycle assessment of frass and the insect industry as a whole. Nonetheless, these strategies also require further investigation.
As our study is the first to measure greenhouse gas losses after frass application to agricultural soil, it is self-evident that more studies with different types of frass (insect species, diet, frass treatments such as drying), soil types, and incubation conditions are needed to reliably assess the potential of greenhouse gas losses. It is important to consider the stoichiometric needs of microorganisms when applying frass to reduce emissions and nutrient losses, and whether additional nutrients could be applied to frass to compensate for stoichiometric imbalances. Furthermore, trace elements should be considered as they play key roles in nutrient cycling processes.
Insect frass is a source of C and nutrients for soil microorganisms. Our study showed that, depending on C, N, and nutrient content of the frass, N will be immobilized or mineralized, and C will be used more or less efficiently by soil microorganisms resulting in microbial, in particular fungal growth. Further, high nutrient availability after frass addition to soil can result in substantial rapid losses of C (as CO2, partly CH4) and N gases, especially N2O. This reduces the fertilizer (N) and organic amendment (C) value of frass, and substantially increases the environmental footprint lowering the ecological benefit associated with insect-based proteins. Therefore, these results need to be included in life cycle assessments of insect-based protein. Future studies are crucial to better understand the mechanisms leading to these large gaseous C and N losses. Therefore, C and N dynamics of frass originating from different insect species, insect diets, frass processing (drying, composting), and application rates need to be tested in different soils under varying environmental conditions. Moreover, plants need to be integrated in experiments where applicable to evaluate plant-soil interaction effects on C and N dynamics.
The raw data for this article can be found online at: https://doi.org/10.25625/LW1N9C.
PSR and FW designed the experiment and PSR carried it out. SAS extracted microbial biomass elements and DNA. LB tested DNA quality for inhibitory effects. SAS and LB employed qPCR of structural and functional genes, respectively. MH coordinated molecular measurements and processed data. MH and SAS statistically analyzed molecular and microbial biomass elements data. PSR prepared the manuscript with contributions from all co-authors. All authors contributed to interpretation of results.
PSR was supported by the Deutsche Forschungsgemeinschaft through the research unit DFG-FOR 2337: Denitrification in Agricultural Soils: Integrated Control and Modelling at Various Scales (DASIM, grant number DI 546/4-2). LB was supported by the German Federal Ministry of Education and Research (BMBF), in the framework of the Bonares-SIGNAL project (funding codes: 031A562A and 031B0510A). The contributions of MH and SAS were funded by Ministry of Culture and Science of the State North Rhine-Westphalia in association with Project Management Jülich (project Soil ionoMICS, grant number 005-1703-0025). Open access publication was was funded by the University of Göttingen.
The authors declare that the research was conducted in the absence of any commercial or financial relationships that could be construed as a potential conflict of interest.
All claims expressed in this article are solely those of the authors and do not necessarily represent those of their affiliated organizations, or those of the publisher, the editors and the reviewers. Any product that may be evaluated in this article, or claim that may be made by its manufacturer, is not guaranteed or endorsed by the publisher.
We thank Klaus Dittert for the opportunity to conduct this study in the mesocosm system and Ulrike Kierbaum for analysis of mineral N samples. Sabrina Meisen's support in soil processing is highly appreciated. The English was finally checked by native English speaker Conor Watson.
The Supplementary Material for this article can be found online at: https://www.frontiersin.org/articles/10.3389/fsufs.2021.709993/full#supplementary-material
Alattar, M., Alattar, F., and Popa, R. (2016). Effects of microaerobic fermentation and black soldier fly larvae food scrap processing residues on the growth of corn plants (Zea mays). Plant Sci. Today 3, 57–62. doi: 10.14719/pst.2016.3.1.179
Azam, F., Müller, C., Weiske, A., Benckiser, G., and Ottow, J. C. G. (2002). Nitrification and denitrification as sources of atmospheric nitrous oxide—role of oxidizable carbon and applied nitrogen. Biol. Fertil. Soils 35, 54–61. doi: 10.1007/s00374-001-0441-5
Barragán-Fonseca, K. Y., Barragán-Fonseca, K. B., Verschoor, G., van Loon, J. J., and Dicke, M. (2020). Insects for peace. Curr. Opin. Insect Sci. 40, 85–93. doi: 10.1016/j.cois.2020.05.011
Beesigamukama, D., Mochoge, B., Korir, N. K., Fiaboe, K. K. M., Nakimbugwe, D., Khamis, F. M., et al. (2020). Exploring Black Soldier Fly Frass as Novel Fertilizer for Improved Growth, Yield, and Nitrogen Use Efficiency of Maize Under Field Conditions. Front. Plant Sci. 11. doi: 10.3389/fpls.2020.574592
Berggren, Å., Jansson, A., and Low, M. (2019). Approaching ecological sustainability in the emerging insects-as-food industry. Trends Ecol. Evol. 34, 132–138. doi: 10.1016/j.tree.2018.11.005
Beule, L., Corre, M. D., Schmidt, M., Göbel, L., Veldkamp, E., and Karlovsky, P. (2019). Conversion of monoculture cropland and open grassland to agroforestry alters the abundance of soil bacteria, fungi and soil-N-cycling genes. PLoS ONE 14:e0218779. doi: 10.1371/journal.pone.0218779
Blackmon, H., and Adams, R. H. (2015). evobiR: Comparative and Population Genetic Analyses. Available online at: https://cran.r-project.org/package=evobiR
Blackwood, C. B., Oaks, A., and Buyer, J. S. (2005). Phylum- and class-specific PCR primers for general microbial community analysis. Appl. Environ. Microbiol. 71:6193. doi: 10.1128/AEM.71.10.6193-6198.2005
Brookes, P. C., Landman, A., Pruden, G., and Jenkinson, D. S. (1985). Chloroform fumigation and the release of soil nitrogen: a rapid direct extraction method to measure microbial biomass nitrogen in soil. Soil Biol. Biochem. 17, 837–842. doi: 10.1016/0038-0717(85)90144-0
Burford, J. R., and Bremner, J. M. (1975). Relationships between the denitrification capacities of soils and total, water-soluble and readily decomposable soil organic matter. Soil Biol. Biochem. 7, 389–394. doi: 10.1016/0038-0717(75)90055-3
Camenzind, T., Philipp Grenz, K., Lehmann, J., and Rillig, M. C. (2021). Soil fungal mycelia have unexpectedly flexible stoichiometric C:N and C:P ratios. Ecol. Lett. 24, 208–218. doi: 10.1111/ele.13632
Chantigny, M. H., Angers, D. A., Kaiser, K., and Kalbitz, K. (2007). “Extraction and characterization of dissolved organic matter,” in Soil Sampling and Methods of Analysis, 2nd Edn, eds M. R. Carter and E. G. Gregorich (Taylor & Francis Group).
Cheng, W., Tsuruta, H., Chen, G., and Yagi, K. (2004). N2O and NO production in various Chinese agricultural soils by nitrification. Soil Biol. Biochem. 36, 953–963. doi: 10.1016/j.soilbio.2004.02.012
Choi, Y., Choi, J., Kim, J., Kim, M., Kim, W., Park, K., et al (2009). Potential usage of food waste as a natural fertilizer after digestion by Hermetia illucens (Diptera: Stratiomyidae). Int. J. Ind. Entomol. 19, 171–174. Available online at: http://www.koreascience.or.kr/article/JAKO200933063804087.page
Christenson, L. M., Lovett, G. M., Mitchell, M. J., and Groffman, P. M. (2002). The fate of nitrogen in gypsy moth frass deposited to an oak forest floor. Oecologia 131, 444–452. doi: 10.1007/s00442-002-0887-7
Council directive of 12 December 1991 concerning the protection of waters against pollution caused by nitrates from agricultural sources (91/676/EEC), (OJ L 375, 31.12.1991, p. 1). (2008). Amended by: Regulation (EC) No 1882/2003 of the European Parliament and of the Council of 29 September 2003L 284131.10.2003, Regulation (EC) No 1137/2008 of the European Parliament and of the Council of 22 October.
Datta, R., Kelkar, A., Baraniya, D., Molaei, A., Moulick, A., Meena, R. S., et al. (2017). Enzymatic degradation of lignin in soil: a review. Sustainability 9:1163. doi: 10.3390/su9071163
DüV (2017). Düngeverordnung vom 26. Mai 2017 (BGBl. I S. 1305), die durch Artikel 1 der Verordnung vom 28. April 2020 (BGBl. I S. 846) geändert worden ist - German Fertiliser Ordinance. 24. Available online at: https://www.gesetze-im-internet.de/bundesrecht/d_v/gesamt.pdf
Fielding, D. J., Trainor, E., and Zhang, M. (2013). Diet influences rates of carbon and nitrogen mineralization from decomposing grasshopper frass and cadavers. Biol. Fertil. Soils 49, 537–544. doi: 10.1007/s00374-012-0702-5
Fox, J., and Weisberg, S. (2011). An R Companion to Applied Regression. Thousand Oaks, CA: Sage Publications Inc.
Frimpong, K. A., and Baggs, E. M. (2010). Do combined applications of crop residues and inorganic fertilizer lower emission of N2O from soil? Soil Use Manag. 26, 412–424. doi: 10.1111/j.1475-2743.2010.00293.x
Garnier, S. (2018). viridisLite: Default Color Maps from “matplotlib” (Lite Version). Available online at: https://cran.r-project.org/package=viridisLite
Godfray, H. C. J., Aveyard, P., Garnett, T., Hall, J. W., Key, T. J., Lorimer, J., et al. (2018). Meat consumption, health, and the environment. Science 80:361. doi: 10.1126/science.aam5324
Großkopf, R., Janssen, P. H., and Liesack, W. (1998). Diversity and structure of the methanogenic community in anoxic rice paddy soil microcosms as examined by cultivation and direct 16S rRNA gene sequence retrieval. Appl. Environ. Microbiol. 64, 960–969. doi: 10.1128/AEM.64.3.960-969.1998
Grüning, M. M., Germeshausen, F., Thies, C., and Arnold, A. (2018). Increased forest soil CO2 and N2O emissions during insect infestation. Forests 9, 1–11. doi: 10.3390/f9100612
Guerra, V., Beule, L., Lehtsaar, E., Liao, H. L., and Karlovsky, P. (2020). Improved protocol for DNA extraction from subsoils using phosphate lysis buffer. Microorganisms 8:532. doi: 10.3390/microorganisms8040532
Hallin, S., Philippot, L., Löffler, F. E., Sanford, R. A., and Jones, C. M. (2018). Genomics and ecology of novel N2O-reducing microorganisms. Trends Microbiol. 26, 43–55. doi: 10.1016/j.tim.2017.07.003
Heinze, S., Raupp, J., and Joergensen, R. G. (2010). Effects of fertilizer and spatial heterogeneity in soil pH on microbial biomass indices in a long-term field trial of organic agriculture. Plant Soil 328, 203–215. doi: 10.1007/s11104-009-0102-2
Hemkemeyer, M., Pronk, G. J., Heister, K., Kögel-Knabner, I., Martens, R., and Tebbe, C. C. (2014). Artificial soil studies reveal domain-specific preferences of microorganisms for the colonisation of different soil minerals and particle size fractions. FEMS Microbiol. Ecol. 90, 770–782. doi: 10.1111/1574-6941.12436
Hemkemeyer, M., Schwalb, S. A., Heinze, S., Joergensen, R. G., and Wichern, F. (2021). Functions of elements in soil microorganisms. Microbiol. Res. doi: 10.1016/j.micres.2021.126832
Hothorn, T., Bretz, F., and Westfall, P. (2008). Simultaneous inference in general parametric models. Biometrical J. 50, 346–363. doi: 10.1002/bimj.200810425
Houben, D., Daoulas, G., Faucon, M. P., and Dulaurent, A. M. (2020). Potential use of mealworm frass as a fertilizer: impact on crop growth and soil properties. Sci. Rep. 10, 1–9. doi: 10.1038/s41598-020-61765-x
Huang, Y., Zou, J., Zheng, X., Wang, Y., and Xu, X. (2004). Nitrous oxide emissions as influenced by amendment of plant residues with different C:N ratios. Soil Biol. Biochem. 36, 973–981. doi: 10.1016/j.soilbio.2004.02.009
IPCC (2006). “Guidelines for National Greenhouse Gas Inventories,” in Agriculture, Forestry, and Other Landuse, Vol. 4 (Paris: OECD Press).
Jakubovics, N. S., and Jenkinson, H. F. (2001). Out of the iron age: new insights into the critical role of manganese homeostasis in bacteria. Microbiology 147, 1709–1718. doi: 10.1099/00221287-147-7-1709
Joergensen, R. G. (1996). The fumigation-extraction method to estimate soil microbial biomass: calibration of the Kec value. Soil Tillage Res. 28, 25–31. doi: 10.1016/0038-0717(95)00102-6
Joergensen, R. G., and Brookes, P. C. (2005). “Quantification of Soil Microbial Biomass by Fumigation-Extraction,” in Monitoring and Assessing Soil Bioremediation (Berlin/Heidelberg: Springer-Verlag), 281–295.
Joergensen, R. G., and Mueller, T. (1996). The fumigation-extraction method to estimate soil microbial biomass: Calibration of the kEN value. Soil Biol. Biochem. 28, 33–37. doi: 10.1016/0038-0717(95)00101-8
Jones, C. M., and Hallin, S. (2010). Ecological and evolutionary factors underlying global and local assembly of denitrifier communities. ISME J. 4, 633–641. doi: 10.1038/ismej.2009.152
Kagata, H., and Ohgushi, T. (2012). Positive and negative impacts of insect frass quality on soil nitrogen availability and plant growth. Popul. Ecol. 54, 75–82. doi: 10.1007/s10144-011-0281-6
Kagata, H., and Ohgushi, T. (2013). Home-field advantage in decomposition of leaf litter and insect frass. Popul. Ecol. 55, 69–76. doi: 10.1007/s10144-012-0342-5
Kallenbach, C. M., Grandy, A. S., Frey, S. D., and Diefendorf, A. F. (2015). Microbial physiology and necromass regulate agricultural soil carbon accumulation. Soil Biol. Biochem. 91, 279–290. doi: 10.1016/j.soilbio.2015.09.005
Khan, K. S., Mack, R., Castillo, X., Kaiser, M., and Joergensen, R. G. (2016). Microbial biomass, fungal and bacterial residues, and their relationships to the soil organic matter C/N/P/S ratios. Geoderma 271, 115–123. doi: 10.1016/j.geoderma.2016.02.019
Kielak, A. M., Cretoiu, M. S., Semenov, A. V., Sørensen, S. J., and Van Elsas, J. D. (2013). Bacterial chitinolytic communities respond to chitin and pH alteration in soil. Appl. Environ. Microbiol. 79, 263–272. doi: 10.1128/AEM.02546-12
Klammsteiner, T., Turan, V., Juárez, M. F. D., Oberegger, S., and Insam, H. (2020). Suitability of black soldier fly frass as soil amendment and implication for organic waste hygienization. Agronomy 10:1578. doi: 10.3390/agronomy10101578
Kögel-Knabner, I. (2002). The macromolecular organic composition of plant and microbial residues as inputs to soil organic matter. Soil Biol. Biochem. 34, 139–162. doi: 10.1016/S0038-0717(01)00158-4
Köster, J. R., Cárdenas, L., Senbayram, M., Bol, R., Well, R., Butler, M., et al. (2011). Rapid shift from denitrification to nitrification in soil after biogas residue application as indicated by nitrous oxide isotopomers. Soil Biol. Biochem. 43, 1671–1677. doi: 10.1016/j.soilbio.2011.04.004
Köster, J. R., Cárdenas, L. M., Bol, R., Lewicka-Szczebak, D., Senbayram, M., Well, R., et al. (2015). Anaerobic digestates lower N2O emissions compared to cattle slurry by affecting rate and product stoichiometry of denitrification - An N2O isotopomer case study. Soil Biol. Biochem. 84, 65–74. doi: 10.1016/j.soilbio.2015.01.021
Lane, D. J. (1991). “16S/23S rRNA sequencing,” in Nucleic Acid Techniques in Bacterial Systematics, eds E. Stackebrandt and M. Goodfellow (New York, NY: John Wiley and Sons Ltd), pp. 115–175.
Laughlin, R. J., and Stevens, R. J. (2002). Evidence for fungal dominance of denitrification and codenitrification in a grassland soil. Soil Sci. Soc. Am. J. 66, 1540–1548. doi: 10.2136/sssaj2002.1540
Lenth, R. (2019). emmeans: Estimated Marginal Means. Available online at: https://cran.r-project.org/package=emmeans
Loecke, T. D., and Robertson, G. P. (2009). Soil resource heterogeneity in terms of litter aggregation promotes nitrous oxide fluxes and slows decomposition. Soil Biol. Biochem. 41, 228–235. doi: 10.1016/j.soilbio.2008.10.017
Lovett, G. M., and Ruesink, A. E. (1995). Carbon and nitrogen mineralization from decomposing gypsy moth frass. Oecologia 104, 133–138. doi: 10.1007/BF00328577
Lueders, T., Manefield, M., and Friedrich, M. W. (2004). Enhanced sensitivity of DNA- and rRNA-based stable isotope probing by fractionation and quantitative analysis of isopycnic centrifugation gradients. Environ. Microbiol. 6, 73–78. doi: 10.1046/j.1462-2920.2003.00536.x
Mangiafico, S. (2018). rcompanion: Functions to Support Extension Education Program Evulation. Available online at: https://cran.r-project.org/package=rcompanion
Martin, K. J., and Rygiewicz, P. T. (2005). Fungal-specific PCR primers developed for analysis of the ITS region of environmental DNA extracts. BMC Microbiol. 5:28. doi: 10.1186/1471-2180-5-28
Millar, N., and Baggs, E. M. (2004). Chemical composition, or quality, of agroforestry residues influences N2O emissions after their addition to soil. Soil Biol. Biochem. 36, 935–943. doi: 10.1016/j.soilbio.2004.02.008
Millar, N., and Baggs, E. M. (2005). Relationships between N2O emissions and water-soluble C and N contents of agroforestry residues after their addition to soil. Soil Biol. Biochem. 37, 605–608. doi: 10.1016/j.soilbio.2004.08.016
Mouginot, C., Kawamura, R., Matulich, K. L., Berlemont, R., Allison, S. D., Amend, A. S., et al. (2014). Elemental stoichiometry of fungi and bacteria strains from grassland leaf litter. Soil Biol. Biochem. 76, 278–285. doi: 10.1016/j.soilbio.2014.05.011
Newton, L., Sheppard, C., Watson, D. W., Burtle, G., and Dove, R. (2005). Using the Black Solidier Fly, Hermetia illucens, as a value-Added tool for the Management of Swine Manure. Available online at: http://www.urbantilth.org/wp-content/~uploads/2008/09/soldierfly-swine-manure-management.pdf
Ogle, D., Wheeler, P., and Dinno, A. (2018). FSA: Fisheries Stock Anaylisis. Available online at: https://github.com/droglenc/FSA
Poveda, J. (2021). Insect frass in the development of sustainable agriculture. A review. Agron. Sustain. Dev. 41, 1–10. doi: 10.1007/s13593-020-00656-x
Poveda, J., Jiménez-Gómez, A., Saati-Santamaría, Z., Usategui-Martín, R., Rivas, R., and García-Fraile, P. (2019). Mealworm frass as a potential biofertilizer and abiotic stress tolerance-inductor in plants. Appl. Soil Ecol. 142, 110–122. doi: 10.1016/j.apsoil.2019.04.016
Quilliam, R. S., Nuku-Adeku, C., Maquart, P., Little, D., Newton, R., and Murray, F. (2020). Integrating insect frass biofertilisers into sustainable peri-urban agro-food systems. J. Insects as Food Feed 6, 315–322. doi: 10.3920/J.I.F.F.2019.0049
R Core Team (2019). R: A Language and Environment for Statistical Computing. Available online at: https://www.r-project.org/
Robertson, G. P., and Groffman, P. M. (2015). “Nitrogen Transformations,” in Soil microbiology, ecology and biochemistry, ed. E. A. Paul (Burlington: Acwdemic Press), 421–446.
Rohe, L., Apelt, B., Vogel, H.-J., Well, R., Wu, G.-M., and Schlüter, S. (2021). Denitrification in soil as a function of oxygen supply and demand at the microscale. Biogeosciences, 1–32. doi: 10.5194/bg-2020-221-supplement
Rummel, P. S., Pfeiffer, B., Pausch, J., Well, R., Schneider, D., and Dittert, K. (2020). Maize root and shoot litter quality controls short-term CO2 and N2O emissions and bacterial community structure of arable soil. Biogeosciences 17, 1181–1198. doi: 10.5194/bg-17-1181-2020
Rummel, P. S., Well, R., Pausch, J., Pfeiffer, B., and Dittert, K. (2021a) Carbon availability nitrogen mineralization control denitrification rates product stoichiometry during initial maize litter decomposition. Appl. Sci. 11:5309. doi: 10.3390/app11115309
Rummel, P. S., Well, R., Pfeiffer, B., Dittert, K., Floßmann, S., and Pausch, J. (2021b). Nitrate uptake and carbon exudation–do plant roots stimulate or inhibit denitrification? Plant Soil. 459, 217–233. doi: 10.1007/s11104-020-04750-7
Sarathchandra, S. U., Watson, R. N., Cox, N. R., Di Menna, M. E., Brown, J. A., Burch, G., et al. (1996). Effects of chitin amendment of soil on microorganisms, nematodes, and growth of white clover (Trifolium repens L.) and perennial ryegrass (Lolium perenne L.). Biol. Fertil. Soils 22, 221–226. doi: 10.1007/BF00382516
Senbayram, M., Chen, R., Budai, A., Bakken, L. R., and Dittert, K. (2012). N2O emission and the N2O/(N2O+N2) product ratio of denitrification as controlled by available carbon substrates and nitrate concentrations. Agric. Ecosyst. Environ. 147, 4–12. doi: 10.1016/j.agee.2011.06.022
Senbayram, M., Well, R., Bol, R., Chadwick, D. R., Jones, D. L., and Wu, D. (2018). Interaction of straw amendment and soil content controls fungal denitrification and denitrification product stoichiometry in a sandy soil. Soil Biol. Biochem. 126, 204–212. doi: 10.1016/j.soilbio.2018.09.005
Skiba, U., Fowler, D., and Smith, K. A. (1997). Nitric oxide emissions from agricultural soils in temperate and tropical climates: Sources, controls and mitigation options. Nutr. Cycl. Agroecosystems 48, 139–153. doi: 10.1023/A:1009734514983
Temple, W. D., Radley, R., Baker-French, J., and Richardson, F. (2013). Use of Enterra Natural Fertilizer (Black Soldier Fly Larvae Digestate) As a Soil Amendment. Available online at: https://certifiedorganic.bc.ca/programs/osdp/I-172_Frass_Research_Final~Report.pdf
Vance, E. D., Brookes, P. C., and Jenkinson, D. S. (1987). An extraction method for measuring soil microbial biomass C. Soil Biol. Biochem. 19, 703–707. doi: 10.1016/0038-0717(87)90052-6
Venables, W. N., and Ripley, B. D. (2002). Modern Applied Statistics with S. Statistics and Computing (New York, NY: Springer). doi: 10.1007/978-0-387-21706-2_10
Walling, E., and Vaneeckhaute, C. (2020). Greenhouse gas emissions from inorganic and organic fertilizer production and use: a review of emission factors and their variability. J. Environ. Manage. 276. doi: 10.1016/j.jenvman.2020.111211
Watson, C., Schlösser, C., Vögerl, J., and Wichern, F. (2021). Excellent excrement? Frass impacts on a soil's microbial community, processes and metal bioavailability. Appl. Soil Ecol. 168:104110. doi: 10.1016/j.apsoil.2021.104110
Wrage, N., Velthof, G. L., van Beusichem, M. L., and Oenema, O. (2001). The role of nitrifier denitrification in the production of nitrous oxide. Soil Biol. Biochem. 33, 1723–1732. doi: 10.1016/S0038-0717(01)00096-7
Wrage-Mönnig, N., Horn, M. A., Well, R., Müller, C., Velthof, G. L., and Oenema, O. (2018). The role of nitrifier denitrication in the production of nitrous oxide revisited. Soil Biol. Biochem. 123, A3–A16. doi: 10.1016/j.soilbio.2018.03.020
Wu, D., Senbayram, M., Well, R., Brüggemann, N., Pfeiffer, B., Loick, N., et al. (2017). Nitrification inhibitors mitigate N2O emissions more effectively under straw-induced conditions favoring denitrification. Soil Biol. Biochem. 104, 197–207. doi: 10.1016/j.soilbio.2016.10.022
Xu, X., Thornton, P. E., and Post, W. M. (2013). A global analysis of soil microbial biomass carbon, nitrogen and phosphorus in terrestrial ecosystems. Glob. Ecol. Biogeogr. 22, 737–749. doi: 10.1111/geb.12029
Yang, Y., Zhao, J., Jiang, Y., Hu, Y., Zhang, M., and Zeng, Z. (2017). Response of bacteria harboring nirS and nirK genes to different N fertilization rates in an alkaline northern Chinese soil. Eur. J. Soil Biol. 82, 1–9. doi: 10.1016/j.ejsobi.2017.05.006
Yu, L., Harris, E., Lewicka-Szczebak, D., Barthel, M., Blomberg, M. R. A., Harris, S. J., et al. (2020). What can we learn from N2O isotope data? Analytics, processes and modelling. Rapid Commun. Mass Spectrom. 34, 1–14. doi: 10.1002/rcm.8858
Yu, Y., Lee, C., Kim, J., and Hwang, S. (2005). Group-specific primer and probe sets to detect methanogenic communities using quantitative real-time polymerase chain reaction. Biotechnol. Bioeng. 89, 670–679. doi: 10.1002/bit.20347
Zhong, L., Bowatte, S., Newton, P. C. D., Hoogendoorn, C. J., and Luo, D. (2018). An increased ratio of fungi to bacteria indicates greater potential for N2O production in a grazed grassland exposed to elevated CO2. Agric. Ecosyst. Environ. 254, 111–116. doi: 10.1016/j.agee.2017.11.027
Zhou, M., Zhu, B., Wang, S., Zhu, X., Vereecken, H., and Brüggemann, N. (2017). Stimulation of N2O emission by manure application to agricultural soils may largely offset carbon benefits: a global meta-analysis. Glob. Chang. Biol. 23, 4068–4083. doi: 10.1111/gcb.13648
Keywords: mineralization, nitrification, denitrification, N2O, CO2, insect frass, organic fertilizer
Citation: Rummel PS, Beule L, Hemkemeyer M, Schwalb SA and Wichern F (2021) Black Soldier Fly Diet Impacts Soil Greenhouse Gas Emissions From Frass Applied as Fertilizer. Front. Sustain. Food Syst. 5:709993. doi: 10.3389/fsufs.2021.709993
Received: 14 May 2021; Accepted: 13 July 2021;
Published: 19 August 2021.
Edited by:
Engracia Madejon, Institute of Natural Resources and Agrobiology of Seville (CSIC), SpainReviewed by:
Jose Antonio Pascual, Consejo Superior de Investigaciones Científicas (CSIC), SpainCopyright © 2021 Rummel, Beule, Hemkemeyer, Schwalb and Wichern. This is an open-access article distributed under the terms of the Creative Commons Attribution License (CC BY). The use, distribution or reproduction in other forums is permitted, provided the original author(s) and the copyright owner(s) are credited and that the original publication in this journal is cited, in accordance with accepted academic practice. No use, distribution or reproduction is permitted which does not comply with these terms.
*Correspondence: Pauline Sophie Rummel, cGF1bGluZS5ydW1tZWxAdW5pLWdvZXR0aW5nZW4uZGU=
Disclaimer: All claims expressed in this article are solely those of the authors and do not necessarily represent those of their affiliated organizations, or those of the publisher, the editors and the reviewers. Any product that may be evaluated in this article or claim that may be made by its manufacturer is not guaranteed or endorsed by the publisher.
Research integrity at Frontiers
Learn more about the work of our research integrity team to safeguard the quality of each article we publish.