 Tommy L. D. Fenster
 Patricia Y. Oikawa2
 Jonathan G. Lundgren
94% of researchers rate our articles as excellent or good
Learn more about the work of our research integrity team to safeguard the quality of each article we publish.
Find out more
ORIGINAL RESEARCH article
Front. Sustain. Food Syst., 10 August 2021
Sec. Agroecology and Ecosystem Services
Volume 5 - 2021 | https://doi.org/10.3389/fsufs.2021.664359
This article is part of the Research TopicBreathing New Life into Farming: Illuminating the Socio-Ecological Benefits of Regenerative AgricultureView all 6 articles
Regenerative agriculture aims to improve soil health and promote biodiversity while producing nutritious food profitably. Almonds are the dominant crop in California agriculture in terms of acreage and revenue generated. We examined the soil health, biodiversity, yield, and profit of regenerative and conventional almond production systems that represented farmer-derived best management practices. Regenerative practices included abandoning some or all synthetic agrichemicals, planting perennial ground covers, integrating livestock, maintaining non-crop habitat, and using composts and compost teas. Total soil carbon (TSC), soil organic matter (SOM), total soil nitrogen (TSN), total soil phosphorous, calcium, sulfur, and soil health test scores were all significantly greater in regenerative soils. Water infiltrated regenerative soils six-fold faster than conventional soils. Total microbial biomass, total bacterial biomass, Gram+ bacteria, and Actinobacteria were significantly greater in regenerative soils. There was more plant biomass, species diversity, and percent cover in regenerative orchards. Invertebrate richness and diversity, and earthworm abundance and biomass were significantly greater in regenerative orchards. Pest populations, yields, and nutrient density of the almonds were similar in the two systems. Profit was twice as high in the regenerative orchards relative to their conventional counterparts. No one practice was responsible for the success of regenerative farms; their success was the result of simultaneously combining multiple regenerative practices into a single, functional farm system. This style of farming may assist in combatting planetary scale problems (e.g., climate change, biodiversity loss, agricultural pollution, chronic human health problems, and declining rural communities) while making farms more profitable and resilient.
Regenerative agriculture can be defined as an “approach to farming that uses soil conservation as the entry point to regenerate and contribute to multiple provisioning, regulating and supporting services, with the objective that this will enhance not only the environmental, but also the social and economic dimensions of sustainable food production” (Schreefel et al., 2020). The principles of regenerative agriculture are similar to those of conservation agriculture and consist of minimizing soil disturbance, eliminating or reducing agrichemical use, eliminating spatio-temporal bare soil events, maximizing plant diversity, and integrating livestock into a cropping operation (Rodale, 1983; Rhodes, 2017; LaCanne and Lundgren, 2018; Gosnell et al., 2019; Pecenka and Lundgren, 2019; Fenster et al., 2021). These regenerative practices increase organic matter in the soil, which is an active area of research for soil health and climate mitigation efforts (Veenstra et al., 2007; Ryals and Silver, 2013; Demestihas et al., 2017; LaCanne and Lundgren, 2018; Soto et al., 2021). Agriculture is an important cause for reductions in biodiversity (Kovács-Hostyánszki et al., 2017; Sanchez-Bayo and Wyckhuys, 2019; Stewart et al., 2019), and regenerative practices that enhance soil C, such as maintaining permanent ground cover, can help to promote biodiversity (Lundgren et al., 2006; Eilers and Klein, 2009; Klein et al., 2012; Vukicevich et al., 2016, 2019; Demestihas et al., 2017; Kovács-Hostyánszki et al., 2017; LaCanne and Lundgren, 2018). Adoption of regenerative practices at large scale requires empirical validation across a range of agroecosystems.
An important question is whether established regenerative farms consistently contribute key environmental services and profitability in a diversity of cropping systems. Research frequently examines the effects of isolated regenerative practices, such as cover cropping or organic amendments on cropping systems, rather than quantifying regenerative systems which integrate and “stack” multiple regenerative practices into a single operation (Derpsch et al., 2014; Soto et al., 2021). Further, studies that compare conventional systems to alternative systems frequently do not compare in situ systems developed and practiced by farmers (Derpsch et al., 2014; Soto et al., 2021). However, studies that have examined regenerative farming in situ have documented positive ecosystem impacts and high profitability. For example, regenerative maize and cattle grazing systems in the Midwest have significantly better soil health metrics, improved biodiversity, and reduced pest damage, while being twice as profitable relative to conventional systems (LaCanne and Lundgren, 2018; Pecenka and Lundgren, 2019). Additionally, research in tomato fields in California's Central Valley showed that tomato-cotton rotations that integrated cover cropping and conservation tillage led to higher levels of soil carbon than either practice on its own (Veenstra et al., 2007). Research comparing rain fed regenerative and conventional almond (Prunus dulcis) orchards in Spain found that regenerative management can improve soil quality and ecosystem services, particularly in systems that stack regenerative practices (Soto et al., 2021).
Regenerative management in California almond orchards may influence large swaths of the agricultural community. Almond orchards are California's highest grossing crop at $6.09 billion, spanning 619,169 ha, while producing 80% of the world's supply and nearly 100% of the domestic supply of almonds (California Almond Board, 2016; CDFA, 2019, 2020). Conventional orchards are reliant on synthetic inputs for nutrient management and pest control (Wade et al., 2019). These orchards primarily maintain bare orchard floors with synthetic herbicides (in 2017, 664,158 ha of almond orchards were sprayed with glyphosate; California Department of Pesticide Regulation, 2019), leaving exposed soil for most of the year. The simplification of the landscape forces almond growers to use synthetic pesticides (16 million kg of pesticide/ year) to manage pest outbreaks (California Department of Pesticide Regulation, 2019). In California's San Joaquin Valley, agriculture is the primary driver of biodiversity loss, with certain species having lost up to 98% of their habitat range (Williams et al., 1998; Stewart et al., 2019). Glyphosate and other pesticides also have significant human health impacts (Beard et al., 2014; von Ehrenstein et al., 2019). As of 2017, 2,386 ha, only 73 farms (<1% of California's almond acreage) were certified organic (USDA-AMS, 2020). Further, organic production systems occasionally conflict with regenerative philosophies, making regenerative almond systems a rarity within the industry.
Ground cover may enhance the natural resource base of almond orchards in several ways. Exposed soils erode and lose soil carbon (Kosmas et al., 1997; Abdalla et al., 2020), with orchards and vineyards experiencing the highest levels of soil losses among cultivated landscapes (Abdalla et al., 2020). The loss of carbon via soil erosion negatively affects land and water quality, reducing yields (Lal, 2007; Lal et al., 2007). Twenty percent of the eroded SOC is mineralized and released into the atmosphere in a gaseous state (0.8–1.2 Pg C year−1), contributing to global climate change (Lal, 2007). Bare orchard floors eliminate critical habitat and resources that support beneficial invertebrates and microbial populations (Eilers and Klein, 2009; Paredes et al., 2013; Saunders et al., 2013; Vukicevich et al., 2016). Allowing for ground cover and reducing soil disturbances in vineyards increases microbial biomass (Ingels et al., 2005; Whitelaw-Weckert et al., 2007; Steenwerth and Belina, 2008; Vukicevich et al., 2019), and these soil microbes play a significant role in forming stable and chemically diverse soil organic carbon (Kallenbach et al., 2016). Increasing vegetation diversity increases invertebrate biodiversity in croplands (Root, 1973; Lundgren et al., 2009; Lundgren and Fausti, 2015) and orchards (Chaplin-Kramer et al., 2011; Paredes et al., 2013; Vukicevich et al., 2016). Invertebrate diversity, abundance, and biological network interactions limit pest pressure through predation and competition, but also in ways that remain poorly understood (Barbosa et al., 2009; Lundgren and Fausti, 2015). Further, increasing plant diversity in farmlands eliminates the yield gap between organic and conventional production systems (Ponisio et al., 2015). The impacts of increasing orchard floor vegetation coverage and reducing synthetic inputs in almond orchards involves complex chemical, physical, and biological factors which require systems-level scientific studies.
This study compared established and successful regenerative and conventional almond orchards. We hypothesize that practices that enhance soil health and carbon storage will also increase biodiversity. Specifically, we hypothesize that regenerative orchards will have higher levels of soil organic matter (SOM), Total Soil Carbon (TSC), lower soil bulk densities, higher rates of water infiltration, and more robust and diverse microbial and invertebrate populations (LaCanne and Lundgren, 2018; Fenster et al., 2021; Soto et al., 2021). We hypothesize that regenerative orchards will have reduced pest pressure relative to insecticide-treated conventional systems. Finally, we hypothesize that regenerative orchards will have lower yields while being more profitable. We believe that this improved profitability will stem from a reduction in synthetic input costs as well as a greater market value for their product (LaCanne and Lundgren, 2018). Overall, we do not believe these differences will be due to a particular management practice, but rather the interacting effects of stacked regenerative practices (Fenster et al., 2021).
Sixteen orchards were studied in 2018 and 2019 (N = 8 each year). In 2018 four regenerative and four conventional orchards were sampled and in 2019 a new set of four regenerative and four conventional orchards were sampled. Regenerative and conventional orchard pairs were within 15.4 km of each other (mean of 3.7 km). The Web Soil Survey was used to select similar soil types for the conventional-regenerative orchard pairings (NRCS, 2021). To further establish similar soil conditions between treatments in pairs soil samples were sent to the Oregon State Soil Lab, where the sand-silt-clay composition was determined via the hydrometer technique (OSU, 2017). The farms in the study ranged from the Northern half of the San Joaquin Valley through the Capay Valley to Chico, and the clay percentages ranged from 7 to 35%. The clay percentages of the soils were strongly correlated with TSC [ = 0.52; F(1, 14) = 17.32, P = 0.001]. The clay percentages of the soils were considered as co-factors in all subsequent models that examined TSC. The average age of the trees in conventional orchards was 13.6 ± 2.96 y and the average age in the regenerative orchards was 17.6 ± 3.27 y, which was not statistically different [t(13) = −0.91, Welch P-value = 0.38]. The ages of trees in regenerative orchards ranged in years from 8 to 38 y, while in the conventional orchards, trees ranged from 3 to 25 y. All the orchards in the study were planted to at least two varieties to improve pollination (Klonsky et al., 2016), and almond varieties varied among the orchards (Table 1).
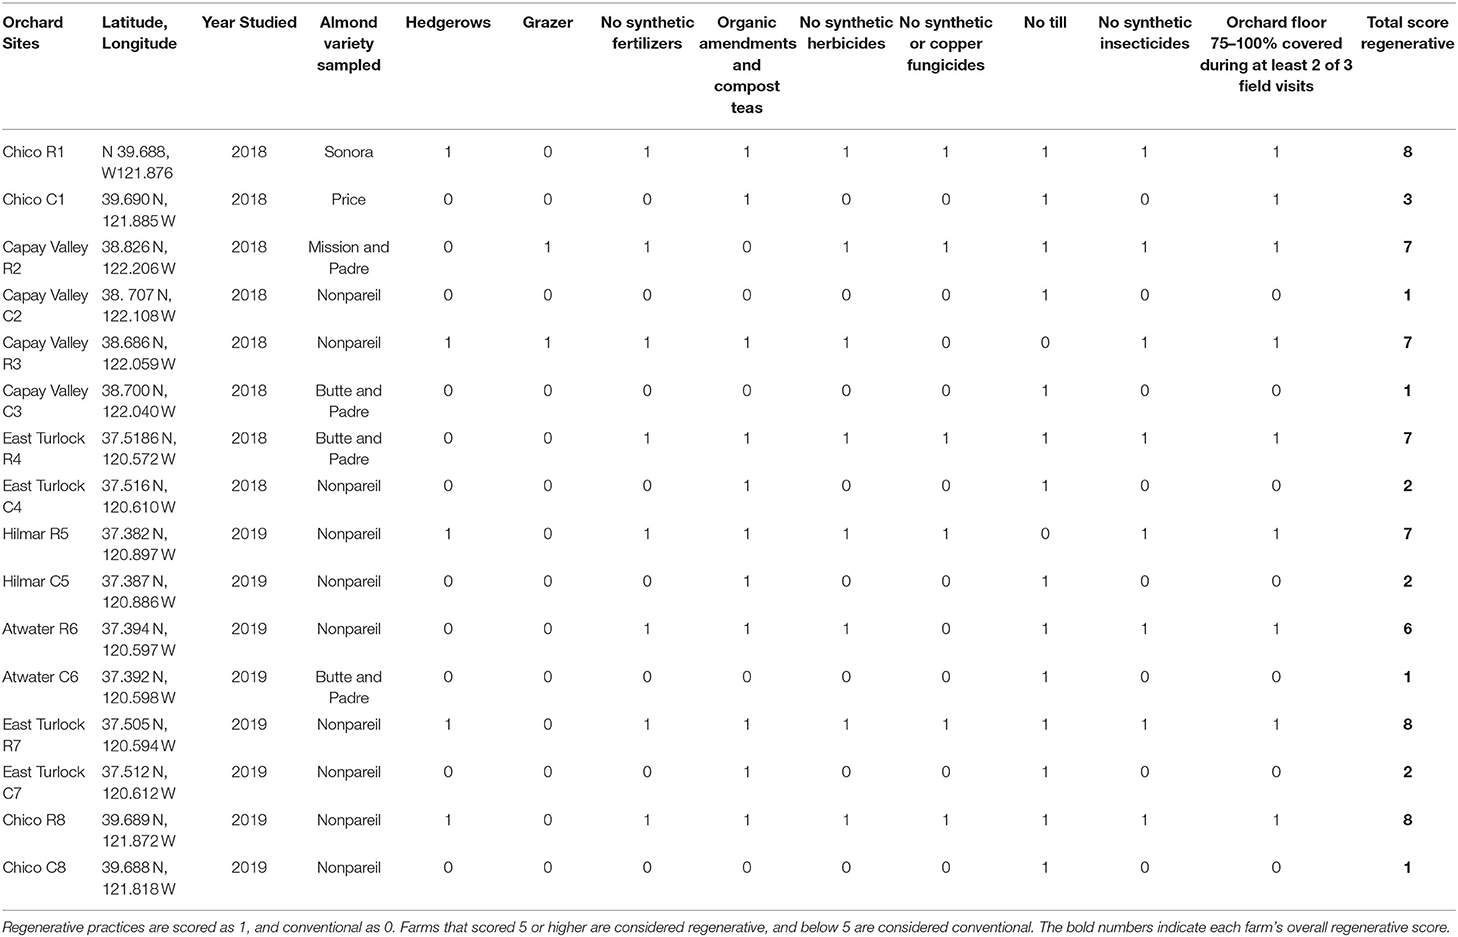
Table 1. The regenerative matrix score is the sum of regenerative practices on each farm, as determined through grower surveys.
The treatments were defined by rankings derived from a character matrix of nine different practices that were considered as regenerative or conventional (Table 1) (LaCanne and Lundgren, 2018; Fenster et al., 2021). Engaging in a regenerative practice or abstaining from a conventional practice resulted in the farm receiving a score of 1 for that matrix category. Therefore, the maximum regenerative score a farm could receive is 9. Use of organic amendments (compost, manure, mulch, compost teas) (Bugg et al., 1994), no-till (NRCS, 2016), prescribed grazing (NRCS, 2009), maintaining ground cover through planting cover crops (NRCS, 2014) or fostering resident vegetation (Bugg et al., 1994; Kosmas et al., 1997; Abdalla et al., 2020), and planting hedgerows (Bugg et al., 1994; NRCS, 2012) were all considered regenerative and received a score of 1 in a binary system. Using non-OMRI listed insecticides, herbicides, fungicides, and fertilizers (forthwith referred to as synthetics inputs), bare soil, and tillage were all considered conventional practices, and received a 0 score. Additionally, the literature suggests that OMRI approved fungicides containing copper have detrimental environmental effects (Vukicevich et al., 2016). They do not biodegrade, thereby accumulating in agricultural soils (Wang et al., 2009), reduce microbial biomass (Kandeler et al., 1996; Fernandez-Calvino et al., 2010), and biodiversity (Tobor-Kaplon et al., 2005), while potentially limiting key groups of beneficial fungal species, such as Arbuscular Mycorrhizal fungi (Graham et al., 1986). Therefore, despite being OMRI approved, the use of fungicides containing copper resulted in orchards receiving a zero in the fungicide category. Orchards that scored 5 or greater in our matrix were declared regenerative orchards, and those that received a score of 4 or lower were categorized as conventional orchards. A minimum of five regenerative practices was used as the regenerative threshold for two reasons. First, there are five principles underlying regenerative agricultural systems: minimizing soil disturbance, eliminating or reducing agrichemical use, eliminating spatio-temporal bare soil events, maximizing plant diversity, and integrating livestock into a cropping operation (Rodale, 1983; Rhodes, 2017; LaCanne and Lundgren, 2018; Gosnell et al., 2019; Pecenka and Lundgren, 2019; Fenster et al., 2021). Furthermore, in Fenster et al. (2021) it was found that in cropland systems, farms separated into two distinct clusters based on their regenerative score. These natural groupings could be divided at the score of 5. As a result, Fenster et al. (2021) proposed that regenerative cropland operations should be defined as those operations that score a minimum of 5 out of 9 in the regenerative-conventional matrix. In this study, all the orchards that qualified as regenerative were also certified organic. However, organic certification was not a requirement for a farm being defined as regenerative in this study, and organic orchards could be considered as non-regenerative.
Four study plots were established in each orchard. The plots were 40 × 40 m and separated by at least 15 m, resulting in 64 total observation points for the study. Plots were established 20 m into the field to avoid field margin effects. Smaller plots were used in one Capay Valley regenerative orchard and one Capay Valley conventional orchard (approximately 30 × 15 m, 6 m margins) due to the smaller sizes of these orchards.
Soil pH, soil macro, and micronutrients and Haney soil health scores were quantified in each orchard (Ward Laboratories, Kearney, NE). Four soil cores (15 cm deep, 1.9 cm diam.; N = 16), were taken from each of the four plots during the fruiting period of the orchard. The samples were taken at random locations halfway between the tree and the drip line within the wetting zone of the sprinkler/emitter (~1.5 m from the nearest tree) (Geisseler and Horwath, 2016) within each plot, at least 5 m apart, using a transect that diagonally bisected the plot. All samples were collected in the same week, and each regenerative and conventional orchard pair occurred within 24 h. Soil cores for each orchard were combined in a sealed plastic bag and placed in a cooler with dry ice (Franzluebbers et al., 2000; Haney et al., 2008). To determine SOM, the Loss on Ignition (LOI) technique was used. Soil pH was quantified using the slurry method with a 1:1 ratio soil: water (Weil and Brady, 2017). Soil nutrients levels and the Haney Soil Health Score were measured on samples that were dried at 50°C. The samples were ground to pass a 2 mm sieve and divided into three subsamples (two were 4 g each and one weighed 40 g). The 40 g soil sample was incubated for 24 h at 24°C. This sample was wetted through capillary action by adding 20 ml of deionized water to a 237 ml glass jar and then capped. After 24 h, the gas inside the jar was analyzed using an infrared gas analyzer (IRGA) (Li-Cor 840A, LI-COR Biosciences, Lincoln NE) for CO2-C. The two 4 g samples were extracted with 40 ml of deionized water and 40 ml of H3A, respectively. H3A extracts NH4, NO3, and P from soil. The extractant, H3A, is made up of organic root exudates, lithium citrate, and two synthetic chelators (DTPA, EDTA) (Haney et al., 2006). The water and H3A extracts were analyzed on a flow injection analyzer (Lachat 8000, Hach Company, Loveland CO) for NO3-N, NH4-N, and PO4-P. The water extract was analyzed on a Teledyne-Tekmar Torch C:N analyzer for water-extractable organic C and total N (WEOC and WEON). WEOC and WEON are the fraction of soil organic carbon and nitrogen present that is mobile and bioavailable to the microbial community (Zsolnay, 1996; Zhang et al., 2011; Grebliunas et al., 2016). The H3A extract was also analyzed on a Thermo Scientific ICP-OES instrument for P, K, Mg, Ca, Na, Zn, Fe, Mn, Cu, S, and Al (Haney et al., 2018).
The Haney Soil Health Score provides a general estimate of the overall health of a soil system. The score combines five independent measurements of soil biological and chemical properties, consisting of NH4-N, NO3-N, WEOC, WEON, and 1 day CO2-C. The calculation examines the balance of soil C and N and their relationship to microbial activity. This soil health calculation number can vary from 0 to > 50 (Haney et al., 2018). The Haney Soil Health Score is calculated as 1-d CO2-Carbon/10 plus Water Extractable Organic Carbon (WEOC)/50 plus Water Extractable Organic Nitrogen (WEON)/10.
Soil classification and surface bulk density (BD) samples were collected in three plots per farm, following the protocol outlined by the (NRCS, 2017). These samples were collected during the fruiting period in 2018 and during the bloom period in 2019. The BD cores were collected next to the soil cores destined for TSC/TSN analysis. A metal cylinder (7.62 cm wide and 12.7 cm tall) was hammered to a depth of 8 cm. Wet weights of each soil core were recorded. The samples were then allowed to air dry for at least 40 wk at ~28°C. Soil samples were then microwaved to constant weight (Usmen and Kheng, 1983). We compared the gravimetric soil moisture percentages for all the orchards as well as just the 2019 orchards, which were sampled in early March and therefore could not be affected by variations in irrigation regimes. This weight was recorded to the 0.01 g and used to calculate BD and the soil's gravimetric moisture percentage. Bulk density is calculated by dividing the mass of the dry sample by the volume of the cylinder. The soil gravimetric moisture percentage was calculated by subtracting the dry weight from the wet weight and then dividing by the dry weight and multiplying by 100. These soil samples (>200 g) were then analyzed for their sand, silt, and clay percentages using the hydrometer technique (OSU, 2017). Prior to starting the particle size separation steps, the sample was dried and particles >2 mm were removed, the sample was weighed, then organic matter and any other potential cementing-agents were removed. Sodium hexametaphosphate was added to the suspension and placed on a shaker overnight to overcome flocculation during settling. Suspension was measured using a hydrometer in 1 L of water at multiple time points to determine the specific gravity of the suspension (OSU, 2017). We determined that there were no treatment level biases in soil textures, pH, and clay percentages.
Water infiltration rates were measured twice per orchard in 2019 (four regenerative and four conventional) during the bloom and fruit development stages. Samples were taken from the middle of the tree row at randomly selected locations. We followed the NRCS protocol, where 444 ml of water was poured into a sheet-metal ring (15.2 cm diam, 13.5 cm tall), which was hammered 6.5 cm into the soil (Doran, 1999). The time until all the water saturated into the soil was recorded to the nearest second. During the fruiting period in the Chico conventional orchard, the infiltration time assigned was 8,077 s with 1 cm of water remaining in the ring. This process simulates an instantaneous 5 cm of rainfall (Doran, 1999). The two samples were averaged for each farm.
Soil samples were collected in each plot to determine TSC and total soil nitrogen (TSN). Random samples were taken halfway between the tree and the drip line within the wetting zone of the sprinkler/emitter. The probe (2.54 × 91.44 cm Plated Replaceable Tip Probe w/61 cm Window and Hammer Head Handle, AMS, American Falls, ID) was inserted 60 cm deep and the resulting soil samples (2.28 cm diameter) were partitioned into 0–5, 5–10, 10–15, 15–30, 30–45, and 45–60 cm depths. Each section of the core was placed into a plastic bag that was stored on ice until it could be transferred to a paper bag in the laboratory. Samples were weighed to the nearest 0.1 g, and then were air dried for at least 12 wk before they were prepared for elemental analysis of TSC and TSN. The air-dried weight of the soil was recorded to 0.01 g. All visible pieces of rock and organic matter were removed from the samples using tweezers, and the samples were ground using a sterilized mortar and pestle. Samples were then passed through a sieve with 0.180 mm openings. The samples were stored in manilla envelopes in a desiccator. Soil (12–15 mg) was removed from the manilla envelope and placed into tin capsules (5 × 9 mm, Costech, Valencia, CA) for elemental analysis. For each soil depth, three sub-samples underwent elemental analysis (ECS 8020, NC Technologies, Milan, Italy). To calibrate the analysis, each group of samples on a multi-sample plate consisted of five bypass samples that removed any gas or residue from the machine (12–15 mg of soil), two blanks, and four standards, 0.5–2.0 mg acetanilide (Costech, Valencia, CA), followed by the soil samples (12–15 mg). A standard was placed between every 10 soil samples to ensure accurate results. To control for the relative compaction and other circumstances associated with each vertical depth, the mass (Mg) of TSC per ha was assessed using the Equivalent Soil Mass (ESM) method, in which a cubic spline of Mg of TSC per depth layer was calculated (Wendt and Hauser, 2013). This resulted in the assessment of carbon as Mg of TSC/ha at the following ESM layers, and the average calculated depth for each reference mass is presented in parentheses: 500 Mg (6.1 cm), 1,000 Mg (11.0 cm), 1,500 Mg (15.8 cm), 3,000 Mg (30.4 cm), 4,500 Mg (45.2 cm), and 6,000 Mg (59.2 cm).
Phospholipid fatty acid profiles were used to characterize the microbial communities. Soil cores (10 cm depth, 1.9 cm diam), were taken from four replicates per plot during the fruiting period. The samples were taken at random locations halfway between the tree and the drip line within the wetting zone of the sprinkler/emitter within each replicate, at least 5 m apart, using a transect that diagonally bisected the plot. All samples were collected within the same week; samples on each paired regenerative and conventional orchard occurred within 24 h. The 16 soil cores for each orchard were combined in a sealed plastic bag and placed on dry ice (Drenovsky et al., 2010). Soil samples were stored at −80°C until they could be freeze-dried and ground to 2 mm particle sizes. The microbial biomass and community composition were recorded as Total microbial biomass, Undifferentiated microbial biomass, Total bacteria, Gram-positive bacteria, Actinobacteria, Gram-negative bacteria, Rhizobia bacteria, Total fungi, Arbuscular mycorrhizal fungi, Saprophytic fungi, and Protozoa. PLFA testing was performed by Ward Laboratories in Kearney, NE (White, 1988; Zelles et al., 1992; Zelles and Bai, 1993; Ramsey et al., 2006).
The epigeal invertebrate communities were sampled using a 15 cm tall 0.25 m2 sheet metal quadrat (Lundgren et al., 2006; LaCanne and Lundgren, 2018). The quadrats were placed at two random locations in the inter-row areas of each plot, and invertebrates collected were combined. Sampling of the invertebrate communities occurred during the bloom, fruit development, and harvest periods. The invertebrate communities were collected from the soil surface and top 2 cm of the soil with mouth-operated aspirators over 15 min, and were preserved in 70% ethanol. The biomass of the invertebrates per 0.5 m2 were weighed to the nearest 0.0001 g. Invertebrates were identified to the morphospecies level. Voucher specimens are all housed in the Mark F. Longfellow Biological Collection at Blue Dasher Farm, Estelline, SD, USA.
Percent ground cover and composition in each of the replicates/plots was recorded during each of the three sampling periods. The percent ground cover was categorized as 0–25, 25–50, 50–75, and 75–100%. Percent ground cover was assessed using visual assessments in each invertebrate quadrat (Hanley, 1978). The community composition and whether the ground cover was resident vegetation or planted was determined using information from farmer surveys and direct field observations.
We used pest damage to almonds collected from the orchard floor as an indicator of pest incidence. Pest damage to the tree was not monitored, nor were actual pest populations scouted. We assessed pest damage on 500 almonds per farm in 2018 and 600 almonds per farm in 2019 (<20 from any one tree) (Bentley et al., 2001; Doll, 2009). In 2018, 125 almonds were randomly collected from the orchard floor diagonally across each plot, and almonds from each farm were pooled across plots. The samples were collected identically in 2019, but 150 almonds were collected per plot and were analyzed per plot. Almonds were stored in a −20°C freezer until they were inspected. The almonds were each categorized as having no pest damage, navel orange worm damage (Amyelois transitella [Walker]; Lepidoptera: Pyralidae), ant damage (Formicidae), oriental fruit moth damage (Grapholita molesta [Busck]; Lepidoptera: Tortricidae), peach twig borer damage (Anarsia lineatella Zeller; Lepidoptera: Gelechiidae), leaf footed plant bug (LFPB) or stinkbug damage (Hemiptera: Coreidae, Pentatomidae), and unknown pest damage (Bentley et al., 2001; Doll, 2009; Symmes, 2018). Regarding the no pest damage qualification, this designation was separated based upon the USDA standard for serious damage (USDA, 1998). These designations were: zero pest damage and no serious pest damage (still edible and would make a USDA grade). The almonds that fell in the less strict standard (no serious pest damage) were those that had slight discolorations and/or indentations, indicative of minor LFPB or stinkbug damage, while still making an edible USDA grade (USDA, 1998).
We quantified the nutrient composition of 500 almonds per orchard in 2018 and 600 almonds per orchard in 2019 (<20 from any one tree). In 2018, 125 almonds were randomly collected from the orchard floor diagonally across each plot, and almonds from each farm were pooled across plots. The samples were collected identically in 2019, except the 150 almonds per plot were not pooled across plots. Almonds were analyzed for the following nutrients at mg/g basis: Total Carbon, Total Nitrogen, Phosphorus, Potassium, Calcium, Magnesium, Sodium, Sulfur, Zinc, Iron, Manganese, Copper, Boron, Aluminum, Molybdenum (Regen Ag Labs, Pleasanton, NE). To quantify the overall nutrient profile of the almonds we utilized the Shannon index (H′), Simpson index (DS), and Peilou's community evenness index (J). Briefly, almonds (30 g; stored at −20°C) were ground to pass through a 1 mm sieve. Total Carbon and Nitrogen was determined via dry combustion elemental analysis using a LECO 928C/N analyzer (LECO, St. Joseph, MI). For the other nutrients, the ground almonds were digested with nitric and hydrochloric acid to burn off organic matter. Hydrogen peroxide was then added to dissolve any fats and oils within the sample. The samples were brought to a high boiling point and then cooled under the hood. Once cooled, the samples were brought to volume, mixed, and filtered. Finally, the digested samples were placed into test tubes and the nutrient levels were determined via inductively coupled plasma mass spectrometry (Thermo iCAP 7400 ICP-OES Duo, ThermoFisher Scientific, Waltham, MA).
A producer survey was used to determine management practices, costs, and revenues that contributed to the direct net profitability of each operation (Supplementary Materials). Under production operating costs, the study included costs associated with winter sanitation, sampling for tree nutrient status and soil salinity, pH, and nutrient levels, irrigation and frost protection, fertilizers, insecticides, herbicides, fungicides, disease treatment sprays, trapping vertebrate pests, cover crop seed/bag, tillage, mowing, flamers, grazers, and harvest. Within the harvest category the study factored the hourly labor to conduct the harvest and/or the price paid to external contractors, kernel kg/ha, returns, and additional revenue streams such as almond hulls and co-products, as well as returns on harvesting the grazing livestock (Klonsky et al., 2016). No farm in the study reported additional revenue from grazers or additional revenue streams such as almond hulls, but two regenerative orchards reported revenues from selling value added products, such as almond butter. Under labor and operating costs, the study included people hours worked at a rate of $18.90/h (Klonsky et al., 2016; Yaghmour et al., 2016). For the yield analysis, one conventional (too young) and one regenerative orchard (information not supplied) from the Capay Valley were not included. For the profitability analysis, in addition to the two orchards we excluded from the yield analysis, we omit an additional regenerative orchard, as its 2019 revenue numbers have not yet come in (N = 13).
Unless otherwise noted, data are reported as mean values followed by ±SE and α = 0.05. Analyses were performed in R (R development Core Team, https://www.r-project.org/, version 4.0). The study used the lme4 package to create the General Linear Mixed Models (GLMM) (Bates et al., 2015). To calculate the biodiversity indices we used the vegan: Community Ecology package (Oksanen et al., 2019). For non-parametric statistical calculations and comparing models the study used the RVAideMemoire: Testing and Plotting Procedures for Biostatistics and the Modern Applied Statistics with S. Fourth Edition packages (Brian et al., 2002; Hervé, 2020). For linear regression analysis and performing the Bonferroni Outlier Test, the analyses used the Companion to Applied Regression (car) package (Fox and Weisberg, 2019). The R base package was used for the multivariate analyses and the micompr R package (Fachada, 2018) was used to ensure the assumptions were met for those analyses (Supplementary Materials). The R package Rstatix (Kassambara, 2020) was used to determine collinearity. Th R base package and ggplot2 (Wickham, 2016) were used for the Principal Component Analysis (PCA).
We used univariate analyses to test whether regenerative and conventional orchards differed in their TSC, TSN, BD, water infiltration rates, macro and micro nutrients, microbial communities, invertebrate biomass, invertebrate and Arthropoda abundance, the Shannon-Wiener diversity Index (H′), species richness, species evenness, pest damage, the particular nutrient levels of the almonds, as well as nutrient distribution in the almonds as determined by H′, DS, and Pielou's Evenness (J), yield, revenue, costs, and profitability. As is standard practice, the vegan package log transformed the count of the invertebrate morphospecies to derive the H′ index. MANOVA was used to confirm the patterns in soil and biological response variables that were revealed by our univariate assessments, and investigate whether or not collinearity among the response variables was a driver of these relationships (Supplementary Table 1). Principle Component Analysis (PCA) was used to assess the interactions among the soil quality and biological metrics, as well as the importance of management practices in determining those metrics. Further, this analysis was used to determine whether our designation of regenerative and conventional orchards accurately distinguished the response variables we observed. To evaluate the association between management practices with the first two components of the ordination, we conducted Spearman rank correlations. The False Discovery Rate correction (FDR) was used to adjust for multiple comparisons. Similarly, Spearman rank correlations were used to assess the degree of association among the soil quality and biological metrics. Since the PCA used a wide range of metrics we used the prcomp command (Center = TRUE, scale. = TRUE) in base R to center and scale the model before performing the PCA. Center = TRUE, centers the variables so they have a mean of zero, while scale = TRUE scales the variables to have a standard deviation of one.
During data collection these samples were pooled at the farm level, resulting in N = 16. The data was mostly normally distributed, so Welch's paired t-test was used for those samples. The exceptions were: total Phosphorus, inorganic Phosphorus, organic Phosphorus, and available Phosphorus. For these samples neither the data nor the residuals of the one-way ANOVA model were normally distributed, so we utilized the non-parametric Mood's Median test.
Soil BD and gravimetric moisture percentage data was averaged across plots and analyzed at the farm level (N = 16). Soil water infiltration rates were only measured on the eight farms sampled in 2019. Water infiltration data was averaged across sampling trips and analyzed at the farm level (N = 8). All these variables were analyzed using one-way ANOVA.
Total soil carbon and total soil nitrogen data was analyzed at the plot level, with GLMM's used to analyze the data. To investigate how Total soil carbon and total soil nitrogen varied across soil depths in regenerative and conventional orchards, we ran GLMM's. Total soil carbon or total soil nitrogen in the various ESM layers were the response (Re) variables, treatment and clay percentage were the fixed factors (F), and farm was the random factor (Ra), [ESM Layer TSC/TSN(Re) × Treatment(F) + Clay%(F) + Farm(Ra), Number of observations = 49, groups: Farm = 16]. The second GLMM designated TSC as the response variable, the years regenerative, years conventional and clay percentage as fixed factors, and farm was the random factor [ESM Layer TSC(Re) × Years Regenerative/Years Conventional(F) + Clay%(F) + Farm(Ra), Number of observations = 49, groups: Farm = 16]. These models were run for the 0–3,000 Mg and 0–6,000 Mg ESM depth layers. As we only took three surface BD/soil texture samples per farm, one TSC/TSN soil sample per farm was randomly excluded from the GLMMs. Most of these models used a Gaussian distribution with the Gauss-Hermite approximation set to 1 (corresponding to the Laplace approximation; Bates et al., 2015). However, when examining TSC and TSN between the 3,000–6,000 Mg ESM layers the GLMM had to be built using a Gamma distribution. Additionally, the integer scalar was set to zero which optimized the random and fixed-effects coefficients in the penalized iteratively reweighted least squares step (Bates et al., 2015). Due to the current interest in utilizing regenerative management to sequester carbon we isolated the effect of each regenerative practices by analyzing the effect of all the regenerative management practices and soil clay percentage on TSC via multiple regression.
During data collection these samples were pooled at the farm level, resulting in N = 16. While the data itself tended not to be normally distributed, the residuals from the one-way ANOVA models tended to be normally distributed allowing for the use of one-way ANOVA for most of these analyses. The exceptions were: Gram (–) %, Rhizobia Biomass, Rhizobia %, Sat: Unsat, Mono: Poly, Gram (+): Gram (–). For these samples neither the data nor the residuals of the one-way ANOVA model were normally distributed, so we utilized the non-parametric Mood's Median test.
Plant species richness and ground coverage (0–25, 25–50, 50–75, 75–100%) were analyzed at the farm level (N = 16). Plant species richness was assessed using one-way ANOVA analysis and ground coverage was assessed using Mood's Median test.
To compare invertebrate biomass, diversity, and species richness among conventional and regenerative orchards we averaged these metrics across plots and sampling trips, resulting in this data being analyzed at the farm level (N = 16). This normalized the data allowing for the use of Welch's paired t-test to analyze this data.
To compare pest damage among regenerative and conventional orchards the data was averaged at the farm level (N = 16) and one-way ANOVA analysis was used.
To analyze the relationship between invertebrate biodiversity and pest damage we built separate GLMM's. Pest damage was the response variable, H′ and species richness were the fixed factors, and farm was the random factor [Diversity Index(Re) × Treatment (F) + Farm (Ra); N = 40. Groups: Farm = 16]. These models used a Gaussian distribution with Gauss-Hermite approximation set to 1 (corresponding to the Laplace approximation) (Bates et al., 2015).
To analyze differences in nutrient levels and the distribution of nutrients within the almonds we used a GLMM. Nutrient type was the response variable, treatment was the fixed factor, and farm was the random factor [Nutrient/Nutrient Distribution (Re) × Treatment (F) + Farm (Ra); N = 40, groups: Farm = 16]. These models used a Gaussian distribution with Gauss-Hermite approximation set to 1 (corresponding to the Laplace approximation; Bates et al., 2015).
Yield (N = 14) and profitability data (N = 13) was collected at the farm level. This data was normally distributed, resulting in the use of Welch's paired t-test to analyze this data.
Soil macronutrients and micronutrients were calculated on a per farm basis (N = 16) (Table 2). Regenerative orchards contained higher levels of Water Extractable Organic Matter (WEOM), which is comprised of WEON and WEOC. Regenerative orchards also had higher levels of total Phosphorus, inorganic Phosphorus, available Phosphorus, Calcium, and Sulfur. Conventional orchards had significantly more aluminum than regenerative orchards. The soil quality index, Haney Soil Scores, were higher in regenerative orchards (Figure 1).
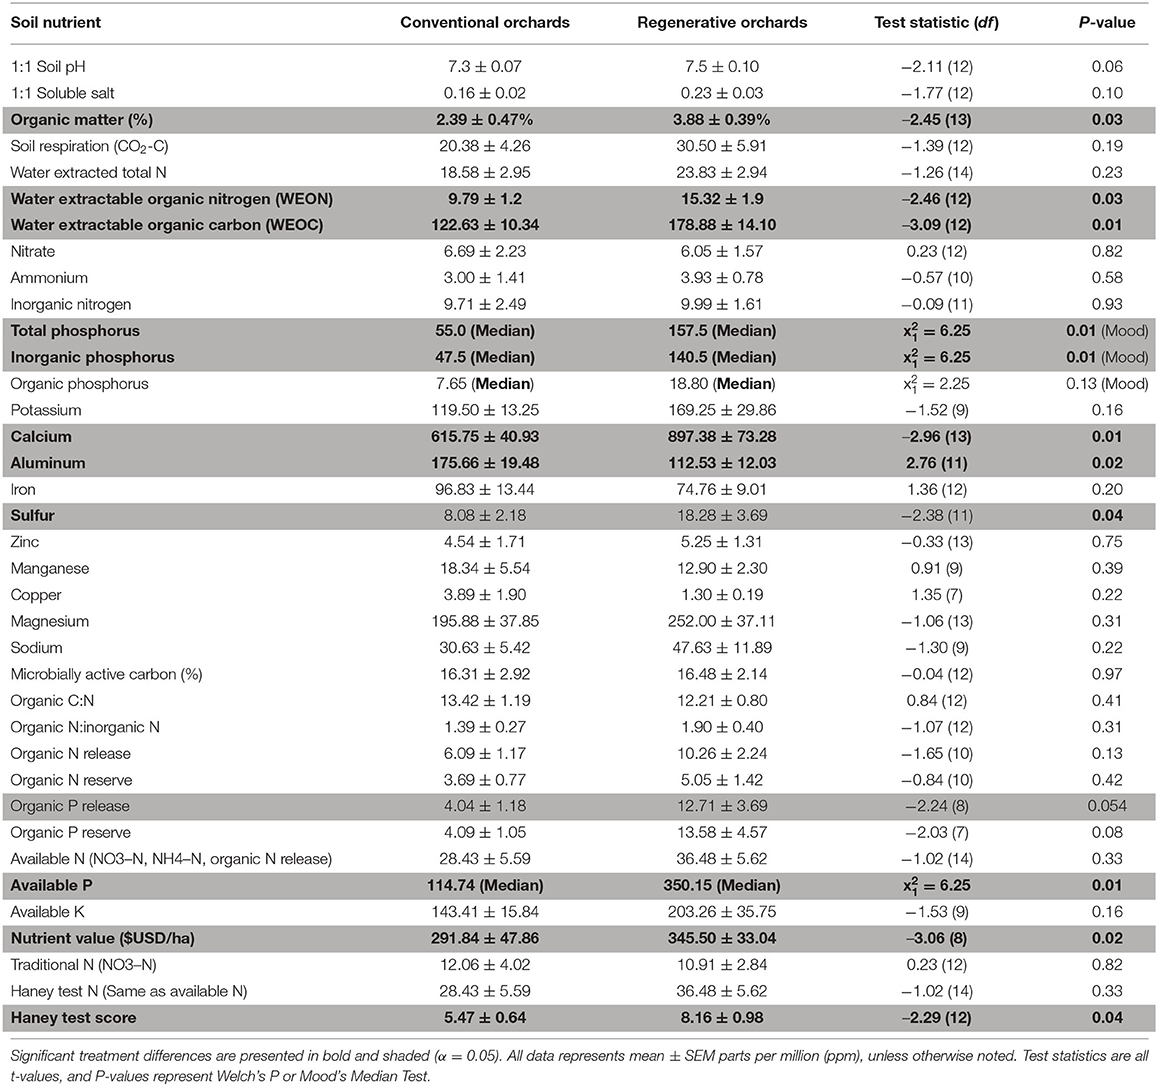
Table 2. Soil nutrients in regenerative and conventional orchards (N = 16).
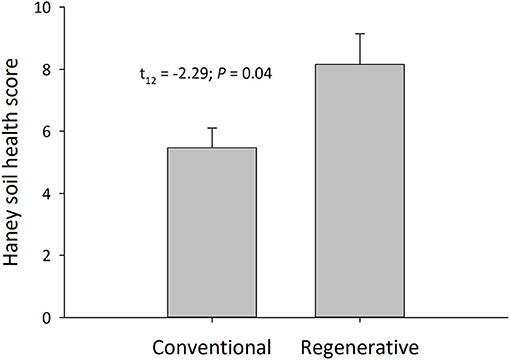
Figure 1. Haney soil health scores in regenerative and conventional almond orchards (mean ± SEM, N = 16 orchards; Welch's two-sample t-test; α = 0.05).
The soils in regenerative orchards had lower bulk densities and more effectively infiltrated water. The mean surface BD in regenerative orchards was 1.16 ± 0.02 g/cm3, and in conventional orchards it was 1.33 ± 0.05 g/cm3 [N = 16; = 0.45, F(2, 13) = 7.02, treatment P = 0.004, clay P = 0.21]. In conventional orchards, the mean amount of time it took 444 ml of water to infiltrate the soil was 3,855 ± 1,213 s, and in regenerative orchards it was 609 ± 302 s [N = 8; = 0.45, F(1, 6) = 6.74, P = 0.04] (Figure 2). Gravimetric soil moisture percentage was higher in regenerative orchards when comparing all the orchards and when only the 2019 orchards were compared (orchards in which we tested for water infiltration). The mean soil gravimetric moisture percentage of all the regenerative orchards was 25 ± 2% and for all the conventional orchards it was 18 ± 2% [N = 16; = 0.22, F(1, 14) = 5.21 P = 0.04].
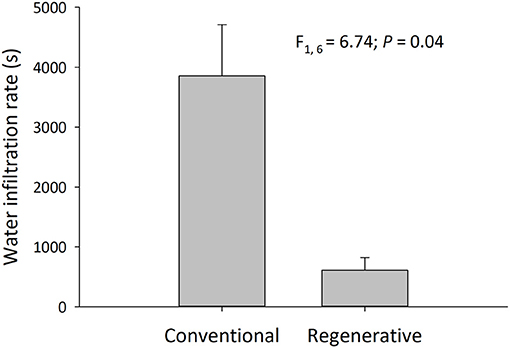
Figure 2. Time required for soils to infiltrate a 5 cm rain event (One-way ANOVA; mean ± SEM, N = 8 orchards, α = 0.05). Water infiltration rates were measured once per orchards during bloom and fruit development in 2019. A smaller number means that water infiltrated into the soil at a faster rate.
Regenerative orchards had significantly higher levels of TSC, TSN, through all the ESM strata (0–6,000 Mg ESM layers; Figure 3; Table 3). Through the 0–6,000 Mg ESM layer (Total TSC Mg /ha) regenerative orchards had 54.52 ± 4.76 Mg TSC/ha, while conventional orchards contained 41.37 ± 7.27 Mg TSC/ha. Through the 6,000 Mg ESM layer, regenerative orchards had significantly higher TSC, and the amount of TSC increased as soil clay increased [ESM Layer TSC/TSN(Re) × Treatment(F) + Clay%(F) + Farm(Ra); Table 3]. Through the 6,000 Mg ESM layer, regenerative orchards contained 5.96 ± 0.45 Mg TSN/ha, while conventional orchards contained 5.00 ± 0.53 Mg TSN/ha (Table 2). The TSC:TSN ratio in regenerative orchards through the 6,000 Mg ESM layer was 9.42 ± 0.41 and in conventional orchards it was 8.01 ± 0.66 (N = 49; treatment: = 3.46, P = 0.06; clay: = 7.13, P = 0.01). Regenerative orchards had significantly more SOM% than conventional orchards, 3.88 ± 0.39 and 2.39 ± 0.47%, respectively [N = 16, P = 0.03, t(−13) = 2.45].
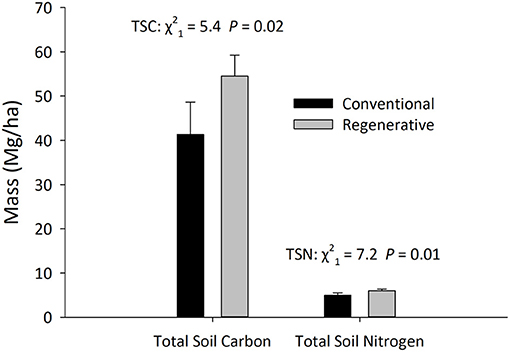
Figure 3. The differences in carbon and nitrogen through the 0–6,000 mg Equivalent Soil Mass (ESM) layer (~0–60 cm) in regenerative and conventional almond orchards (mean ± SEM). Statistical significance was determined using Linear Mixed Models, in which treatment and clay percentage were fixed factors, and farm was a random factor (N = 49 observations across 16 orchards, α = 0.05).
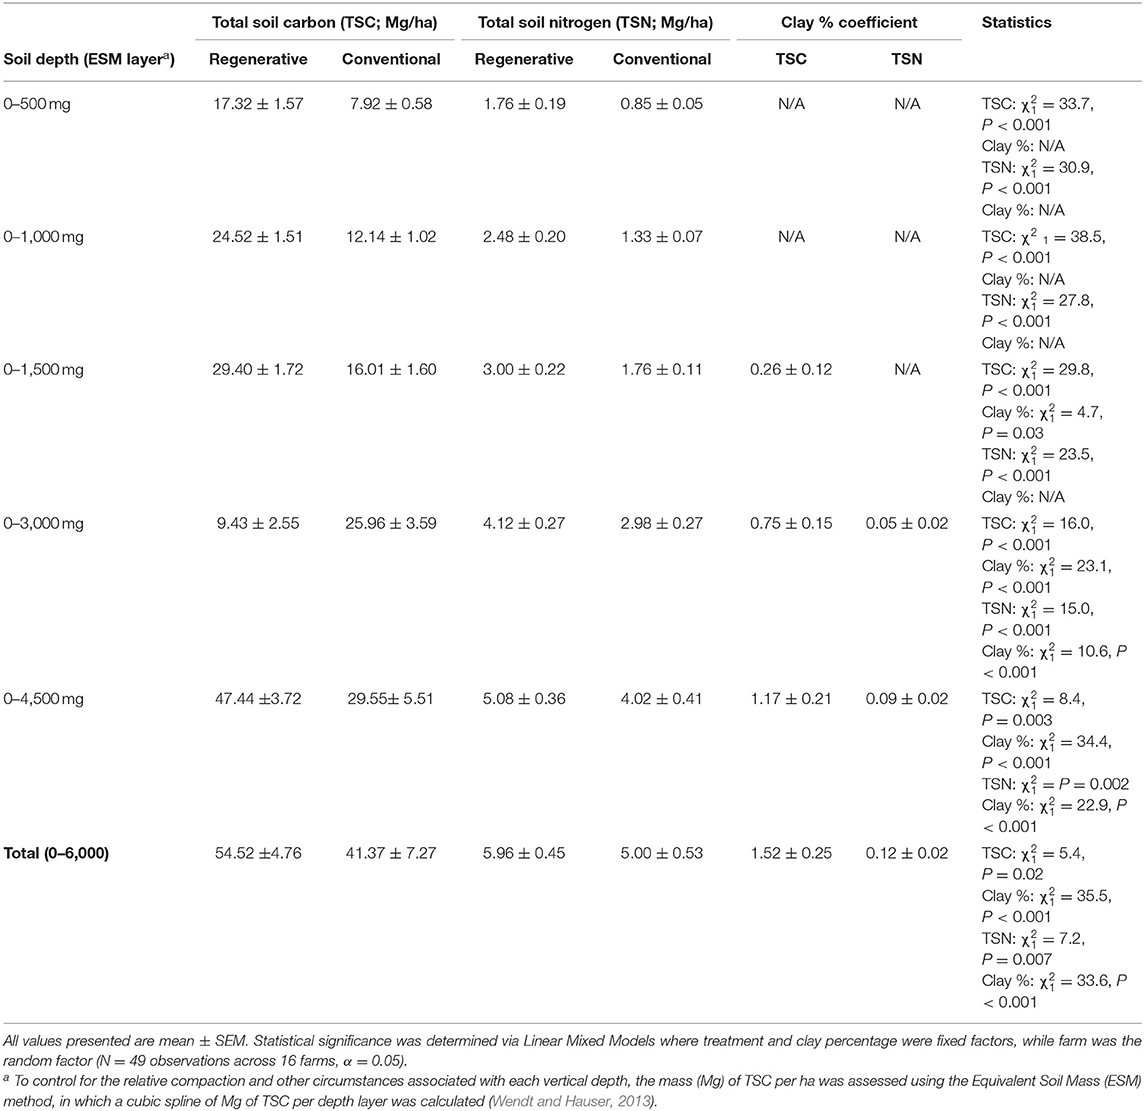
Table 3. The differences in carbon and nitrogen at different soil depths in regenerative and conventional almond orchards.
Total Soil Carbon and TSN varied by treatment among the different soil depths. In the top 1,000 Mg ESM of soil, regenerative orchards had significantly more TSC and TSN, regardless of how much soil clay was present (Table 3). Clay became a significant factor in determining TSC at the 1,500 Mg ESM layer, but with TSN, clay was not a significant factor until the 3,000 Mg ESM layer (Table 3). The greatest percentage of TSC was found at the 0–500 Mg ESM layer. In regenerative systems the 0–500 Mg ESM layer accounted for 32% of the systems' TSC and 30% of its TSN. In conventional systems it accounted for 19% of the TSC and 17% of the TSN. The 0–1500 Mg ESM layer accounted for 54% of the TSC and 50% of the TSN in regenerative systems, while in conventional systems this layer contained 39% of the TSC and 35% of the TSN. The 0–3000 Mg ESM layer accounted for 72% of the TSC and 69% of the TSN in regenerative systems and 63% of the TSC and 59% of the TSN in conventional systems. Between the 3,000 and 6,000 Mg ESM layers there was no difference in TSC (N = 49; treatment: = 0.10; P = 0.75; clay: = 35.79; P < 0.001) and TSN (N = 49; treatment: = 0.46, P = 0.50; clay: = 32.29, P < 0.001) based on treatment.
The duration that these orchards had been in their respective systems had significant effects on soil carbon. The year by management type interaction term of the general linear mixed model was significant [ESM Layer TSC(Re) × Years Regenerative/Years Conventional(F) + Clay%(F) + Farm(Ra)]. Through the 3,000 Mg ESM layer, number of years under regenerative management correlated with increasing TSC (N = 49; = 5.86, P = 0.02), while conventional management correlated with decreasing TSC ( = 4.85, P = 0.03; clay: = 31.88, P < 0.001). Similarly, when we examined 0–6,000 Mg ESM layer in relation to time, regenerative management correlated with the buildup of TSC (N = 49; treatment: = 8.07; P = 0.005; clay: = 33.00; P < 0.001), and years under conventional management correlated significantly with reductions in TSC (N = 49; treatment: = 10.20; P = 0.001; clay: = 42.13; P < 0.001).
Ground cover was the parameter best correlated with TSC through the soil column. Multiple regression models revealed that keeping 75–100% of the ground covered with vegetation was the sole practice that scaled with TSC through the 6,000 Mg ESM layer [N = 16; = 0.78, F(7, 8) = 8.79, model P = 0.003, ground coverage P = 0.01, clay P = 0.01].
Several metrics of soil microbial community structure were significantly different between regenerative and conventional orchards (N = 16; Table 4 and Supplementary Table 1). Soils in regenerative orchards contained greater total microbial biomass (ng/g) (Figure 4), total bacterial biomass, Gram (+) biomass, and Actinobacteria biomass (Table 4 and Supplementary Table 1). For many of these microbial community metrics there was no statistical difference between the regenerative and conventional orchards (P > 0.05). Conventional orchards never had greater metrics of microbial community structure than regenerative orchards.
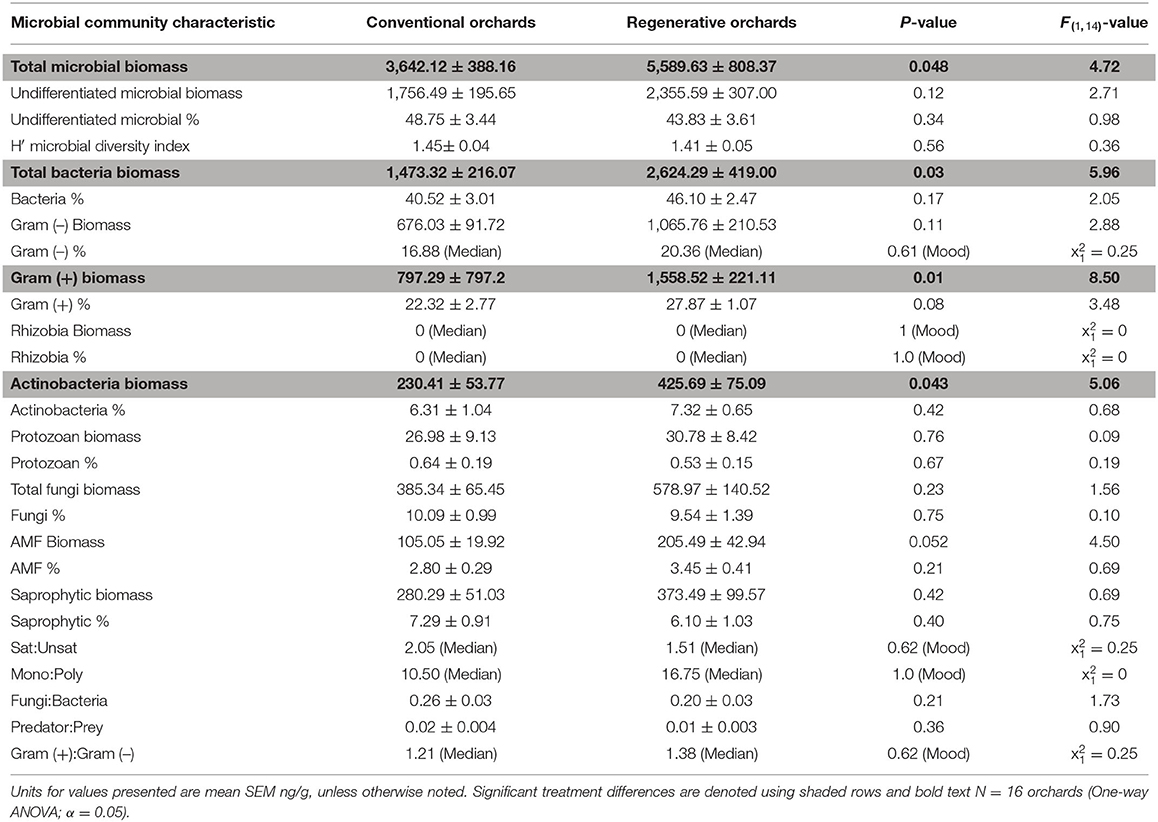
Table 4. The soil microbial community in regenerative and conventional almond orchards.
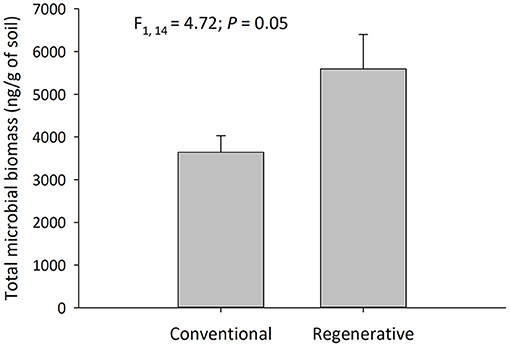
Figure 4. Total microbial biomass collected from the soil in regenerative and conventional almond orchards (mean ± SEM, N = 16 orchards, α = 0.05). This sampling occurred during the fruiting period.
Regenerative orchards had significantly more plant cover on the soil surface than conventional orchards. For regenerative orchards, the median ground coverage percentage category was 75–100% and for conventional orchards it was 0–25% (N = 16; = 9.14, Mood's P = 0.002). Additionally, regenerative orchards averaged more plant species on the floors of their orchards. The mean number of plant species on the orchard floor in regenerative orchards was 7.0 ± 0.7 and in conventional orchards it was 2 ± 0.7 [N = 16; = 0.60, F(1, 14) = 23.14, P < 0.001].
We identified 275 different invertebrate morphospecies (270 arthropod morphospecies) from almond orchards, totaling 12,414 individuals. Larvae and adults were considered separate morphospecies, as adults and larvae serve distinct ecological functions (Pecenka and Lundgren, 2019) (Supplementary Table 2). The invertebrate species consisted of eight classes across 23 orders: Araneae, Blattodea, Coleoptera, Dermaptera, Diptera, Entomobryomorpha, Geophilomorpha, Hemiptera, Hymenoptera, Julida, Lepidoptera, Lithobiomorpha, Neuroptera, Oniscidea, Opiliones, Opisthopora, Orthoptera, Psocoptera, Solifugae, Spirobolida, Stylommatophora, Symphypleona, Thysanoptera. The orders containing the highest number of morphospecies were: Coleoptera (99), Hemiptera (39), Araneae (36), Diptera (30), and Hymenoptera (28). The most abundant orders were Entomobryomorpha (3,785), Opisthopora (2,136), Hymenoptera (1,527), Coleoptera (1,274), Oniscidea (986), Araneae (827), Diptera (347), Hemiptera (305), Dermaptera (157), Lithobiomorpha (131).
Invertebrate community structure was significantly different in the regenerative and conventional orchards. Invertebrate biomass [N = 16; t(12) = −3.15, P < 0.001] and abundance [N = 16; t(13) = −3.86, P = 0.002] were significantly higher in regenerative orchards. Invertebrate biomass in regenerative orchards was 5.94 ± 0.54 g per m2, while the invertebrate biomass in conventional orchards was 1.09 ± 0.39 g per m2 (Figure 5). Invertebrate abundance in regenerative orchards was 173.92 ± 17.88 per m2, while invertebrate abundance in conventional orchards it was 84.71 ± 14.68 per m2. Arthropod (excluding Opisthopora and Gastropoda) abundance was significantly greater in regenerative orchards than in conventional orchards [N = 16; t(12) = −2.42, P = 0.03]. The mean arthropod abundance in regenerative orchards was 141.16 ± 23.55 per m2 and the mean arthropod abundance in conventional orchards was 72.60 ± 15.68 per m2. Mean earthworm (Lumbricina) abundance in regenerative orchards was 24.70 ± 6.18 m−2, while earthworm abundance in conventional orchards was 4.92 ± 1.60 per m2 [n = 16; t(7) = −3.10, P = 0.01].
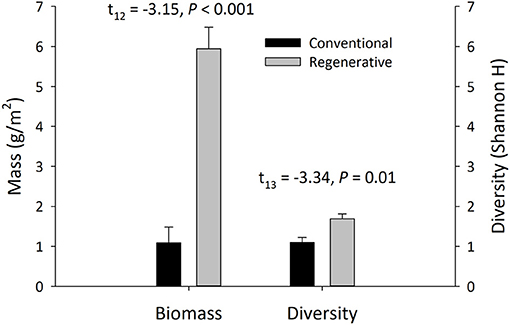
Figure 5. Invertebrate biomass and diversity (Shannon H) of the epigeal invertebrate communities in regenerative and conventional orchards (mean ± SEM, N = 16 orchards, Welch's two-sample t-test; α = 0.05). Invertebrate communities were collected during the bloom, fruit development, and harvest periods.
Regenerative orchards were significantly richer in invertebrate and arthropod morphospecies, while having more evenly distributed arthropod communities. The mean species richness of all invertebrates in regenerative orchards was 13.28 ± 1.32 and the mean species richness in conventional orchards was 6.66 ± 0.92 [N = 16; t(12) = −4.13, P = 0.001]. The mean species richness of arthropods in regenerative orchards was 12.31 ± 1.32 and in conventional orchards it was 6.08 ± 0.84 [N = 16; t(12) = −3.97, P = 0.002]. The mean J′ of invertebrates in regenerative orchards was 0.70 ± 0.02 and in conventional orchards it was 0.68 ± 0.04 [N = 16; t(11) = −0.45, P = 0.66]. The mean J′ of arthropods in regenerative orchards was 0.76 ± 0.02 and in conventional orchards it was 0.67 ± 0.04 [N = 16; t(11) = −2.15, P = 0.049].
Regenerative orchards were significantly more diverse than conventional orchards, with higher levels of invertebrate and arthropod H′. The mean H′ of all invertebrates in regenerative orchards was 1.69 ± 0.12 and the mean H′ in conventional orchards was 1.10 ± 0.12 [N = 16; t(13) = −3.34, P = 0.01] (Figure 5). These findings continue to hold true when we assessed arthropod H′. In this case, H′ of arthropod morphospecies in regenerative orchards was 1.75 ± 0.10 and H′ in conventional orchards was 1.05 ± 0.12 [N = 16; t(13) = −4.40, P = 0.001].
Pest damage was similar in regenerative and conventional orchards. Using the stricter criteria of zero pest damage the mean percent of undamaged almonds in regenerative orchards was 92.6 ± 2.5%, while the mean percent of undamaged almonds in conventional orchards was 91.0 ± 1.3% [N = 16 = −0.04, F(1, 14) = 0.33, P = 0.57]. Running the Bonferroni P outlier test indicated that one regenerative orchard was a significant outlier (P = 0.004). Without this outlier the mean percent of undamaged almonds in regenerative orchards increased to 94.9 ± 1.1% [N = 16 = 0.21, F(1, 14) = 4.52, P = 0.055]. Using the less strict standard, no serious pest damage, the mean percent of almonds without pest damage in conventional orchards was 95.3 ± 1.0% and in regenerative orchards it was 94.2 ± 2.0% [N = 16 = −0.05, F(1, 14) = 0.26, P = 0.62]. Again, the Bonferroni P outlier test indicated that one regenerative orchard was a significant outlier (P < 0.001). Without this outlier the mean percent of undamaged almonds in regenerative orchards increased to 96.1 ± 1.0%, with no difference among the percentage of undamaged almonds in regenerative and conventional orchards [N = 16, = −0.03, F(1, 13) = 0.60, P = 0.45].
The GLMM's [Zero Pest Damage (Re) × Diversity (F) + Farm (Ra)] for the stricter criteria, zero pest damage, found significant correlations between invertebrate diversity (N = 40; = 7.34, P = 0.01) and species richness (N = 40; = 4.18, P = 0.04) and reduced pest damage. The GLMM's [No Serious Pest Damage (Re) × Diversity (F) + Farm (Ra)] for the less strict criteria, no serious pest damage, also found significant correlations between H′ (N = 40; = 5.50, P = 0.02) and species richness (N = 40; = 4.23, P = 0.04) and reduced pest damage.
One metric of almond nutrient density was significantly different between regenerative and conventional orchards (N = 16; Table 5). Almonds in regenerative orchards contained higher levels of magnesium (Table 5). To better understand this difference, we ran a GLMM with years under regenerative management and years under conventional management as fixed factors. This model reveals that magnesium is negatively correlated with years under conventional management (N = 40; years conventional: = 5.22, P = 0.02; years regenerative = 0.60, P = 0.27). Further, there was no difference between regenerative and conventional orchards when we used H′, DS, or J to examine the overall nutrient profile of the almonds (P > 0.05) (Table 5).
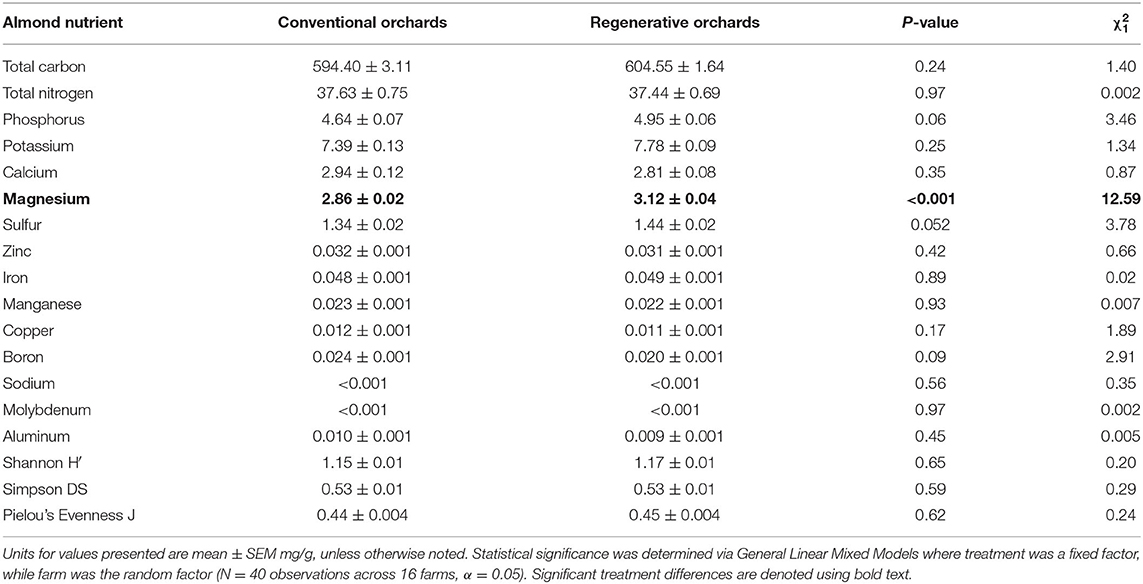
Table 5. The nutrient levels in the almonds.
There was no difference in yield between conventional (1,920 ± 315 kg/ha) and regenerative orchards (1,338 ± 248 kg/ha) [N = 14; t(11) = 1.45, Welch P = 0.17]. The yields in conventional orchards ranged from 538 kg/ha (480 lb/ac) to 3,026 kg/ha (2,700 lb/ac), with the yields in regenerative orchards ranging from 705 kg/ha (629 lb/ac) to 2,466 kg/ha (2,200 lb/ac).
Regenerative orchards were approximately twice as profitable as conventional orchards (Figure 6). The profitability of regenerative orchards [including value added products like almond butter was $15,055 ± 2,853 per ha ($6,093 ± 1,155 per ac)]. Since none of the conventional orchards sell value-added product, we only use the profit/revenue associated from selling solely almonds in subsequent analyses. The profitability of regenerative orchards not accounting for value-added products was significantly higher in the regenerative orchards vs. the conventional orchards ($5,299 ± 1,090 vs. $2,877 ± 733 per ac) [N = 13; t(9) = −2.32, P = 0.045] (Figure 6). The operating costs of regenerative orchards were $3,402 ± 425 per ha and for conventional orchards they were $2,494 ± 90.32 per ha [N = 15; t(6) = −0.86, P = 0.42]. Gross revenue of regenerative orchards was $18,178 ± 3,033 per ha and for conventional orchards it was $9,587 ± 1,851 per ha [N = 13; t(8) = −2.42, P = 0.04].
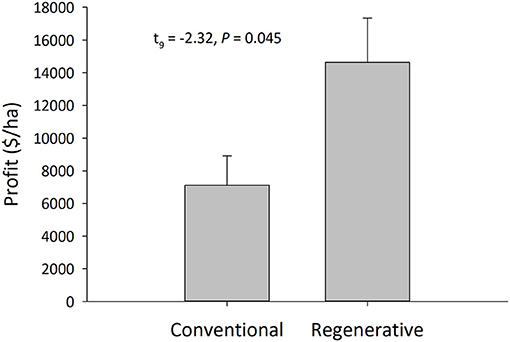
Figure 6. Net profitability of regenerative and conventional almond production systems (Welch's two-sample t-test; mean ± SEM, N = 13, α = 0.05). A producer survey was used to determine management practices, costs, and revenues that contributed to the direct net profitability of each operation. One conventional and two regenerative orchards were not included.
Principal Component Analysis confirmed our distinct treatments, and revealed that nearly all management practices were correlated with improved soil and biological properties of the orchards. Two distinct clusters separated along the first principal component, relating to farms being designated as regenerative or conventional (Figure 7). All of the soil quality and biological community metrics (BD, TSC, TSN, TSP, microbial biomass, actinobacteria biomass, invertebrate H′, and invertebrate biomass) were significantly correlated with the first component of the ordination plot, with the first component explaining 61.48% of the variance (Figure 7). Additionally, the correlations showed that, moving toward the left side of the plot along principal component 1, orchards had lower soil bulk densities, higher levels of TSC, TSN, and TSP, greater microbial and actinobacteria biomasses, and larger and more diverse invertebrate communities (Figure 7). Permanent ground coverage, avoiding synthetic agrichemical inputs, and using organic amendments/compost teas were significantly correlated with the first component of the ordination plots (Figure 7). These correlations demonstrated that these are the critical management practices driving the improved soil quality and biological community metrics associated with regenerative orchards. Of the soil quality and biological community metrics, only microbial and actinobacteria biomass were significantly correlated with the second principal component, with none of the management practices significantly correlating to the second principal component (Figure 7). These correlations showed that moving down the plot toward the bottom results in greater microbial and actinobacteria biomasses. However, as none of the management practices correlated to the second principal component, it seems likely that there may be other correlated factors outside of the analysis that may not be causal (Figure 7). We also analyzed whether gravimetric soil moisture (PC1: P = 0.08, PC2: P = 0.89) or soil clay percentage (PC1: P = 0.96, PC2: P = 0.11) correlated to either to first or second principal component and neither of these variables were significantly correlated.
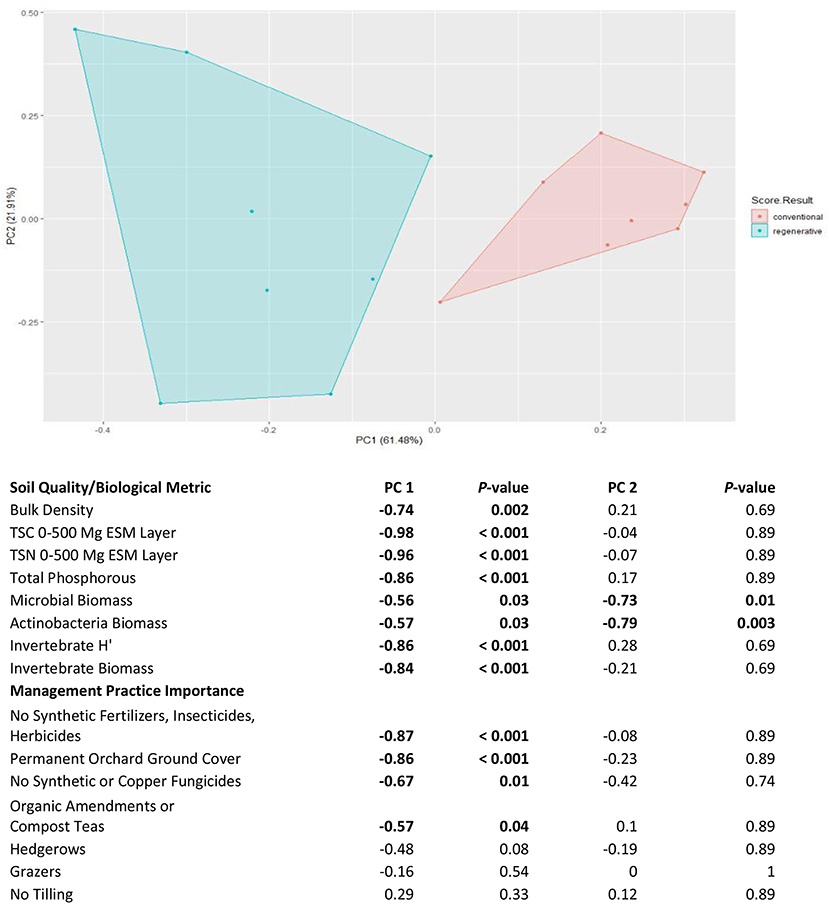
Figure 7. Principle Component Analysis of 16 almond orchards based on eight soil quality and biological community metrics. Blue points represent farms defined as regenerative and red points represent farms defined as conventional in the study. Spearman correlation coefficients are listed for associations of principle components 1 and 2, with soil quality/biological community metrics and with management practice importance. Coefficients in bold indicate significant correlations following False Discovery Rate Adjustment.
Regenerative management in almond orchards improved soil quality and increased biodiversity while producing almonds profitably. Nearly every major metric (soil carbon and micronutrient levels, water infiltration rates, and soil health indices) were improved on regenerative orchards vs. their conventional counterparts. Soil microbiology, plant community, and invertebrates (including earthworms) were also enhanced in regenerative systems, while pest damage to the nuts were equivalent in the regenerative and conventional orchards, with increasing invertebrate biodiversity correlating to reduced pest damage. Overall almond nutrient levels and yields were equivalent in the two treatments. Finally, profits were nearly doubled in the regenerative systems relative to their conventional counterparts. The soil and biological properties of the orchards were interconnected and produced by a combination of management practices, rather than just by one or two practices.
The soils in regenerative orchards contained higher levels of total phosphorus, inorganic phosphorus, available phosphorus, calcium, and sulfur, while receiving higher Haney soil quality scores. Multiple studies have found that soils with minimal disturbance and permanent ground cover provide significant benefits with regards to BD, soil carbon, and the labile SOM pool (Kosmas et al., 1997; Steenwerth and Belina, 2008; Blanco-Moure et al., 2016; Awale et al., 2017; LaCanne and Lundgren, 2018; Soto et al., 2021). With global supplies of phosphorus being depleted, and soil erosion being recognized as a key factor (Alewell et al., 2020), making phosphorus levels within the soils bioavailable to plants will be critical to maintain agricultural productivity. Calcium and sulfur are important nutrients for balancing soil texture and pH, and are essential nutrients for plants (Duke and Reisenauer, 1986; Tuteja and Mahajan, 2007). Although regenerative practices increased the abundance of specific nutrients, additional research is necessary to know whether regenerative systems have a more favorable balance of these nutrients for plant and animal growth (Parent et al., 2012). The Haney soil health score helps to give a picture of the overall balance of the soils chemical and biological properties that theoretically should reflect the relative abundances of micronutrients like calcium and sulfur, since these nutrients affect the health and productivity of soils. We hypothesize that the higher nutrient levels in the soils of regenerative orchards are due to these orchards integrating multiple regenerative practices which foster robust microbial and invertebrate communities and build topsoil, with conventional orchards probably losing topsoil to erosion (Martínez-Mena et al., 2020).
Compared to conventional orchards, regenerative orchards had 32% more TSC and 19% more TSN. These results generally align with (Soto et al., 2021) that found regenerative orchards using no till and organic amendments had 31% more SOC and 16% more TSN in the upper 20 cm of soil. The greatest percentage of TSC and TSN occurred in the upper soil levels, with the highest percentage in the 0–500 Mg ESM layer and no difference among regenerative and conventional orchards in the 3,000–6,000 Mg ESM layer (Table 4). Furthermore, the concentrations of TSC and TSN in the upper soil layers suggest that orchards' stock TSC and TSN are sensitive to orchard floor management decisions (Demestihas et al., 2017; Montanaro et al., 2017). This notwithstanding, there was value in sampling 15 cm below the root zone of almond orchards, as we did in this study (Olson and Al-Kaisi, 2015). We only observed changes in soil carbon and nitrogen in the 0–3,000 Mg EMS layer (0–30 cm) (Table 4), which may be because nearly all almond roots are in the 0–45 cm depth. Still, while the majority of the TSC and TSN occurs in the 0–3,000 Mg ESM layer, 27% of the TSC stocks of regenerative orchards and 40% of the TSC stocks of conventional orchards occur in the 3,000–6,000 Mg ESM layer (Table 4), signifying the importance of sampling to greater depths to get a more thorough accounting of almond orchards' carbon stocks (Olson and Al-Kaisi, 2015; Tautges et al., 2019). While this study did not conduct a carbon life cycle analysis, the fact that regenerative orchards contained an additional 13.15 Mg/carbon/ha (48.26 Mg/CO2 equivalents/ha), 30% more than their conventional counterparts, suggests that regenerative management in almond orchards could play a significant role in carbon sequestration.
The duration of conventional or regenerative management strongly affected soil carbon levels. The literature suggests that orchards which eliminate spatiotemporal events of bare soil while integrating organic amendments may be able to eliminate their carbon losses and build soil carbon over time (Kosmas et al., 1997; Demestihas et al., 2017; Montanaro et al., 2017; Martínez-Mena et al., 2020; Soto et al., 2021). This study's models support this hypothesis with the models, indicating positive correlations between years in regenerative farming and increasing soil C. In a meta-analysis of cover cropping and soil carbon sequestration rates, Poeplau and Don (2015) found that the integration of cover crops increased soil carbon sequestration at a rate of 0.32 ± 0.08 Mg/ha/yr through a sampling depth of 22 cm. Similarly, Ryals and Silver (2013) found a one-time compost application to grazed grasslands increased soil carbon accumulation at a rate of 1 Mg/ha/yr. Our findings suggest that regenerative management in almond orchards can play a critical role in preventing carbon losses, while also sequestering carbon. However, longer term studies, particularly transitional studies, are needed to ascertain a more exact rate at which regenerative orchards are building TSC and conventional orchards are losing it. Additionally, our results show soil clay percentage to be a significant determinant, supporting the inclusion of soil textures in future studies on this topic.
When compared to conventional orchards, regenerative orchards had lower soil bulk densities, higher gravimetric moisture percentage, and faster water infiltration rates. The same patterns were observed before and after irrigation. Research indicates that greater porosity is found in soils with lower bulk densities, thereby allowing water to infiltrate more effectively through the soil (Weil and Brady, 2017). Additionally, increasing soil carbon improves the water holding capacity of soils; one estimate is that each 1% increase in SOM increases a soil's water holding capacity by 187,000 L/ha (Nichols, 2017). The higher soil moisture percentages found in the regenerative orchards suggest that regenerative orchards more effectively retained water than their conventional counterparts. Additionally, Martínez-Mena et al. (2020) found that implementing regenerative practices in almond orchards reduced water run off by 65%. The faster water infiltration rates and higher soil moisture percentages found in regenerative orchards, combined with their significantly higher levels of soil carbon/organic matter, suggests the regenerative management in almond orchards could assist California in meeting its Sustainable Groundwater Management Act ground water recharge goals.
Higher levels of soil carbon in the regenerative orchards can be attributed in part to ground cover protecting soil aggregates, reducing erosion rates (Kosmas et al., 1997; Peregrina et al., 2010; Montanaro et al., 2017; Abdalla et al., 2020; Soto et al., 2021), and lowering decomposition rates by lowering soil temperatures (Almagro et al., 2016; Blanco-Canqui and Francis, 2016). Of all the management practices analyzed in the model, permanently maintaining orchard floor ground cover was significantly correlated with TSC at the 0–6,000 Mg ESM layer. Although maintaining ground cover is important, multi-functional almond orchards require an interwoven system of regenerative practices to be successful (Fenster et al., 2021).
Compared to conventional orchards, regenerative orchards averaged more plant species and significantly more plant biomass on their orchard floors, with a median ground coverage percentage category of 75–100%, while the median for conventional orchards was 0–25%. As the primary avenue through which energy enters the ecosystem, plants are a critical component of the carbon cycle (Weil and Brady, 2017), and drive the biodiversification of the entire system (Zak et al., 2003; Bianchi et al., 2006; Saunders et al., 2013). Additionally, plant communities play direct and indirect roles in determining soil quality in orchards (Demestihas et al., 2017; Montanaro et al., 2017; Weil and Brady, 2017), influencing, soil carbon, water infiltration rates, soil aggregate structure, and BD (Gulick et al., 1994; Liu et al., 2005; Martínez-Mena et al., 2020; Soto et al., 2021). In this study, there were several ways that farmers diversified the plant communities, including allowing resident perennial vegetation cover to persist, and deliberately planting annual cover crops and hedgerows to foster biodiversity in their operations.
Overall microbial biomass, bacteria biomass, Gram+ biomass, and Actinobacteria (a Gram+ bacteria) biomass were all significantly higher in regenerative orchards. Furthermore, microbial biomass and Actinobacteria biomass were significantly correlated to improvements in TSC, TSN, phosphorus, BD, and the invertebrate community. More robust microbial communities are associated with improved nutrient cycling and higher functioning soils (Steenwerth and Belina, 2008; Vukicevich et al., 2016, 2019; Weil and Brady, 2017). Actinobacteria, which share behavioral traits with both fungi and bacteria, produce growth-promoting compounds and metabolites such as antibiotics which are critical in helping host plants ward off pathogens (Subramanian et al., 2016). The growth promoting compounds that Actinobacteria produce help their host plants acquire nutrients under severe abiotic conditions, including droughts and times of nutrient deficiency (Subramanian et al., 2016). Finally, Actinobacteria assist in nutrient solubilization and mobilization, mycorrhizal symbioses, biological nitrogen fixation, all while producing geosmin- a key indicator of soil fertility (Subramanian et al., 2016). AMF biomass was potentially higher in regenerative orchards than in conventional orchards (the data was marginally significant; P = 0.052). AMF species can assist their plant hosts with salinity tolerance (Ye et al., 2019), phosphorous uptake (Romero-Munar et al., 2019), improve osmotic adjustment (Shahvali et al., 2020), ward off insect pests (Vannette and Hunter, 2009), and improve water use and photosynthetic efficiency (Shahvali et al., 2020). These myriad benefits culminate in enhanced growth and yield of AMF-associated plants (Kumar et al., 2015). Finally, our findings align with Kallenbach et al. (2016), who shows soil microbes playing a key role in making stable and chemically diverse soil organic carbon and Xiang et al. (2017) which found larger Actinobacteria communities strongly correlated to increases in soil carbon.
Invertebrate H′ and biomass are significantly interconnected to improvements in TSC, TSN, TSP, BD, and soil microbial communities (Figure 7). The epigeal invertebrate community directly and indirectly affects decomposition and nutrient cycling, sometimes in complex ways (Weil and Brady, 2017). In Santos et al. (1984), insecticide treatments eliminated the insect and mite community, including the predatory mites that regulated populations of bacterivorous nematodes. The result was that bacterial litter degradation was reduced by 40% in this system. Further, Cifuentes-Croquevielle et al. (2020), has proposed the invertebrate diversity should be considered a key factor in promoting soil carbon and fertility due to their critical role in driving soil fertility and environmental heterogeneity, as well as their significant stature in the soil organism community (Doube and Olaf, 1997). Additionally, Colloff et al. (2010) suggests that the collective burrowing activity soil fauna may improve soil water infiltration rates. The importance of permanent ground cover and microbial communities in maintaining/building soil carbon is clear, but the role invertebrates play is less defined. Our results suggest that a diverse and robust invertebrate community plays a key intermediary step in the process of plant litter. becoming TSC. If growers are using practices that harm the invertebrate and microbial communities in their orchards, they are likely capping their orchards' ability to build carbon and increase fertility.
There was no difference in the pest damage to almonds among regenerative and conventional orchards. We hypothesize that the mechanisms in which these two managements regimes attained low pest densities are fundamentally different. Conventional orchards largely eliminate their ground cover with herbicides, and respond to pest outbreaks using multiple insecticide applications per year. Regenerative replaced synthetic pesticides with more robust ground cover on their orchard floors, and this in turn supports more diverse and abundant invertebrate populations. This agrees with this study's GLMM's, which found significant correlations between increased invertebrate diversity and reduced pest damage. These results support previous research that shows pest populations are inversely related to that invertebrate diversity in agricultural systems (Lundgren et al., 2006; Eilers and Klein, 2009; Chaplin-Kramer et al., 2011; Lundgren and Fausti, 2015; Demestihas et al., 2017; LaCanne and Lundgren, 2018).
Regenerative management did not seem to reduce almond yields. The 2018 and 2019 yield average for the three counties (Butte, Merced, and Yolo) in the study was: 1,931 kg/ha (Butte, 2020; Merced, 2020; Yolo, 2020). This aligns with the mean yield of the conventional orchards in this study, 1,920 kg/ha ± 315, suggesting that the yields from the conventional orchards in this study were representative of the counties in which they were located. This similarity in yields between ecologically intensive food systems and conventional systems has been seen elsewhere (Ponisio et al., 2015; Soto et al., 2021), with improvements to the biodiversity of farming systems being shown to provide a wide swath of ecosystem services without sacrificing crop yield (Tamburini et al., 2020). To accomplish this, regenerative orchards replaced synthetic agrichemical inputs with more robust microbial communities, diverse ground covers, organic amendments, and invertebrate diversity that increased soil nutrient levels, made more water available to the trees, and managed pest pressure to a similar level. A common claim is that regenerative orchards improve the nutrient density of the farm product; this may be true in some systems, but we found that magnesium was the only nutrient that was significantly improved in this study. Examining these data under different cropping conditions, and within the context of how agrichemicals might affect the bioavailability of these nutrients for almond consumers, warrants additional attention. To our knowledge, this is the first published examination of relative nutritional contents of regenerative farm products.
Despite having similar yields, regenerative orchards were twice as profitable as conventional orchards. The greater revenue of the regenerative orchards was due to the premium paid for almonds grown in regenerative systems. All the regenerative producers in this study were certified organic, allowing them to receive the organic premium in the wholesale market. One other paper found similar profitability of regenerative farms relative to conventional (LaCanne and Lundgren, 2018), but in that case there were substantial treatment effects on production costs in the regenerative and conventional corn fields. Our work indicates there may be greater opportunity to cut costs in regenerative orchards than in conventional orchards as regenerative systems become more widespread. Although there was no difference in operating costs on average between the two systems, these costs were consistent in the conventional orchards, whereas they varied substantially in regenerative orchards. The variability in cost that we see in regenerative orchards ranged from $1,064 to $9,327/ha, and appeared to be driven by the higher costs incurred by the smaller operators. These smaller scale regenerative producers paid significantly more labor and amended their harvesting practices. They recoup these costs by direct marketing their products and by appealing to niche markets. When we look at the costs from the large-scale, wholesale regenerative producers, their costs vary less ($1,577–$2,614/ha), and are approximately 80% the conventional orchard costs ($2,357–$2843/ha). Regenerative agricultural systems are a fairly recent evolution of our food system, and a consistent formula of practices have yet to be defined by farmers to characterize regenerative systems; this variability in systems may contribute to the variability in the expenditures observed in regenerative orchards. The end result was that regenerative almonds are more profitable than conventional systems, and because yields were equivalent, and the potential for reducing input costs, the profitability of regenerative almonds is expected to be equal or greater than conventional almonds, even if regenerative almond producers do not receive a premium for their product.
Overall, the performance of regenerative orchards is a result of them developing a full regenerative system that stacks multiple regenerative practices into a single operation. Their performance is not due to any one management practice. Rather, increasing the number of regenerative practices correlates to improved performance (Fenster et al., 2021), with permanent ground coverage, the avoidance of synthetic agrichemical inputs, and the use of organic amendments correlated with regenerative outcomes of soil health and biodiversity promotion (Figure 7). This analysis adds a layer of nuance to the stacking concept, suggesting that there is a core set of practices that establish a foundation for improving soil quality and biological community metrics. One would expect abstaining from tillage to be a key management practice. However, as 88% of the orchards in the study avoided tillage this appears to indicate that solely avoiding tillage will not improve critical soil quality and biological metrics. The success of regenerative orchards is the result of these agroecosystems being more robust, with additive or synergistic interconnections among components of the system (Figure 7). For example, soil BD, TSC, TSN, TSP, microbial biomass, actinobacteria biomass, invertebrate H′, and invertebrate biomass were all correlated to one another, and regenerative management drives these interconnections (Figure 7 and Supplementary Table 1). Our results support the notion that converting agriculture over to regenerative systems could contribute to remediating several imminent global problems, including climate change, diminishing water resources, biodiversity loss, agricultural pollution, human health problems, and diminishing rural economies.
The original contributions presented in the study are included in the article/Supplementary Materials, further inquiries can be directed to the corresponding author/s.
TF and JL conceived and designed the study. JL, TF, and PO helped to develop the methodology, analyze the results, and prepare the manuscript. All authors contributed to the article and approved the submitted version.
This work was supported by Ecdysis Foundation, Patagonia Foundation, and W-SARE graduate student fellowship GW19-193. Ward Laboratories provided the soil macronutrient and micronutrient testing, as well as PLFA analysis free of charge.
The authors declare that the research was conducted in the absence of any commercial or financial relationships that could be construed as a potential conflict of interest.
All claims expressed in this article are solely those of the authors and do not necessarily represent those of their affiliated organizations, or those of the publisher, the editors and the reviewers. Any product that may be evaluated in this article, or claim that may be made by its manufacturer, is not guaranteed or endorsed by the publisher.
We thank Chris Bradley, Charles Fenster, Ian Lundgren, Ali Mohammedsabri, and Hilary Vanderheiden for helping collect field samples. We thank Dr. Erica Wildy for providing logistical support. Dr. Kelton Welch and Mark F. Longfellow helped to identify the invertebrates for the analyses. We thank Ward Laboratories for running the PLFA analysis, as well as the soil macronutrient and micronutrient testing. We thank Regen Ag Labs for running the almond nutrient density testing. We thank Dr. Inge Armbrecht for serving as the editor of the manuscript. Finally, we thank the two reviewers for their time and invaluable comments/suggestions.
The Supplementary Material for this article can be found online at: https://www.frontiersin.org/articles/10.3389/fsufs.2021.664359/full#supplementary-material
Abdalla, K., Mutema, M., and Hill, T. (2020). Soil and organic carbon losses from varying land uses: a global meta-analysis. Geograph. Res. 58, 167–185. doi: 10.1111/1745-5871.12389
Alewell, C., Ringeval, B., Ballabio, C., Robinson, D. A., Panagos, P., and Borrelli, P. (2020). Global phosphorus shortage will be aggravated by soil erosion. Nat. Commun. 11:4546. doi: 10.1038/s41467-020-18326-7
Almagro, M., de Vente, J., Boix-Fayos, C., García-Franco, N., Melgares de Aguilar, J., González, D., et al. (2016). Sustainable land management practices as providers of several ecosystem services under rainfed Mediterranean agroecosystems. Mitig. Adapt. Strateg. Glob. Change 21, 1029–1043. doi: 10.1007/s11027-013-9535-2
Awale, R., Emeson, M. A., and Machado, S. (2017). Soil organic carbon pools as early indicators for soil organic matter stock changes under different tillage practices in inland Pacific Northwest. Front. Ecol. Evol. 5:96. doi: 10.3389/fevo.2017.00096
Barbosa, P., Hines, J., Kaplan, I., Martinson, H., Szczepaniec, A., and Szendrei, Z. (2009). Associational resistance and susceptibility: having right or wrong neighbors. Annu. Rev. Ecol. Evol. Syst. 40, 1–20. doi: 10.1146/annurev.ecolsys.110308.120242
Bates, D., Mächler, M., Bolker, B., and Walker, S. (2015). Fitting linear mixed-effects models using lme4. J. Stat. Softw. 67, 201–210. doi: 10.18637/jss.v067.i01
Beard, J. D., Umbach, D. M., Hoppin, J. A., Richards, M., Alavanja, M. C. R., Blair, A., et al. (2014). Pesticide exposure and depression among male private pesticide applicators in the agricultural health study. Environ. Health Perspect. 122, 984–991. doi: 10.1289/ehp.1307450
Bentley, W. J., Hendricks, L., Duncan, R. A., Silvers, C., Martin, L. A., Gibbs, M., et al. (2001). BIOS and conventional almond orchard management compared. Calif. Agric. 55, 12–19. doi: 10.3733/ca.v055n05p12
Bianchi, F.J.J.A., Booij, C. J. H., and Tscharntke, T. (2006). Sustainable pest regulation in agricultural landscapes: a review on landscape composition, biodiversity and natural pest control. Proc. Roy. Soc. B 273, 1715–1727. doi: 10.1098/rspb.2006.3530
Blanco-Canqui, H., and Francis, C. A. (2016). Building resilient soils through agroecosystem redesign under fluctuating climatic regimes. J. Soil Water Conserv. 71, 127A−133A. doi: 10.2489/jswc.71.6.127A
Blanco-Moure, N., Gracia, R., Bielsa, A. C., and López, M. V. (2016). Soil organic matter fractions as affected by tillage and soil texture under semiarid Mediterranean conditions. Soil Tillage Res. 155, 381–389. doi: 10.1016/j.still.2015.08.011
Brian, A., Venables, B., Bates, D. M., Firth, D., and Ripley, M. B. (2002). Modern Applied Statistics with S. New York, NY: Springer. doi: 10.1007/978-0-387-21706-2
Bugg, R. L., Anderson, G., Eck, R., Hendricks, L., and Lashbrook, C. (1994). “Biologically Integrated Orchard Systems (BIOS) for Almonds in Merced County,” in Community Alliance with Family Farmers Foundation (Davis, CA).
Chaplin-Kramer, R., O'Rourke, M. E., Blitzer, E. J., and Kremen, C. (2011). A meta-analysis of crop pest and natural enemy response to landscape complexity. Ecol. Lett. 14, 922–932. doi: 10.1111/j.1461-0248.2011.01642.x
Cifuentes-Croquevielle, C., Stanton, D. E., and Armesto, J. J. (2020). Soil invertebrate diversity loss and functional changes in temperate forest soils replaced by exotic pine plantations. Sci. Rep. 10, 1–11. doi: 10.1038/s41598-020-64453-y
Colloff, M. J., Pullen, K. R., and Cunningham, S. A. (2010). Restoration of an ecosystem function to revegetation communities: the role of invertebrate macropores in enhancing soil water infiltration. Restor. Ecol. 18, 65–72. doi: 10.1111/j.1526-100X.2010.00667.x
Demestihas, C., Plénet, D., Génard, M., Raynal, C., and Lescourret, F. (2017). Ecosystem services in orchards. A review. Agron. Sustain. Dev. 37:12. doi: 10.1007/s13593-017-0422-1
Derpsch, R., Franzluebbers, A. J., Duiker, S. W., Reicosky, D. C., Koeller, K., Friedrich, T., et al. (2014). Why do we need to standardize no-tillage research? Soil Till. Res. 137, 16–22. doi: 10.1016/j.still.2013.10.002
Doube, B. M., and Olaf, S. (1997). “Can the abundance or activity of soil macrofauna be used to indicate the biological health of soils?,” in Biological Indicators of Soil Health : Biological Indicators of Soil Health, C. Pankhurst, B. M. Doube, and V. V. S. R. Gupta (Oxon, UK: CAB International), 265–295.
Drenovsky, R. E., Steenwerth, K. L., Jackson, L. E., and Scow, K. M. (2010). Land use and climatic factors structure regional patterns in soil microbial communities. Glob. Ecol. Biogeogr. 19, 27–39. doi: 10.1111/j.1466-8238.2009.00486.x
Duke, S. H., and Reisenauer, H. M. (1986). “Roles and requirements of sulfur in plant nutrition,” in Sulfur in Agriculture, Agronomy Monograph 27, ed. American Society of Agronomy (Madison, WI: American Society of Agronomy), 123–168. doi: 10.2134/agronmonogr27.c4
Eilers, E. J., and Klein, A.-M. (2009). Landscape context and management effects on an important insect pst and its natural enemies in almond. Biol. Control 51, 388–394. doi: 10.1016/j.biocontrol.2009.07.010
Fachada, N. (2018). micmpr: multivariate independent comparison of observations. J. Open Source Softw. 3:430. doi: 10.21105/joss.00430
Fenster, T. L. D., LaCanne, C. E., Pecenka, J. R., Schmid, R. B., Bredeson, M. M., Busenitz, K. M., et al. (2021). Defining and validating regenerative farm systems using a composite of ranked agricultural practices [version 1; peer review: 2 approved]. F1000Research 10:115. doi: 10.12688/f1000research.28450.1
Fernandez-Calvino, D., Soler-Rovira, P., Polo, A., Diaz-Ravina, M., Arias- Estevez, M., and Plaza, C. (2010). Enzyme activities in vineyard soils long-term treated with copper-based fungicides. Soil Biol. Biochem. 42, 2119–2127. doi: 10.1016/j.soilbio.2010.08.007
Fox, J., and Weisberg, S. (2019). An R Companion to Applied Regression. Thousand Oaks, CA: SAGE Publications.
Franzluebbers, A. J., Haney, R. L., Honeycutt, C. W., Schomberg, H. H., and Hons, F. M. (2000). Flush of carbon dioxide following rewetting of dried soil relates to active organic pools. Soil Sci. Soc. Am. J. 64, 613–623. doi: 10.2136/sssaj2000.642613x
Gosnell, H., Gill, N., and Voyer, M. (2019). Transformational adaptation on the farm: processes of change and persistence in transitions to 'climate-smart' regenerative agriculture. Glob. Environ. Change 59:101965. doi: 10.1016/j.gloenvcha.2019.101965
Graham, J. H., Timmer, L. W., and Fardelmann, D. (1986). Toxicity of fungicidal copper in soil to citrus seedlings and vesicular-arbuscular mycorrhi-zal fungi. Phytopathology 76, 66–70. doi: 10.1094/Phyto-76-66
Grebliunas, B. D., Armstrong, S. D., and Perry, W. L. (2016). Changes in water-extractable organic carbon with cover crop planting under continuous corn silage production. Air Soil Water Res. 9, 45–54. doi: 10.4137/ASWR.S30708
Gulick, S. H., Grimes, D. W., Munk, D. S., and Goldhamer, D. A. (1994). Cover crop-enhanced water infiltration of a slowly permeable fine sandy loam. Soil Sci. Soc. Am. J. 58, 1539–1546. doi: 10.2136/sssaj1994.03615995005800050038x
Haney, R. L., Brinton, W. H., and Evans, E. (2008). Estimating soil carbon, nitrogen, and phosphorus mineralization from short-term carbon dioxide respiration. Commun. Soil Sci. Plant Anal. 39, 2706–2720. doi: 10.1080/00103620802358862
Haney, R. L., Haney, E. B., Hossner, L. R., and Arnold, J. G. (2006). Development of a new soil extractant for simultaneous phosphorus, ammonium, and nitrate analysis. Commun. Soil Sci. Plant Anal. 37, 1511–1523. doi: 10.1080/00103620600709977
Haney, R. L., Haney, E. B., Smith, D. R., Harmel, R. D., and White, M. J. (2018). The soil health tool- theory and initial broad-scale application. Appl. Soil Ecol. 125, 162–168. doi: 10.1016/j.apsoil.2017.07.035
Hanley, T. A. (1978). A comparison of the line-interception and quadrat estimation methods of determining shrub canopy coverage. J. Range Manage. 31, 60–62. doi: 10.2307/3897638
Ingels, C. A., Scow, K. M., Whisson, D. A., and Drenovsky, R. E. (2005). Effects of cover crops on grapevines, yield, juice composition, soil microbial ecology, and gopher activity. Am. J. Enol. Viticult. 56, 19–29.
Kallenbach, C. M., Frey, S. D., and Grandy, A. S. (2016). Direct evidence for microbial-derived soil organic matter formation and its ecophysiological controls. Nat. Commun. 7:13630. doi: 10.1038/ncomms13630
Kandeler, E., Kampichler, C., and Horak, O. (1996). Influence ofheavy metals on the functional diversity of soil microbial communities. Biol. Fertil. Soils 23, 299–306. doi: 10.1007/BF00335958
Kassambara, A. (2020). rstatix: Pipe-Friendly Framework for Basic Statistical Tests. R package version 0.6.0. Available online at: https://CRAN.R-project.org/package=rstatix
Klein, A. M., Brittain, C., Hendrix, S. D., Thorp, R., Williams, N., and Kremen, C. (2012). Wild pollination services to California almond rely on semi-natural habitat. J. Appl. Ecol. 49, 723–732. doi: 10.1111/j.1365-2664.2012.02144.x
Klonsky, K., Sumner, D. A., Stewart, D., and Gutierrez, C. (2016). 2016 Sample Costs to Produce Organic Almonds. University of California Cooperative Extension Agriculture and Natural Resources Agricultural Issues Center.
Kosmas, C., Danalatos, N., Cammeraat, L. H., Chabart, M., Diamantopoulos, J., Farand, R., et al. (1997). The effect of land use on runoff and soil erosion rates under Mediterranean conditions. Catena 29, 45–59. doi: 10.1016/S0341-8162(96)00062-8
Kovács-Hostyánszki, A., Espíndola, A., Vanbergen, A. J., Settele, J., Kremen, C., and Dicks, L. V. (2017). Ecological intensification to mitigate impacts of conventional intensive land use on pollinators and pollination. Ecol. Lett. 20, 673–689. doi: 10.1111/ele.12762
Kumar, A., Dames, J. F., Gupta, A., Sharma, S., Gilbert, J. A., and Ahmad, P. (2015). Current developments in arbuscular mycorrhizal fungi research and its role in salinity stress alleviation: a biotechnological perspective. Crit. Rev. Biotechnol. 35, 461–474. doi: 10.3109/07388551.2014.899964
LaCanne, C. E., and Lundgren, J. G. (2018). Regenerative agriculture: merging food production and natural resource conservation in a profitable business model. PeerJ 6:e4428. doi: 10.7717/peerj.4428
Lal, R. (2007). Carbon management in agricultural soils. Mitig. Adapt. Strateg. Glob. Change 12, 303–322. doi: 10.1007/s11027-006-9036-7
Lal, R., Follett, R. F., Stewart, B. A., and Kimble, J. M. (2007). Soil carbon sequestration to mitigate climate change and advance food security. Soil Sci. 172, 943–956. doi: 10.1097/ss.0b013e31815cc498
Liu, A., Ma, B. L., and Bomke, A. A. (2005). Effects of cover crops on soil aggregate stability, total organic carbon, and polysaccharides. Soil Sci. Soc. Am. J. 69, 2041–2048. doi: 10.2136/sssaj2005.0032
Lundgren, J. G., and Fausti, S. W. (2015). Trading biodiversity for pest problems. Sci. Adv. 1:e1500558. doi: 10.1126/sciadv.1500558
Lundgren, J. G., Shaw, J. T., Zaborski, E. R., and Eastman, C. E. (2006). The influence of organic transition systems on beneficial ground-dwelling arthropods and predation of insects and weed seeds. Renew. Agric. Food Syst. 21, 227–237. doi: 10.1079/RAF2006152
Lundgren, J. G., Wyckhuys, K. A. G., and Desneux, N. (2009). Population responses by Orius insidiosus to vegetational diversity. Biocontrol 54, 135–142. doi: 10.1007/s10526-008-9165-x
Martínez-Mena, M., Carrillo-López, E., Boix-Fayos, C., Almagro, M., García Franco, N., Díaz-Pereira, E., et al. (2020). Long-term effectiveness of sustainable land management practices to control runoff, soil erosion, and nutrient loss and the role of rainfall intensity in Mediterranean rainfed agroecosystems. Catena 187:104352. doi: 10.1016/j.catena.2019.104352
Montanaro, G., Xiloyannis, C., Nuzzo, V., and Dichio, B. (2017). Orchard management, soil organic carbon and ecosystem services in Mediterranean fruit tree crops. Sci. Hortic. 217, 92–101. doi: 10.1016/j.scienta.2017.01.012
Nichols, R. (2017). A Hedge Against Drought: Why Healthy Soil is 'Water in the Bank'. United States Department of Agriculture, Natural Resource Conservation Service.
Oksanen, J., Guillaume Blanchet, F., Friendly, M., Kindt, R., Legendre, P., McGlinn, D., et al. (2019). Vegan: Community Ecology Package. R Package Version 2.5–2.6.
Olson, K. R., and Al-Kaisi, M. M. (2015). The importance of soil sampling depth for accurate account of soil organic carbon sequestration, storage, retention and loss. Catena 125, 33–37. doi: 10.1016/j.catena.2014.10.004
Paredes, D., Cayuela, L., and Campos, M. (2013). Synergistic effects of ground cover and adjacent vegetation on natural enemies of olive insect pests. Agric. Ecosyst. Environ. 173, 72–80. doi: 10.1016/j.agee.2013.04.016
Parent, S. E., Parent, L. E., Rozanne, D. E., Hernandes, A., and Natale, W. (2012). “Nutrient balance as paradigm of plant and soil chemometrics,” Soil Fertility, ed. R. N. Issaka (London: InTech), 83–114.
Pecenka, J. R., and Lundgren, J. G. (2019). Effect of cattle management systems on dung arthropod community structure. Basic Appl. Ecol. 40, 19–29. doi: 10.1016/j.baae.2019.07.006
Peregrina, F., Larrieta, C., Ibáñez, S., and García-Escudero, E. (2010). Labile organic matter, aggregates, and stratification ratios in a semiarid vineyard with cover crops. Soil Sci. Soc. Am. J. 74, 2120–2130. doi: 10.2136/sssaj2010.0081
Poeplau, C., and Don, A. (2015). Carbon sequestration in agricultural soils via cultivation of cover crops - a meta-analysis. Agric. Ecosyst. Environ. 200, 33–41. doi: 10.1016/j.agee.2014.10.024
Ponisio, L. C., M'gonigle, LK, Mace, K. C., Palomino, J., De Valpine, P., and Kremen, C. (2015). Diversification practices reduce organic to conventional yield gap. Proc. Roy. Soc. B Biol. Sci. 282:20141396. doi: 10.1098/rspb.2014.1396
Ramsey, P. W., Rillig, M. C., Feris, K. P., Holben, W. E., and Gannon, J. E. (2006). Choice of methods for soil microbial community analysis: PLFA maximizes power compared to CLPP and PCR-based approaches. Pedobiologia 50, 275–280. doi: 10.1016/j.pedobi.2006.03.003
Rhodes, C. J. (2017). The imperative for regenerative agriculture. Sci. Prog. 100, 80–129. doi: 10.3184/003685017X14876775256165
Rodale, R. (1983). Breaking new ground: the search for a sustainable agriculture. Futurist 17, 15–20.
Romero-Munar, A., Baraza, E., Gulías, J., and Cabot, C. (2019). Arbuscular mycorrhizal fungi confer salt tolerance in giant reed (Arundo donax l.) plants grown under low phosphorus by reducing leaf NA+ concentration and improving phosphorus use efficiency. Front. Plant Sci. 10:843. doi: 10.3389/fpls.2019.00843
Root, R. B. (1973). Organization of a plant-arthropod assocation in simple and diverse habitats: the fauna of collards (Brassica oleraceae). Ecol. Monogr. 43, 95–124. doi: 10.2307/1942161
Ryals, R., and Silver, W. L. (2013). Effects of organic matter amendments on net primary productivity and greenhouse gas emissions in annual grasslands. Ecol. Appl. 23, 46–59. doi: 10.1890/12-0620.1
Sanchez-Bayo, F., and Wyckhuys, K. A. G. (2019). Worldwide decline of the entomofauna: a review of its drivers. Biol. Conserv. 232, 8–27. doi: 10.1016/j.biocon.2019.01.020
Santos, P. F., Elkins, N. Z., Steinberger, Y., and Whitford, W. G. (1984). A comparison of surface and buried Larrea tridentata leaf litter decomposition in North American hot deserts. Ecology 65, 278–284. doi: 10.2307/1939480
Saunders, M. E., Luck, G. W., and Mayfield, M. M. (2013). Almond orchards with living ground cover host more wild insect pollinators. J. Insect Conserv. 17, 1011–1025. doi: 10.1007/s10841-013-9584-6
Schreefel, L., Schulte, R. P. O., de Boer, I. J. M., Schrijver, A. P., and van Zanten, H. H. E. (2020). Regenerative agriculture- the soil is the base. Global Food Secur. 26:100404. doi: 10.1016/j.gfs.2020.100404
Shahvali, R., Shiran, B., Ravash, R., Fallahi, H., and Banovićeri, B. (2020). Effect of symbiosis with arbuscular mycorrhizal fungi on salt stress tolerance in GF677 (peach × almond) rootstock. Sci. Hortic. 272:109535. doi: 10.1016/j.scienta.2020.109535
Soto, R. L., Martinez-Mena, M., Padilla, M. C., and de Vente, J. (2021). Restoring soil quality of woody agroecosystems in Mediterranean drylands through regenerative agriculture. Agric. Ecosyst. Environ. 306:107191. doi: 10.1016/j.agee.2020.107191
Steenwerth, K., and Belina, K. M. (2008). Cover crops enhance soil organic matter, carbon dynamics and microbiological function in a vineyard agroecosystem. Appl. Soil Ecol. 40, 359–369. doi: 10.1016/j.apsoil.2008.06.006
Stewart, J. A. E., Butterfield, H. S., Richmond, J. Q., Germano, D. J., Westphal, M. F., Tennant, E. N., et al. (2019). Habitat restoration opportunities, climatic niche contraction, and conservation biogeography in California's San Joaquin Desert. PLoS ONE 14:e0210766. doi: 10.1371/journal.pone.0210766
Subramanian, K. S., Muniraj, I., and Uthandi, S. (2016). “Role of actinomycete-mediated nanosystem in agriculture,” in Plant Growth Promoting Actinobacteria: A New Avenue for Enhancing the Productivity and Soil Fertility of Grain Legumes, eds S. Gopalakrishnan, A. Sathya, and R. Vijayabharathi (Singapore: Springer), 233–247. doi: 10.1007/978-981-10-0707-1_15
Tamburini, G., Bommarco, R., Wanger, T C, Kremen, C., van der Heijden, M. G. A., Liebman, M., and Hallin, S. (2020). Agricultural diversification promotes multiple ecosystem services without compromising yield. Sci. Adv. 6:eaba1715. doi: 10.1126/sciadv.aba1715
Tautges, N. E., Chiartas, J. L., Gaudin, A. C. M., O'Geen, A. T., Herrera, I., and Scow, K. M. (2019). Deep soil inventories reveal that impacts of cover crops and compost on soil carbon sequestration differ in surface and subsurface soils. Glob. Chang. Biol. 25, 3753–3766. doi: 10.1111/gcb.14762
Tobor-Kaplon, M. A., Bloem, J., Romkens, P., and de Ruiter, P. C. (2005). Functional stability ofmicrobial communities in contaminated soils. Oikos 111, 119–129. doi: 10.1111/j.0030-1299.2005.13512.x
Tuteja, N., and Mahajan, S. (2007). Calcium signaling networks in plants. Plant Signal. Behav. 2, 79–85. doi: 10.4161/psb.0.2.2.4176
USDA-AMS (2020). USDA Agricultural Marketing Service Organic Standards. USDA Agricultural Marketing Service.
Usmen, M. A., and Kheng, H. Y. (1983). Use of microwave oven for rapid determination of moisture content of highway materials. Transp. Res. Rec. 1056, 68–75.
Vannette, R. L., and Hunter, M. D. (2009). Mycorrhizal fungi as mediators of defence against insect pests in agricultural systems. Agric. For. Entomol. 11, 351–358. doi: 10.1111/j.1461-9563.2009.00445.x
Veenstra, J. J., Horwath, W. R., and Mitchell, J. P. (2007). Tillage and cover cropping effects on aggregate-protected carbon in cotton and tomato. Soil Sci. Soc. Am. J. 71, 362–372. doi: 10.2136/sssaj2006.0229
von Ehrenstein, O. S., Ling, C., Cui, X., Cockburn, M., Park, A. S., Yu, F., et al. (2019). Prenatal and infant exposure to ambient pesticides and autism spectrum disorder in children: population based case control study. BMJ 364:l962. doi: 10.1136/bmj.l962
Vukicevich, E., Lowery, D. T., Bennett, J. A., and Hart, M. (2019). Influence of groundcover vegetation, soil physicochemical properties, and irrigation practices on soil fungi in semi-arid vineyards. Front. Ecol. Evol. 7:118. doi: 10.3389/fevo.2019.00118
Vukicevich, E., Lowery, T., Bowen, P., Úrbez-Torres, J. R., and Hart, M. (2016). Cover crops to increase soil microbial diversity and mitigate decline in perennial agriculture. A review. Agron. Sustain. Dev. 36:48. doi: 10.1007/s13593-016-0385-7
Wade, A., Lin, C.-H., Kurkul, C., Regan, E. R., and Johnson, R. M. (2019). Combined toxicity of insecicides and gungicides applied to California almond orchards to honey bee larvae and adults. Insects 10:20. doi: 10.3390/insects10010020
Wang, Q.-Y., Zhou, D.-M., and Cang, L. (2009). Microbial and enzyme properties of apple orchard soil as affected by long-term application of copper fungicide. Soil Biol. Biochem. 41, 1504–1509. doi: 10.1016/j.soilbio.2009.04.010
Weil, R., and Brady, N. (2017). The Nature and Properties of Soils. 15th Edn. Boston, MA: Pearson Education.
Wendt, J. W., and Hauser, S. (2013). An equivalent soil mass procedure for monitoring soil organic carbon in multiple soil layers. Eur. J. Soil Sci. 64, 58–65. doi: 10.1111/ejss.12002
White, D. C. (1988). Validation of quantitative analysis for microbial biomass, community structure, and metabolic activity. Arch. Hydrobiol. Beih. Ergebn. Limnol. 31, 1–18.
Whitelaw-Weckert, M. A., Rahman, L., Hutton, R. J., and Coombes, N. (2007). Permanent swards increase soil microbial counts in two Australian vineyards. Appl. Soil Ecol. 36, 224–232. doi: 10.1016/j.apsoil.2007.03.003
Williams, D. F., Cypher, E. A., Kelly, P. A., Miller, K. J., Norvell, N., Phillips, S. F., et al. (1998). Recovery plan for upland species of the San Joaquin Valley, California. U. S Fish and Wildlife Service Portland, Oregon.
Xiang, Y., Cheng, M., Huang, Y., An, S., and Darboux, F. (2017). Changes in soil microbial community and its effect on carbon sequestration following afforestation on the Loess Plateau, China. Int. J. Environ. Res. Public Health 14:948. doi: 10.3390/ijerph14080948
Yaghmour, M., Haviland, D., Fichtner, E., Sanden, B., Viveros, M., Sumner, D., et al. (2016). Sample Costs to Establish an Orchard and Produce Almonds: University of California Agriculture and Natural Resources Cooperative Extension.
Ye, L., Zhao, X., Bao, E., Cao, K., and Zou, Z. (2019). Effects of arbuscular mycorrhizal fungi on watermelon growth, elemental uptake, antioxidant, and photosystem II activities and stress-response gene expressions under salinity-alkalinity stresses. Front. Plant Sci. 10:863. doi: 10.3389/fpls.2019.00863
Zak, D. R., Holmes, W. E., White, D. C., Peacock, A. D., and Tilman, D. (2003). Plant diversity, soil microbial communities, and ecosystem function: are there any links? Ecology 84, 2042–2050. doi: 10.1890/02-0433
Zelles, L., and Bai, Q. Y. (1993). Fractionation of fatty acids derived from soil lipids by solid phase extraction and their quantitative analysis by GC-MS. Soil Biol. Biochem. 25, 495–507. doi: 10.1016/0038-0717(93)90075-M
Zelles, L., Bai, Q. Y., Beck, T., and Beese, F. (1992). Signature fatty acids in the phospholipids and lipopolysaccharides as indicators of microbial biomass and community structure in agricultural soils. Soil Biol. Biochem. 24, 317–323. doi: 10.1016/0038-0717(92)90191-Y
Zhang, M., He, Z., Zhao, A., Zhang, H., Endale, D. M., and Schomberg, H. H. (2011). Water-extractable soil organic carbon and nitrogen affected by tillage and manure application. Soil Sci. 176, 307–312. doi: 10.1097/SS.0b013e31821d6d63
Keywords: biodiversity, economics, invertebrates, regenerative farming system, soil health, soil microbiology
Citation: Fenster TLD, Oikawa PY and Lundgren JG (2021) Regenerative Almond Production Systems Improve Soil Health, Biodiversity, and Profit. Front. Sustain. Food Syst. 5:664359. doi: 10.3389/fsufs.2021.664359
Received: 05 February 2021; Accepted: 28 June 2021;
Published: 10 August 2021.
Edited by:
Inge Armbrecht, University of Valle, ColombiaReviewed by:
Claire Balint, California Polytechnic State University, United StatesCopyright © 2021 Fenster, Oikawa and Lundgren. This is an open-access article distributed under the terms of the Creative Commons Attribution License (CC BY). The use, distribution or reproduction in other forums is permitted, provided the original author(s) and the copyright owner(s) are credited and that the original publication in this journal is cited, in accordance with accepted academic practice. No use, distribution or reproduction is permitted which does not comply with these terms.
*Correspondence: Jonathan G. Lundgren, am9uYXRoYW4ubHVuZGdyZW5AZWNkeXNpcy5iaW8=
Disclaimer: All claims expressed in this article are solely those of the authors and do not necessarily represent those of their affiliated organizations, or those of the publisher, the editors and the reviewers. Any product that may be evaluated in this article or claim that may be made by its manufacturer is not guaranteed or endorsed by the publisher.
Research integrity at Frontiers
Learn more about the work of our research integrity team to safeguard the quality of each article we publish.