 Pankaj B. Pathare
 Mai Al-Dairi
94% of researchers rate our articles as excellent or good
Learn more about the work of our research integrity team to safeguard the quality of each article we publish.
Find out more
ORIGINAL RESEARCH article
Front. Sustain. Food Syst., 04 August 2021
Sec. Agro-Food Safety
Volume 5 - 2021 | https://doi.org/10.3389/fsufs.2021.658132
This article is part of the Research TopicFood Storage, Spoilage and Shelf Life: Recent Developments and InsightsView all 18 articles
Bruise damage is one of the mechanical injury problems that could appear in fresh produce during the post-harvest supply chain. The study investigated three main effects (drop impact level, storage temperature, and storage duration), which can expand the level of bruising and cause some quality changes that contribute to the damage of pear. Pear fruit samples were purchased from the market and delivered to the post-harvest laboratory. Each pear was impacted by a ball with a known mass at three different drop heights (20, 40, and 60 cm), stored at 22°C with 45 ± 5% RH and 10°C with 85 ± 5% RH for 14 days storage period. Bruise area (BA), bruise volume (BV), and bruise susceptibility (BS) were calculated. Different quality analyses were done like color, firmness, and total soluble solids (TSS). Analysis of variance (ANOVA), regression analysis, and pearson correlation coefficient were performed. With increasing drop height and temperature for 14 days storage, BA, BV, BS, lightness (L*), yellowness (b*), color saturation (Chroma), and total color difference increased. However, firmness was highly reduced (92.82%) due to the increase in drop height (60 cm), storage temperature (22°C), and storage duration (14 days). Color purity (Hue), redness (a*), and TSS were not affected by drop height (impact level). A strong relationship with a strong linear regression (R2) was found between BS and CIE L*, a*, and b* color coordinates. A positive and strong correlation was also found between BS and CIEL*a*b* color parameters with a strong and negative correlation with firmness. Overall, this study can be considered as guideline for horticulture researchers and in fresh produce supply chain during post-harvest operations.
Pear (Pyrus spp.) ranked second among the fruit produced and consumed in the world (Lipa et al., 2019). Pears are among the highly perishable agricultural products and have a lower storability compared to an apple, and at the same time, they are sensitive to inappropriate conditions during harvest, transport, and reloading. Impacts cause irreversible damage to the external and internal structure, consisting mostly in the mechanical deformation of both the fruit peel and the spatial deformation of flesh cells. The attractiveness of the pear is determined by the lack of mechanical defects on the fruit surface. As reviewed by Hussein et al. (2020b), bruising is the most common type of mechanical damage that reduces fruit quality and causing considerable post-harvest losses. The presence of bruising and other types of mechanical damage (cuts, puncture, split, abrasion) causes significant economic loss of fresh produce due to downgrading or rejection of the appearance quality by the consumer. Besides, bruising can result in weight loss in fruit and vegetable and hence a decrease in their market value. So, minimizing the post-harvest losses and enhancing the storage potential are the major goals for growers.
Bruising is the most prevalent form of mechanical damage in many fruits, which is caused largely by excessive impact and/or compression forces concentrated on a small area of the fruit surface against a rigid body or fruit against fruit mainly involved during mechanical handling (Pathare and Al-Dairi, 2021). Furthermore, bruise damage modifies physiological and metabolic processes, leading to faster ripening, internal browning, and quality losses (Opara and Pathare, 2014; Costa et al., 2018; Hussein et al., 2019). Minor bruise damage on the “Galaxy” apple resulted in a decrease in firmness and fruit browning (Ergun, 2017). Similarly, bruising damage accelerated loss of firmness and the ratio of sugar to acid for Yali pears (Li et al., 2012). Bruising reduced firmness and weight loss of packaged kiwifruit after 10 days of storage (Xia et al., 2020). Decreased weight of the fruit and the unsightly shriveling lead to economic losses (Al-Dairi et al., 2021d). As one of the important quality attributes in fruit production, the fruit weight influences not only consumer preference but also the marketing of fresh fruit (Al-Dairi et al., 2021a). Impact bruising resulted in both the qualitative internal and minor external changes on fresh produce, including changes in citric acid content (Hussein et al., 2020b), soluble solid content, (Gao et al., 2021), respiration, and ethylene production (Xia et al., 2020).
Opara and Pathare (2014) highlighted the importance of bruise damage measurement or analysis in aiding interventions to inhibit quality changes. Recently, Hussein et al. (2020b) reported 40% weight loss of bruised pomegranate fruit during long cold storage. Bruising of fresh fruits during harvest and post-harvest processing is a major problem in the horticultural industry, particularly on fruit such as pears, which are highly sensitive to mechanical damage (Komarnicki et al., 2016). Damage is largely a result of the impact, particularly during sorting, grading, and packing operations. Based on our knowledge, the majority of the studies focused on the impact of bruising on pear and other fresh produce stored at one storage condition. However, the current study comprises the effect of different drop heights (20, 40, and 60 cm) and two storage temperature (10 and 22°C) for 14 days experimental period on pear quality changes. This can help to understand the mechanism of bruising and how to reduce it. Therefore, the objective of this study is to determine the extent of bruising [bruise area (BA), bruise volume (BV), and bruise susceptibility (BS)] and other quality attribute changes [color, firmness, and total soluble solids (TSS)] of pear as affected by drop impact levels, storage temperatures, and storage duration for 14 days. Besides, regression analyses between BS and the studied quality attributes during 14 days of storage were done.
Fresh pears Pyrus communis, variety “D'Anjou,” were purchased from the market (23°35′10.5"N latitudes and 58°12′07.0"E longitudes) and directly transported to the post-harvest laboratory at Sultan Qaboos University (23°35′25.1"N latitudes and 58°10′07.9"E longitudes), Sultanate of Oman. A total of 129 pears were selected based on their uniform color, shape, and surface condition (with no defects and blemishes or bruising). The average weight of each sample selected was 163.12 ± 4.26 g. Before bruising and storage study, the pear samples on the initial day (0 day) were tested for color, firmness, and TSS analysis.
Pear fruits were bruised using the drop test method described by Pathare and Al-Dairi (2021) (Figure 1). This technique includes a free fall of a steel ball of a known mass (110 g) through PVC hollow pipe into every individual pear from 20 cm (low), 40 cm (medium), and 60 cm (high) drop heights. The ball was fixed by hand after each drop to prevent multiple impacts into pears.
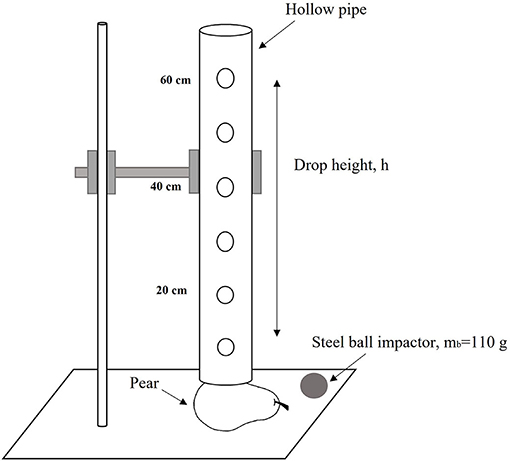
Figure 1. Schematic experimental setup.
After the drop test, all bruised areas on pears were marked to simplify bruise recognition during measurements. To calculate the impact energy (Ei) resulted from drop impact, the equation used by Hussein et al. (2017) was performed as follows (Equation 1):
where mb is the mass of dropped ball (110 g), g is the gravitational constant (9.81 m s−2), and h is the drop height in cm. Table 1 shows the impact energy generated from different drop impacts. To perform bruise measurements, pears were sliced from the middle of the marked Bruised area. Bruise sing was recognized by the presence of noticeably bruise tissue exist on the marked area of the pear. Digital caliper (Model: Mitutoyo, Mitutoyo Corp., Japan) was used to measure bruise diameter (d) like major and minor width (w1 and w2), respectively, and bruise depth (hb) (Figure 2). Bruise size results were presented in the form of Bruise area (BA) (Equation 2), Bruise volume (BV) (Equation 3) (Opara and Pathare, 2014), and Bruise susceptibility (BS) (Equation 4) (Hussein et al., 2019).
The samples were divided and stored at 10°C (85 ± 5% RH) and 22°C (45 ± 5% RH) (65 pear samples per storage condition) at 2 days interval for 14 days to study bruise development and quality changes on pears like color, firmness (unbruised area), and Total soluble solids (TSS). Each storage condition consisted of three groups of different drop heights, where each of them consisted of seven subgroups for storage duration (temporal) assessment. The temperature meter (Model: TES 13604, TES Electrical Corp., Taiwan) was used for daily monitoring of temperature and relative humidity. Visual observations were taken to observe the incidence of bruising and other quality changes of pear.
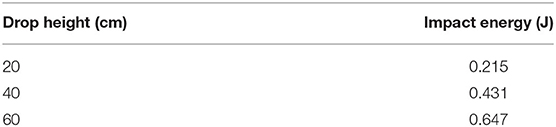
Table 1. Experimental drop height and energy produced.
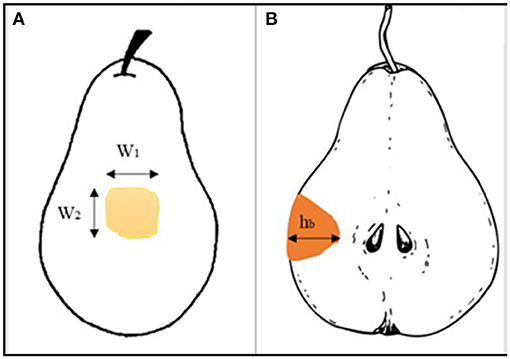
Figure 2. Bruise measurements (A) bruise diameter and (B) bruise depth.
Pear fruit surface color was measured using a Colorimeter (Model: CR-310, Minolta, Japan), which was calibrated using a white plate (L* = 93.90, a* = 3.13, b* = 3.20). Color measurements were conducted six times per sample (108 reading a day) for 14 days of analysis to obtain the changes of L* (lightness-darkness), a* (redness-greenness), and b* (yellowness-blueness) subjected to different impact levels at 10 and 22°C. Total color differences (ΔE*) (Equation 5), Chroma (Equation 6), and Hue (Equation 7) were also calculated using the equations explained by Pathare et al. (2013):
Firmness was performed by penetrating the middle region of pear fruit by using a hand penetrometer (Model: FT 327, EFFEGI, Italy) at 2 days interval of the experiment and expressed in N by following the standard procedure of OECD (2018).
According to OECD (2018), TSS °Brix of pear was measured using a hand-held refractometer and was calibrated at 20°C. For each pear sample, two longitudinal slices were taken (from two opposite sides). Each slice was squeezed longitudinally to obtain a mixture of juice from all regions. From each group, 6 readings of TSS were taken (36 readings per day).
To turn all statistical analysis, SPSS 20.0 (International Business Machine Crop., USA) software was performed. Three-way analysis of variance (ANOVA) was applied to investigate the effect of three independent variables (drop impact height, storage temperature, and storage duration) on several dependent variables (BA, BV, BS, color changes, firmness, and TSS properties). The significant differences were determined at p < 0.05, and the values of all properties are presented as average ± standard deviation (S.D.). Regression analyses were performed to determine the relation between BS with color parameters (L*, a*, and b*) and firmness. Pearson correlation coefficient was also performed to study the relationship between all resulted analyses.
Table 2 shows the values of BA (mean ± Sd) and BV (mean ± Sd) of selected pear fruits at different heights and storage temperatures for 14 days period. In this study, BA and BV of bruised pears were highly increased (p < 0.05) with the increase of all investigated factors like drop height, storage duration, and temperature condition. The highest drop height (60 cm, 0.647 J) increased the average value of BA from 140.6 mm2 on day 2 and 243.7 mm2 on day 8 to reach 283.1 mm2 on day 14 on pears stored at 10°C. However, the BA was higher on pears stored at 22°C and impacted with the heights impact level (60 cm), where BA was 204.6 mm2 on day 2 and 295.2 mm2 on day 8 to reach 431.6 mm2 on day 14 (Table 2). Same trends of results were shown on the BV of the pear fruits where high BV resulted on pear impacted with the steel ball from 60 cm height stored at ambient temperature condition followed by the one impacted from 40 and 20 cm heights at both storage conditions. In the current study, high storage temperature conditions and impact energy during storage time slightly increased BA and BV. The same findings were recorded in apples (Fadiji et al., 2016) and pomegranate (Hussein et al., 2019). Shafie et al. (2017) also revealed that BV and BA were highly influenced by drop height. Similarly, Shafie et al. (2015) found an obvious tendency between BV and storage time, impact level, and storage temperature. Besides, Komarnicki et al. (2016) found that the maximum value of BV reached 15,000 mm3 (1.5 × 10⁻⁵ m3), which corresponded to impact from the height of 32.8 cm. However, Zarifneshat et al. (2010) recorded that high temperature can reduce BV/damage of apple.
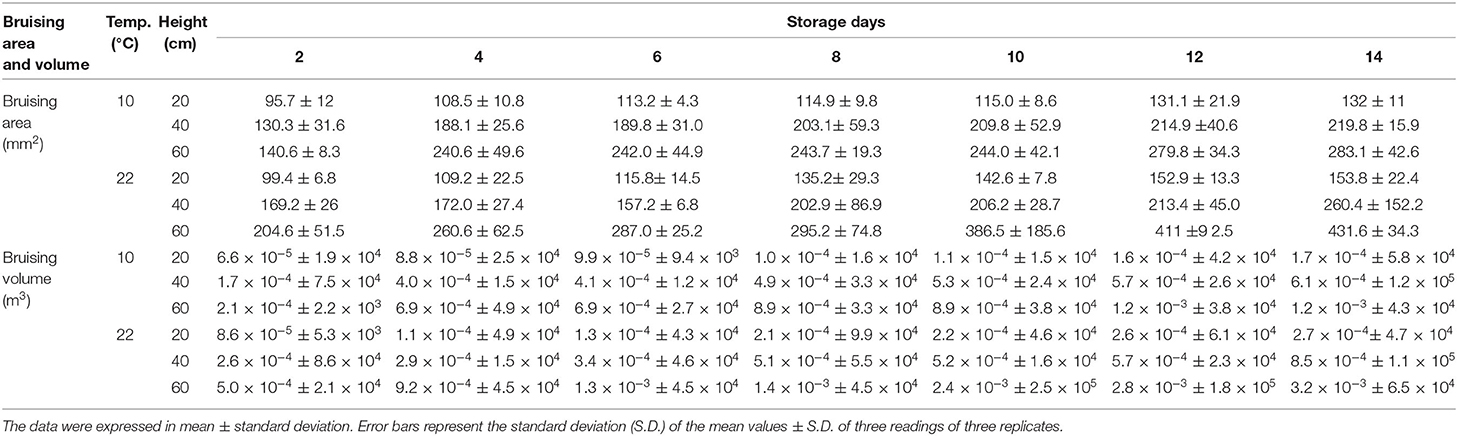
Table 2. Bruise area and bruise volume of pear fruits impacted with three drop heights levels at two storage conditions during 14 days of storage.
A statistical difference (p < 0.05) was found between BS and all other studied parameters such as drop height, storage temperature, and storage duration (Figure 3). The results showed that BS gradually increased with drop height at both storage temperature conditions throughout storage duration (14 days). The results also indicated that high storage temperature and drop height for 14 days storage can elevate the percentage of BS. Bruise susceptibility of pear fruit stored at 22°C reached the maximum value with 5.0 × 10⁻³ m3 J−1 for 60 cm drop height followed by 2.7 × 10⁻³ and 2.2 × 10⁻³ m3 J−1 for both 40 cm and 20 cm drop heights, respectively (Figure 3B). However, less BS was observed on bruised pears stored at 10°C, which was 1.9 × 10⁻³, 1.4 × 10, and 1.3 × 10⁻³ m3 J−1 for high, medium, and low drop heights, respectively, on the last day of storage (Figure 3A). Celik (2017) indicated higher BS as pear subjected to an impact from 1 m heights. High storage temperature can increase the occurrence of bruising in fresh produce as enzymes are still active resulting in cell wall degradation and stiffness (Ahmadi et al., 2010). Bugaud et al. (2014) recorded a less increment in BS of bananas stored at low temperature. Al-Dairi et al. (2021b) observed a higher percentage of bruise damage on tomatoes stored at room temperature. In contrast, Bollen (2005) observed no signs of bruising on dropped apple after storing at two different storage temperatures.
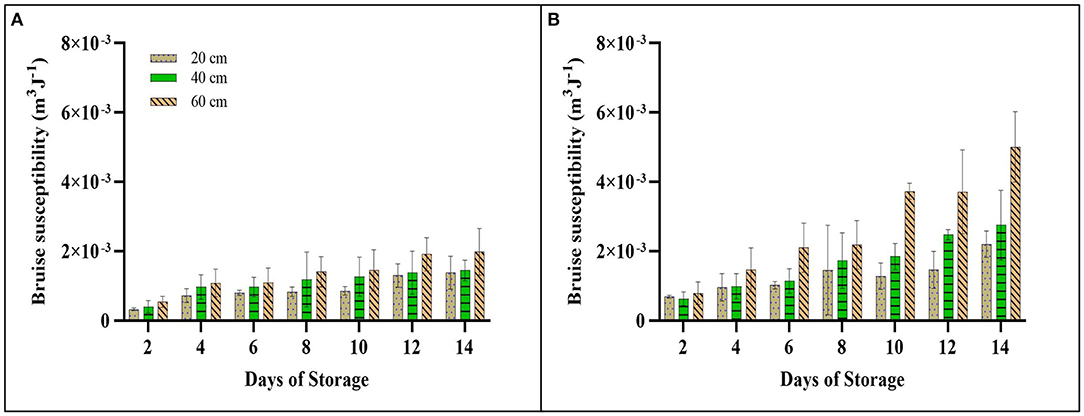
Figure 3. Bruise susceptibility of pear impacted at different drop heights (20, 40, and 60 cm) during 14 days at (A) 10°C and (B) 22°C storage conditions. The data were expressed in mean ± standard deviation. Error bars represent the standard deviation (S.D.) of the mean values ± S.D. of three readings of three replicates.
The measurements of CIE L*, a*, and b* color coordinates were reported. In terms of storage days, the trend of all color values was similar in all treated pears. L* value was varied significantly (p < 0.05) with storage temperature, drop height, and storage duration. Alteration in lightness (L* value) increased with the increase of drop height (impact energy), temperature condition, and days of storage (Figure 4). The L* value of all bruised pears increased significantly, particularly, for 60 cm drop height bruised pears at 10 and 22°C, where the percentage of L* increment reached 27.7% (Figure 4B) and 25.9% (Figure 4A) on the last day of storage, respectively. However, the lowest percentage of increment on L* was observed for 20 cm drop height (24.7%) bruised pears stored at 10°C. This was due to the conversion of pear surface color from green to more yellow color. Moreover, the lightness L* of bruised pears exposed to different impact energy levels (drop heights) at both storage conditions showed a strong relationship with the BS (R2 20 cm,10°C: 0.8204, R2 40 cm,10°C: 0.7161, R2 60 cm,10°C: 0.9058, R2 20 cm,22°C: 0.9038, R2 40 cm,22°C: 0.8899, R2 60 cm,22°C: 0.9444) (Figure 5).
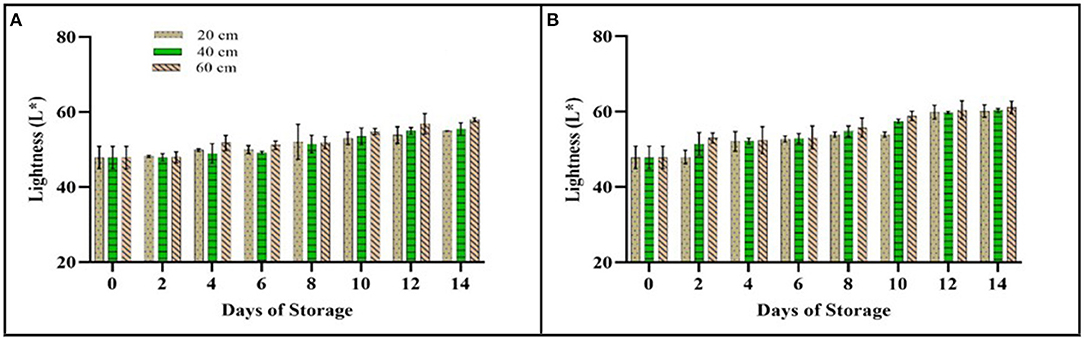
Figure 4. L* value of pear impacted at different drop heights (20, 40, and 60 cm) during 14 days at (A) 10°C and (B) 22°C storage conditions. The data were expressed in mean ± standard deviation. Error bars represent the standard deviation (S.D.) of the mean values ± S.D. of 18 readings per three replicates.
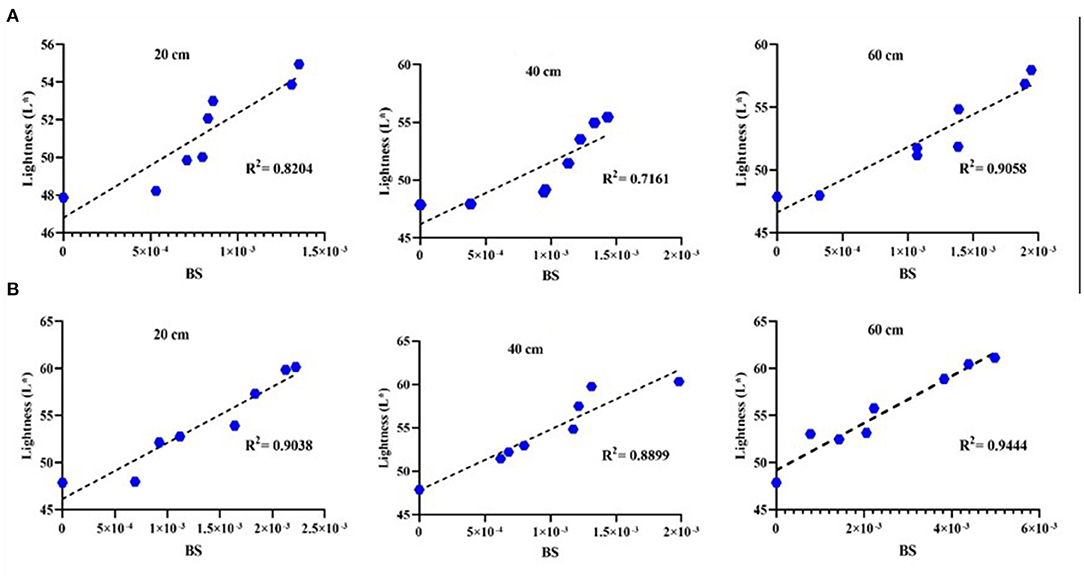
Figure 5. Single linear regression between BS and L* at different drop heights (20, 40, and 60 cm) during 14 days at (A) 10°C and (B) 22°C storage conditions.
The redness (a*) increased in all treated samples. The a* value was significantly differed (p < 0.05) with storage period and storage temperature condition, while no statistical significance (p > 0.05) was observed in the a* value of bruised pear with respect to drop height. Table 3 shows a rapid increase in a* value on bruised pear stored at 22°C compared to bruised pears stored at 10°C after 14 days of storage. The highest change of a* value was observed on bruised pears impacted with a steel ball from the medium height (40 cm) stored at 22°C, which increased from −9.66 on day 0 to reach 3.39 on day 14 followed by bruised pear impacted from low (20 cm) and high (60 cm) drop height that reached 3.38 and 3.02, respectively. At 10°C storage condition, stored pears recorded less change in a*, which altered from −9.66 to reach −0.03, −0.49, and 0.40 on the last day of storage for 20, 40, and 60 cm height bruised pears, respectively. Generally, a* value was maintained on bruised pears stored at 10°C. The change of redness is attributed to green color loss on bruised pears during storage (Bodner and Scampicchio, 2020). Similarly, Gao et al. (2021) recorded no significant changes on the a* value of impacted kiwifruit during storage. As observed, higher BS indicated more redness (a*) value per treatment as shown in Figure 6.
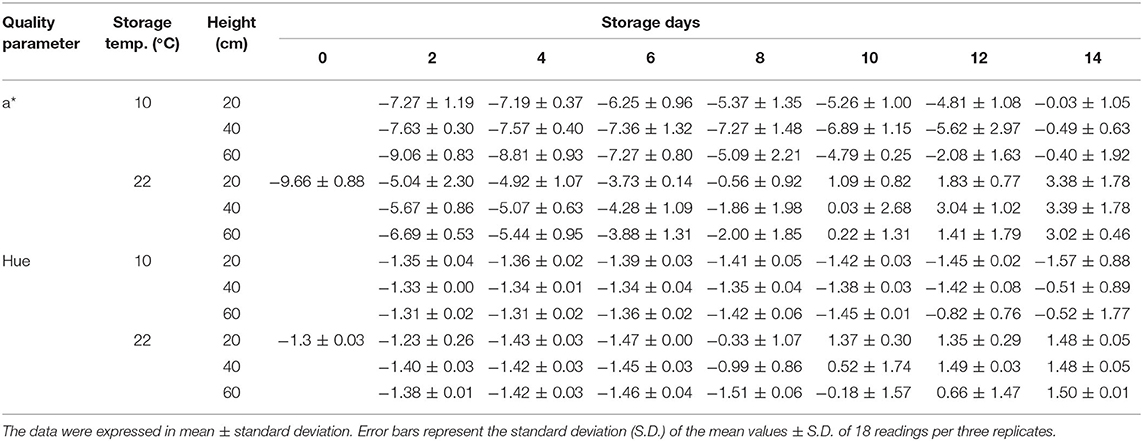
Table 3. a* and hue values of pears impacted with three drop heights levels at two storage conditions during 14 days of storage.
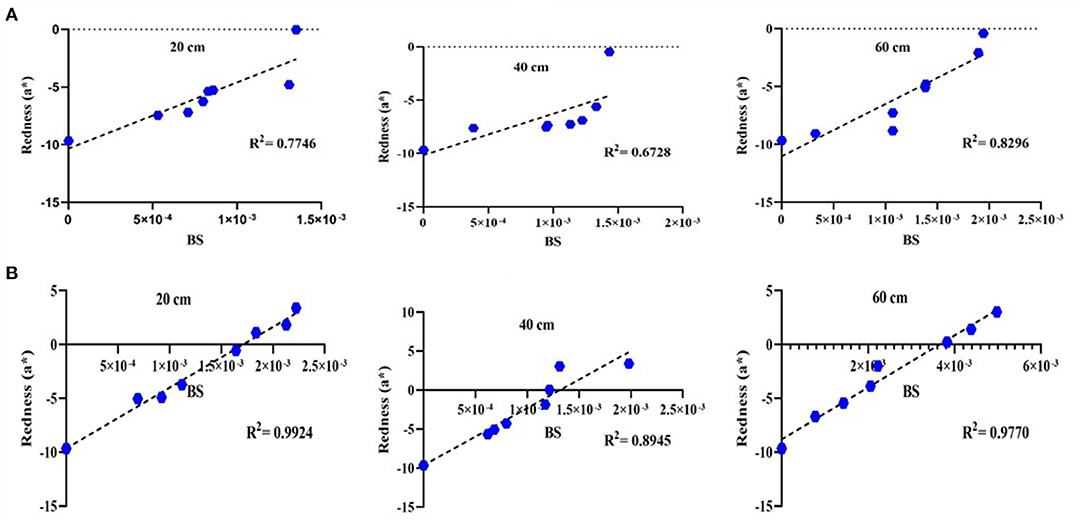
Figure 6. Single linear regression between BS and a* at different drop heights (20, 40, and 60 cm) during 14 days at (A) 10°C and (B) 22°C storage conditions.
With storage time and temperature, an increasing trend in the color attribute of b* was statistically (p < 0.05) observed. The impact of drop height on the b* value of bruised pear fruit was also significant (p < 0.05). The b* value was increasing gradually at both temperature conditions during storage (Figure 7). The results showed that the highest impact (60 cm 0.647 J) bruised pears provided the largest percentage of b* increment (32.9%) after 14 days of storage at room temperature (Figure 7B). This was followed by bruised pears subjected to an impact from 40 cm (0.4316 J) and 20 cm (0.215 J) drop heights, where the b* value increased by 29.1 and 28.32%, respectively (Figure 7B). Storage at 10°C increased b* value by 28 and 31.46% for low (20 cm) and high (60 cm) impact bruised pears, respectively (Figure 7A). Generally, the b* value increased gradually during the whole 14 days due to the conversion of the green surface color of pear to yellow. As shown in Figure 8, b* value of pear fruit increased with the increase on BS (R2 20 cm,10°C: 0.9034, R2 40 cm,10°C: 0.9173, R2 60 cm,10°C: 0.8795, R2 20 cm,22°C: 0.9087, R2 40 cm,22°C: 0.8822, R2 60 cm,22°C: 0.9105) (Figure 8).
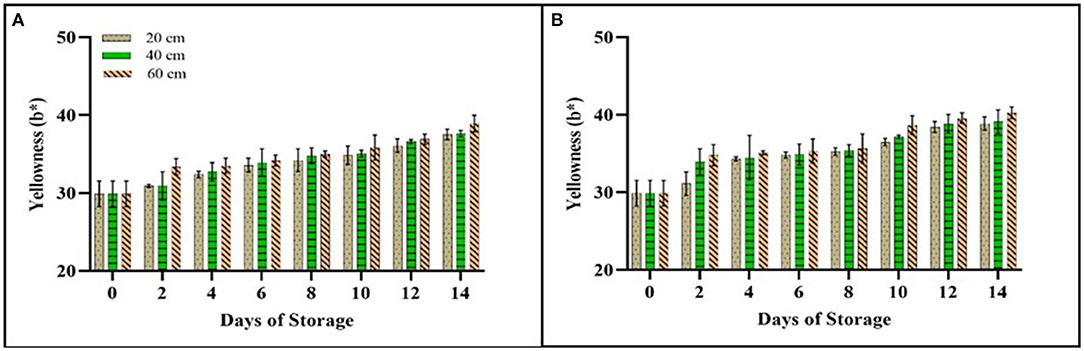
Figure 7. b* value of pear impacted at different drop heights (20, 40, and 60 cm) during 14 days at (A) 10°C and (B) 22°C storage conditions. The data were expressed in mean ± standard deviation. Error bars represent the standard deviation (S.D.) of the mean values ± S.D. of 18 readings per three replicates.
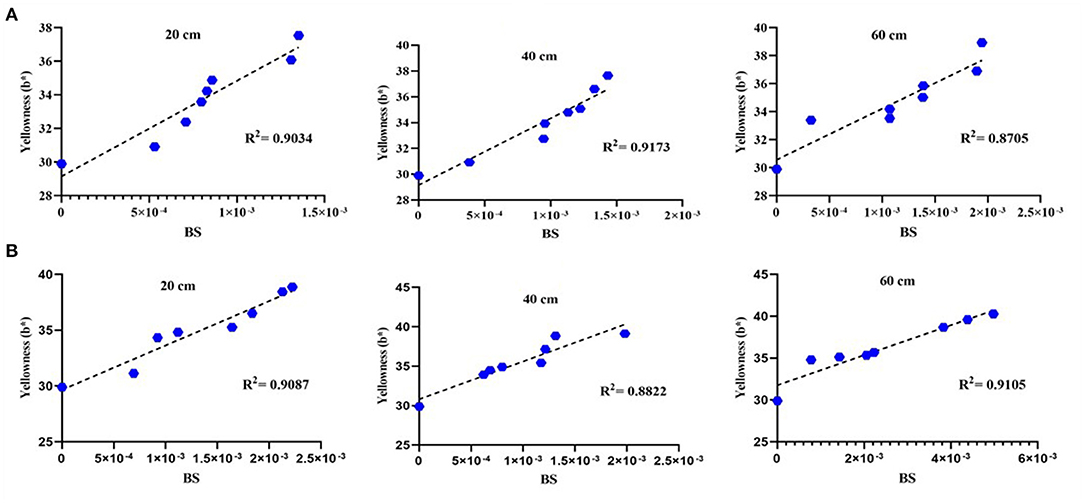
Figure 8. Single linear regression between BS and b* at different drop heights (20, 40, and 60 cm) during 14 days at (A) 10°C and (B) 22°C storage conditions.
Total color change (ΔE*) was calculated to record the changes in bruised pear color difference (Figures 9A,B). Total color differences (ΔE*) that increased significantly (p < 0.05) varied with drop height, storage temperature condition, and storage duration. The ΔE* value was higher (21.23) in pear impacted at a drop height of 60 cm and stored at 22°C (Figure 9B), while the lowest value (17.12) was recorded in pear fruit stored at 10°C and impacted at a drop height of 20 cm (Figure 9A) during the whole days of the experiment. Bruising is one of the factors that cause fruit discoloration (Bodner and Scampicchio, 2020). Pathare and Al-Dairi (2021) also observed the same findings where the total color change of tomato was highly affected by storage temperature and duration as well as drop impact. Bodner and Scampicchio (2020) recorded that the total color change value for bruised pear fruit was high, suggesting the effect of bruising in accelerating the ripening process. As reported by Al-Dairi and Pathare (2021), storage at ambient temperature can accelerate the color change of fresh produce than storage at 10°C. In this study, the difference between chroma and all studied factors (drop impact, storage condition, and storage duration) was generally significant (p < 0.05; Figures 9C,D). The highest drop height and storage at 22°C showed a great effect on chroma of bruised pear fruits (26.9%) followed by medium (23.5%) and low drop height impact (Figure 9D). Storge at 10°C showed less change with 19.4, 19.7, and 23.8% impacted at 20, 40, and 60 cm drop heights, respectively (Figure 9C). Regarding hue value (color purity), there was a significant (p < 0.05) influence of both storage duration and temperature with no pronounced significance (p > 0.05) with drop height (Table 3). This study showed that hue value was decreasing slowly at both storage temperature but then increased rapidly on day 10 at 22°C storage temperature to reach 1.50 and 1.48 on day 14 after it was −1.3 on day 0 for high and medium bruised fruit due to change of a* value from (–) to (+) value during storage. Dobrzanski and Rybezynski (2002) recorded that color characteristics of bruised apples were significantly affected by bruise damage.
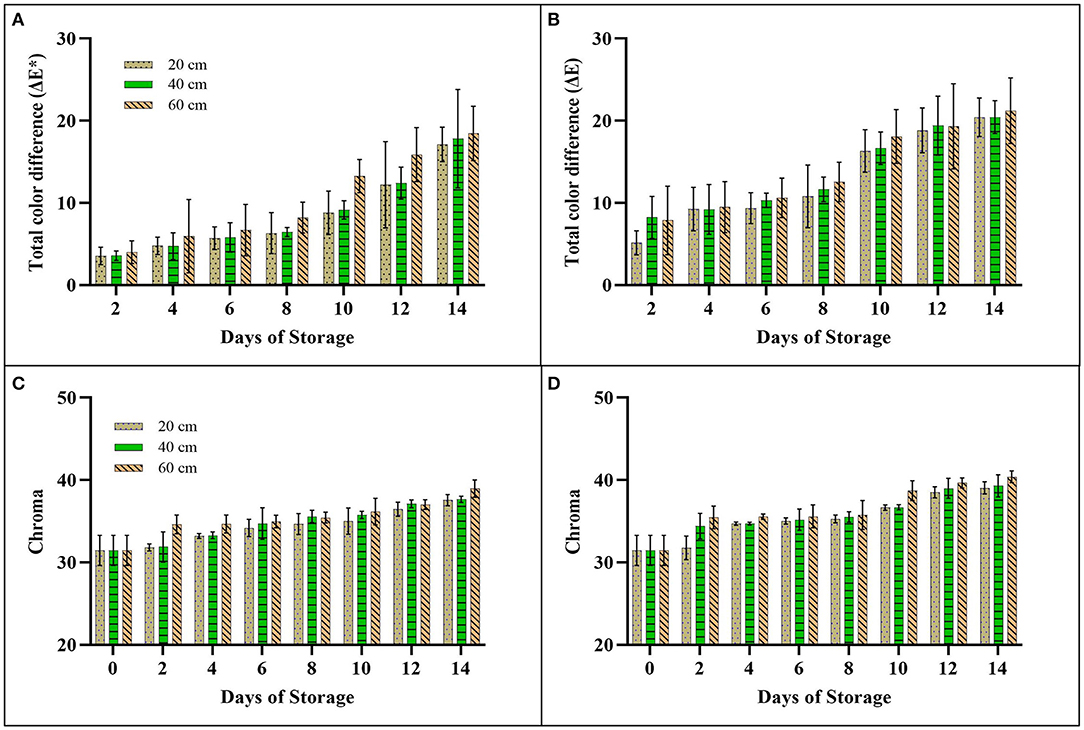
Figure 9. Total color change (ΔE*) and chroma of pear impacted at different drop heights (20, 40, and 60 cm) during 14 days at (A,C) 10°C and (B,D) 22°C storage conditions. The data were expressed in mean ± standard deviation. Error bars represent the standard deviation (S.D.) of the mean values ± S.D. of 18 readings per three replicates.
Drop height, storage temperature, and storage duration statistically (p < 0.05) affect the firmness of bruised pear fruit (Figure 10). In this study, as drop height increased, the firmness of pear fruit tended to reduce by 89.2, 91.8, and 92.7% for low, medium, and high drop impact stored at 22°C, respectively. On the last day of storage, the firmness of pears stored at 10°C reduced by 80.4, 84.1, and 84.61% for low, medium, and high impact. The percentage of reduction can show that a high impact level can reduce the firm state of pear fruits in the last day of storage. Azadbakht et al. (2019) found that the firmness of pear was reduced with the increase of bruise and force level for the long storage duration. Similar findings were reported on pomegranate (Hussein et al., 2020a) and apple (Van Zeebroeck et al., 2007). Also, Li et al. (2012) confirmed that bruising is another parameter that led to a decline in the firm state due to the increment of polygalacturonase activity included on pear. For storage time and temperature conditions, firmness was decreasing dramatically during the period of storage at both storage temperatures particularly at 22°C due to continued ripening of the pear. As stated by Zhou et al. (2007), firmness reduction was observed on pears at different storage temperature conditions and it was highly reduced at ambient temperature storage conditions, where the softening rate is increased. For 14 days storage at both storage condition, the firmness of bruised pears impacted at different drop height correlates strongly with BS (R2 20 cm,10°C: 0.8422, R2 40 cm,10°C: 0.9696, R2 60 cm,10°C: 0.9309, R2 20 cm,22°C: 0.9064, R2 40 cm,22°C: 0.7885, R2 60 cm,22°C: 0.7317) (Figure 11).
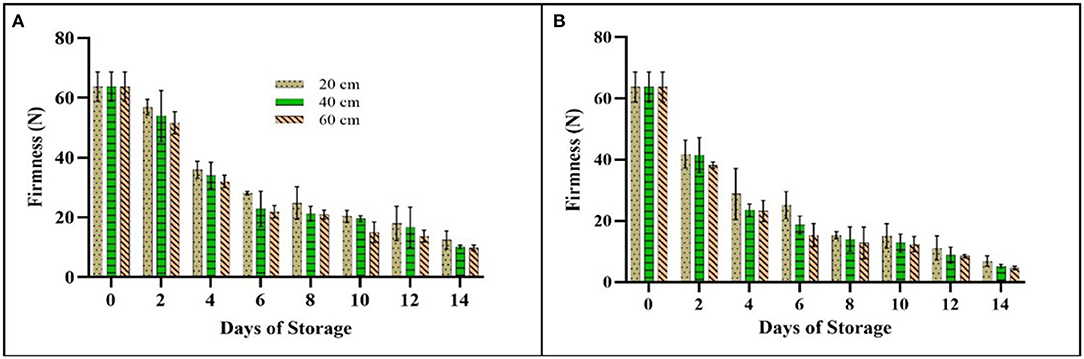
Figure 10. Firmness (N) of pear impacted at different drop heights (20, 40, and 60 cm) during 14 days at (A) 10°C and (B) 22°C storage conditions. The data were expressed in mean ± standard deviation. Error bars represent the standard deviation (S.D.) of the mean values ± S.D. of six readings per three replicates.
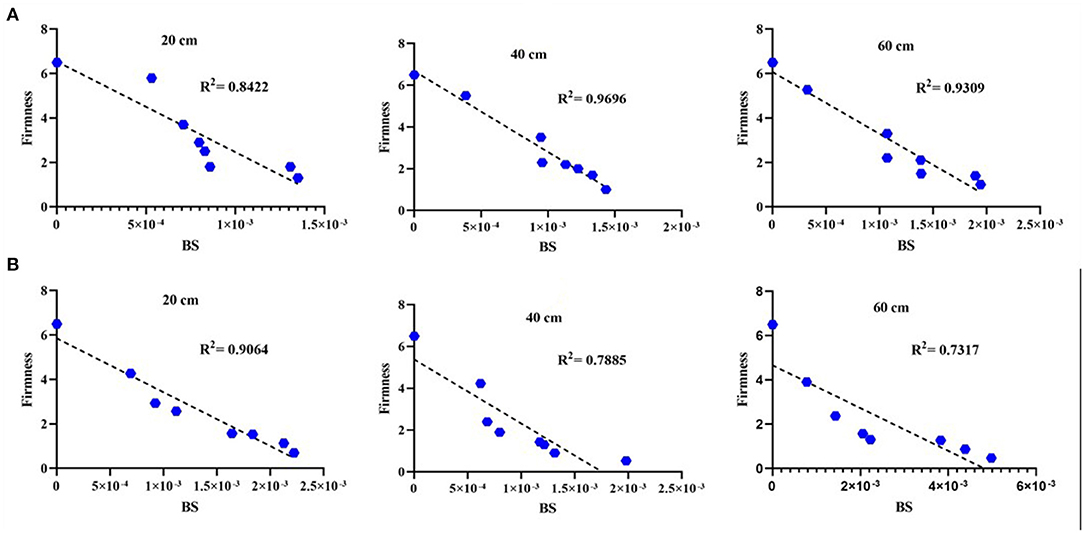
Figure 11. Single linear regression between BS and firmness at different drop heights (20, 40, and 60 cm) during 14 days at (A) 10°C and (B) 22°C storage conditions.
The statistics showed a significant (p < 0.05) effect of both temperature and storage duration on the TSS of pear fruit. At the same time, no interaction (p > 0.05) was found between the TSS of pear and drop height. TSS value was ranging between 12.13 and 15.40 °Brix on pear stored at 22°C compared to TSS value of pears stored at 10°C that was ranging between 12.13 and 14.80 °Brix (Table 4). The highest content of TSS was shown on day 10 of storage on pear impacted from medium (40 cm) drop height at 22°C. Also, there was a gradual decline and increase in TSS content of pear stored at 10°C (Table 4). The study agreed with the findings of Hussein et al. (2020b), who obtained no significant impact between TSS content and impact bruising in pomegranate. Montero et al. (2009) found that the TSS content of tangerines was highly reduced by impact bruise. Another finding was revealed by Maia et al. (2011) who reported that the total soluble content of bananas showed an increase after subjected to bruise damage. This was attributed to the conservation of starch to total soluble sugars during the ripening process under respiration resulted in high sugar content (Al-Dairi et al., 2021c; Gao et al., 2021), particularly at room temperature.

Table 4. Total soluble solids (TSS) value (°Brix) of pears impacted with three drop heights levels at two storage conditions during 14 days of storage.
Table 5 presents the Pearson correlation coefficients between BS, color space values [L*, a*, b*, total color change (ΔE*), chroma, and hue], firmness, and TSS on pear stored at 10 and 22°C and impacted by a steel ball from three drop heights. The results showed a positive correlation between L* and BS (p < 0.05, p < 0.001) viz as BS in pear fruits increased, the pear surface became lighter. A positive and strong linear relationship was observed between L* and a*, b*, total color difference, and chroma. All of these parameters increased gradually during storage time. However, a strong and negative correlation was found between all the previous color parameters and firmness. As firmness decreased, L*, a*, b*, chroma, and total color difference increased. There was also a negative and a strong correlation between firmness and BS (r = −0.91 20 cm,10°C: p < 0.001, r = −0.98 40 cm,10°C: p < 0.001, r = −0.96 60 cm,10°C: p < 0.001, r = −0.95 20 cm,22°C: p < 0.001, r = −0.88 40 cm,22°C: p < 0.001, r = −0.85 60 cm,22°C: p < 0.001). Firmness of bruised pears impacted at different heights was correlated negatively with TSS at 22°C (r = −0.92 20 cm,22°C: p < 0.001, r = −0.84 40 cm,22°C: p < 0.001, r = −0.96 60 cm,22°C: p < 0.001), while there was no correlation between firmness and TSS of bruised pears stored at 10°C. The study showed a positive correlation between TSS of impacted pear stored at 22°C and BS (r = 0.85 20 cm,22°C: p < 0.001, r = 0.78 40 cm,22°C: p < 0.05, r = 0.85 60 cm,22°C: p < 0.05), with no pronounce correlation at 10°C storage condition. The same scenario was observed between hue and other quality analyses like L*, b*, chroma, total color change, and firmness at 10°C in contract to storage at 22°C.
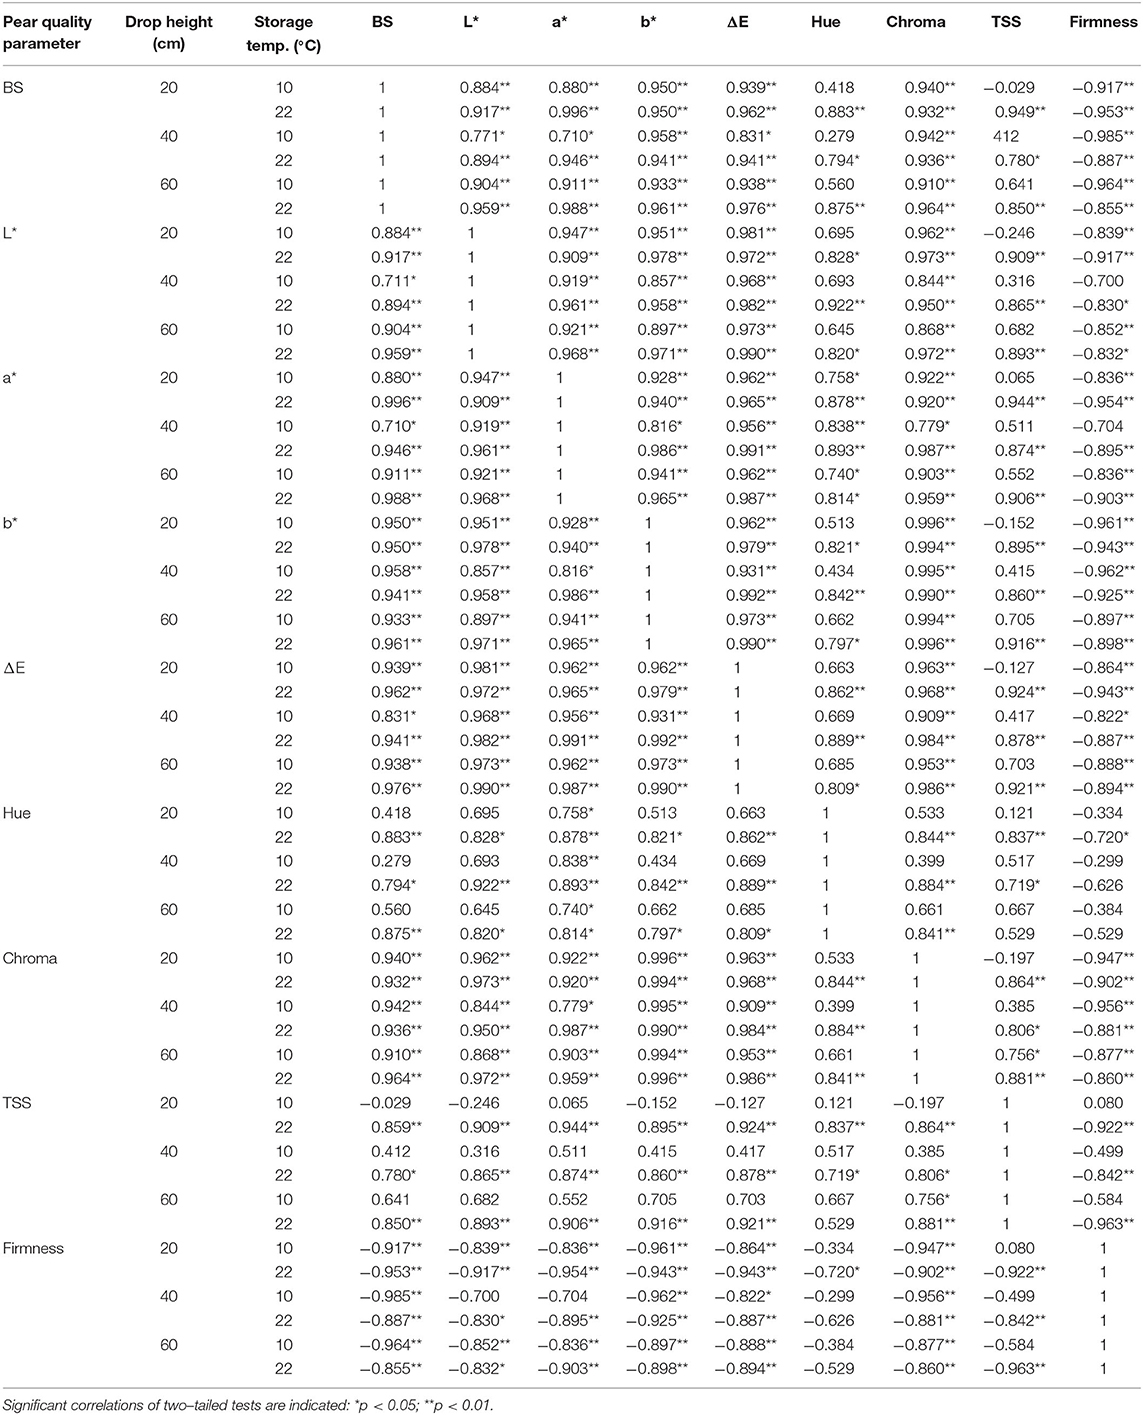
Table 5. Pearson correlation coefficients (r) (n = 8) between bruise susceptibility (BS), color space values [L*, a*, b*, total color change (ΔE), chroma, and hue], firmness, and TSS on pear stored at 10 and 22°C and impacted by a steel ball from three drop heights.
Pear fruits impacted at the highest drop height and impact energy (60 cm 0.647 J) showed the highest increase in BA, BV, and BS. Storage temperature condition and storage duration had a great influence in increasing bruise damage. Rapid increase (L*, a*, b*, total color change, and chroma) and reduction (firmness) were observed on pear stored at 22°C after it was subjected to an impact from 60 cm drop height for 14 days storage period. More color discoloration and ripening were observed on this treatment. Hue value and TSS were not affected by the drop height, but with storage temperature and storage duration. Storage at 10°C can retain the quality attributes of fresh produce that could be changed due to bruising.
The raw data supporting the conclusions of this article will be made available by the authors, without undue reservation.
PP: conceptualization, formal analysis, writing—review and editing, funding acquisition, and supervision. MA-D: data curation, formal analysis, and writing—original draft. All authors contributed to the article and approved the submitted version.
The research leading to these results received funding from the Research Council (TRC) of the Sultanate of Oman under Block Funding Program (TRC Block Funding Agreement No. RC/GRG-AGR/SWAE/19/01). We sincerely thank Sultan Qaboos University for funding this study through an internal grant (IG/AGR/SWAE/19/03).
The authors declare that the research was conducted in the absence of any commercial or financial relationships that could be construed as a potential conflict of interest.
All claims expressed in this article are solely those of the authors and do not necessarily represent those of their affiliated organizations, or those of the publisher, the editors and the reviewers. Any product that may be evaluated in this article, or claim that may be made by its manufacturer, is not guaranteed or endorsed by the publisher.
Ahmadi, E., Ghassemzadeh, H. R., Sadeghi, M., Moghaddam, M., and Neshat, S. Z. (2010). The effect of impact and fruit properties on the bruising of peach. J. Food Eng. 97, 110–117. doi: 10.1016/j.jfoodeng.2009.09.024
Al-Dairi, M., and Pathare, P. B. (2021). Kinetic modeling of quality changes of tomato during storage. Agric. Eng. Int. CIGR J. 23 183–193.
Al-Dairi, M., Pathare, P. B., and Al-Mahdouri, A. (2021a). Effect of storage conditions on postharvest quality of tomatoes: a case study at market-level. J. Agric. Marine Sci. 26, 13–20. doi: 10.24200/jams.vol26iss1pp13-20
Al-Dairi, M., Pathare, P. B., and Al-Mahdouri, A. (2021b). Impact of vibration on the quality of tomato produced by stimulated transport. In: IOP Conference Series: Earth and Environmental Science. Bristol: IOP Publishing. p. 012101.
Al-Dairi, M., Pathare, P. B., and Al-Yahyai, R. (2021c). Chemical and nutritional quality changes of tomato during postharvest transportation and storage. J. Saudi Soc. Agric, Sci. In press. doi: 10.1016/j.jssas.2021.05.001
Al-Dairi, M., Pathare, P. B., and Al-Yahyai, R. (2021d). Effect of postharvest transport and storage on color and firmness quality of tomato. Horticulturae 7:163. doi: 10.3390/horticulturae7070163
Azadbakht, M., Mahmoodi, M. J., and Vahedi Torshizi, M. (2019). Effects of different loading forces and storage periods on the percentage of bruising and its relation with the qualitative properties of pear fruit. Int. J. Horti. Sci.Technol. 6, 177–188. doi: 10.22059/ijhst.2019.280000.290
Bodner, M., and Scampicchio, M. (2020). Does bruising influence the volatile profile of pears? Nutr. Food Sci. ahead-of-print. doi: 10.1108/NFS-05-2020-0213
Bollen, A. (2005). Major factors causing variation in bruise susceptibility of apples (Malus domestica) grown in New Zealand. N Z J. Crop Horti. Sci. 33, 201–210. doi: 10.1080/01140671.2005.9514351
Bugaud, C., Ocrisse, G., Salmon, F., and Rinaldo, D. (2014). Bruise susceptibility of banana peel in relation to genotype and post-climacteric storage conditions. Postharvest Bio. Technol. 87, 113–119. doi: 10.1016/j.postharvbio.2013.08.009
Celik, H. K. (2017). Determination of bruise susceptibility of pears (Ankara variety) to impact load by means of FEM-based explicit dynamics simulation. Postharvest Bio. Technol. 128, 83–97. doi: 10.1016/j.postharvbio.2017.01.015
Costa, A. G., Braga, R. A. Jr, Boas, E. V. V., and Risso, M. (2018). Early prediction of internal bruising in potatoes by biospeckle laser technique. African J. Agric. Res. 13, 691–697. doi: 10.5897/AJAR2017.12959
Dobrzanski, B., and Rybezynski, R. (2002). Colour change of apple as a result of storage, shelf-life, and bruising. Int. Agrophysics. 16, 261–268.
Ergun, M. (2017). Physical, physiochemical and electrochemical responses of ‘Galaxy'apples to mild bruising. Eur. J. Horti. Sci. 82, 244–250. doi: 10.17660/eJHS.2017/82.5.4
Fadiji, T., Coetzee, C., Pathare, P., and Opara, U. L. (2016). Susceptibility to impact damage of apples inside ventilated corrugated paperboard packages: effects of package design. Postharvest Bio.Technol. 111, 286–296. doi: 10.1016/j.postharvbio.2015.09.023
Gao, M., Guo, W., Huang, X., Du, R., and Zhu, X. (2021). Effect of pressing and impacting bruises on optical properties of kiwifruit flesh. Postharvest Bio.Technol. 172:111385. doi: 10.1016/j.postharvbio.2020.111385
Hussein, Z., Fawole, O. A., and Opara, U. L. (2017). Investigating bruise susceptibility of pomegranate cultivars during postharvest handling. Afr. J. Rural Devel. 2, 33–39. doi: 10.22004/ag.econ.263298
Hussein, Z., Fawole, O. A., and Opara, U. L. (2019). Bruise damage susceptibility of pomegranates (Punica granatum, L.) and impact on fruit physiological response during short term storage. Sci. Horti., 246, 664–674. doi: 10.1016/j.scienta.2018.11.026
Hussein, Z., Fawole, O. A., and Opara, U. O. (2020a). Bruise damage of pomegranate during long-term cold storage: Susceptibility to bruising and changes in textural properties of fruit. Intl. J. Fruit Sci. 20, S211–S230. doi: 10.1080/15538362.2019.1709602
Hussein, Z., Fawole, O. A., and Opara, U. O. (2020b). Effects of bruising and storage duration on physiological response and quality attributes of pomegranate fruit. Sci. Hortic. 267:109306. doi: 10.1016/j.scienta.2020.109306
Komarnicki, P., Stopa, R., Szyjewicz, D., and Młotek, M. (2016). Evaluation of bruise resistance of pears to impact load. Postharvest bio. Technol. 114, 36–44. doi: 10.1016/j.postharvbio.2015.11.017
Li, J., Yan, J., Cao, J., Zhao, Y., and Jiang, W. (2012). Preventing the wound-induced deterioration of Yali pears by chitosan coating treatments. Food Sci. Technol. Int. 18, 123–128. doi: 10.1177/1082013211414774
Lipa, T., Szot, I., Dobrzański, B., Kapłan, M., and Baryła, P. (2019). Susceptibility of pear to bruising after harvest and storage. Acta Agrophys. 25, 485–499. doi: 10.31545/aagr/102717
Maia, V. M., Salomão, L. C. C., Siqueira, D. L., Puschman, R., Mota Filho, V. J. G., and Cecon, P. R. (2011). Physical and metabolic alterations in “Prata Anã” banana induced by mechanical damage at room temperature. Scientia Agricola 68, 31–36. doi: 10.1590/S0103-90162011000100005
Montero, C. R. S., Schwarz, L. L., Santos, L. C. D., Andreazza, C. S., Kechinski, C. P., and Bender, R. J. (2009). Postharvest mechanical damage affects fruit quality of ‘Montenegrina' and ‘Rainha' tangerines. Pesquisa Agropecuária Brasileira 44, 1636–1640. doi: 10.1590/S0100-204X2009001200011
OECD (2018). Guidelines on Objective Tests to Determine Quality of Fruit and Vegetables, Dry and Dried Produce. Available online at: https://www.oecd.org/agriculture/fruit-vegetables/publications/47288602.pdf (accessed December 29, 2020).
Opara, U. L., and Pathare, P. B. (2014). Bruise damage measurement and analysis of fresh horticultural produce-a review. Postharvest Bio. Technol. 91, 9–24. doi: 10.1016/j.postharvbio.2013.12.009
Pathare, P. B., and Al-Dairi, M. (2021). Bruise damage and quality changes in impact-bruised, stored tomatoes. horticulturae 7, 113. doi: 10.3390/horticulturae7050113
Pathare, P. B., Opara, U. L., and Al-Said, F. A. (2013). Colour measurement and analysis in fresh and processed foods: a review. Food Bioprocess Technol. 6, 36–60. doi: 10.1007/s11947-012-0867-9
Shafie, M., Rajabipour, A., Castro-García, S., Jiménez-Jiménez, F., and Mobli, H. (2015). Effect of fruit properties on pomegranate bruising. Int. J. Food Prop. 18, 1837–1846. doi: 10.1080/10942912.2014.948188
Shafie, M., Rajabipour, A., and Mobli, H. (2017). Determination of bruise incidence of pomegranate fruit under drop case. Int. J. Fruit Sci. 17, 296–309. doi: 10.1080/15538362.2017.1295416
Van Zeebroeck, M., Darius, P., De Ketelaere, B., Ramon, H., and Tijskens, E. (2007). The effect of fruit factors on the bruise susceptibility of apples. Postharvest Bio. Technol. 46, 10–19. doi: 10.1016/j.postharvbio.2007.03.017
Xia, M., Zhao, X., Wei, X., Guan, W., Wei, X., Xu, C., and Mao, L. (2020). Impact of packaging materials on bruise damage in kiwifruit during free drop test. Acta Phys. Plantarum. 42, 1–11. doi: 10.1007/s11738-020-03081-5
Zarifneshat, S., Ghassemzadeh, H. R., Sadeghi, M., Abbaspour-Fard, M. H., Ahmadi, E., Javadi, A., and Shervani-Tabar, M. T. (2010). Effect of impact level and fruit properties on golden delicious apple bruising. Am. J. Agric. Bio. Sci. 5, 114–121. doi: 10.3844/ajabssp.2010.114.121
Keywords: bruising, color, firmness, drop height, pear, storage temperature
Citation: Pathare PB and Al-Dairi M (2021) Bruise Susceptibility and Impact on Quality Parameters of Pears During Storage. Front. Sustain. Food Syst. 5:658132. doi: 10.3389/fsufs.2021.658132
Received: 25 January 2021; Accepted: 30 June 2021;
Published: 04 August 2021.
Edited by:
Anindya Chanda, Mycologics LLC, United StatesReviewed by:
Joseph D. Eifert, Virginia Tech, United StatesCopyright © 2021 Pathare and Al-Dairi. This is an open-access article distributed under the terms of the Creative Commons Attribution License (CC BY). The use, distribution or reproduction in other forums is permitted, provided the original author(s) and the copyright owner(s) are credited and that the original publication in this journal is cited, in accordance with accepted academic practice. No use, distribution or reproduction is permitted which does not comply with these terms.
*Correspondence: Pankaj B. Pathare, cGFua2FqQHNxdS5lZHUub20=; cGJwYXRoYXJlQGdtYWlsLmNvbQ==
Disclaimer: All claims expressed in this article are solely those of the authors and do not necessarily represent those of their affiliated organizations, or those of the publisher, the editors and the reviewers. Any product that may be evaluated in this article or claim that may be made by its manufacturer is not guaranteed or endorsed by the publisher.
Research integrity at Frontiers
Learn more about the work of our research integrity team to safeguard the quality of each article we publish.