 Jeremy Haggar1*
 Fernando Casanoves2
 Rolando Cerda2
 Stefania Cerretelli1
 Sergio Gonzalez-Mollinedo3
 Gracia Lanza2
 Erick Lopez3
 Benjamin Leiva4Alejandra Ospina2
- 1Natural Resources Institute, University of Greenwich, Chatham Maritime, Medway, United Kingdom
- 2Centro Agronómico de Investigación y Enseñanza (CATIE), Turrialba, Costa Rica
- 3Centro Estudios Ambientales y Biodiversidad, Universidad del Valle de Guatemala, Cuidad de Guatemala, Guatemala
- 4Observatorio Económico Sostenible, Universidad del Valle de Guatemala, Cuidad de Guatemala, Guatemala
Despite many years of research, there is still a lack of consensus as to the nature of the relationship between shade trees and agronomic intensification in coffee agroforestry systems. While some studies find unshaded intensively managed coffee is the most productive, other studies find no trade-off between shade characteristics and productivity. Our study of 179 farms from the main coffee growing regions of Costa Rica and Guatemala analyzed how shade affected the productive response of coffee to intensification of agronomic management. Four levels of coffee productivity were differentiated for each country associated with three levels of shade development in Costa Rica and two levels in Guatemala. The highest coffee productivity group was associated with medium shade development in both countries. High shade groups had low productivity, but very low productivity groups were associated with low (Costa Rica) or medium (Guatemala) shade. Medium and high productivity farms were associated with high elevation, lower rainfall and regions with higher coffee prices. Yields with a moderate level of investment (720–1,500 USD−1) and with medium shade (LAI 0.55-1.1) were not significantly different from yields with higher investment or lower shade levels. The increase in yields with increasing N fertilizer application were similar under low, medium and high LAI, but the mean productivity significantly lower with high LAI. Agronomic intensification to increase productivity is equally effective for low and medium shade systems (LAI <1.1); low productivity farms may have high shade or low shade but are mainly limited by low investment. Intensification of production is compatible with medium shade levels that should deliver broader ecosystem services but achieving this depends on coffee prices enabling this investment.
Introduction
There has been on-going concern that the intensification of coffee production to meet growing global demand and generate income for producing countries, has led to the replacement of traditional coffee agroforestry systems that use a diversity of shade trees with unshaded or simplified shade coffee production (Jha et al., 2014). While countries that have maintained coffee agroforestry systems have mostly lower or stagnated production (e.g., El Salvador, Guatemala, Mexico), increasing production has been achieved in countries with intensive full sun production (primarily in Brazil and Vietnam) (Jha et al., 2014). At the same time, coffee production has been at the vanguard of promoting sustainability with ~35% of global production now compliant with one of the private sustainability standards (Lernoud et al., 2018). While these standards promote shaded coffee production (i.e., the producer gains points for the use of shade and in most cases more points for a more diverse shade), none require them.
Concerns for the loss of diverse shaded coffee systems have particularly focused on Mesoamerica (Philpott et al., 2008), which is an important wintering habitat for migrant north American songbirds (Bakermans et al., 2012). Nevertheless, the importance of coffee agroforestry systems in conserving biodiversity and ecosystem services has been recognized across coffee plantation systems in other parts of the world such as Ethiopia (Aerts et al., 2011; Hundera et al., 2013) and India (Anil Kumar et al., 2018), and for multiple taxonomic groups such as bats, mammals, ants and butterflies (Moguel and Toledo, 1999; Philpott et al., 2008). Coffee agroforestry systems (shaded coffee) are considered to have multiple attributes that support ecosystem services which sustain coffee productivity (e.g., soil improvement, pest regulation, reduce physiological stress), as well as services that benefit society and the environment (e.g. carbon sequestration, regulation of hydrology, biodiversity conservation) (Cannavo et al., 2011; Hergoualc'h et al., 2012; Souza et al., 2012). Additionally, coffee agroforestry systems provide many other products (timber, fuelwood, other fruits) that can generate further economic benefits (Rice, 2008; Vaast et al., 2015).
A persistent challenge for coffee farmers is the extreme fluctuations in coffee prices with prices for arabica coffee showing six-fold fluctuations over the past two decades (www.ico.org/new_historical.asp). Since the severe crash in coffee price in the early 2000s, at least in Central America, there appears to have been an undocumented reversal in the trend for increased intensification, with farmers moderating rates of fertilizer use and reintroducing shade trees, in-line with the agronomic guidance from the coffee institutes in those countries (pers. obs). This is thought to be driven by the need to reduce costs during periods of low coffee prices, increases in fertilizer costs, and perceived benefits of shade for adaptation to climate extremes (Jaramillo et al., 2013; Jezeer et al., 2018).
Studies have contrasting conclusions as regards the trade-off between increasing productivity through intensification (increasing inputs and reducing or eliminating shade trees) and the maintenance of a diverse and complex shade tree coffee agroforestry system. Some authors have found no trade-off between tree diversity and productivity (e.g., Soto-Pinto et al., 2000; Nesper et al., 2017). Other studies across a broader range of production intensities have found a strong negative correlation between tree diversity and productivity, but this is largely driven by farmers investing less in agronomic management of systems with diverse shade, and so inevitable productivity is lower (Haggar et al., 2013, 2017). Experimental agronomic studies of shaded and unshaded coffee with the same levels of agronomic management generally find that unshaded systems are the most productive (Noponen et al., 2013; Schnabel et al., 2018), but other studies have found that, if shade levels are kept below 40% shade cover, shaded coffee production may be equally or more productive than unshaded (Soto-Pinto et al., 2000; Vaast et al., 2008).
The aim of the current study was to assess trade-offs or potential synergies between the use of shade trees and agronomic investment to increase coffee productivity. Analysis will include how farmer investment in agronomic production and shade system characteristics may result in a trade-off or potentially have synergies. The study was conducted in Costa Rica, a country that had considerably intensified its coffee production and had the highest productivity per hectare in the world in the 1990s (Samper, 1999), and in Guatemala, where traditional coffee agroforestry systems have been largely maintained and 98% of coffee production is shaded, although many farms have also invested in increasing productivity (ANACAFE, 2011).
Methods
The approach of the study was to conduct farm surveys to assess productivity and investment in agronomic management of coffee as measures of intensification, and shade characteristics as a proxy for the sustainability of the production system. Farm outcomes were assessed and grouped in terms of productivity for different levels of investment and shade employed. Agronomic management, agri-environmental and socioeconomic factors were analyzed to assess enabling conditions for trade-offs or synergies in outcomes.
Farm Selection
The farm surveys were conducted from September 2019 to January 2020 in three of the main coffee growing regions of Guatemala and Costa Rica, covering a range of agro-environmental conditions. A total of 180 farms (90 per country, 30 per region) were selected from a list used in a previous study in 2009 comparing sustainably certified and uncertified farms (Soto et al., 2011). Farms were selected from three regions (see below) that cover a range of environmental conditions, represent different shade types (monoshade, multistrata and where present full sun), and cover high, mid and low productivity in approximately equal representation. From the total pre-selected farms, only 122 were located, and the sample was complemented with 59 new farms (nine in Costa Rica and 50 in Guatemala). New farms were identified in collaboration with key stakeholders such as: Manos Campesinas and National Coffee Association (ANACAFE) in Guatemala; and the Institute of Coffee (ICAFE) in Costa Rica. As far as possible they were chosen to have similar shade and productivity characteristics as the missing farms. Subsequently, two farms (one from each country) were removed from the study due to incomplete data.
In Costa Rica, farms were selected in three coffee regions (Table 1) recognized by ICAFE: (i) Turrialba-Orosi (low-medium altitude, high rainfall, standard commercial grade coffee); (ii) Valle Occidental (mid-high altitude, seasonal climate with high quality coffee), and (iii) Los Santos Tarrazú (high altitude, seasonal climate, and coffee quality that is considered the best in the country).
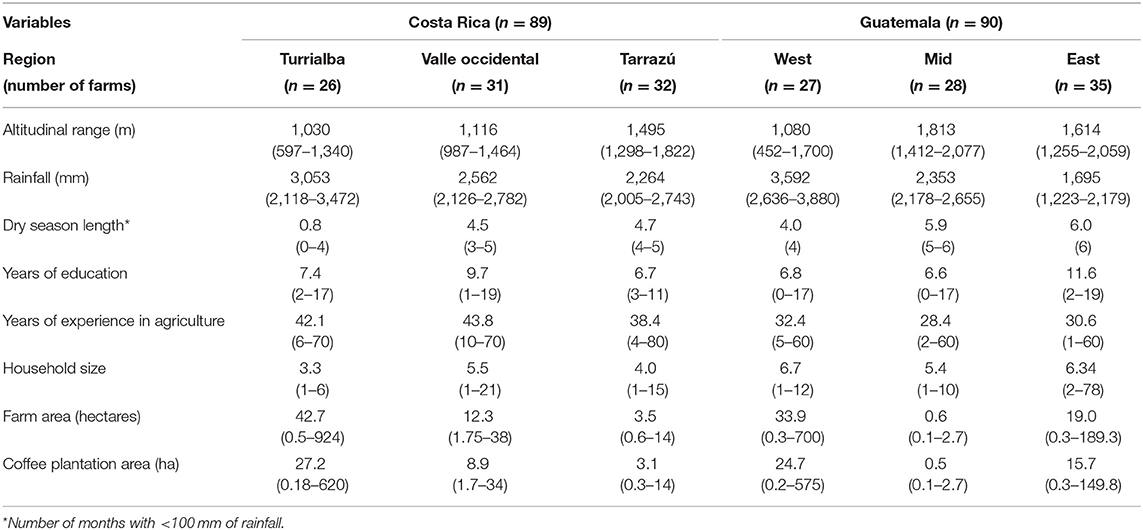
Table 1. Characterization of the farms in Costa Rica and Guatemala considered in the study (values are means, with range in parentheses).
In Guatemala, farms were selected in three coffee regions (Table 1) recognized by ANACAFE: West (departments of Quetzaltenango, Retalhuleu, and San Marcos) low-high altitude, high rainfall, commercial grade coffee; Mid (department of Solola) high altitude, medium rainfall, high quality coffee; and East (departments of Guatemala, Sacatepequez and Chimaltenango) high altitude, low rainfall, and very high coffee quality considered the best in the country.
Farm Survey
Interviews of farm owners or managers were conducted to collect social, economic, and agronomic data. Ethical standards of prior consent and confidentiality were followed as appropriate for socioeconomic surveys and farmers were at complete liberty to decline to participate (as a few did). Field measurements of shade were taken in one plot of their coffee plantations (see below). These plots were geo-referenced, and altitude registered. Plot coordinates were used to calculate total annual rainfall (mm) and number of dry months (<100 mm) from the WorldClim version 2.1 climate dataset for the 1970–2000 time period (downloaded from www.worldclim.org; Fick and Hijmans, 2017).
The interviews were conducted face to face with farmers to collect detailed information on farm characteristics, farmer and household characteristics, coffee area and yield (kg of coffee cherries produced in the previous harvest), shade system characteristics (see below for more details), details of coffee agronomic management including all inputs used (organic and/or chemical fertilizers and pesticides) and labor invested. Information was mainly obtained through farmer recall of activities conducted during the previous year, assisted by farm records where available. Coffee production data was for the last harvest (completed October 2018 to March 2019 depending on the region); agronomic pre-harvest management was recorded for the 2019 production year that spans from completion of the last harvest to the start of the next harvest (the moment at which interviews were conducted). Interviewers were limited to two people per country; people experienced, and knowledgeable about coffee. Interviewers received training, conducted trial interviews, and interview responses were reviewed periodically to ensure quality with feedback provided. All variables were quality checked in order to identify values out of acceptable or standardized ranges. All the values identified as outliers were reviewed or corrected with the producer in a second visit or phone call.
Assessment of Agronomic Investment
To evaluate the productive profile of each farm the following variables were considered: expenditures in: (i) fertilization, (ii) pest and disease control, (iii) shade management, (iv) weed control, and (v) coffee pruning. These include labor costs incurred to perform the corresponding activity during the 2019 productive year as reported by farmers, including labor to prepare and apply inputs. Fertilization, weed control, and pest and disease control also include quantities of inputs, valued at reported prices or imputed with market prices when needed. Fertilization includes foliar applications and chemical and organic fertilization, with organic fertilization accounting for input and labor costs when the fertilizer was produced on the farm. Weed control includes manual and chemical control. From the data on fertilization, application rates (kg ha−1) of nitrogen (N), phosphorus (P), and potassium (K) were calculated.
Total cost sums all expenditure variables from (i) to (v) (see above). Total cost was separated in two broad categories: input cost and manual labor costs. A measure of efficiency was calculated from the production in the 2018–2019 harvest divided by the total pre-harvest agronomic cost during 2019. Although the ideal would be to use the same year for production and cost, production data for the 2019–2020 harvest was not available at the time of the survey. Also, the 2018-19 harvest was completed before the impact of the 2019 El Nino, which would affect the 2019–2020 harvest. Therefore, we consider it reasonable to relate the 2018/19 harvest to the agronomic management conducted during 2019 as an assessment of the overall productive efficiency of the agronomic management strategy.
Shade Composition and Cover
Shade species richness and tree density on each farm, were assessed through farmer recall as to the number of trees per hectare maintained in the coffee plantation and making a list of tree species in the shade canopy to estimate species richness.
Shade levels in the coffee plantations were assessed by taking hemispherical canopy photos to estimate: (i) leaf area index (LAI) and (ii) proportion of visible sky (VisSky), the inverse of canopy cover. If the farm had more than one coffee plantation, a representative coffee plantation was selected in consultation with the owner or manager against the following characteristics: (i) should be a plantation with coffee in production, (ii) minimum size of 1,000 m2, and (iii) representative of the overall farm management (shade and typical inputs and cultural practices).
Inside the selected plantation, three points were assessed depending on the size and shape of the plantation, at least 30 m apart. In the few cases where plantation size was too small only one or two points were assessed. Hemispherical photographs were taken at each point with a camera fitted with a fish-eye lens (Canon 80D—Sigma 4.5 mm) and a self-leveling mount, above the coffee plants to assess only the shade trees canopy. The photographs were taken (when possible) under overcast sky conditions in order to minimize glare from direct sunlight, light reflection, or uneven lighting. The images were analyzed using the HemiView software version 2.1 (Rich et al., 1999) to derive the proportion of open skype (VisSky) and the leaf area index (LAI). The threshold used to classify “sky pixels” and “canopy pixels” was manually selected for every photo. Point values were averaged to represent the plantation and farm shade levels.
Coffee Plantation Typology
The coffee plantation typology in each country was formed using multivariate cluster analysis (similar to Bhattarai et al., 2017) based on the shade LAI and coffee productivity, as outcomes of the management strategy of the plantation. LAI was chosen as the best single indicator of “shade” as it integrates tree density, biomass and cover into a single value. LAI is closely related to tree productivity, light capture, and the competitiveness of trees in mixtures (Haggar and Ewel, 1997), as well as microclimate and soil ameliorating functions of shade trees. This enabled the grouping of farms according to the outcome in terms of productivity and shade and to assess the potential synergy or trade-off between productivity and shade. Cluster analysis of plantations per country was conducted using LAI and coffee productivity (kg ha−1), previously standardized, using the Ward method with Euclidean distance. The resulting clusters represented the coffee plantation typology that reflects the strategy in terms of intensification and sustainability. Multivariate analysis of variance was used to assess the differences in typologies by country (Wilks-F), using Hotelling post-host test (p < 0.05).
All analysis were performed by country, comparing variables among the plantation types. The analysis included general linear model ANOVAs with typology as class variable and yield, average number of trees per hectare, VisSky, total cost, individual costs per activity, altitude, efficiency of production, coffee area, rainfall, and farm size as response variables. Normality and equal variances assumptions were evaluated using graphical tools on model residuals. Fisher LSD (p < 0.05) was used to evaluate the mean differences after rejection of null ANOVA hypothesis. When the normality assumption did not hold, rank transformation of the variable was performed using Kruskal–Wallis ANOVA.
The relationship between typologies and discrete variables (number of species, producer age, years working in coffee, number of family members and members working with coffee or depending on it, length of dry season) was evaluated using generalized linear models with a Poisson distribution and log link function. When overdispersion was present, Negative Binomial distribution was applied. Fisher LSD (p < 0.05) was used to evaluate the mean differences after rejection of null hypothesis.
The association between the typology and categorical variables (region, educational level, sustainability certification and farm size class) was analyzed using contingency tables (Chi-Square statistics). To visualize the associations among categories biplot graphs were obtained from correspondence analysis.
Analysis by LAI and Total Cost Categories
To explore in more detail the productivity response to intensification (agronomic investment) and how it is influenced by shade level (reflected by LAI), coffee plantations were categorized according to three levels of LAI and three levels of total cost with approximately equal distribution of plantations at each of the three levels. Shade LAI category ranges were low <0.55, medium 0.55–1.1 and high >1.1; and agronomic cost category ranges were low <723 USD ha−1, medium 723–1,570 USD ha−1, and high >1,570 USD ha−1. Firstly, a mixed model was run to test the effects of the LAI and cost category variables on productivity and any interaction. Then nine groups were formed combining the LAI-Cost categories which were compared as to their productivity, N input rates, input costs and labor costs using a General Linear Model. Linear regression analysis was used to evaluate the effect of N on productivity for each shade category. Four farms with N application rates over 600 Kg N ha−1 were not included as these extreme rates did not result in increased production and their inclusion overly influenced the slopes of the regressions. The analyses were carried out in InfoStat version 2020 (Di Rienzo et al., 2020) and R 4.0.3 (R Core Development Team, 2020).
The results of these analyses enabled us to determine the influence of shade levels on the productive response of coffee to agronomic investment and management and thus the potential for trade-offs or synergies between shade and intensification.
Results
Coffee Shade-Productivity Typology
Four shade-productivity clusters were identified in the dendrograms for each country (see Supplementary Material) with highly significantly multivariate differences among them (p < 0.0001). The clustering accounted for 65.17 and 83.50% of the variation in LAI and productivity in Costa Rica, and 63.86 and 91.29% of the variation in LAI and productivity in Guatemala. In both countries the cluster typologies enabled differentiation of four levels of productivity, but for shade LAI only two levels in Guatemala and three levels of LAI in Costa Rica (Table 2). In both countries, the high productivity typology was associated with medium LAI shade (Hp-Ms), while medium productivity typologies were associated with low (Mp-Ls) or medium (Mp-Ms) LAI shade in Costa Rica and Guatemala, respectively. The low productivity typologies were associated with high LAI shade (Lp-Hs) in both countries, but the very low productivity typologies were associated with low (VLp-Ls) or medium shade (VLp-Ms) in Costa Rica and Guatemala, respectively. Thus, there was no simple trade-off between shade and productivity, possibly due to interactions with other factors such as agronomic management.
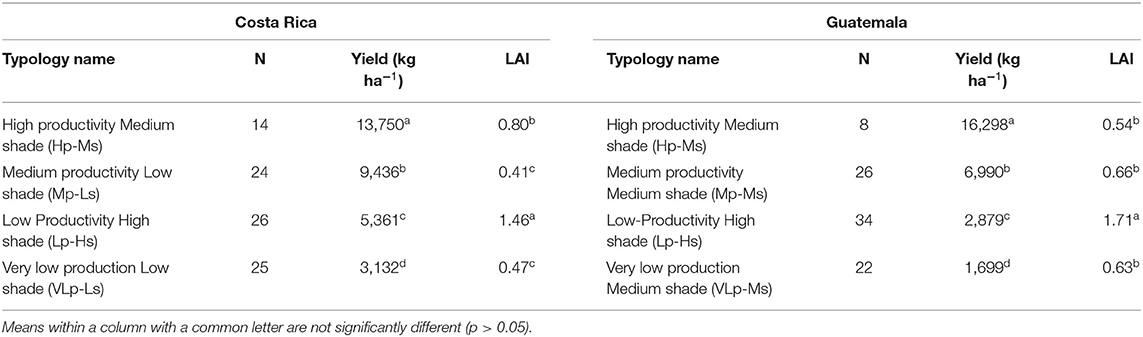
Table 2. Coffee plantation typology groups according to productivity and LAI (N = number of farms in the group).
Shade System Characteristics
The proportion of open sky (inverse of shade canopy cover) followed the LAI differences between typologies with three levels of shade for Costa Rica and two for Guatemala. In terms of the more typically used canopy cover measure of shade high LAI (>1.1) corresponds approximately to over 60% shade cover, medium LAI (0.55–1.1) to 41–60% shade cover, and low LAI (<0.55) to 40% shade cover or less. In Costa Rica there were no differences in tree density but in Guatemala the VLp-Ms typology had significantly lower tree density than the Mp-Ms typology. Tree species richness was significantly lower in the VLp-Ls typology of Costa Rica and significantly higher in the Mp-Ms typology in Guatemala (Table 3). There were no significant differences in the occurrence of different tree types (legume shade, timber, fruit, and other species), between the four typologies in either country, with all four tree types represented with similar frequency in all typologies.
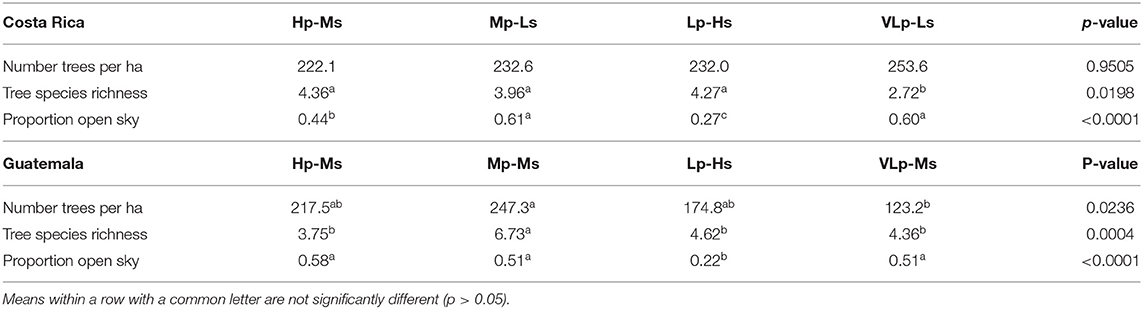
Table 3. Shade characteristics for coffee plantation typologies (key to typology codes see Table 2).
Agronomic Investment
In Costa Rica, the high and medium productivity typologies had significantly higher investment in total cost, and in particular in fertilizer, pest and disease control, compared to the low and very low productivity typologies (Figure 1A). There were no differences in manual labor costs nor in the costs of associated management practices (shade management, weeding and pruning) between the typologies. Input costs were not different between high and medium productivity typologies (1,245 USD ha−1 and 1,177 USD ha−1, respectively), but they were double that for low and very low productivity typologies (608 USD ha−1 and 586 USD ha−1, respectively). Kilograms of coffee produced per dollar invested was significantly higher (p < 0.05) for the Hp-Ms typology (6.87 kg USD−1) compared to Lp-Hs (4.95 kg USD−1) or VLp-LS (3.34 kg USD−1) typologies. Therefore, overall the medium shade level typology achieved the highest productivity for the level of input investment (Table 2; Figure 1A).
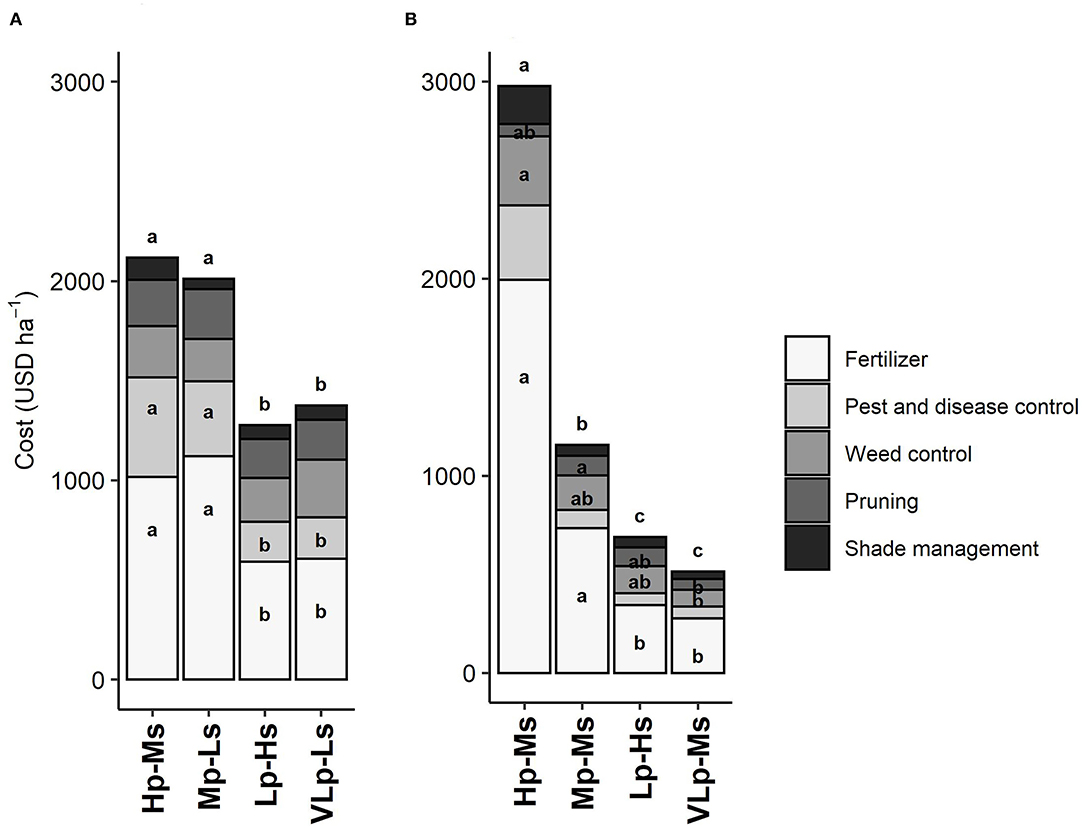
Figure 1. Agronomic costs (USD ha−1) by coffee plantation typology in (A) Costa Rica and (B) Guatemala. The letters at the top of the bars indicate a significant difference (p<0.05) in total cost. The letters in the bars indicate significant differences between typologies for each type of cost. Key to typologies: Hp-Ms, High productivity, Medium shade; Mp-Ls, Medium productivity, Low shade; Mp-Ms, Medium productivity, Medium shade; Lp-Hs, Low productivity, High shade; Vlp-Ls, Very low productivity, low shade; Vlp-Ms, Very low productivity, Medium shade.
In Guatemala, total agronomic costs, and fertilizer costs were significantly higher in high productivity (on average about four times higher) and medium productivity (on average about double) typologies compared to low and very low productivity typologies (Figure 1B). Weed control costs were also significantly higher (on average four times higher) for high productivity than very low productivity typologies. Manual labor costs were also significantly higher (on average about triple, 966 USD ha−1) for the high productivity typology than low and very low productivity typologies; also the very low productivity typology had significantly lower manual labor costs (253 USD ha−1) than low or moderate productivity typologies (363 and 456 USD ha−1, respectively). Kilograms of coffee produced per dollar invested was significantly higher (p < 0.05) for the high and medium productivity typologies (9.1 and 8.5 kg USD−1) than low or very low productivity typologies (4.8 and 6.4 kg USD−1, respectively). As in the case of Costa Rica the typology with the highest productivity for the level of investment, had high productivity under medium shade.
Nutrient inputs from fertilizer (chemical and organic) were significantly higher (approximately double for N and K) for high and medium productivity typologies than low and very low productivity typologies in Costa Rica, but there were no differences between high and medium productivity typologies (Table 4). Low productivity differed from very low productivity typologies only in having a significantly higher application rate for P. In Guatemala medium and high productivity typologies had higher N application rates (two to four times higher on average) than low and very low productivity typologies. There was high variation in the amount of N applied between farms within the high productivity typology, with a quarter of farms that fertilize using only organic or mineral compounds having very low N additions (<50 kg N ha−1). Across all typologies the highest levels of nutrient application were similar between the two countries but twenty-one farms in Guatemala applied <1 kg N ha−1, as opposed to only four in Costa Rica. This is reflected in the lower levels of nutrient inputs for low and very low productivity typologies in Guatemala compared to those in Costa Rica. In particular, the high shade low productivity farms had similar productivity between countries but nutrient inputs in Guatemala were less than half that in Costa Rica (Table 4).
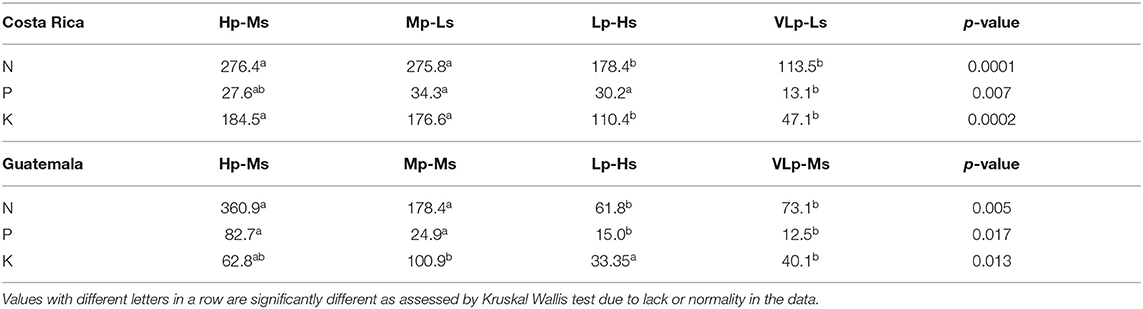
Table 4. Median nutrient input levels (kg ha−1 yr−1) for each coffee plantation typology (key to typology codes in Table 2).
Farm Socioeconomic and Environmental Characteristics
All production typologies were found in all regions, nevertheless there was a significant trend (p < 0.01) in frequency by region in both countries. In Costa Rica, the majority of the high and medium productivity plantations were found in Tarrazú, a majority of very low productivity low shade plantations in Turrialba, and a majority of low productivity high shade plantations in Valle Occidental (Figure 2). In Guatemala, a majority of high and medium productivity plantations were found in the eastern region (Sacatepequez, Guatemala, and Chimaltenango), a majority of the very low productivity plantations in the western region (San Marcos and Quetzaltenango), but low productivity high shade plantations were evenly distributed between regions (Figure 3). While there was no significant trend in terms of certification in Costa Rica there was in Guatemala (p = 0.006) with a majority of certified plantations (other than organic) found on medium productivity medium shade farms, and a majority of this plantation type were certified. Organic plantations were found among all plantation typologies in both countries but tended to be found in more marginal regions (Turrialba and Western region of Guatemala). There were no significant associations between plantation typologies and farm size in either country.
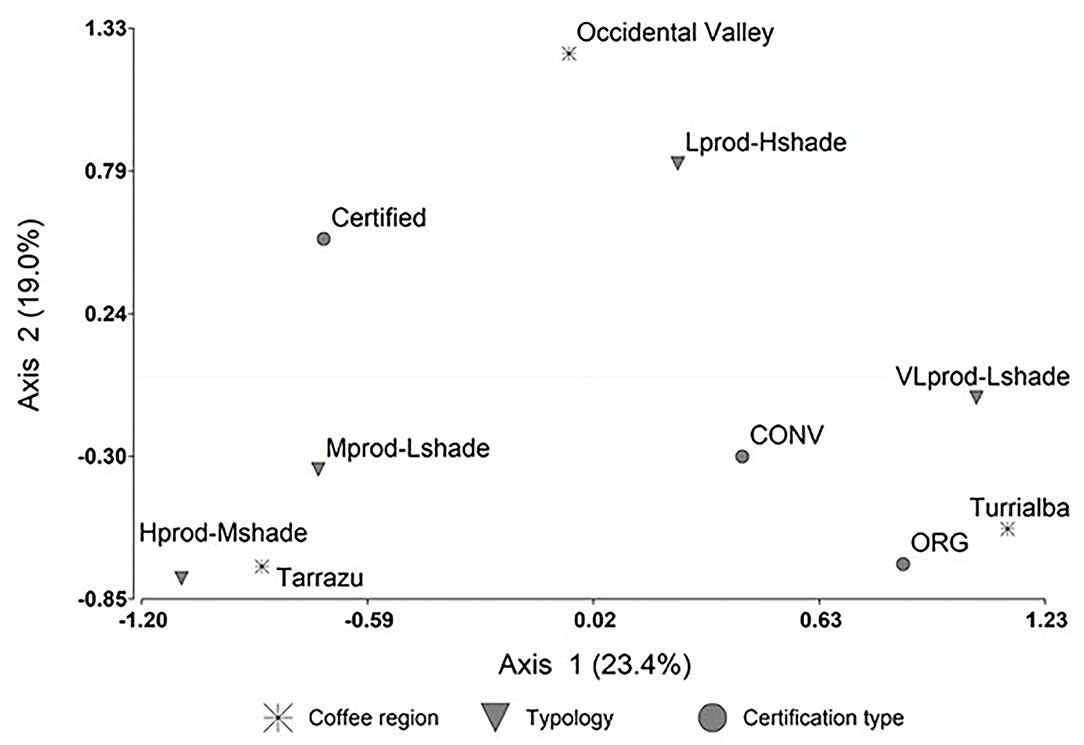
Figure 2. Degree of association between coffee plantation typologies, regions (see Table 1) and certification type in Costa Rica using a biplot from multiple correspondence analysis. Key to typologies: Hp-Ms, High productivity, Medium shade; Mp-Ls, Medium productivity, Low shade; Lp-Hs, Low productivity, High shade; Vlp-Ls, Very low productivity, low shade. Key to certification type: ORG, organic, CONV, not certified, certified, all sustainability certifications other than organic.
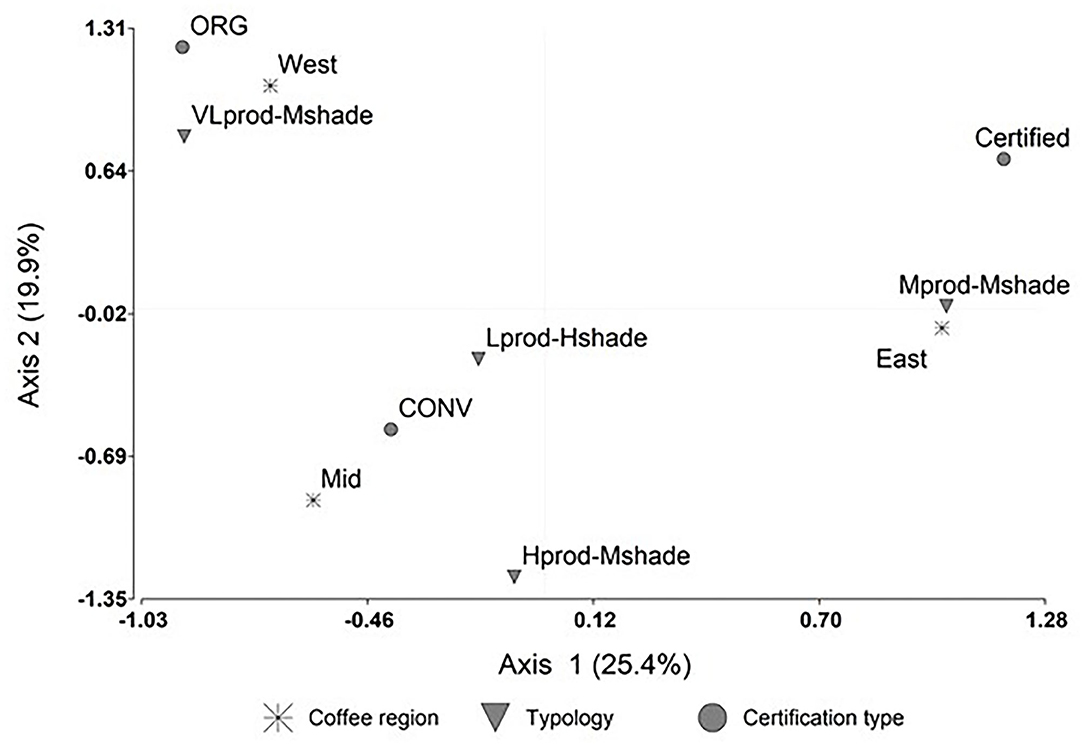
Figure 3. Degree of association between coffee plantation typologies (key to codes see Table 2), regions (see Table 1) and certification type in Guatemala using a biplot from multiple correspondence analysis. Key to typologies: Hp-Ms, High productivity, Medium shade; Mp-Ms, Medium productivity, Medium shade; Lp-Hs, Low productivity, High shade; Vlp-Ms, Very low productivity, Medium shade. Key to certification type: ORG, organic, CONV, not certified, certified, all sustainability certifications other than organic.
In both countries, the typologies were similar in terms of social characteristics. There were no significant differences between typologies in farmer age, educational level, years of experience, number of family members dependent on the farm, nor number of family members working on the farm.
High and medium productivity typology plantations had higher altitude than lower productivity plantations, in both countries. Very low productivity typologies in both countries tended to have higher rainfall and, in the case of Costa Rica, shorter dry season (Table 5).
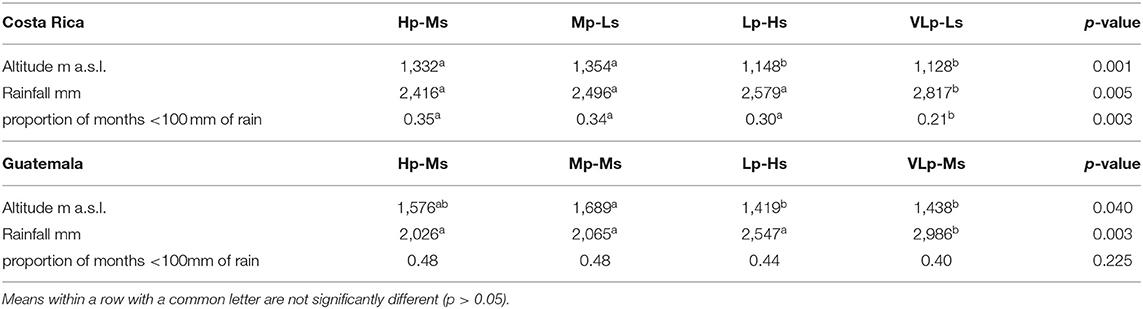
Table 5. Agri-environmental conditions for each coffee plantation typology (key to typology codes see Table 2).
Yield Response to Agronomic Investment and Interaction With Shade LAI
In Costa Rica yield was significantly different between cost categories (p < 0.001) but not LAI categories, and there was no interaction. High and medium agronomic cost categories had very similar yield and both had significantly higher yield than low-cost plantations (8,612 and 7,998 kg ha−1 vs 2,172 kg ha−1, respectively, p = 0.002). The medium-cost high-shade group had significantly lower yield than high-cost low and medium shade groups in multiple means comparisons (Figure 4A). In Guatemala there was a significant difference in yield across all three cost categories (p < 0.001; high 9,909 kg ha−1 vs. medium 5,456 kg ha−1 vs. low 3,084 kg ha−1), and between the LAI categories (p = 0.002; LAI <0.55, 7,025 kg ha−1 and LAI 0.55–1.1, 7,472 kg ha−1 vs. LAI >1.1, 3,951 kg ha−1), plus there was a marginally significant LAI × Cost interaction (p = 0.064) (Figure 4B). Similar to Costa Rica, in Guatemala medium-cost medium-shade group productivity was not significantly different from high-cost productivity, while in contrast there were no significant differences in yield across investment levels for high shade (Figure 4B). In both countries yields under high investment were significantly higher than under low investment and this response was not different between low and medium shade, indicating the medium shade levels do not limit yield response to agronomic investment.
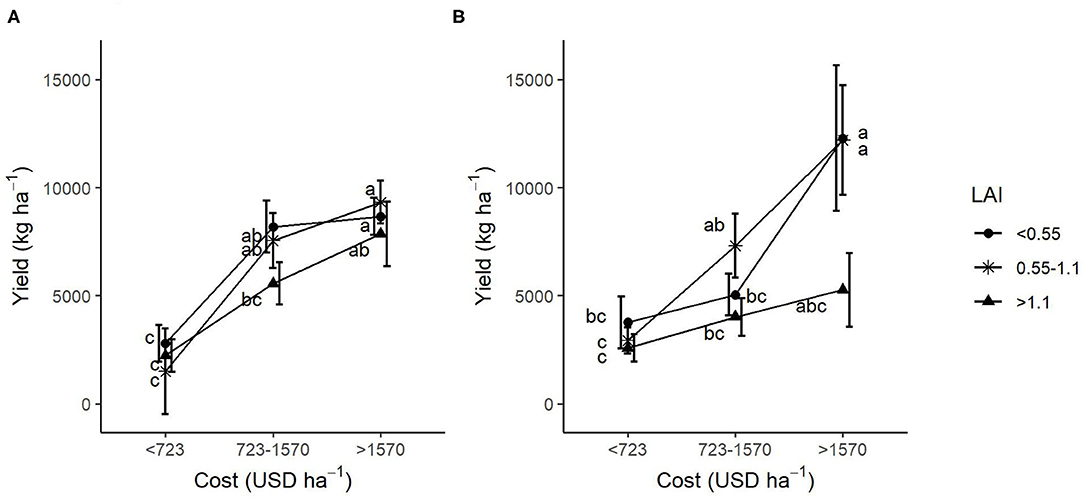
Figure 4. Coffee production for different levels of agronomic investment (cost) and shade LAI for (A) Costa Rica and (B) Guatemalan plantations. Means with a common letter are not significantly different (p > 0.05).
In Costa Rica high-cost groups invested more in both inputs and manual labor than medium cost groups and had higher rates of N application for the same shade grouping. Likewise input costs of medium-cost groups were higher than low-cost groups, but differences in manual labor costs and N applications rates were not statistically significant (Table 6a). In Guatemala high-cost groups invested more in inputs and have higher N application rates than medium-cost groups with high and medium shade, but not the with low shade group even though it had lower productivity. Low-cost groups invested less in inputs and manual labor than medium-cost groups but differences in N application rates were only significant among low shade groups (Table 6b).
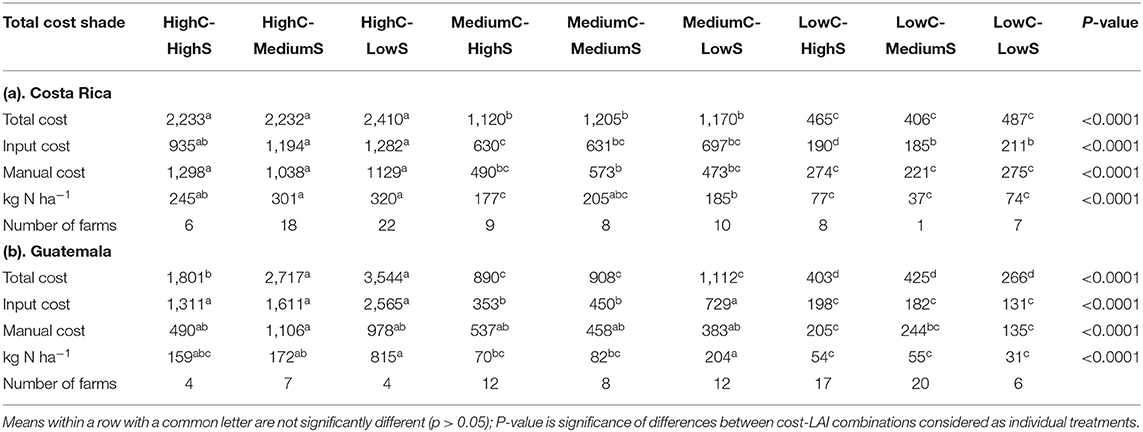
Table 6. Agronomic investment on coffee plantations grouped by high, medium and low total agronomic cost (C) and shade LAI (S) categories.
Yield Response to N Application According to Shade Levels
All regressions of coffee yield against levels of nitrogen input, for the different LAI (shade) categories, were significant and similar in both countries and thus were combined for the two countries. The regressions had no significant differences in slope, i.e., there was a similar response of productivity to increased N application rates across the different shade categories. Although the regression for the high LAI category had a significantly lower intercept (1,911 kg ha−1) than low (4,275 kg ha−1) and medium (4,364 kg ha−1) LAI, which had very similar values (Figure 5).
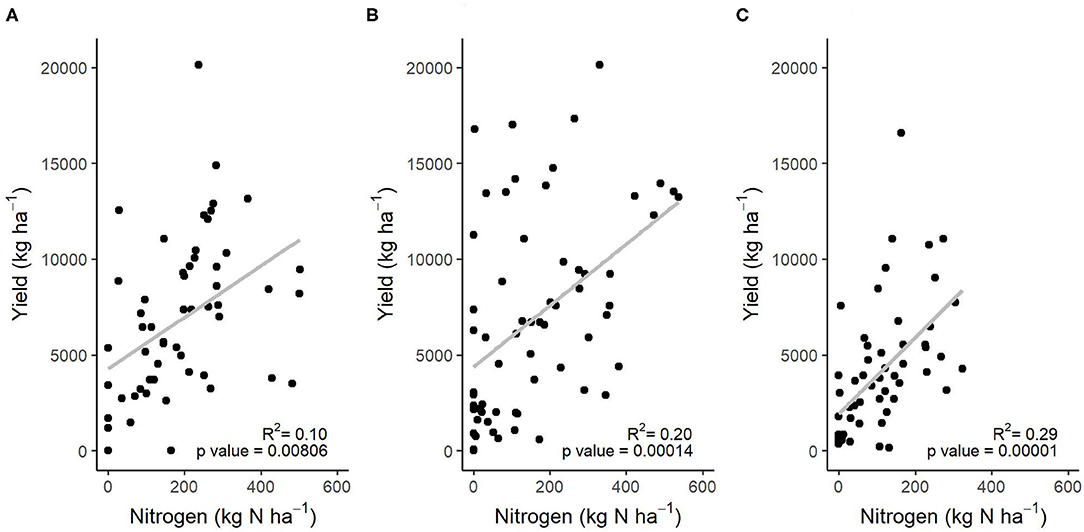
Figure 5. Coffee yield response to levels of nitrogen inputs under (A) low (<0.55), (B) medium (0.55–1.10), and (C) high (>1.10) shade LAI combining data from both countries.
Discussion
Our results indicated that high productivity coffee plantations as managed by farmers in Costa Rica and Guatemala were characterized by moderate shade LAI and moderate to high agronomic costs. Further analysis shows that in Costa Rica high productivity could be achieved with moderate agronomic investment under moderate shade, and that higher levels of investment or lower shade did not lead to higher yield. There was a similar tendency in Guatemala with no significant yield difference between moderate and high investment when associated with moderate shade. These results also demonstrate that low shade cover did not confer greater productivity than having moderate shade. This is similar to findings of Soto-Pinto et al. (2000) that found 38–48% of shade was optimal for production, similar to our “moderate shade” level.
The characteristics of “moderate shade” in this study were a shade tree cover of between 41 and 60%, a tree density of 200–250 trees per hectare, and three to six tree species. This is a higher level of shade than that identified as optimal by Cerda et al. (2020) who working just in the Turrialba area found no evidence of shade contributing to pest and disease yield losses when below 35% shade cover (equivalent to our low shade). In terms of the classification used by Moguel and Toledo (1999) our “moderate shade” would correspond to the “commercial or traditional polyculture shade” but not meet the complexity of “rustic shade” nor be as simple as “shaded monoculture” systems. However, the high shade (over 60% canopy cover) systems in this study did not on average have higher tree densities nor tree diversity to meet a “rustic shade” condition. The low shade systems on average did have lower tree density (Guatemala) or diversity (Costa Rica) and may be closer to “shaded monoculture.” Nevertheless, similar to other studies (Nesper et al., 2017), shade cover, tree density and tree diversity did not appear to be closely correlated. Cerda et al. (2019) reviewing different studies concluded that stand basal area of shade trees is the best metric to assess shade tree influence on coffee or cocoa as it integrates tree density and size, which should be highly correlated to LAI and carbon stocks. Nevertheless, care is needed when comparing shade level from different studies since different shade assessment methods can lead to different conclusions (Jezeer et al., 2018).
The lack of association between these factors makes interpretation of differences in quality of habitat for biodiversity difficult. The many studies of diversity tend to contrast systems such as full sun with shaded, or monoculture with rustic (e.g., Greenberg et al., 1997; Philpott et al., 2008), without it being clear which factors are the most important. Our resultant typologies, however, indicate that shade cover, tree density and species richness are independent of each other. For example, the highest tree species richness (under Mp-Ms in Guatemala) had moderate shade level (50% cover) and a similar tree density (250 trees/ha) to a low shade system in Costa Rica. While it is likely that some taxonomic groups may require high shade levels, there appears to be scope for increased tree diversity within moderate shade levels at an adequate tree density that may provide habitat for a more diverse associated fauna and flora. Nevertheless, some studies have found that ecosystem services from biodiversity such as pest regulation and pollination are affected by canopy cover and tree diversity (Martínez-Salinas et al., 2016; Chain-Guadarrama et al., 2019). Tree cover from shaded coffee may also contribute to landscape connectivity for groups such as birds, bats or amphibians (Murrieta-Galindo et al., 2013; Estrada-Carmona et al., 2019).
Under high levels of shade (LAI >1.1; ~ > 60% shade cover) productivity was generally lower, although in many cases agronomic investment and N application rates were also lower. As suggested by other studies, in Guatemala the farms characterized by high shade levels generally had lower agronomic investment (Haggar et al., 2013). Nevertheless, increased N application under high shade, when undertaken, did result in a positive productivity response from the coffee. This indicates firstly that there is competition between trees and coffee for nutrients that fertilization can alleviate, but also that even heavy shade does not prevent coffee responding to N fertilization. Among farm level studies, Meylan et al. (2017) found no evidence of competition between Erythrina shade and coffee production on Costa Rican farms with high N fertilization rates, but in this case under low tree densities and frequent shade regulation, while (Boreux et al., 2016) found no effect of fertilization nor shade cover on coffee productivity in India. The only study found of the response of coffee to fertilizer at high shade levels was by Farfan and Mestre (2004) who concluded coffee responded to fertilizer only at low tree densities (70 trees ha−1 of an Inga species), but there were no true replicates of the shade treatments so the result may not be reliable. Another experiment reported by Haggar et al. (2011) shows that coffee does respond to high levels of fertilization in shaded coffee agroforestry systems.
In Costa Rica the high productivity under moderate shade was associated with high levels of N fertilizer use (200–300 kg N ha−1), as well as higher investment in fertilizer and pest and disease control in general. However, in Guatemala this was not always the case. While the small group of high-input low shade farms had very high N fertilization levels (over 800 kg N ha−1) their productivity was very similar to high-input moderate shade farms, which applied only about 172 kg N ha−1. Furthermore, moderate-input moderate shade farms that only applied 82 kg N ha−1, had yields that were not statistically lower than the high input farms. It appeared that some farmers in Guatemala achieved high productivity with lower levels of N application, the details of their agronomic strategy merits more detailed study. It would appear that the highest levels of investment and/or use of N fertilizer in both countries may be in excess of what is required to achieve a high level of productivity. Such excessive use of fertilizer may lead to fertilizer runoff and leaching that affects surrounding water bodies, ground water sources and generates the emission of nitrous oxide gas (Bergamo et al., 2008; Cannavo et al., 2013).
Although high shade plantations generally also had low agronomic investment, and lower coffee productivity, there were some high-shade plantations that had higher investment and N application rates that resulted in higher yields. Even though high shade coffee responds to increased N applications, the resultant yield is less than with moderate or low shade. However, this does not account for additional tree products that high shade systems may generate (Rice, 2008; Vaast et al., 2015). Other studies in Peru and El Salvador (Gobbi, 2000; Jezeer et al., 2018) have found higher investments in plantations with a reduction in shade level, but our study indicates that low shade, low investment and high shade, high investment strategies are also conducted by farmers and yields respond accordingly. Cerda et al. (2017) looked at the economic interaction between management intensity and shade type on gross income (a function of productivity) finding that the increase in management intensity was greater for monocultures than agroforestry to achieve a given increase in gross income.
For some farmers groups in both countries a low shade system appeared to be a strategy to minimize costs as it was accompanied by low investment, and often resulted in very low productivity. This strategy was more frequent in areas less favorable for coffee such as Turrialba and the Western part of Guatemala, both of which have higher annual rainfall, shorter dry season and include farmers from low to high altitudes. In contrast, higher productivity moderate shade typologies were more frequent in regions with higher altitude, lower rainfall and longer dry season (Tarrazú in Costa Rica and Sacatepequez/Chimaltenango in Guatemala). This may be because coffee responds better to this production environment, but also because farmers receive higher prices for coffee in these regions as it is considered to be better quality. The Costa Rica Coffee Institute reports on coffee prices paid to farmers indicate prices are 20% higher in Tarrazú than Turrialba (ICAFE, 2019). Price data are not available for Guatemala but the eastern part of our study area includes the highly sought after “Antigua” coffee (from Sacatepequez) which is protected by denomination of origin as well as Acatenango (Chimaltenango) and Fraijanes (Guatemala Department) which are of similar quality (ANACAFE, 2011). The combination of better growing conditions and higher coffee prices may enable these farmers to invest in having productive and sustainable production systems (Pelupessy and Díaz, 2008). Thus, higher altitude and higher coffee prices are important drivers that enable farmers to invest in having both productive and sustainable production systems; in contrast lower altitude and prices may oblige farmers to reduce costs, which appears to result in some reducing shade to limit costs of shade management, while others allow shade to develop to higher levels to reduce the fertilizer demand of the crop. Both strategies result in lower productivity.
We conclude that productivity of coffee systems in Costa Rica and Guatemala primarily depends on the agronomic investment, and especially responds to N fertilization levels. Across low and medium shade levels (LAI < 1.1 or ~ < 60% shade cover) there is no trade-off in yield response to investment with shade. Indeed, the highest productivity farms in both countries had medium levels of shade. But a high level of shade can decrease the yield response to increased inputs, in this case generating a trade-off. Therefore, there appears to be compatibility between intensification and shade production with high productivity achievable with medium levels of investment and moderate shade up to about 60% cover. Such shade levels permitted a moderate diversity of tree species (on average 4 species) which may generate other products as well as broader ecosystem services that support coffee production and benefit society in general. Furthermore, such agroforestry systems may be more resilient to increasing climate variability particularly excess rainfall and drought, but also high and low temperatures.
Enabling farmers to combine high productivity and shade-tree based sustainability, appears to depend on their capacity to invest as it is mainly farmers in high-quality coffee growing regions who are achieving this combination. Whereas, the farmers in less optimal coffee growing areas, who would benefit most from increased productivity and the ecosystem services from well-developed shade, lack the capacity to invest, possibly due to lower coffee prices. Resolving this would require higher levels of financial and technical support to farmers in these regions to enable investment in sustainable intensification of coffee production to increase both their economic and environmental resilience. Overall, it is important that coffee policies recognize that shaded coffee agroforestry systems are compatible with high productivity, and low productivity can occur under both excess and inadequate shade as a result of farmers lack of capacity to optimally invest.
Data Availability Statement
The raw data supporting the conclusions of this article will be made available by the authors, but anonymity of respondents will be kept.
Author Contributions
JH is Principal Investigator of the research and lead author. RC and GL are co-investigators of the research. FC and BL supported the statistical and economic analysis. SC and AO supported data collection and analysis. SG-M and EL supported data collection and processing. All authors contributed to the article and approved the submitted version.
Funding
This research was funded by UK Research and Innovation Biotechnology and Biological Sciences Research Council (UKRI/BBSRC), from the Global Challenges Research Fund (GCRF) under the Agri-systems research to enhance rural livelihoods in developing countries programme, Grant No. BB/S01490X/1.
Conflict of Interest
The authors declare that the research was conducted in the absence of any commercial or financial relationships that could be construed as a potential conflict of interest.
Acknowledgments
We acknowledge the institutional support of the National Coffee Association of Guatemala (ANACAFE) and the Institute for Coffee in Costa Rica (ICAFE), as well as the many coffee farmers who gave their time to enable us to conduct this research.
Supplementary Material
The Supplementary Material for this article can be found online at: https://www.frontiersin.org/articles/10.3389/fsufs.2021.645958/full#supplementary-material
References
Aerts, R., Hundera, K., Berecha, G., Gijbels, P., Baeten, M., Van Mechelen, M., et al. (2011). Semi-forest coffee cultivation and the conservation of Ethiopian Afromontane rainforest fragments. For. Ecol. Manage. 261, 1034–1041. doi: 10.1016/j.foreco.2010.12.025
Anil Kumar, N. P., Saleem Khan, A. I. K., and Balakrishnan, V. (2018). “Coffee, climate and biodiversity: understanding the carbon stocks of the shade coffee production system of India,” in Handbook of Climate Change and Biodiversity, eds W. Leal Filho, J. Barbir, R. Preziosi (Berlin: Springer), 113–134.
Bakermans, M. H., Rodewald, A. D., Vitz, A. C., and Rengifo, C. (2012). Migratory bird use of shade coffee: THE role of structural and floristic features. Agrofor. Syst. 85, 85–94. doi: 10.1007/s10457-011-9389-0
Bergamo, T. A., Reichardt, K., Favarin, J. L., Oliveira, O., Silva, A. L., and Timm, L. C. (2008). Fertilizer 15N balance in a coffee cropping system: a case study in Brazil. R. Bras. Ci. Solo. 32, 1459–1469. doi: 10.1590/S0100-06832008000400010
Bhattarai, S., Alvarez, S., Gary, C., Rossing, W., Tittonell, P., and Rapidel, B. (2017). Combining farm typology and yield gap analysis to identify major variables limiting yields in the highland coffee systems of Llano Bonito, Costa Rica. Agric. Ecosyst. Environ. 243, 132–142. doi: 10.1016/j.agee.2017.04.016
Boreux, V., Vaast, P., Madappa Lavin., P, Cheppudira Kushalappa, G., Garcia, C., and Ghazou, J. (2016). Agroforestry coffee production increased by native shade trees, irrigation, and liming. Agron. Sustain. Dev. 36:42. doi: 10.1007/s13593-016-0377-7
Cannavo, P., Harmand, J.-M., Zeller, B., Vaast, P., Ramirez, J. E., and Dambrine, E. (2013). Low nitrogen use efficiency and high nitrate leaching in a highly fertilized Coffea arabica–Inga densiflora agroforestry system: a 15N labeled fertilizer study. Nutr. Cycl. Agroecosyst. 95, 377–394. doi: 10.1007/s10705-013-9571-z
Cannavo, P., Sansoulet, J., Harmand, J. M., Siles, P., Dreyer, E., and Vaast, P. (2011). Agroforestry associating coffee and Inga densiflora results in complementarity for water uptake and decreases deep drainage in Costa Rica. Agric. Ecosyst. Environ. 140, 1–13. doi: 10.1016/j.agee.2010.11.005
Cerda, R., Allinne, C., Gary, C., Tixier, P., Harvey, C. A., Krolczyk, L., et al. (2017). Effects of shade, altitude and management on multiple ecosystem services in coffee agroecosystems. Eur. J. Agronomy 82, 308–319. doi: 10.1016/j.eja.2016.09.019
Cerda, R., Avelino, J., Harvey, C. A., Gary, C., Tixier, P., and Allinne, C. (2020). Coffee agroforestry systems capable of reducing disease-induced yield and economic losses while providing multiple ecosystem services. Crop Protection 134:105149. doi: 10.1016/j.cropro.2020.105149
Cerda, R., Orozco-Aguilar, L., Sepúlveda, N., Ordoñez, J., Carreño-Rocabado, G., Amores, F., et al. (2019). “Tropical agroforestry and ecosystem services: trade-off analysis for better design strategies,” in Agroforestry for Sustainable Agriculture, eds M. R. Mosquera-Losada and R. Prabhu, (Cambridge, UK: Burleigh Dodds Science Publishing), 467-509
Chain-Guadarrama, A., Martínez-Salinas, A., Aristizabal, N., and Ricketts, T. (2019). Ecosystem services by birds and bees to coffee in a changing climate: a review of coffee berry borer control and pollination. Agric. Ecosyst. Environ. 280, 53–67. doi: 10.1016/j.agee.2019.04.011
Di Rienzo, J. A., Casanoves, F., Balzarini, M. G., Gonzalez, L., Tablada, M., Robledo, C. W., InfoStat versión. (2020). Centro de Transferencia InfoStat, FCA, Universidad Nacional de Córdoba, Argentina. Available online at: http://www.infostat.com.ar
Estrada-Carmona, N., Martínez-Salinas, A., Declerck, F., Vilchez, S., and Garbach, K. (2019). Managing the farmscape for connectivity increases conservation value for tropical bird species with different forest-dependencies. J. Environ. Manage. 250:109504. doi: 10.1016/j.jenvman.2019.109504
Farfan, V. F., and Mestre M, A. (2004). Respuesta del cultivo de café en un sistema agroforestal a la aplicación de fertilizantes. Cenicafe 52, 161–174. doi: 10.1007/s10457-011-9392-5
Fick, S. E., and Hijmans, R. J. (2017). WorldClim 2: new 1km spatial resolution climate surfaces for global land areas. Int. J. Climatol. 37, 4302–4315. doi: 10.1002/joc.5086
Gobbi, J. A. (2000). Is biodiversity-friendly coffee financially viable? An analysis of five different coffee production systems in western El Salvador. Ecol. Econ. 33, 267–281. doi: 10.1016/S0921-8009(99)00147-0
Greenberg, R. P., Bichier, A. C., and Angon, R. R. (1997). Bird populations in shade and sun coffee plantations in Central Guatemala. Conserv. Biol. 11, 448–459. doi: 10.1046/j.1523-1739.1997.95464.x
Haggar, J., Barrios, M., Bolaños, M., Merlo, M., Moraga, P., Munguia, M., et al. (2011). Coffee agroecosystem performance under full sun, shade, conventional and organic management regimes in Central America. Agroforestry Systems 82, 285–301
Haggar, J., Medina, B., Aguilar, R.M., and Munoz, C. (2013). Land use change on coffee farms in southern guatemala and its environmental consequences. Environ. Manage. 51, 811–823. doi: 10.1007/s00267-013-0019-7
Haggar, J., Soto, G., Casanoves, F., and Virginio, E. de M. (2017). Environmental-economic benefits and trade-offs on sustainably certified coffee farms. Ecol. Indic. 79, 330–337. doi: 10.1016/j.ecolind.2017.04.023
Haggar, J. P., and Ewel, J. J. (1997). Primary productivity and resource partitioning in model tropical ecosystems. Ecology 78, 1211–1221. doi: 10.1890/0012-9658(1997)078[1211:PPARPI]2.0.CO;2
Hergoualc'h, K., Blanchart, E., Skiba, U., Hénault, C., and Harmand, J. M. (2012). Changes in carbon stock and greenhouse gas balance in a coffee (Coffea arabica) monoculture versus an agroforestry system with Inga densiflora, in Costa Rica. Agric. Ecosyst. Environ. 148, 102–110. doi: 10.1016/j.agee.2011.11.018
Hundera, K., Aerts, R., Fontaine, A., Van Mechelen, M., Gijbels, P., Honnay, O., et al. (2013). Effects of coffee management intensity on composition, structure, and regeneration status of Ethiopian moist evergreen afromontane forests. Environ. Manage. 51, 801–809. doi: 10.1007/s00267-012-9976-5
ICAFE (2019). Precios de liquidación final cosecha 2018-2019. Instituto de Café de Costa Rica. Available online at: http://www.icafe.cr/sector-cafetalero/liquidacion-final-beneficio/ (accessed June 17, 2020).
Jaramillo, J., Setamou, M., Muchugu, E., Chabi-Olaye, A., Jaramillo, A., Mukabana, J., et al. (2013). Climate change or urbanization? Impacts on a traditional coffee production system in East Africa over the last 80 years. PLoS ONE 8:e51815. doi: 10.1371/journal.pone.0051815
Jezeer, R. E., Santos, M. J., Boot, R. G. A., Junginger, M., and Verweij, P. A. (2018). Effects of shade and input management on economic performance of small-scale Peruvian coffee systems. Agric. Syst. 162, 179–190. doi: 10.1016/j.agsy.2018.01.014
Jha, S., Bacon, C. M., Philpott, S. M., MÉndez, V. E., LÄderach, P., and Rice, R. A. (2014). Shade coffee: update on a disappearing refuge for biodiversity. Bioscience 64, 416–428. doi: 10.1093/biosci/biu038
Lernoud, J., Potts, J., Sampson, G., Voora, V., Willer, H., and Wozniak, J. (2018). The State of Sustainable Markets 2018. Statistics and Emerging Trends. Geneva: International Trade Centre (ITC), International Institute for Sustainable (IISD); Research Institute of Organic Agriculture (FiBL).
Martínez-Salinas, A., Declerck, F., Vierling, K. T., Vierling, L. A., Legal, L., Vilchez, S., et al. (2016). Bird functional diversity supports pest control services in a Costa Rican coffee farm. Agric. Ecosyst. Environ. 235, 277–288. doi: 10.1016/j.agee.2016.10.029
Meylan, L., Gary, C., Allinne, C., Ortiz, J., Jackson, L., and Rapidel, B. (2017). Evaluating the effect of shade trees on provision of ecosystem services in intensively managed coffee plantations. Agric. Ecosyst. Environment 245, 32–42. doi: 10.1016/j.agee.2017.05.005
Moguel, P., and Toledo, V. M. (1999). Biodiversity conservation in traditional coffee systems of Mexico. Conserv. Biol. 13, 11–21. doi: 10.1046/j.1523-1739.1999.97153.x
Murrieta-Galindo, R., González-Romero, A., López, F., and Parra-Olea, G. (2013). Coffee agrosystems: an important refuge for amphibians in central Veracruz, Mexico. Agroforestry Systems 87, 767–779. doi: 10.1007/s10457-013-9595-z
Nesper, M., Kueffer, C., Krishnan, S., Kushalappa, C. G., and Ghazoul, J. (2017). Shade tree diversity enhances coffee production and quality in agroforestry systems in the Western Ghats. Agric. Ecosyst. Environ. 247, 172–181. doi: 10.1016/j.agee.2017.06.024
Noponen, M. R. A., Haggar, J. P., Edwards-Jones, G., and Healey, J. R. (2013). Intensification of coffee systems can increase the effectiveness of REDD mechanisms. Agric. Syst. 119, 1–9. doi: 10.1016/j.agsy.2013.03.006
Pelupessy, W., and Díaz, R. (2008). Upgrading of lowland coffee in Central America Wim. Agribusiness 24, 119–140. doi: 10.1002/agr.20150
Philpott, S. M., Arendt, W. J., Armbrecht, I., Bichier, P., Diestch, T. V., Gordon, C., et al. (2008). Biodiversity loss in Latin American coffee landscapes : review of the evidence on ants, birds, and trees. Conserv. Biol. 22, 1093–1105. doi: 10.1111/j.1523-1739.2008.01029.x
R Core Development Team (2020). R: A language and environment for statistical computing (Version 4.0.3). Vienna, Austria: R Foundation for Statistical Computing.
Rice, R. A. (2008). Agricultural intensification within agroforestry: the case of coffee and wood products. Agric. Ecosyst. Environ. 128, 212–218. doi: 10.1016/j.agee.2008.06.007
Rich, P. M., Wood, J., Vieglais, D. A., Burek, K., and Webb, N. (1999). Hemiview User Manual. Version 2.1. Cambridge, UK: Delta-T Devices Ltd..
Samper, M. K. (1999). “Trayectoria y viabilidad de las caficultoras centroamericanas,” in Desafío de La Caficultura En Centroamérica, (San José, CA: IICA/PROMECAFE/CIRAD), 1–68.
Schnabel, F., de Melo Virginio Filho, E., Xu, S., Fisk, I. D., Roupsard, O., and Haggar, J. (2018). Shade trees: a determinant to the relative success of organic versus conventional coffee production. Agrofor. Syst. 92, 1535–1549. doi: 10.1007/s10457-017-0100-y
Soto, G., Haggar, J., Le Coq, J. F., Gonzalez, C., Soto, A., Casanoves, F., et al. (2011). Environmental and socioeconomic impact of organic coffee certification in Central America as compared with other certification seals. 17th IFOAM Org. World Congr. 1–4.
Soto-Pinto, L., Perfecto, I., Castillo-Hernandez, J., and Caballero-Nieto, J. (2000). Shade effect on coffee production at the northern Tzeltal Zone of the state of Chiapas, Mexico. Agric. Ecosyst. Environ. 80, 61–69. doi: 10.1016/S0167-8809(00)00134-1
Souza, H. N., de, de Goede, R. G. M., Brussaard, L., Cardoso, I. M., Duarte, E. M. G., Fernandes, R. B. A., et al. (2012). Protective shade, tree diversity and soil properties in coffee agroforestry systems in the Atlantic Rainforest biome. Agric. Ecosyst. Environ. 146, 179–196. doi: 10.1016/j.agee.2011.11.007
Vaast, P., Martínez, M., Boulay, A., Castillo, B. D., and Harmand, J.-M. (2015). “Diversifying Central American coffee agroforestry systems via revenue of shade trees,” in Economics and Ecology of Diversification, eds F. Ruf, G. Schroth, (Springer), 271–281.
Keywords: coffee agroforestry, ecosystem services, leaf area index, shaded coffee, sustainable agricultural intensification
Citation: Haggar J, Casanoves F, Cerda R, Cerretelli S, Gonzalez-Mollinedo S, Lanza G, Lopez E, Leiva B and Ospina A (2021) Shade and Agronomic Intensification in Coffee Agroforestry Systems: Trade-Off or Synergy? Front. Sustain. Food Syst. 5:645958. doi: 10.3389/fsufs.2021.645958
Received: 24 December 2020; Accepted: 30 March 2021;
Published: 26 April 2021.
Edited by:
Ana Isabel Moreno-Calles, Universidad Nacional Autónoma de México, MexicoReviewed by:
Ivette Perfecto, University of Michigan, United StatesEk Del-Val, National Autonomous University of Mexico, Mexico
Copyright © 2021 Haggar, Casanoves, Cerda, Cerretelli, Gonzalez-Mollinedo, Lanza, Lopez, Leiva and Ospina. This is an open-access article distributed under the terms of the Creative Commons Attribution License (CC BY). The use, distribution or reproduction in other forums is permitted, provided the original author(s) and the copyright owner(s) are credited and that the original publication in this journal is cited, in accordance with accepted academic practice. No use, distribution or reproduction is permitted which does not comply with these terms.
*Correspondence: Jeremy Haggar, ai5wLmhhZ2dhckBncmVlbndpY2guYWMudWs=