 Bert Dijkink
 Erik Esveld
 Martijntje Vollebregt
- Wageningen Food and Biobased Research, Wageningen, Netherlands
The milk for a factory in Sululta (Ethiopia) is currently collected at ambient temperature. To increase milk production, the sourcing must be extended. This requires the collection of not only the morning milk but also the evening milk from smallholder farms. To accomplish this, the collection of milk from small farmers has to be improved, whereby the milk quality has to be assured with reasonable cost and environmental impact. A model predicting milk rejection was developed based on initial contamination and time and temperature profiles. With this model, different cooling scenarios we reevaluated regarding the expected effectiveness of reducing the rejection rate during collection. Second, cost estimations were made to implement the scenarios to collect morning and evening milk from smallholder farms. A third criterion was greenhouse gas (GHG) emissions per litre of collected milk. Finally, the feasibility of the scenarios was assessed in terms of technical, practical, and economic aspects. Including both quality and economics, the best scenario can be expected from a cooling centre where farmers bring their milk twice a day, except there are signals that the farmers would not be willing to deliver the evening milk to the centre at night. In that case, an additional collecting system would be needed to increase the milk supply. This would result in higher collection costs and an increased risk of milk rejection at the factory gate. Furthermore, this would reduce the value of the chilling centre, as in that case it would be better to deliver the milk directly to the factory. Both scenarios would increase GHG emissions compared with the current situation. Only the use of an off-grid solar power-driven cooling system at the farms would reduce the GHG emissions. However, this solution is less feasible economically. The applied combination of a simple model, economic analysis and the effect on GHG emissions gives valuable information on the effectiveness and limitations of different cooling scenarios for the milk factory. It can help to successfully apply a scenario for increasing the milk supply.
Introduction
Farming communities in developing countries often lack the infrastructure to sufficiently safeguard their perishable produce from deterioration before it can be sold. Depending on the local settings, completely different technical, logistic, or infrastructure options might be proposed to prevent deterioration. Specifically for milk, which is obviously prone to rapid bacterial spoilage when left uncooled, several interventions have been suggested and implemented over the years to improve the situation. Notably in Kenia and Ethiopia, various NGOs have installed refrigeration units at collection points near central roads where electricity is available. Alternatively, various off-grid cooling options have been technically developed to prevent spoilage for part of the milk production already at the farms.
The goal of this study was to determine the best cooling scenario to prevent milk rejection and increase the milk collection potential for a milk factory in Ethiopia. This paper uses a combination of quality models with locally realistic logistic scenarios as a practical way to assess the feasibility of various options. The analysis addresses four common criteria when evaluating the implementation of these scenarios: (1) the effect on the potential yield of good quality milk; (2) the cost-effectiveness; (3) the effect on total greenhouse gas (GHG) emissions; and (4) the technical feasibility and practical and economic consequences. This way of comparing scenarios can hopefully contribute to better implementation of interventions that can genuinely improve the lives of smallholder farmers and stimulate economic growth for them.
Current Situation in Central Ethiopia
In Ethiopia, 98% of the milk is produced by smallholder farmers (Getahun et al., 2019). On average, in peri-urban areas, farmers possess 3.8 cows, which produce about 17 L of milk per day (Vernooij et al., 2010). Part of this production is collected and transported to milk factories, where the milk is pasteurised or further processed into yoghourt, butter, or cheese for upper-class consumers in larger cities.
One of these factories is the Zagol milk factory, located in Sululta, a 1-h-drive north of Addis Ababa, the capital of Ethiopia. The factory has a maximum pasteurisation capacity of 1,000 L/h, but it currently processes only 2,000–3,000 L a day.
The milk and other dairy products from the factory are sold in Addis under the brand name Zagol. According to the factory, the product demand is sufficiently large to sell more than the current production allows for. The challenge for the factory, therefore, is to increase its supply of milk by improving the milk collection process.
Currently, the supply of the milk to the factory comes from three sources. First, the factory itself owns a farm with approximately 100 cows; it also purchases milk from a neighbouring farm of similar size on a daily basis. These two farms together supply about half of the total volume. The other half, about 1,000 L/day, is collected from smallholder farms in the area. This collection used to be done by independent collectors only, but recently, the Zagol factory started its own road collection between Chancho and Derba along with a cooperative. A further increase in the supply of milk by the smallholder farms can be expected provided the reliability of supply can be ensured and the milk quality guaranteed.
The cows of the smallholder farms are milked twice a day, typically around 18:00 in the evening and 6:00 in the morning. In the current situation, normally, only the morning milk is brought to one of several assigned collection points along the road by the milk factory. At the collection points (Figure 1), milk supplied by each smallholder farmer is tested for freshness with an alcohol flocculation test (Sommer and Binney, 1923). For the test, a 5-ml sample of milk is taken and mixed with 5 ml of 70% ethanol solution in a specialised device that is easy to use on the field. If the tested milk has good quality, there will be no coagulation, clotting, or precipitation.
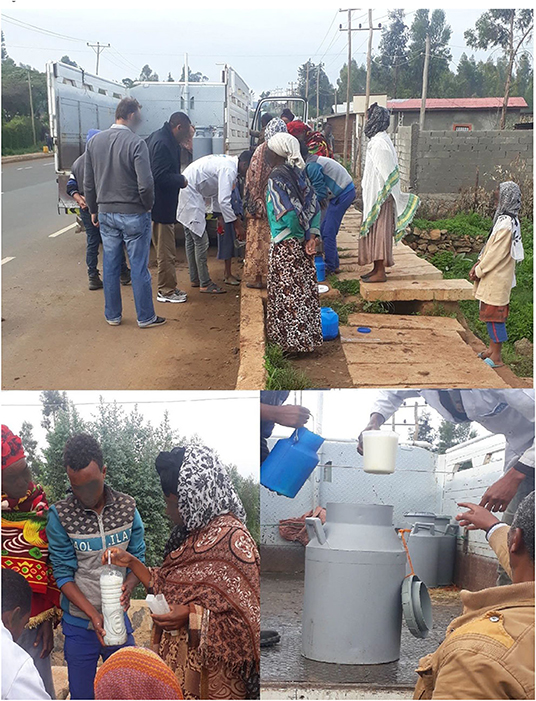
Figure 1. Current situation: collection of morning milk on the road between Derba and Sululta where the Zagol milk factory is situated. Photos: author.
After the offered milk is approved, the volume is measured, and it is gathered in 25 L plastic cans and loaded on an open truck. When all the milk is collected, the truck returns to the factory, where the milk can be tested for a second time before being chilled or processed. Normally, this second test is only done when the milk is from independent milk collectors.
The storage at smallholder farms, the collection of milk and the transport to the factory are commonly done at ambient temperature, which ranges between 5 and 23°C in Sululta. As a result, only the morning milk is collected, because only then is the time between milking and arrival at the factory short enough to prevent quality loss. Nevertheless, a part of the milk arriving at the factory is still not suitable for further production and will be rejected due to its low quality.
Without expanding the sourcing area, collecting the evening milk from smallholder farms would be the easiest way to increase the milk supply for the factory. Such development would also increase the income of smallholder farms by generating more sales possibilities for their surplus raw milk. A complicating factor in Ethiopia is the regular fasting periods, when consumption of milk is not allowed for the majority of the population. In these periods, the demand for milk products is very low at local markets within walking distance, resulting in an oversupply. In Addis, this fluctuation is smaller; therefore, especially in these periods, it would be beneficial if the morning milk as well as the evening milk could be delivered to the factory. If there is an efficient milk-to-factory supply chain, the large price drops during fasting periods could potentially be avoided. In August 2018, the milk price for farmers was about US$0.50/L during the non-fasting period and US$0.33/L in the fasting period. Also, fermented products such as ayib are subject to the same price reduction (Asresie et al., 2018).
Scenarios
To rank the impact of various cooling and collection strategies, we consider seven scenarios that could help to reduce the milk rejection rate. These are depicted in Figure 2 as a sequence of actions.
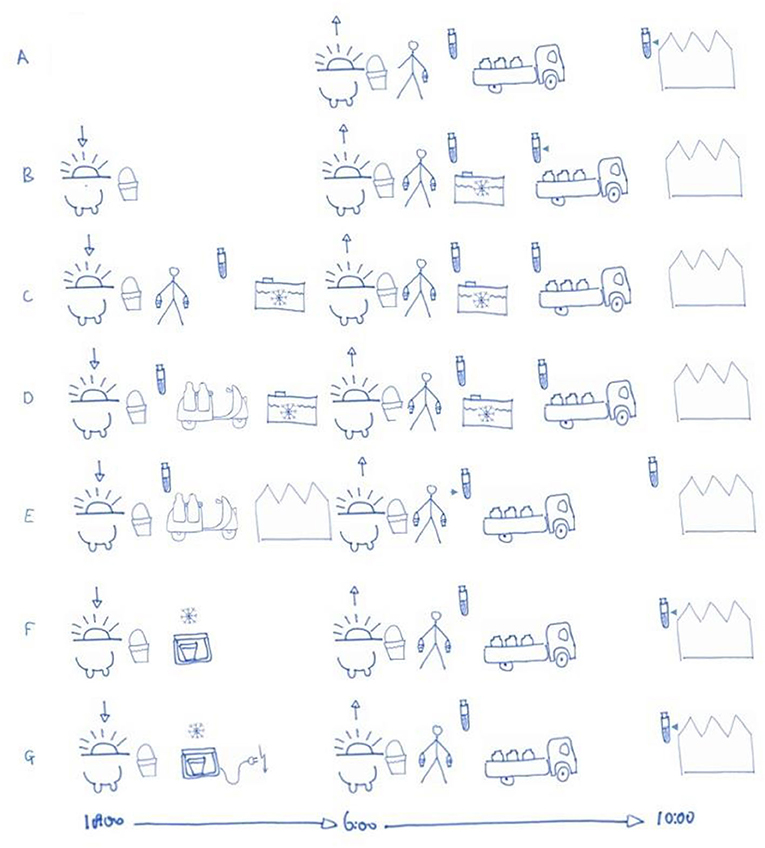
Figure 2. Scenarios to increase supply and improve raw milk quality at factory delivery. (A) Current situation; (B) chilling centre where evening and morning milk is delivered together in the morning; (C) evening milk is brought separately to the chilling centre by farmers; (D) evening milk is collected separately at farms and brought to the chilling centre; (E) evening milk is collected separately at farms and brought directly to the factory; (F) evening milk is cooled with off-grid coolers at farms and delivered with morning milk; (G) evening milk is cooled with grid-connected refrigerators at farms and delivered together with morning milk.
Scenario A is the reference (current) situation. Scenarios B, C, and D use a chilling centre that is strategically located where farmers can deliver milk. During this study, a chilling centre was under construction in Derba with two separate tanks to provide separate storage of evening and morning milk, double walls for cooling and an inside mixer to reach high cooling rates (Moffat et al., 2016). Upon delivery of the milk, a worker at the chilling centre will cheque its quality. In this approach, a truck from the factory collects the milk from the cooling tanks on a daily basis, e.g., 20-L plastic milk cans, as is the current practise. Before the milk is loaded onto the truck, another quality test can be performed. The time for this collection is less critical, as the milk is already cold, contrary to the current situation.
In scenario B, farmers bring morning and evening milk together to the chilling centre. They keep the evening milk uncooled during the night at the farm. In scenarios C and D, the milk is collected twice a day, directly after milking. In scenario C, farmers bring the milk to the chilling centre themselves, and in scenario D, scooters are used to transport the milk from the farms. In the latter case, the milk is tested and handled by the collector on the scooter.
Scenario E is a combination of scenarios A and D. The morning milk is collected as is currently done, and the evening milk is collected by scooter directly from the farmers. There is no chilling centre involved, and the collection is therefore completely under the control of the factory.
In scenarios F and G, the evening milk is cooled as well, although not in a chilling centre, but at the farm overnight. In the morning, the cold evening milk can be offered for collection at the roadside together with the fresh morning milk. Since smallholder farms are currently not connected to the power grid, the cooling unit has to operate off-grid (F) or the farm has to be connected to the power grid (G). For off-grid operation, two technological options are available for milk chillers, based on solar power (Foster, 2015) or biogas (van der Velde and Belkhir, 2016). Solar power has the complication that the energy is only available during the daytime, while the energy demand for cooling will occur at night. Therefore, cooling for that option involves ice packs inside an insulated box. The energy produced during the day will be applied to freeze the ice packs, which are subsequently used for cooling the milk at night. For the option based on biogas, the required biogas can be locally produced from, e.g., cow dung and used whenever gas is needed for cooking or cooling.
In the last scenario (G, connexion to the power grid), standard refrigerators can be used instead of off-grid chillers at the farms. This option requires that all farmhouses are connected to the power grid. Currently, the farms are not connected to the power grid, although power lines are available beside the tarred road.
Scenario Evaluation
To evaluate each scenario's effect on milk quality, the cost-effectiveness of practical implementation and the effect on GHG emissions are calculated.
In practise, milk quality is assessed by an alcohol flocculation test, a fast method to determine if acidification of the milk has started. Acidification will occur by the growth of lactic acid bacteria that contaminate the milk during milking. Fresh milk has an initial pH of 6.7, and the alcohol test is positive if the pH is 6.4 or lower and the milk is rejected.
Within the framework of this project, Wageningen UR developed a model that determines the lactic acid growth in milk. The model estimates when the milk will be rejected at the collection point or factory gate as a function of initial contamination and time–temperature history. The scenarios were evaluated with the model, showing the capability of reducing the rejection rate to an acceptable level to create a more efficient milk collection chain.
Improving the milk supply will require investments, labour and the use of utilities, and thus an increase in the raw milk price for the factory, which will have to be compensated by the improved capacity utilisation.
The effect on milk quality, possibilities for increasing the supply and the cost of implementation determine the feasibility of the different scenarios.
Dairy accounts for 6.8% of total FLW worldwide and 10.2% of the associated GHG emissions (Guo et al., 2020). This makes saving in the dairy sector relevant to reducing GHG emissions on a worldwide basis.
However, in Ethiopia, rejected milk is not thrown away but used for the production of fermented local products such as ergo, ayib, butter and whey (Andualem and Geremew, 2014). For this reason, this milk cannot be seen as waste. In Ethiopia, only about 1.6% of milk is wasted, mainly by spillage (Lore et al., 2005). In this light, it is to be expected that the GHG emissions related to collecting milk will increase rather than decrease, although in favour of economic growth and improved product quality.
Quality Model Method and Parameters
Milk Spoilage Model
The model estimates the pH of milk over time and thus whether it will pass the alcohol test. When the pH is 6.4 or lower, the milk will fail the alcohol test and be rejected. The model describes two processes: the temperature-dependent growth of lactic acid producing bacteria (LAB) and the production of lactic acid.
Growth Model
For a given temperature, the growth rate of lactic acid-producing bacteria is exponential. Only at high concentrations of micro-organisms [expressed in colony forming units per millilitre (CFU/ml)] will the growth rate decrease because of diminishing resources. The change over time in the amount of lactic acid-producing bacteria is given by
where μT is the specific maximum growth rate (h−1); N is the concentration of LAB (CFU/ml); t is the time (h); and Nmax is the maximum concentration of LAB (CFU/ml). The initial contamination rate is indicated by t = 0, N = N0.
In microbiological inoculation studies, usually, an initial period of no or retarded growth is observed right after inoculation, which is known as the lag phase. This lag phase exists because the micro-organisms are not yet adapted to the matrix and temperature conditions (Dalgaard and Koutsoumanis, 2001). However, in this study, the lag phase was not taken into account since the milk is contaminated directly during milking, as the bacteria are present in the equipment and surroundings and are therefore expected to be adapted to the milk.
To estimate the growth rate at different temperatures, the Ratkowsky equation was used (Ratkowsky et al., 1982):
which was rewritten as:
where μ20 is the maximum specific growth rate at 20°C (h−1); T is the temperature (°C); and Tmin is the temperature when the growth rate is mathematically zero (°C). Below Tmin, the equation is not valid.
Acidification Model
We adopted a model that predicts the production of lactic acid depending on the growth and maintenance of the bacteria as developed by Luedeking and Piret (1959):
where LA is the production of lactic acid (g/ml), mu is the cell weight (g/CFU) and the two acidification parameters are growth-associated production, α (gLA/gbiomass), and non-growth production; β (gLA/gbiomass/h).
The pH depends on the amount of lactic acid and the buffering capacity of the milk, which in turn depends on the protein content. The experimentally fitted relation is
With 0.48 g/L lactic acid produced, the milk reaches a pH of 6.4, which is the threshold value for passing the test for milk quality.
Thermal Model
To calculate the milk temperature, the following heat transfer equation is used:
where k is the effective cooling rate coefficient (h−1); Tmilk is the milk temperature (°C); and Tambient is the temperature of the surrounding environment (°C). We assume that the milk temperature is homogeneous. The cooling rate coefficient k and ambient temperature differ for different stages in the scenarios.
Rejection Rate
The model (f) can calculate for initial LAB contamination and expected milk pH at any time in a given scenario.
Numerically, the inverse model (g) can also be determined, that is, the initial LAB contamination required to reach a certain pH at a given time for a given scenario. For the critical pH of 6.4 at 8:00 (roadside collection) or 10:00 (arrival at factory), we can thus calculate the critical initial LAB contamination in the fresh milk for each scenario.
If the actual N0 of a single batch is higher, then the product will be rejected by the test later on. Since the actual (cumulative) distribution of the initial LAB contamination, CDF(N0), can be derived from Ethiopian studies, we know the quantile corresponding to the critical level, and thus the expected milk rejection rate for a given scenario.
Model Parameters
Model Bacterial Growth Parameters
Different types of lactic acid bacteria are responsible for the acidification of milk. From samples of ergo, a traditional fermented milk in Ethiopia, more than 100 strains of lactic acid bacteria belonging to the genera Lactococcus, Lactobacillus, Enterococcus, Streptococcus, Leuconostoc, and Pediococcus were isolated (Yoneya et al., 1999; Assefa et al., 2008). Since this traditional natural fermentation is commonly applied at Ethiopian farms, it is assumed that the natural lactic acid-producing contamination flora in the raw milk will be mainly from these species. Since the exact strain of lactic acid bacteria causing acidulation is not known and will differ, the growth model is based on a standard commercial culture of Christian Hansen (Hørsholm, Denmark), Fresco culture DVS 1010, consisting of Lactococcus lactis subsp. lactis, L. lactis subsp. cremoris and Streptococcus thermophilus. With data of Fresco culture DVS 1010 in milk from Acai et al. (2015), the Ratkowsky equation parameters were fitted: Tmin = 1.27°C, μ20 = 0.524 h−1, correlation coefficient 99.6%. It is known that the Ratkowsky growth model is inaccurate at temperatures above 37°C (Matejčeková et al., 2019), but this would not affect the model outcomes, as the temperatures in this study did not exceed this value. The growth rate is also influenced by the pH and, to a lesser extent, the lactic acid concentration (Bouguettoucha et al., 2011), but in the limited simulation range of pH 6.7 to 6.4, acidification only results in a 10% enhancement of the growth rate (Venkatesh et al., 1993; Fu and Mathews, 1999), which effect can be ignored for model simplicity.
Acidification Parameters
Luedeking and Piret (1959) determined the parameters α and β for the production of lactic acid by Lactobacillus delbrueckii through optical density (OD) measurements. For the model, the values from Luedeking were recalculated to g biomass: α = 4.44 g lactic acid/g biomass production and β = 1.11 g lactic acid/g biomass/h, with a conversion factor of 1 OD = 450.106 CFU/ml and cell weight of 1.1 × 10⁻⁹ mg/CFU (Passos et al., 1994).
The relation between lactic acid concentration and corresponding pH was determined through a titration curve of two milk samples, commercial whole milk with 3% fat and semi-skimmed milk with 1.5% fat, with a 45% lactic acid solution at ambient temperature. There was no difference between whole and semi-skimmed milk. In the pH range between 5.3 and 6.7, a second-order polynomial equation was fitted with a 99.9% correlation coefficient.
Distribution of Initial Contamination
The distribution of initial contamination levels of LAB in fresh milk is known from the study of Tegegne and Tesfaye (2017) conducted in the Gondar region of Ethiopia. Tegegne reported the total aerobic mesophilic bacteria (AMB) levels of the milk directly after milking. The LAB distribution was not reported, but can be derived under the assumption of a fixed LAB:AMB ratio, which was found to be 31% on average in Ethiopian milk by Yilma and Faye (2006) and Ashenafi (1996).
The cumulative LAB distribution based on the data of Tegegne is shown in Figure 3. It allows estimation of the rejection rate (percentage) for scenarios via the corresponding initial LAB quality threshold. Figure 3 also shows contamination data from on-farm cooling tanks (2–4°C) in Basse-Normandie, France (Mallet et al., 2012). This shows the latent improvement potential compared with standard European hygiene.
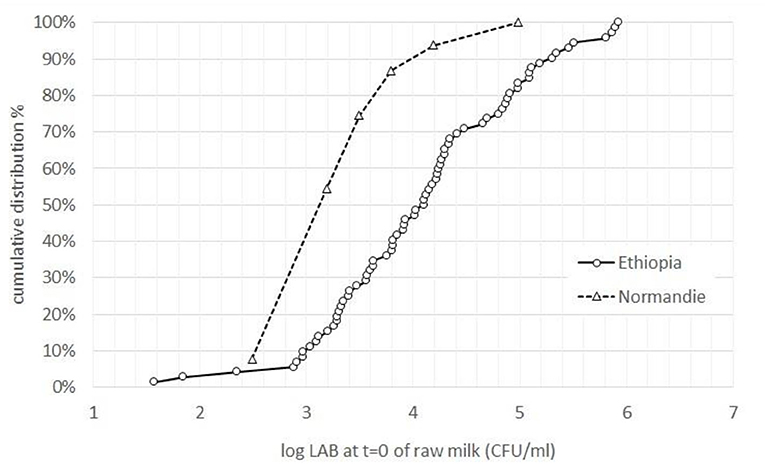
Figure 3. Estimation of contamination of LAB (log CFU/mL) in raw milk from total bacterial count collected directly from teat and milking buckets in and around Gondar, Ethiopia (Tegegne and Tesfaye, 2017), compared with data from on-farm cooling tanks (2–4°C) in Basse-Normandie, France (Mallet et al., 2012).
Effective Thermal Parameters
The practical circumstances of the milk collection chain in the different scenarios are listed in Table 1. The collection chain is described in five stages: storage on the farm, transport to the collection point, storage at the collection point, transport to the factory, and finally arrival at the factory. Between stages, the ambient temperature varies, while during each stage the ambient temperature is assumed constant.
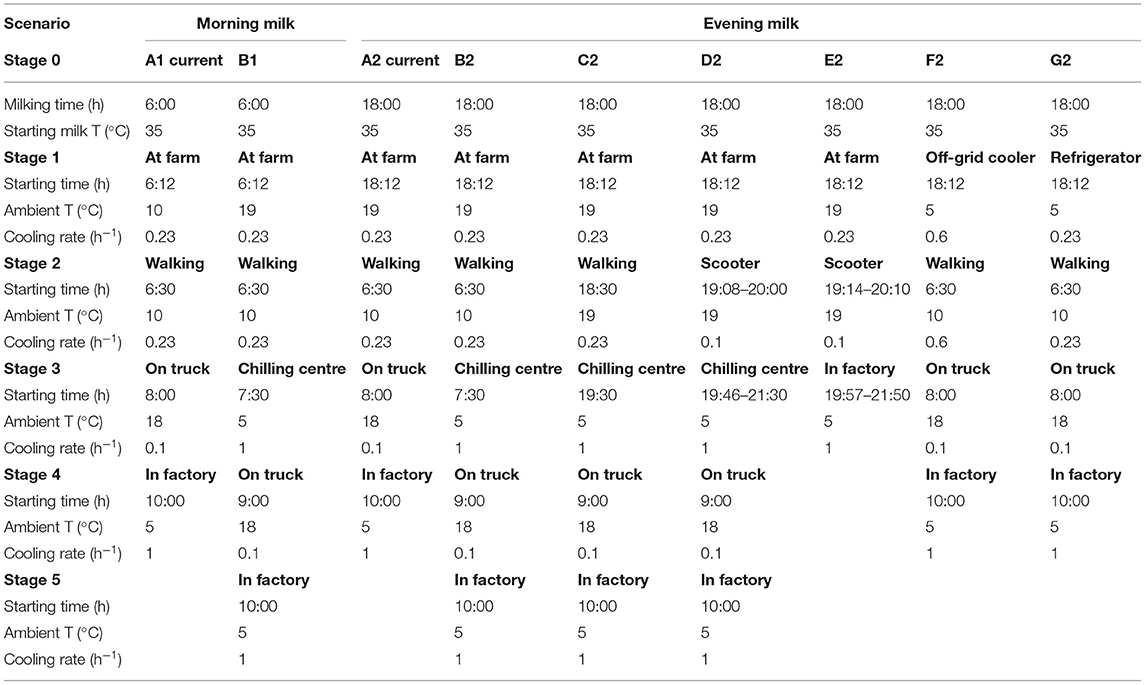
Table 1. Parameters used for scenarios.
The effective cooling rate coefficient for calculating the milk temperature at different stages for a 5-L metal jar is 0.6 h−1 (van der Velde and Belkhir, 2016) and for a 1,000-L chilling centre is 1.0 h−1 (Moffat et al., 2016). To determine the plastic jar cooling rate coefficient, a container was filled with 35°C water (mimicking the milk temperature directly after milking), closed and placed in a large room at 20°C (which provides a good indication for the ambient storage conditions). The average cooling rate coefficient of three repetitions, calculated by measuring the temperature in the container and the environment overnight, was 0.23 h−1. Using this cooling rate and the difference between the ratio of surface area to volume, the effective cooling rate coefficient for the plastic 20-L milk can was estimated at 0.1 h−1.
Validation Cheque of Model Parameters
We assessed the validity of the model of lactic acid production and corresponding pH through the data of Østlie et al. (2003) for the linear reduction over time between pH 6.7 and 5.5. For all three types of bacteria analysed by Ostlie, the simulation results, with α = 4.4 g lactic acid/g biomass production and β = 1.11 g lactic acid/g biomass/h as suggested by Luedeking, gave good pH estimation in time. With the initial contamination between log 7.7 and 8.3 CFU/ml, the estimated time to reach pH 5.5 by the model varied by no more than 0.2 h from the Ostlie's data.
Ashenafi (1996) measured the decrease in pH of Ethiopian milk at different temperatures with an initial contamination of log 5.2 CFU/ml. From these measurements, the time to reach pH 6.4 was estimated through linear regression. The effect of temperature as measured by Ashenafi was smaller than what was calculated in the model. At 20°C, the model predicts a slightly longer time for pH to reach 6.4 (11.4 h, compared with 9.9 h), whereas at higher temperatures, this time is estimated to be shorter than measured (at 37°C, the model calculated 3.2 vs. 4.8 h measured). It therefore seems that the growth rates of actual LAB present in the Ethiopian milk are less dependent on the temperature than the rates derived from the commercial culture of Christian Hansen. This means that above 25°C, in practise, a longer time is available before the test for milk quality fails than our model actually predicts.
Collection Cost Method and Parameters
Geographic Situation Analysis
To estimate the costs for the different scenarios in the collection area of the Zagol milk factory, about 20% of the current morning milk collecting area was analysed. Figure 4 shows the current supply area of the smallholder farms, study area and location of the factory with the chilling centre is constructed. The maximum walking distance to the road in the study area is 6.4 km; by the tarred road, the distance between the chilling centre and the factory is 13.9 km and from the factory to Derba is 27.7 km.
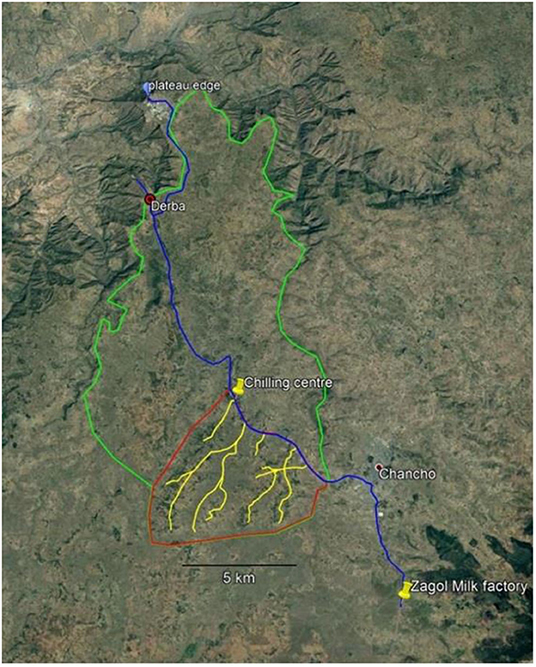
Figure 4. Situation of supply area of Zagol milk factory (location 9°15′19.66″N, 38°45′45.75″O). Red: study area, 34 km2; green: total supply area, 165 km2; blue: tarred road; yellow: main walking tracks to tarred road.
Collection Routes, Number of Rounds, and Required Number of Scooters
In scenarios D and E, the evening milk is collected directly from the farmers between 18:00 and 21:00 using scooters. In the selected area, collection rounds were laid out to cover the whole area. Contrary to the layout of the power grid, the collection round follows current larger paths visible on satellite images. Only paths that are likely to be accessible by a scooter with 100 L of milk were selected, i.e., steep slopes were avoided. The route of the scooter can be round-trip or one-way.
For every round, the total driving distance and number of courtyards along the route are determined. From these rounds, an average round-trip distance with an average number of households is determined to calculate the total driving distance and number of collectors needed to meet the pre-set collection goal. The available time for collection is set at 3 h, which is the current time between milking and road collection or factory arrival.
There are some uncertainties in the parameters in this scenario for calculating the number of scooters needed to collect the required milk. First, it is not known how many farmers on the route will be willing to sell their evening milk. Furthermore, the time needed to collect milk at the farm and the speed at which a scooter can drive on the single tracks are uncertain. We assume that the maximum carrying capacity of a scooter is 100 L.
To deal with these uncertainties, optimistic and conservative (max, min) estimations are made to calculate the required number of scooters (Table 2). For the optimistic estimation, the collection round is a one-way route, so the scooter has the same outward and return route to the farmers. At a one-way route, it is assumed that the scooter starts at the end of the route, ensuring a minimal amount of driving for each collection round. After 100 L has been collected, the scooter has to return to the chilling centre and can start collecting again at a point closer to the road. For a circular route, the collection starts on the tarred road and follows the shortest route to the tarred road when 100 L are collected. In the next trip, collection will start at the last visited farm until the whole round is completed. A one-way route has a little advantage in total kilometres compared with a circular route when the number of farmers per km is the same. Probably more important is that in the collection strategy of the one-way route, the collector drives half the distance with an empty scooter, which will increase the average driving speed.
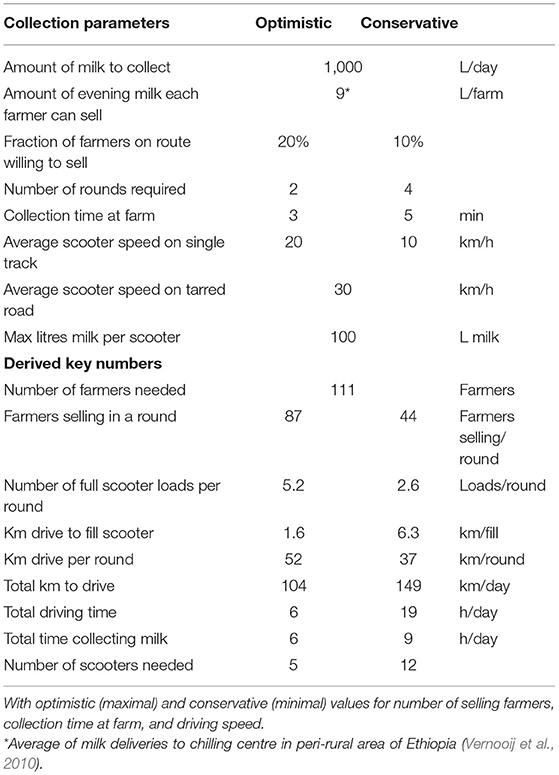
Table 2. Estimated starting points for scooter collection and derived numbers for number of collectors (scooters) and total driving distance in cooling centre scenario for collection of 1,000 L of evening milk.
Figure 5 shows the path of round 1, where a scooter is used to collect the evening milk and bring it to the chilling centre. In total, three rounds in the study area were defined with an average distance of 16.6 km.
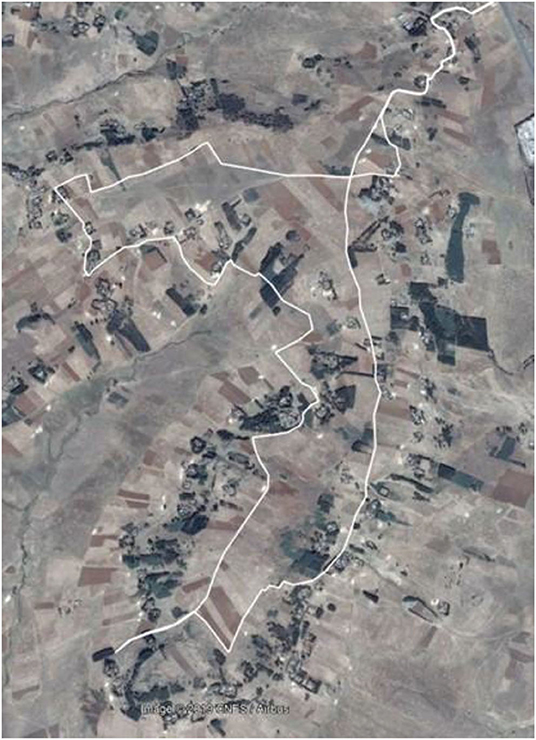
Figure 5. Satellite image of one round of three possible milk collection rounds in study area to determine driving distance. Selected route goes over single and double tracks. Rivers and steep slopes are avoided.
From the distance of the three rounds and the optimistic and conservative estimations from Table 2, the total driving distance and time to collect 1,000 L of evening milk per day are calculated (Table 5).
Utility Cost Parameters
The additional costs per collected litre of milk are calculated for the different scenarios with the prices for hardware, utilities and labour from Table 3. Although the cooling centre works on electricity, a diesel generator is also included in the investment to secure cooling capacity during power failures. To calculate energy costs, however, only the energy from electricity is taken into account.
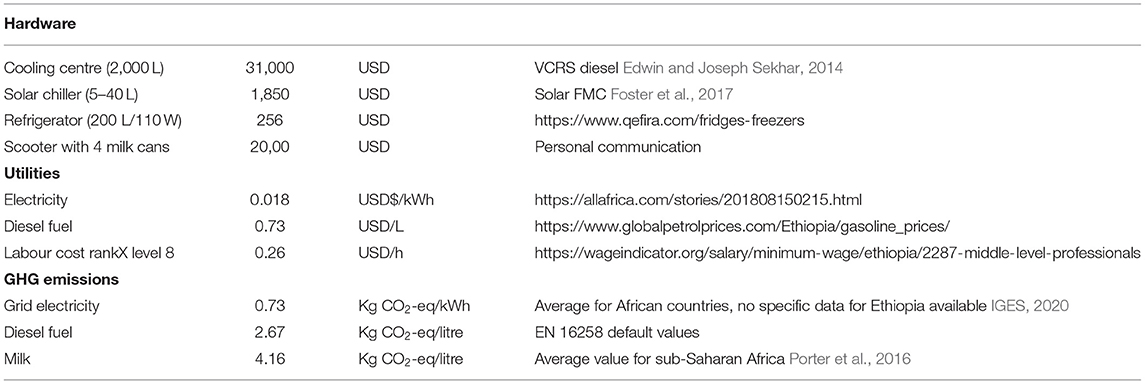
Table 3. Cost of hardware, utilities, labour, and GHG emissions for economic and environmental analyses.
A scooter for the collection of evening milk can drive 30 km on 1 L of gasoline. Home refrigerators, in the power grid extension situation, are expected to run the whole day with an average power consumption of 30 W. For off-grid chillers, the price of the 40-L solar power chiller is taken (Foster et al., 2017). The investment for the power grid extension that would be necessary when using on-farm refrigerators is not taken into account. It is assumed that a grid extension will benefit all (economic) activities and the electricity costs will cover the required investment in the grid extension. Maintenance and financing are not taken into account and depreciation time is 10 years.
Greenhouse Gas Emissions Calculation
To calculate the GHG emissions in the different scenarios, only the emissions associated with milk collection are taken into account, and not the production of hardware. The light truck that is currently used to pick up milk from the road site drives to Derba and back (55.4 km). To pick up the milk from the chilling centre, the truck has to drive 27.8 km. It is assumed that the light truck uses 0.14 L/km (Sivak and Schoettle, 2017). Depending on the scenario, this is used for transporting either 1,000 or 2,000 L of milk.
To calculate the total GHG emissions related to the milk, besides the emissions of the truck, the use of other utilities is taken into account from the cost price estimation and the CO2-eq values in Table 3.
For the off-grid cooling scenario, only the use of solar power is considered.
Results
Effects of Different Chilling Scenarios on Factory Rejection Rates
The scenarios were simulated with the parameters given in Table 1. Figure 6A shows the estimated temperature profile, LAB contamination and pH in the current situation for morning milk (scenario A1), assuming an initial LAB count of log 4 CFU/ml. The morning milk that arrives at the factory at 10:00, i.e., 4 h after milking, will not show any pH reduction. Figure 6B shows the quality development for the evening milk with the same starting contamination (scenario A2). A reduction in pH starts to be noticeable when the contamination is just below log 7. From that point, enough biomass has been developed to produce a significant amount of lactic acid. For the evening milk, this point is at around midnight (0 h) and the quality threshold of pH 6.4 is reached around 4:00 in the morning. Figure 6C shows the development of evening milk that was chilled in a refrigerator at the farm (scenario G2). The chilling of evening milk clearly delays growth, and the next morning the milk is still of sufficient quality.
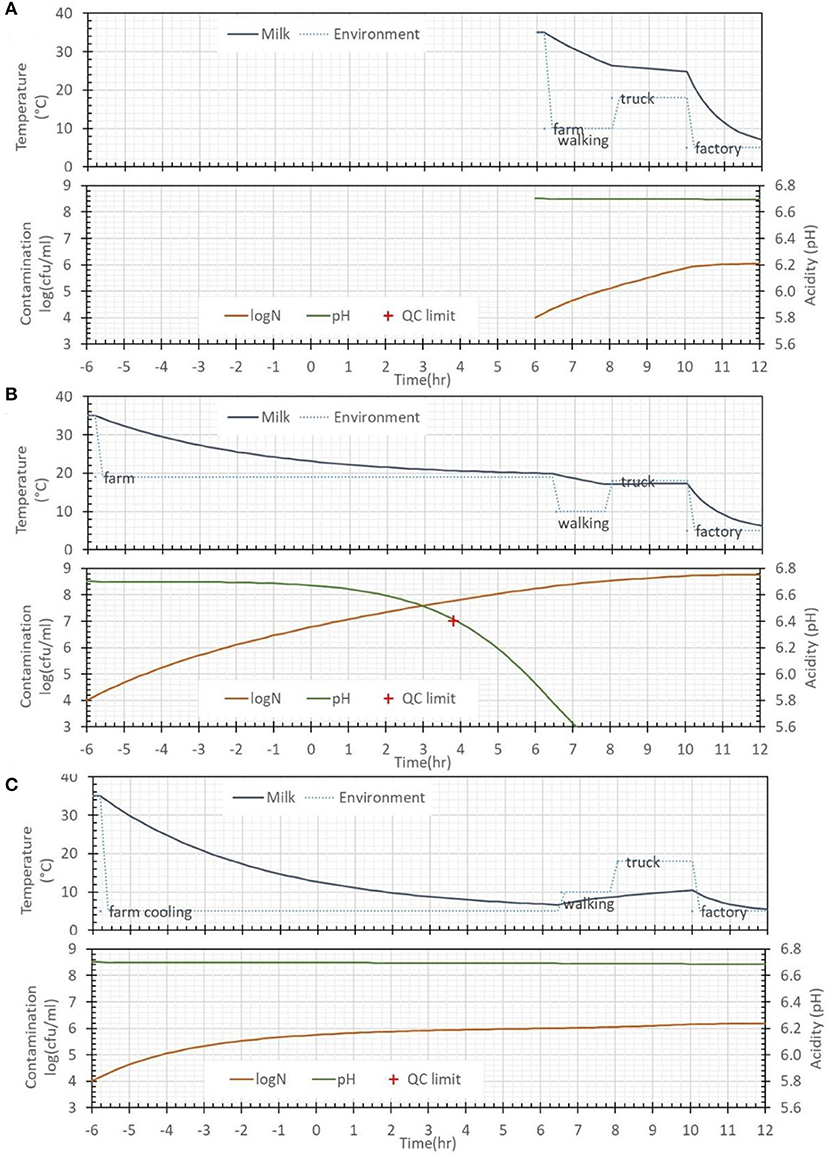
Figure 6. Examples of simulation results of LAB levels (log CFU/mL) and pH, and time to reach pH 6.4 (red cross) of raw milk assuming initial LAB contamination of log 4 CFU/mL. Time zero is midnight, time −6 is 18:00 the previous day, and time 6 is 6:00 in the morning. (A) Scenario A1, morning milk. Time to reach pH 6.4 > 24 h, contamination at factory gate 5.9 log CFU/mL. (B) Scenario A2, evening milk. Time to reach pH 6.4 takes 3.8 h, contamination at factory gate 8.7 log CFU/mL. (C) Scenario G2, refrigerator cooling at farm. Time to reach pH 6.4 > 12 h, contamination at factory gate 6.1 log CFU/mL.
With the actual distribution of the initial contamination levels from Figure 3, the expected rejection rates can be calculated at the collection point and when transferred to the factory. The results for the scenarios are presented in Table 4.
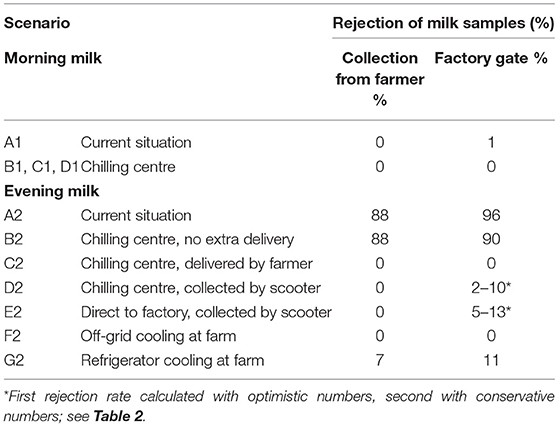
Table 4. Estimation of milk samples that do not pass alcohol test at collection from farmer and arrival at factory gate in the morning for different scenarios, with initial LAB concentrations estimated from field data from Tegegne.
Scenario A: Current situation, only morning delivery. According to the model, it is expected that all morning milk (A1) will be accepted at the collection point and only a very small amount (1%) at the factory gate. As expected in the current uncooled situation (A2), the morning collection of fresh evening milk is not feasible. Nearly all of it (88%) will already be rejected at the road collection point.
Scenario B: Morning delivery to chilling centre near the road. The evening milk (B2) is already spoiled before it reaches the chilling centre, so this is no use. The quality of morning milk (B1) will be improved, thus the rejection at the factory will be reduced 0% and the delivery time becomes less critical.
Scenario C: Extra evening delivery to chilling centre. The evening milk quality will be excellent, but a large drawback is that farmers need to supply milk twice per day.
Scenario D: Evening collection with scooters to cooling centre. This avoids the need for farmers to travel to the chilling centre with the evening milk at night. While all the milk can pass an alcohol test in the evening, 2 to 10% of batches will be rejected at the factory, depending on whether we use the optimistic or conservative parameters.
Scenario E: Evening collection with scooters to factory. In this case, a chilling centre by the road is not required, but the extra uncooled travel time to the factory will result in somewhat higher rejection rates of 5–13%.
Scenario F: Off-grid coolers at the farm. Quality wise, cooling the milk at the farm is preferred, since the evening milk will be sufficiently fast cooled before any spoilage can occur during the night, and will sustain transport to the factory with 0% projected rejection. The cooling rate for this scenario is taken from Sim Gas, producer of milk chillers. The company reported a cooling rate coefficient of 0.6 h−1 in its gas-powered chillers, which use a metal jar in combination with close wall-to-wall contact.
Scenario G: Refrigerator at the farm. A standard refrigerator connected to the power grid is, quality wise, a less-efficient solution. The cooling rate in a refrigerator with milk stored in plastic jars is much lower compared with the Sim Gas off-grid chiller. It results in a 7 and 11% rejection rate at the road site and the factory, respectively. In this way, it is comparable with scenario E with evening scooter collection.
Collection Costs in the Different Scenarios
The total investment for collecting 1,000 L evening milk per day in the scenarios is given in Table 5. The investment for scooters is based on the estimated number of scooters. The investment for the power grid extension that would be necessary by using on-farm refrigerators is not taken into account. The investment for scenario D is split between the morning and evening milk, with the chilling centre allocated half for the evening and half for the morning milk.
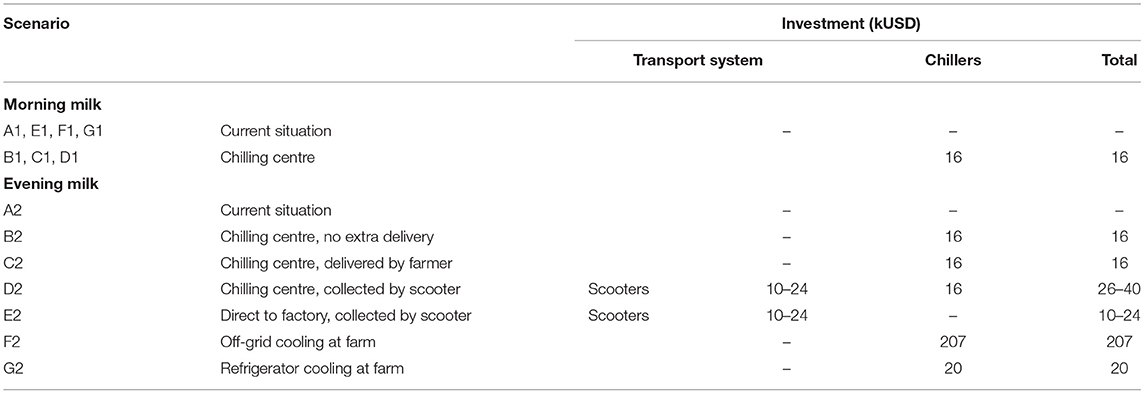
Table 5. Required investment for collection of 1,000 L evening milk per day and average selling amount of 9 L per farmer in different scenarios.
In Table 6, the fixed costs (with a depreciation of 10 years), variable and total collection costs are given for the scenarios. For these calculations, the rejection of milk is not taken into account, although this will have financial consequences for either the farmer or the milk factory, depending on the chosen scenario.
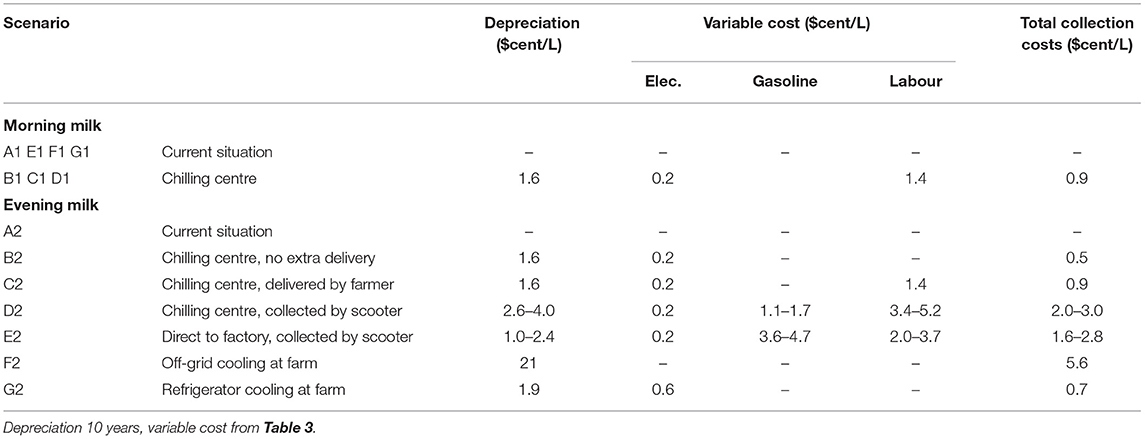
Table 6. Additional depreciation, variable and average cost per litre for collection of 1,000 L evening milk per day and average selling amount of 9 L per farm for different scenarios.
Scenario B, which seems the most economical way to increase the milk supply by an extra US$0.50/L milk, will not be feasible in that respect, as an estimated 90% of the offered evening milk will be rejected.
In scenarios B1, C1, C2, and D1, the chilling centre for milk delivered by farmers costs US$0.90/L. This is about 2% of the US$0.50/L market price. This conforms with the 1% increase in price for raw milk in peri-rural areas found by Vernooij et al. (2010), where only the variable costs were included, which in our estimate is half the total cost including depreciation. For the morning milk, these costs are relatively high since only a limited benefit for the milk quality is expected. For the evening milk (scenario C2), such added costs are comparatively low, under the condition that farmers are able and willing to bring the evening milk directly after milking to the cooling centre.
In scenarios D2 and E2, collecting the milk with a scooter costs US$1.6–3.0/L. This is about 4%−6% of the market price but may be necessary to reach the goal of an additional 1,000 L/day.
The depreciation costs for the off-grid chiller in scenario F add up to US$5.6/L. This is due to the daily milk production of 9 L per farmer and the capacity of the evaluated chiller of 40 L/day. For the biogas off-grid chiller, no investment data were available due to the bankruptcy of the producing company (Faillissementsdossier.nl, 2018). However, it is not likely that the collection costs with this chiller would be lower compared with the solar-powered chiller.
The ordinary grid refrigerator in scenario G2 is obviously much cheaper. If the electricity grid were extended from the road to these remote farms in the future (vide infra), then the evening milk could be sold with a very low additional costs of US$0.70/L, of which 25% covers electricity costs.
GHG Emissions in the Scenarios
Except for solar power-driven cooling on the farm, all scenarios have higher GHG emissions than the current situation (Table 7). The scenarios for the evening milk in the current situation (A) and with the chilling centre with one delivery (B) are not taken into account. Due to the high rejection rate of more than 90%, these scenarios are not feasible. The GHG emissions for the other milk collection scenarios account for 0.2–2.2% of the GHG emissions of primary production and therefore have little impact.
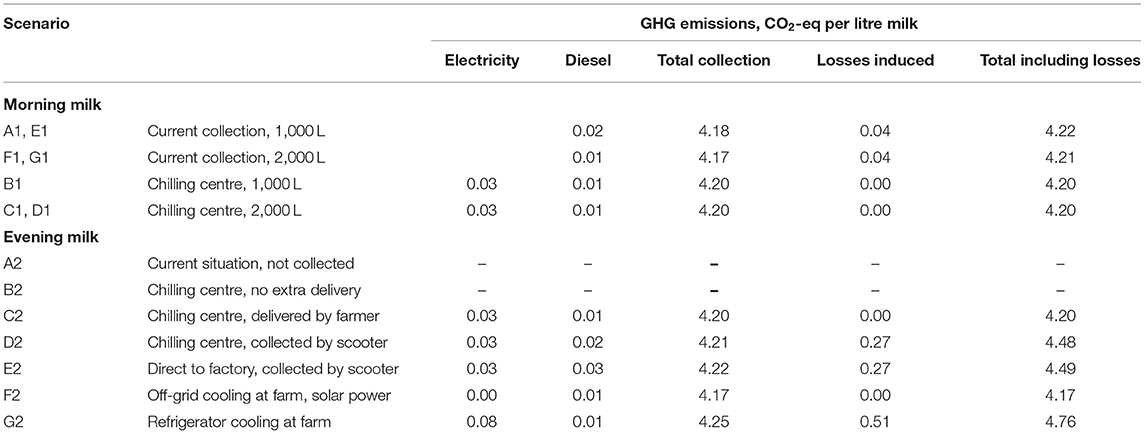
Table 7. GHG emissions for collection of milk per litre in different scenarios.
When the rejected milk would be considered waste and in the scenarios where farmers bring the milk to the chilling centre (B and C), the total GHG emissions would be lower, as in the current situation.
Discussion
This analysis shows that most scenarios are either quality wise or economically unfeasible in their original stated form. While doing the analysis, the limitation became apparent and other practical, technological, or economical options emerged. We will discuss them here, starting with the sensitivity of the rejection rate to scenario variability.
Variability of Rejection Rate and Technical Options
The calculated 0% rejection rate for the morning milk in scenario A1 is plausible. The rejection rates at road collection points were not recorded, but during our observation of milk collection only one sample of offered milk was rejected, representing <0.5% of the total milk collected.
At the factory gate, only milk offered by independent milk collectors was tested, and 10% of this milk was rejected, which is higher than the 1% calculated by the model in scenario A1. It is not likely that the growth rate is underestimated, since the model formulation and chosen parameters result in a slight overestimation at higher temperatures, as discussed in Section 2. As the exact time of arrival at the milk factory is not recorded for these supplies, later arrival times can explain this difference. When a delivery time of 12:00 instead 10:00 is taken, the model predicts 11% rejection. This shows that the rejection rate is very sensitive to delays in delivery time when the milk collection system operates at ambient temperature.
The high rejection rate of evening milk cannot be solved by improving the milking hygiene alone. Hypothetically, even with significantly lower initial contamination by LAB from Normandie, 85% of the evening milk will still be rejected at the factory gate if no cooling is applied.
In scenario B, with only morning delivery to the road, the chilling centre near the road has no positive effect on the availability of evening milk for the factory. An optimal passive cooling strategy without active chillers for bringing the evening milk to ambient night temperature (10°C) with, e.g., a four times higher heat transfer rate for the milking jars, could help to reduce the rejection rate of evening milk at 10:00 to 44%. This is a large improvement, but still not enough to be practically feasible.
In the scenarios where the evening milk is collected by scooters, then, as shown, whether an acceptable rejection rate at the factory gate can be achieved depends on the logistic parameters. One obvious technical way to shorten the travel time of warm milk is simply to have more scooters and not fill them to their maximum capacity.
For on-farm cooling in a standard refrigerator with plastic jars, the rejection rate is also a problem. The convective cooling in the refrigerator and the low heat transfer rate of plastic increase the cooling time of the milk. Changing to metal jars would increase the cooling rate and reduce the rejection rates to acceptable levels for this scenario.
Collection Costs and Financial Risks
The different scenarios not only affect the total collection cost per litre of milk but also involve other aspects that need to be considered during implementation: who needs to invest, whether the cost can be allocated to the additional collected milk, who assumes the financial risk of milk rejection and the effect of smaller collection volumes.
For all scenarios, depreciation is responsible for the majority of the cost. This will, in general, hold back the implementation of any scenario. This will especially apply to the on-farm cooling scenarios, as it is not likely that a farmer could afford to pay for such equipment by himself. One option might be pre-financing of the chiller by the milk factory, to be paid back with milk deliveries. In this respect, a chilling centre has advantages, as the required investments can be directly allocated to milk collection irrespective of whether the centre is owned by the milk factory or by a cooperative. Different purchase prices can be offered for the evening milk, as this milk is collected separately. When farmers bring the evening milk together with the morning milk, in the on-farm chilling scenario there cannot be a price deviation between the two. The farmers therefore have to give up their margin on the evening milk, whereas in the chilling centre scenario the additional cost can be directly paid by the factory.
The investment for an off-grid on-farm milk chiller would be very high to make this scenario feasible, even if it is pre-financed by the milk factory. As the used capacity of the off-grid chiller is <25% of its maximum capacity, the depreciation cost is much higher than it would be if it were calculated by full capacity. If a smallholder farm teamed up with neighbours to also cool their evening milk, acting as a mini-chilling centre, the collection cost drops to an acceptable level of US$1.3/L.
To calculate the collection cost, an average of 9 L of milk per delivery was used, from the study of Vernooij et al. (2010). Although this number came from a cooling centre very close to the study area, this number seems quite high. During the observation of the roadside milk collection, more than once, only one 1-L bottle of milk was offered. If the actual delivery quantities are indeed substantially lower than assumed in the scenario evaluation, then the collection costs in all scenarios will be much higher, except for the cooling centre. With a reduced average delivery of 2 L per farm, the collection cost for the chilling centre combined with scooter collection will be 2.3 times higher, and for off-grid on-farm cooling even 4.5 times higher.
So the use of a chilling centre is less dependent on the delivery size per farmer, but it is very sensitive to the total collection volume. An evaluation of the operation of milk collection centres in Rwanda showed that a lack of total volume is one of the major reasons for closing a chilling centre (Ministry of Agriculture and Animal Resources, 2013). This is notably a risk for scenario C, in which the evening milk is brought by farmers directly to the chilling centre, and it is doubtful whether the required volume could be reached. The study mentioned above (Vernooij et al., 2010) showed that 25% of the milk delivered to chilling centres in peri-rural areas came from evening milk. In those cases, most farms were relatively close the road, between 5 and 30 min walking distance. However, for the region considered in this study, the walking distance is on average significantly longer (up to 1 h). According to the local cooperative, farmers are hesitated to take the extra trip to a cooling centre in the dark. It is a risky and time-consuming investment. So, although scenario C scores well with respect to rejection rates and calculated collection costs, it falls short, as the projected extra volume might not be achieved given the longer distances.
Scooter collection would bring the required extra volume of 1,000 L/day, making a chilling centre feasible. However, the whole chilling centre is no longer needed in scenario E, in which the milk is collected by scooters and taken directly to the factory. Without the cost of a chilling centre, the collection cost is only US$0.2–0.4/L lower, with a notable 40 to 61% reduction in capital costs. This makes this scenario attractive and scalable, due to the associated low financial risk when it is steadily implemented.
In scenario G2, where a grid extension is assumed, the collection costs are the lowest of all scenarios. The decision to use a grid extension, however, cannot be made by the milk factory; for that, it must rely on government priorities and costs. As for the Ethiopian government, one of the goals is to provide power connexion for every household in sub-rural areas (Commission, 2020), which still could be a possible scenario, but not for the short term.
Conclusions
The developed model is shown to be a good tool to predict the rejection rates of raw milk, even with the simplifications employed. This is illustrated by evaluating different scenarios and comparing with the data and practical experience. The model shows that the rejection rate for milk collected in Ethiopia is largely dependent on the time between milking and cooling. Only improving farm hygiene will not reduce the rejection rate of evening milk to acceptable levels. The analysis of the scenarios shows that cooling is essential for preventing rejection of collected evening milk in the area of the Zagol milk factory, although in most scenarios, it will increase GHG emissions. For the morning milk, cooling is currently less beneficial, but only when the time between collection and arrival at the factory is limited.
Including both quality and economics, the best scenario can be expected with a cooling centre where farmers offer their milk twice a day. The additional collection cost for milk will be just below US$0.01/L above the current morning milk, and this depends on the amount of milk the farmers are offering. However, as it is expected that farmers will not be willing to deliver the evening milk to the chilling centre themselves at night, an additional collecting system is probably needed to increase the milk supply. This would result in higher costs and a risk of rejection at the factory gate. Furthermore, when a collection system can be set up, a chilling centre has reduced added value. Therefore, with a collection system at farms for the evening milk, the milk can be better brought directly to the factory. The rejection rates in that case are significant. However, they can be reduced by limiting the collection time. Another benefit for this scenario is that it can be introduced on a small scale with limited financial risk.
In addition, the off-grid chiller scenario, where the rejection rate is reduced to zero, can be started as a small project with limited risk. Compared with a farm collection system, the collection cost for this scenario is much higher. However, this scenario is the only one where a reduction of GHG emissions is expected.
If a grid extension was established, the cost for on-farm cooling would be much lower, compared with the solar-power-driven cooler. The drawback is that proper training would be necessary to get sufficiently high cooling rates for the evening milk, in order to prevent rejection at the collection point in the morning.
The applied combination of a simple model, economic analysis and the effect on GHG emissions gives valuable information on the effectiveness and limitations of different cooling scenarios for the milk factory. This can help to successfully apply a scenario to increase the milk supply.
Data Availability Statement
The original contributions presented in the study are included in the article/supplementary material, further inquiries can be directed to the corresponding author/s.
Author Contributions
BD idea, implementation, and writing. EE development of the model and reviewing. JB evaluation of the GHG emissions and reviewing. MV supervision and reviewing. All authors contributed to the article and approved the submitted version.
Funding
This work was implemented as part of the Consultative Group on International Agricultural Research (CGIAR) Research Program on Climate Change, Agriculture and Food Security (CCAFS), which is carried out with support from CGIAR fund donors and through bilateral funding agreements.
Conflict of Interest
The authors declare that the research was conducted in the absence of any commercial or financial relationships that could be construed as a potential conflict of interest.
References
Acai, P., Valik, L., Medvedova, A., and Rosskopf, F. (2015). Modelling and predicting the simultaneous growth of Escherichia coli and lactic acid bacteria in milk. Food Sci. Technol. Int. 22, 475–484. doi: 10.1177/1082013215622840
Andualem, B., and Geremew, T. (2014). Fermented ethiopian dairy products and their common useful microorganisms: a review. World J. Agric. Sci. 10, 121–133. doi: 10.5829/idosi.wjas.2014.10.3.1143
Ashenafi, M. (1996). Effect of container smoking and incubation temperature on the microbiological and some biochemical qualities of fermenting ergo, a traditional ethiopian sour milk. Int. Dairy J. 6, 95–104. doi: 10.1016/0958-6946(94)00037-9
Asresie, A., Yilma, Z., Seifu, E., Zemedu, L., Eshetu, M., and Kurtu, M. Y. (2018). Handling, processing, utilization and marketing of ayib (Ethiopian traditional cottage cheese) varieties produced in selected areas of eastern Gojjam, Northwestern highlands of Ethiopia. Open J. Anim. Sci. 8:23. doi: 10.4236/ojas.2018.81005
Assefa, E., Beyene, F., and Santhanam, A. (2008). Isolation and characterization of inhibitory substance producing lactic acid bacteria from Ergo, Ethiopian traditional fermented milk. Livestock Res. Rural Dev. 20:44.
Bouguettoucha, A., Balannec, B., and Amrane, A. (2011). Unstructured models for lactic acid fermentation–a review. Food Technol. Biotechnol. 49, 3–12.
Commission, E. I. (2020). Power. Available online at: http://www.investethiopia.gov.et/index.php/investment-opportunities/strategic-sectors/power.html
Dalgaard, P., and Koutsoumanis, K. (2001). Comparison of maximum specific growth rates and lag times estimated from absorbance and viable count data by different mathematical models. J. Microbiol. Methods 43, 183–196. doi: 10.1016/S0167-7012(00)00219-0
Edwin, M., and Joseph Sekhar, S. (2014). Techno-economic studies on hybrid energy based cooling system for milk preservation in isolated regions. Energy Convers. Manage. 86, 1023–1030. doi: 10.1016/j.enconman.2014.06.075
Faillissementsdossier.nl (2018). Bankruptcy Simgas B.V. Available online at: https://www.faillissementsdossier.nl/en/bankruptcy/1450278/simgas-b-v.aspx
Foster, R. (2015). Solar Milk Cooling: Smallholder Dairy Farmer Experience in Kenya. doi: 10.18086/swc.2015.03.05
Foster, R., Jensen, B., Faraj, A., Mwove, J., Dugdill, B., Knight, B., et al. (2017). “Direct drive photovoltaic milk chilling: two years of field experience in Kenya,” in Solar World Congress 2017 (Abu Dhabi). doi: 10.18086/swc.2017.16.02
Fu, W., and Mathews, A. (1999). Lactic acid production from lactose by Lactobacillus plantarum: kinetic model and effects of pH, substrate, and oxygen. Biochem. Eng. J. 1999, 163–170. doi: 10.1016/S1369-703X(99)00014-5
Getahun, D., Alemneh, T., Akeberegn, D., Getabalew, M., and Zewdie, D. (2019). Probiotic bacteria in relation to Ethiopian dairy industry. Microbiol. Res. Int. 7, 24–30. doi: 10.30918/MRI.73.19.024
Guo, X., Broeze, J., Groot, J., Axmann, H., and Vollebregt, M. (2020). A worldwide hotspot analysis on food loss and waste, associated greenhouse gas emissions, and protein losses. Sustainability 12:7488. doi: 10.3390/su12187488
IGES (2020). List of Grid Emission Factors, Version 10.8. IGES Institute for Global Environmental Strategies. Available online at: https://pub.iges.or.jp/pub/iges-list-grid-emission-factors (accessed November 2, 2020).
Lore, T., Omore, A., and Staal, S. (2005). Types, Levels and Causes of Post-Harvest Milk and Dairy Losses in Sub-Saharan Africa and the Near East: Phase Two Synthesis Report. FAO Action Programme for the Prevention of Food Losses.
Luedeking, R., and Piret, E. (1959). A kinetic study of the lactic acid fermentation. Batch process at controlled pH. J. Biochem. Microbiol. Technol. Eng. 1, 393–412. doi: 10.1002/jbmte.390010406
Mallet, A., Guéguen, M., Kauffmann, F., Chesneau, C., Sesbou,é, A., and Desmasures, N. (2012). Quantitative and qualitative microbial analysis of raw milk reveals substantial diversity influenced by herd management practices. Int. Dairy J. 27, 13–21. doi: 10.1016/j.idairyj.2012.07.009
Matejčeková, Z., Spodniaková, S., Dujmić, E., Liptáková, D., and Valík, L. (2019). Modelling growth of Lactobacillus plantarum as a function of temperature: effects of media. J. Food Nutr. Res. 58, 125–134.
Ministry of Agriculture and Animal Resources (2013). National Dairy Strategy, MINAGRI. Kigali: Government of Rwanda
Moffat, F., Khanal, S., Bennett, A., Thapa, T. B., and George, M. (2016). Technical and Investment Guidelines for Milk Cooling Centres. FAO, Rome.
Østlie, H. M., Helland, M. H., and Narvhus, J. A. (2003). Growth and metabolism of selected strains of probiotic bacteria in milk. Int. J. Food Microbiol. 87, 17–27. doi: 10.1016/S0168-1605(03)00044-8
Passos, F. V., Fleming, H. P., Ollis, D. F., Felder, R. M., and McFeeters, R. F. (1994). Kinetics and modeling of lactic acid production by Lactobacillus plantarum. Appl. Environ. Microbiol. 60, 2627–2636. doi: 10.1128/AEM.60.7.2627-2636.1994
Porter, S. D., Reay, D. S., Higgins, P., and Bomberg, E. (2016). A half-century of production-phase greenhouse gas emissions from food loss & waste in the global food supply chain. Sci. Total Environ. 571, 721–729. doi: 10.1016/j.scitotenv.2016.07.041
Ratkowsky, D. A., Olley, J., McMeekin, T. A., and Ball, A. (1982). Relationship between temperature and growth rate of bacterial cultures. J. Bacteriol. 149, 1–5. doi: 10.1128/JB.149.1.1-5.1982
Sivak, M., and Schoettle, B. (2017). On-Road Fuel Economy of Vehicles in the United States: 1923-2015. Michigan: The University of Michigan
Sommer, H. H., and Binney, T. H. (1923). A study of the factors that influence the coagulation of milk in the alcohol test. J. Dairy Sci. 6, 176–197. doi: 10.3168/jds.S0022-0302(23)94078-6
Tegegne, B., and Tesfaye, S. (2017). Bacteriological milk quality: possible hygienic factors and the role of Staphylococcus aureus in raw bovine milk in and around Gondar, Ethiopia (journal article). Int. J. Food Contam. 4:1. doi: 10.1186/s40550-016-0046-2
van der Velde, N., and Belkhir, R. (2016). First Off-Grid, Biogas-Powered Milk Chiller Introduced. Available online at: http://www.bopinc.org/updates/first-off-grid-biogas-powered-milk-chiller-introduced
Venkatesh, K. I., Okos, M. R., and Wankat, P. C. (1993). Kinetic model of growth and lactic acid production from lactose by Lactobacillus bulgaricus. Process Biochem. 28, 231–241. doi: 10.1016/0032-9592(93)80039-J
Vernooij, A., Pronk, E., and Leegwater, T. (2010). Performance of Milk Collection Centres in Ethiopia.
Yilma, Z., and Faye, B. (2006). Handling and microbial load of cow's milk and irgo - fermented milk collected from different shops and producers in central highlands of ethiopia and producers in central highlands of Ethiopia. Ethiop. Soc. Anim. Product. 6, 67–82.
Keywords: food security, milk collection, milk rejection, economic analysis, cooling centre, green house gas emission
Citation: Dijkink B, Esveld E, Broeze J and Vollebregt M (2021) Evaluation of Scenarios for Improving the Collection System for a Milk Factory in Ethiopia. Front. Sustain. Food Syst. 5:645057. doi: 10.3389/fsufs.2021.645057
Received: 22 December 2020; Accepted: 05 May 2021;
Published: 11 June 2021.
Edited by:
Ilija Djekic, University of Belgrade, SerbiaReviewed by:
Vesna Radovanović, Other, Belgrade, SerbiaOlivier Kashongwe, Leibniz Institute for Agricultural Engineering and Bioeconomy (ATB), Germany
Copyright © 2021 Dijkink, Esveld, Broeze and Vollebregt. This is an open-access article distributed under the terms of the Creative Commons Attribution License (CC BY). The use, distribution or reproduction in other forums is permitted, provided the original author(s) and the copyright owner(s) are credited and that the original publication in this journal is cited, in accordance with accepted academic practice. No use, distribution or reproduction is permitted which does not comply with these terms.
*Correspondence: Bert Dijkink, YmVydC5kaWpraW5rQHd1ci5ubA==