 Cristina Ripoli1
 Giuseppina Adiletta2
 Paola Russo3*
 Nicola Funicello1
 Gerardo Iannone4Marisa Di Matteo2
 Salvatore De Pasquale1
- 1Department of Physics “E.R. Caianiello”, University of Salerno, Fisciano, Italy
- 2Department of Industrial Engineering, University of Salerno, Fisciano, Italy
- 3Department of Chemical Engineering Materials Environment, Sapienza University of Rome, Rome, Italy
- 4National Institute for Nuclear Physics-Sezione di Napoli, University of Salerno, Fisciano, Italy
Nuclear Magnetic Resonance (NMR) and Magnetic Resonance Imaging (MRI) techniques are widely used in food science, mainly because they are non-invasive techniques. MRI, as a non-destructive technique, allows the study of intact samples and without any preparation of the samples before analysis. In food processing, the monitoring of distribution and water content is a consolidated analysis technique, frequently used on the market in order to preserve appropriate nutritional and health characteristics of food according to quality standards. In a food matrix, the variation of the water content is related to the changes in the internal structure and in the physico-chemical properties that occur during the transformation process. In this study MRI technique is used to evaluate the variation of the water content as a function of the drying time. Pumpkin samples are analyzed at four different drying temperatures of 50, 60, 65, and 70°C. The transverse relaxation time, T2, is used to assess the hydration level of the samples by comparing the information extracted from MR images with the drying kinetics measured by gravimetric method. Moreover, T2 maps are used to correlate the change in water distribution with the change in T2 values. The results show that the global weight loss curves obtained with the standard gravimetric method and with the MRI data are in excellent agreement. This work indicates that monitoring changes in the T2 profile of food (i.e., pumpkin) is a useful method for evaluating moisture profiles and changes induced on the sample during the drying process.
Introduction
MRI has been widely used in food science (Hills, 1998). In particular, the use of this technique has significantly increased over the past 20 years (Fukuoka et al., 2000; Ghosh et al., 2007; Mariette et al., 2007) mainly due to its ability to provide high spatial resolution and relevant information such as mobility and distribution of water.
MRI can provide detailed information based on a significant number of NMR characteristic parameters such as proton density (PD), transversal relaxation time (T2), and/or longitudinal relaxation Time (T1). These parameters are intrinsic properties of the samples; in general, the images have relative contrast to one of these parameters depending on what is to be displayed. It is also possible to obtain maps, in which each pixel contains information not about the signal strength, but about relaxation time T1 or T2. These maps can be obtained by acquiring MR image series with different T1 or T2 weighting levels.
Relaxation measurements were used, in particular, to study the microstructure of food materials and the role of water in fruits and vegetables. MRI relaxation time mapping was used to study fruit development and ripening, demonstrating the dependence of relaxation times on the type of samples and their changes during the process (Clark and MacFall, 2003; Musse et al., 2009).
MRI has the potential to examine how moisture interacts in various food products and provides an understanding of the moisture uptake mechanism, moisture migration kinetics, and the interaction of moisture with various food matrices. The knowledge of water distribution and its mobility in the food matrix represents a powerful tool for characterizing the quality of food during processing and storage (Khan et al., 2016; Wang et al., 2017; Cheng et al., 2018).
The moisture distribution of one of the most consumed foods, pasta, has been intensively studied to probe the internal distribution of moisture in the texture of pasta (Ogawa and Adachi, 2014), which is crucial for consumer perception.
MRI was applied to monitor water entry and distribution in pasta and noodle samples at different stages of cooking (Kojima et al., 2001; Bernin et al., 2014), and rapidly occurring deterioration after cooking and during distribution due to homogenization of moisture distribution (Horigane et al., 2006). It is possible to study the mobility and distribution of water in foods with low and intermediate moisture content (Cornillon and Salim, 2000), the mapping of real-time moisture migration for grain-based food (Weglarz et al., 2008) and to study moisture migration during absorption and aging in soft-panned packages (Troutman et al., 2001). The results of the cited studies and many published articles have shown that MRI is an excellent technique for studying and monitoring moisture migration in multicomponent food systems (Ramos-Cabrer et al., 2006).
Quantitative MRI has also been used to study bread and vegetables processing, i.e., baking and drying (Takano et al., 2002; Brasiello et al., 2017). Since several processing operations induce changes in water content and molecular structure, an appropriate MRI protocol must be set up to provide correct image interpretation.
In previous works (Adiletta et al., 2014; Proietti et al., 2018), we studied the capacity of non-destructive and non-invasive techniques such as the Magnetic Resonance Imaging (MRI) and portable NMR, to optimize the drying process of eggplants and pears, respectively. In this work the drying process of pumpkin samples is investigated.
Pumpkin is one of the most important cultivated fruits in the world for its nutritional and healthful qualities. It is a good source of antioxidants and vitamins (carotene and vitamin-A, vitamin-C, and vitamin-E) which are vital for our health (Arévalo-Pinedo and Murr, 2006). This fruit is rich in phenols, flavonoids (Que et al., 2008), polysaccharides, mineral salts, and other substances beneficial for health (Yang et al., 2007).
Fresh pumpkin must be stored at temperature between 10 and 13°C and the relative humidity of the air must be between 50 and 70%. If stored at low temperature, unfavorable physiological processes that cause cold damage can occur. Furthermore, after peeling, the pumpkin is susceptible to moisture loss, softening, color changes, and microbial spoilage due to the high water level, for these reasons the product can be easily spoiled (Perez and Schmalko, 2009).
Pumpkin is generally processed to obtain juices, pickles, dried products in many countries of the world. As a dried product, it is available as a snack, dried premix, soup, etc. (Krokida et al., 2003).
In order to reduce water and microbiological activities and minimize physical and chemical changes during vegetable storage, the drying technique is commonly used for food storage. Therefore, optimal pumpkin storage methods should be used, appropriate for the specific end use of the fruit.
The aim of this study is to investigate the drying process of pumpkin samples, at four different drying temperatures, through MR images, correlating the variations of the water content with the variation of the T2 value. The analysis of the images and the information carried out by mapping T2 value are closely related to the level of hydration of the samples under examination, since it is roughly proportional to the moisture content (Kojima et al., 2001). The study wants to show how the T2 of water, decreases considerably during the drying process.
Materials and Methods
Samples Preparation and Drying Process
The analysis was performed on samples of a specific pumpkin cultivar: Cucurbita Maxima.
Fresh pumpkin samples were selected from the same geographical area (Perdifumo-Campania-Italy), collected in September and stored at 10°C before use. The samples were cut from the fresh pumpkin, using a steel mold to make small parallelepiped of about 10 × 10 × 16 mm3.
The dimensions of samples have been adapted to the diameter (15 mm) of the test tube and calibrated in order to obtain a well detectable signal even after the shrinkage occurred at high drying temperatures.
For each experiment, samples from different peeled pumpkins were randomly mixed, in order to minimize differences in the food matrix.
For the fresh pumpkin the initial moisture content of the samples was (13.29 ± 0.53) kg kg−1, corresponding to a relative moisture content of 93%. Water activity, is a parameter used to describe the energy status or tendency for water to leak out of a sample is 0.96 measured by a water activity meter (Testo 650, Testo Inc., West Chester, PA, USA) at 25°C.
A bench-top temperature humidity chamber (Espec Corp. mod. SU-221) (Temperature range: 20–150°C, air velocity of 1.2 m/s) was used to dry the pumpkin samples at fixed temperatures.
The drying experiments were carried out at four different temperatures: 50, 60, 65, and 70°C to study the effects of temperature on moisture migration, with a time interval of 10 min and a total drying time of 180 min at 50°C, 150 min at 60°C, and 120 min at 65 and 70°C.
Five samples were placed in the climate chamber and weighed at fixed time intervals during the drying process until the weight no longer changes significantly, i.e., it is assumed when the change in weight of the sample is <5%.
All the samples were weighed using a digital balance (Shimadzu mod. AW320—Sensitivity 10−3 g). Each test was conducted on five samples and weight loss was monitored and the mean Moisture Ratio (MR) was calculated. Using gravimetric measurements, MR values were evaluated using the following formula (1):
where M(T) is the mass of the sample during drying, while M0 and M∞ refer, respectively, to its initial and equilibrium value. Since the value of M∞ is negligible with respect to M0 and M, the previous equation can be written as follows (2):
To avoid water absorption, each sample is hermetically sealed in the test tube during MRI acquisitions, after which the samples were placed in the oven to continue the drying process. The weight loss obtained from the gravimetric measurements was compared with the relaxation data collected by the MRI.
MRI Protocol
NMR experiments were recorded using a Bruker spectrometer operating at the frequency of 300 MHz (B0 = 7 T) equipped with a MicWB40 Probe in combination with the Micro2.5 Gradient System.
In order to describe the water distribution during drying process, T2 maps were obtained through MSME (Multi Slice Multi Echo) sequence collected at the end of each drying cycle. The acquisition time was of about 1 h for each sample at each temperature step.
For quantitative measurements a suitable choice is to set an optimum value of Repetition Time (TR) five times bigger than T1 in order to assure the complete longitudinal relaxation. The parameters used are TR = 5T1 = 13*103 ms, Echo Time (TE) in the range [5 ÷ 100] ms and matrix size = 256 × 256.
The Field of View (FOV) was chosen to cover the whole sample: FOV = 16 mm × 16 mm and slices of 1 mm thickness were selected.
In order to generate a cut off of the noise level for the T2 calculation of the image, the Region Of Interest (ROI) threshold was chosen at 15% with respect the default value of 10%.
T2 Mapping
Using 1H MR imaging on biological samples, the proton signal comes predominantly from the water proton. Three water environments can be distinguished: intercellular, intracellular and cell wall water. Each environment corresponds to a different bond strength. Taking these differences into account, it is possible to talk about free water (FW), weakly bound water (LBW), and strongly bound water (SBW). The mobility of water, defined as the ability of water molecules to rotate freely, is clearly related to the type of bond: it decreases as bond strength increases.
The transverse relaxation time, T2, is influenced by the molecular mobility of water. Higher values of T2 can be associated with greater water mobility; lower values instead reveal the presence of a more rigid structure (Irie et al., 2004; Horigane et al., 2006). This explains the presence of several T2 components. This behavior is described by mono-exponential or multi-exponential decay curve, which indicates different mobility of water. The T2 value can be a powerful tool to get information on water dynamics.
Generally, in inhomogeneous systems, each voxel contains various water compartments, and the signal decay curve becomes multi-exponential, with several T2 relaxation times depending on the water location.
In homogenous systems, the T2 relaxation process is mono-exponential with a well-defined T2 relaxation time. This means that T2 exhibits behavior approximately proportional to the hydration level of the samples. Khan et al. (2016) showed that in a pumpkin sample the largest percentage of water appears weakly bound (LBW) and this type of water is mostly removed during the drying process.
Since in the mapping procedure a single T2 value is attributed to each voxel, to establish a suitable normalization the sum of all T2 values collected in the fresh sample is considered as a reference. This value is called S0. With the same procedure S is defined as the sum of all T2 values measured on the sample during drying.
S is then estimated at each drying step, adding all the T2 values from each voxel. Normalizing S with the global T2 value of the fresh sample (S0), we define a new quantity (3):
Using the ST2 value, the T2 profile could be compared with the moisture ratio (MR) values obtained by gravimetric measurements.
Results and Discussion
Drying Kinetics
In order to analyze the effect of the different drying temperatures (50–70°C) on the drying kinetics of the pumpkin samples, the curves of the moisture ratio MR vs. drying time (min) are shown in Figure 1. In particular, the moisture ratio of the samples obtained through gravimetric measurements is reported.
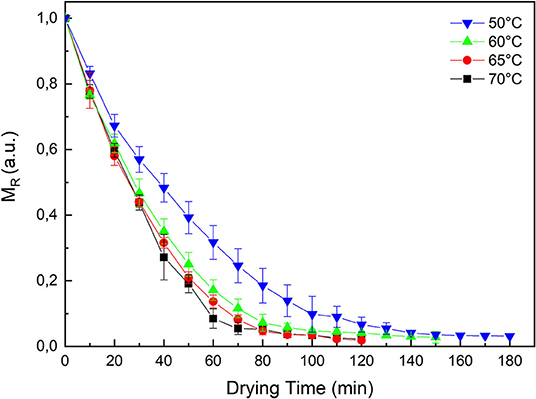
Figure 1. Drying kinetics obtained by gravimetric procedure at 50, 60, 65, and 70°C.
As expected, it is evident that a higher temperature will reduce the drying time. It is clear that the moisture content decreases with increasing drying time at all temperatures investigated. Furthermore, at 50°C the MR curve is significantly higher than the other temperatures. But at the end of process the residual moisture content is similar for test at 50, 60, 65, and 70°C.
From the curves of drying rate as a function of drying time (Figure 1), it can be observed that at 50°C after an initial period of constant rate, the drying process of the pumpkin samples continues with a phase characterized by a falling rate region. While at the other temperatures the falling rate phase is the only one observed.
The constant rate corresponds to the initial drying phase when moisture is removed from the surface by evaporation and the internal moisture transfer is sufficient to keep the surface saturated. In the falling-rate phase, the surface of the sample is not saturated and the evaporation rate is greater than the rate of water transfer through the sample.
There are several reasons that can justify this behavior. At some point, the partial pressure of the water over the entire sample is below the saturation level. Hence, to be supplied into the inner part, the heat must be conducted through dry solid and porous regions, both of which have low thermal conductivity.
As the moisture content in the sample decreases, then the internal resistance to moisture transfer increases (Srikiatden and Roberts, 2007). For these reasons the drying rate in this phase is extremely slow. In this final stage, the diffusion is the dominant mechanism that regulates the transport of moisture within the sample.
At a fixed temperature (60, 65, 70°C), observing the graph the two stages with a first rapid moisture loss which leads to a fast-drying rate and a second stage (after 80 min) where the moisture of migration is slower and the drying rate decreases are clearly distinguishable.
This behavior is in agreement with the results reported for pumpkin and other vegetables (Haile et al., 2015; Hwa Keen et al., 2016; Onwude et al., 2016).
Finally, it is observed in Figure 2 that the drying temperatures affected the drying rates. As expected, the drying rates for the pumpkin samples are higher at higher temperatures.
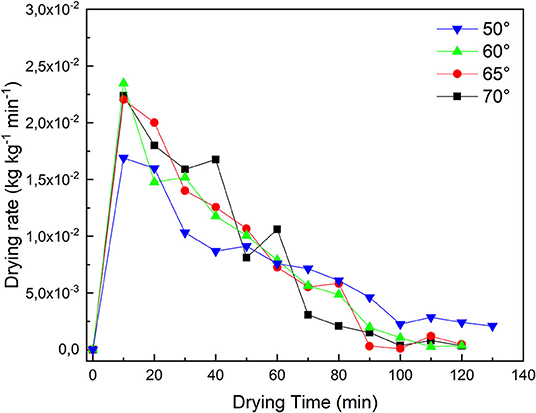
Figure 2. Drying rate of pumpkins at 50, 60, 65, and 70°C.
Shrinkage
The raw data obtained from the NMR measurements were processed by the ParaVision software provided by Bruker and then processed by the Origin analysis tool.
The contrast level in the T2-weighed MR images reflects the magnitude of T2 values: longer T2 indicates a higher moisture content (bright area); shorter T2 values indicate a low content of water (dark area). It is clear that in the pumpkin sample, where the water content is above 90%, the area appears almost completely bright (see Figure 3 as an example). As can be seen, after drying at 70°C for 70 min (Figure 3) the impact of water loss causes a noticeable reduction in size (shrinkage) and weight loss of the pumpkin samples. This also has a consequence on the number of slices we can acquire.
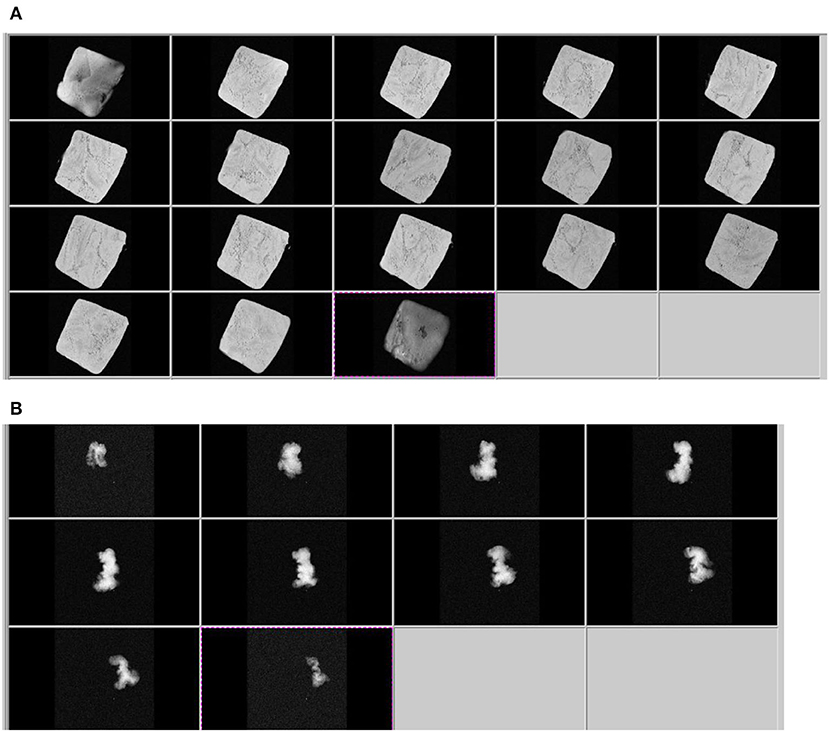
Figure 3. Axial slices of T2 weighted images of fresh pumpkin (A) and dried sample after 70 min at 70°C (B).
Other useful information from T2 data can be obtained plotting the transverse profiles of normalized T2, taken slice-by-slice and step-by-step during drying, as shown in Figure 4.
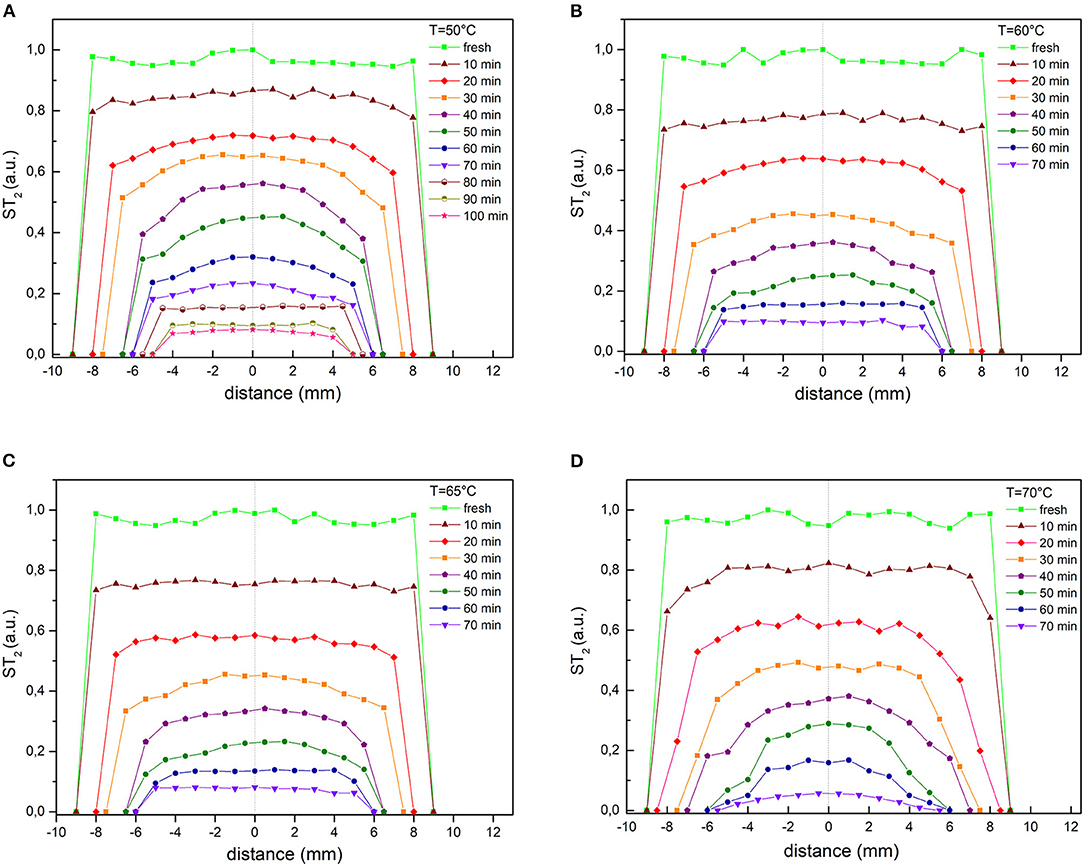
Figure 4. Transverse profiles of normalized T2 taken slice by slice for selected drying times at all temperatures considered: (A) 50°C, (B) 60°C, (C) 65°C, (D) 70°C.
The widths of the profiles and their shapes are clearly influenced by both the drying step and the temperature.
As expected, the water profile in the sample changes dramatically during dehydration: initially it is almost homogeneous over the entire length of the sample, then has a maximum in the center of the length as drying proceeds.
This effect is even more noticeable at higher temperatures. The shrinkage of the samples has been observed for all drying temperatures, it increases with the volume of water removed, since the more the water is removed the more shrinkage stress originates in the samples (Mayor and Sereno, 2004).
By extracting the wall charts using the same data obtained from T2 maps, we produce the plots illustrated in Figure 5.
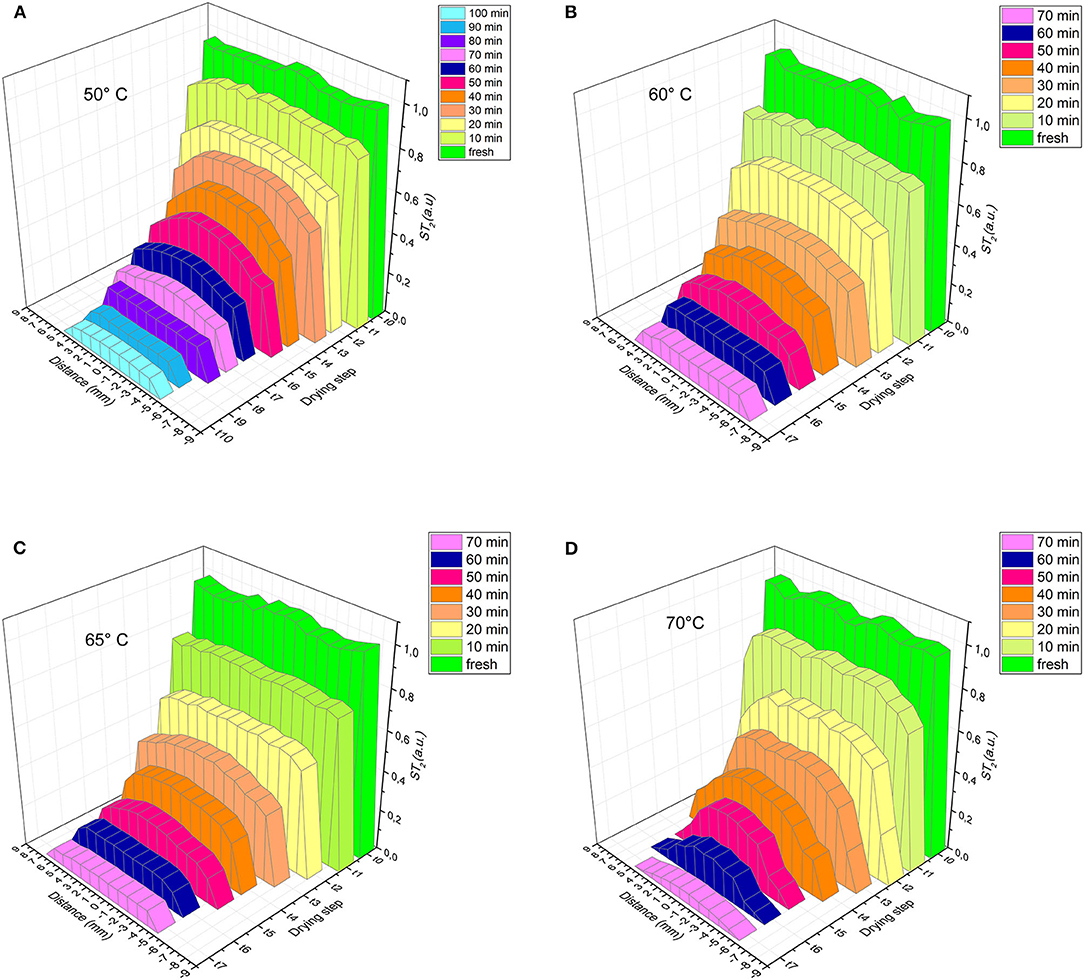
Figure 5. Moisture ratio (a.u.) of samples during drying, obtained by gravimetric method and MRI at (A) 50°C (R2 = 0.995), (B) 60°C (R2 = 0.997), (C) 65°C (R2 = 0.997), (D) 70°C (R2 = 0.999).
These graphs clearly and suggestively show the simultaneous water loss and volume reduction caused by sample shrinkage during the drying process. According to Mayor et al. (2011), the shrinkage is less pronounced in the mid-length and medium thickness of the sample while, at the edges, the shrinkage is more pronounced.
The goodness of our method in terms of T2 estimate of the moisture content is evaluated by plotting the values obtained through gravimetric measurements together with the ST2 values extracted, at each drying step, from the T2 maps. The excellent agreement (R2 > 0.995) between the curves of global weight loss obtained with the standard gravimetric method (black squares) and the MRI data obtained with the procedure described above (red squares) is shown in the following graphs (Figure 6).
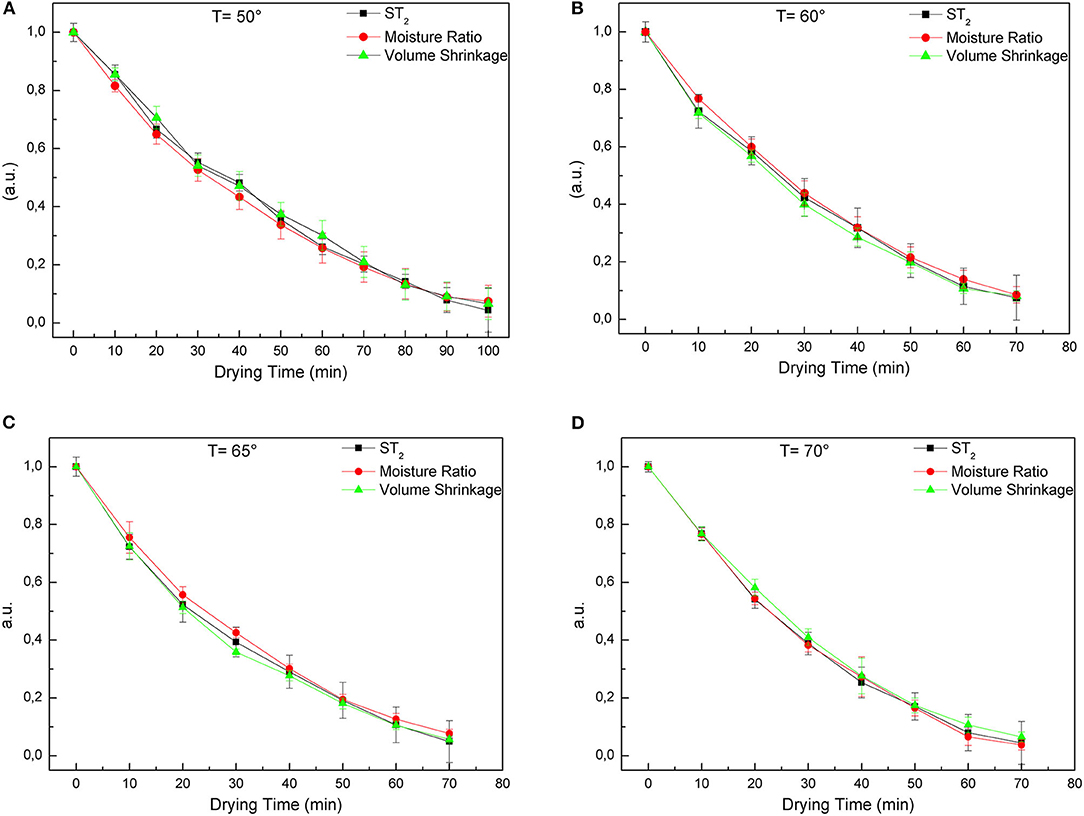
Figure 6. Moisture ratio (a.u.) of samples during drying, obtained by gravimetric method and MRI, and volume shrinkage at (A) 50°C, (B) 60°C, (C) 65°C, and (D) 70°C.
As can be observed, looking at the 50°C temperature plots (Figure 6A), the T2 estimate provides measurable signals even at 100 min of drying.
For the other temperatures 60, 65, and 70°C (Figures 6B–D) the T2 signal extracted from the maps becomes too small to be detected already after 70 min of drying.
Referring to the drying kinetics (Figure 1) for MR values lower than 0.1 we can observe that the water, distributed inside the food matrix, hardly evaporates during the drying process. Indeed, the time it takes to remove the residual moisture content from 10 to 3% is almost equivalent to the time it takes to remove the first 90% of the total moisture content.
In fact, when the water content in the sample becomes too small, usually strongly bound or immobilized inside the food matrix, also the T2 measurements and the related signals become difficult to measure with our method. However, this actually affect the residual water, well below 10% of the total moisture content of the fresh sample.
For this reason, a comparison between the gravimetric measurements and the T2 data was made only in the range in which we have measurable T2 signals (Figure 6).
Finally, knowing that the thickness of each slice is 1 mm, the volume of the sample at each drying step was easily calculate from the transverse profiles of normalized T2 taken slice by slice. The volume shrinkage was calculated as the ratio between the volume data obtained in this way and the initial volume of the sample.
Volume shrinkage data are compared with gravimetric measurements and ST2 data obtained from MR T2 maps at each drying step. The comparison is reported in the Figures 6A–D for different temperatures.
The agreement among the three physical quantities is remarkable for every drying temperature. The volume shrinkage during the drying process shows the same decreasing trend of the moisture ratio and of the ST2 values.
Conclusions and Perspectives
In this study, we demonstrated that T2 relaxation time can be an excellent parameter for monitoring changes in moisture content during the drying process of pumpkin samples. The results show that the global weight loss curves obtained with the standard gravimetric method and with the MRI data are in excellent agreement. This approach highlights the great advantage of the non-destructive MRI approach in the investigation and monitoring of internal structures avoiding damaging the samples. Overall, this work demonstrates that the MRI technique can be versatile and able to follow the moisture distribution within the pumpkin samples during the drying process.
We initially started with a specific and simple food matrix to demonstrate that the method is reliable and provides reproducible results. The improvements of this work consist in extending this method to different food matrices and validating this approach by programming repeated measurements on similar samples and performing multiple analyses.
On the other hand, quantitative moisture distribution maps enable future development and verification of models for the prediction of mass transport phenomena in food during drying to extend the shelf life of food materials: a major challenge for the modern food industry. An advantage of the MRI approach is that the starting point is simply the image and, compared to the common NMR spectroscopy, the preparation of the sample under examination is really easy, non-invasive and absolutely non-destructive. As future improvement of our method, the protocol will be extended to work with new MRI sequences, such as diffusion weighted images (DWI), and to test the fast imaging method to reduce acquisition time.
Data Availability Statement
The original contributions presented in the study are included in the article, further inquiries can be directed to the corresponding author.
Author Contributions
All authors listed have made a substantial, direct and intellectual contribution to the work, and approved it for publication.
Funding
Project is funded by the Italian Ministry of Agricultural, Food and Forestry Policies.
Conflict of Interest
The authors declare that the research was conducted in the absence of any commercial or financial relationships that could be construed as a potential conflict of interest.
References
Adiletta, G., Iannone, G., Russo, P., Patimo, G., De Pasquale, S., and Di Matteo, M. (2014). Moisture migration by magnetic resonance imaging during eggplant drying: a preliminary study. Int. J. Food Sci. Technol. 49, 2602–2609. doi: 10.1111/ijfs.12591
Arévalo-Pinedo, A., and Murr, F. E. X. (2006). Kinetics of vacuum drying of pumpkin (Cucurbita maxima): modeling with shrinkage. J. Food Eng. 76, 562–567. doi: 10.1016/j.jfoodeng.2005.06.003
Bernin, D., Steglich, T., Röding, M., Moldin, A., Topgaard, D., and Langton, M. (2014). Multi-scale characterization of pasta during cooking using microscopy and real-time magnetic resonance imaging. Food Res. Int. 66, 132–139. doi: 10.1016/j.foodres.2014.09.007
Brasiello, A., Iannone, G., Adiletta, G., De Pasquale, S., Russo, P., and Di Matteo, M. (2017). Mathematical model for dehydration and shrinkage: prediction of eggplant's MRI spatial profiles. J. Food Eng. 203, 1–5. doi: 10.1016/j.jfoodeng.2017.01.013
Cheng, S., Zhang, T., Yao, L., Wang, X., Song, Y., Wang, H., et al. (2018). Use of low-field-NMR and MRI to characterize water mobility and distribution in pacific oyster (Crassostrea gigas) during drying process. Dry Technol. 36, 630–636. doi: 10.1080/07373937.2017.1359839
Clark, C. J., and MacFall, J. S. (2003). Quantitative magnetic resonance imaging of “Fuyu” persimmon fruit during development and ripening. Magn. Reson. Imaging 21, 679–685. doi: 10.1016/S0730-725X(03)00082-1
Cornillon, P., and Salim, L. C. (2000). Characterization of water mobility and distribution in low- and intermediate-moisture food systems. Magn. Reson. Imaging 18, 335–341. doi: 10.1016/S0730-725X(99)00139-3
Fukuoka, M., Mihori, T., and Watanabe, H. (2000). MRI observation and mathematical model simulation of water migration in wheat flour dough during boiling. J. Food Sci. 65, 1343–1348. doi: 10.1111/j.1365-2621.2000.tb10609.x
Ghosh, P. K., Jayas, D. S., Gruwel, M. L. H., and White, N. D. G. (2007). A magnetic resonance imaging study of wheat drying kinetics. Biosyst. Eng. 97, 189–199. doi: 10.1016/j.biosystemseng.2007.03.002
Haile, F., Admassu, S., and Fisseha, A. (2015). Effects of pre-treatments and drying methods on chemical composition, microbial and sensory qualities of orange-fleshed sweet potato flour and porridge. Am. J. Food Sci. Technol. 3, 82–88. doi: 10.12691/ajfst-3-3-5
Hills, B. P. (1998). Magnetic Resonance Imaging in Food Science. New York, NY: John Wiley & Sons, Inc.
Horigane, A. K., Naito, S., Kurimoto, M., Irie, K., Yamada, M., Motoi, H., et al. (2006). Moisture distribution and diffusion in cooked spaghetti studied by NMR imaging and diffusion model. Cereal Chem. 83, 235–242. doi: 10.1094/CC-83-0235
Hwa Keen, J. L., Taip, F. S., Ibrahim, M. N., Abdul Aziz, N., and Shishir, M. R. (2016). Effect of pre-treatment on the physical properties of pumpkin powder. Aust. J. Basic Appl. Sci. 10, 146–151.
Irie, K., Horigane, A. K., Naito, S., Motoi, H., and Yoshida, M. (2004). Moisture distribution and texture of various types of cooked spaghetti. Cereal Chem. 81, 350–355. doi: 10.1094/CCHEM.2004.81.3.350
Khan, M. I. H., Wellard, R. M., Nagy, S. A., Joardder, M. U. H., and Karim, M. A. (2016). Investigation of bound and free water in plant-based food material using NMR T2relaxometry. Innov. Food Sci. Emerg. Technol. 38, 252–261. doi: 10.1016/j.ifset.2016.10.015
Kojima, T. I., Horigane, A. K., Yoshida, M., Nagata, T., and Nagasawa, A. (2001). Change in the status of water in Japanese noodles during and after boiling observed by NMR micro imaging. J. Food Sci. 66, 1361–1365. doi: 10.1111/j.1365-2621.2001.tb15215.x
Krokida, M. K., Karathanos, V. T., Maroulis, Z. B., and Marinos-Kouris, D. (2003). Drying kinetics of some vegetables. J. Food Eng. 59, 391–403. doi: 10.1016/S0260-8774(02)00498-3
Mariette, F., Collewet, G., Davenel, A., Lucas, T., and Musse, M. (2007). Quantitative MRI in food science & food engineering. EMagRes. 1, 1–8. doi: 10.1002/9780470034590.emrstm1272
Mayor, L., Moreira, R., and Sereno, A. M. (2011). Shrinkage, density, porosity and shape changes during dehydration of pumpkin (Cucurbita pepo L.) fruits. J. Food Eng. 103, 29–37. doi: 10.1016/j.jfoodeng.2010.08.031
Mayor, L., and Sereno, A. M. (2004). Modelling shrinkage during convective drying of food materials: a review. J. Food Eng. 61, 373–386. doi: 10.1016/S0260-8774(03)00144-4
Musse, M., Quellec, S., Cambert, M., Devaux, M. F., Lahaye, M., and Mariette, F. (2009). Monitoring the postharvest ripening of tomato fruit using quantitative MRI and NMR relaxometry. Postharvest. Biol. Technol. 53, 22–35. doi: 10.1016/j.postharvbio.2009.02.004
Ogawa, T., and Adachi, S. (2014). Measurement of moisture profiles in pasta during rehydration based on image processing. Food Bioprocess. Technol. 7, 1465–1471. doi: 10.1007/s11947-013-1156-y
Onwude, D. I., Hashim, N., Janius, R. B., Nawi, N., and Abdan, K. (2016). Modelling the convective drying process of pumpkin (Cucurbita moschata) using an artificial neural network. Int. Food Res. J. 23.
Perez, N. E., and Schmalko, M. E. (2009). Convective drying of pumpkin: influence of pretreatment and drying temperature. J. Food Process. Eng. 32, 88–103. doi: 10.1111/j.1745-4530.2007.00200.x
Proietti, N., Adiletta, G., Russo, P., Buonocore, R., Mannina, L., Crescitelli, A., et al. (2018). Evolution of physicochemical properties of pear during drying by conventional techniques, portable-NMR, and modelling. J Food Eng. 230, 82–98. doi: 10.1016/j.jfoodeng.2018.02.028
Que, F., Mao, L., Fang, X., and Wu, T. (2008). Comparison of hot air-drying and freeze-drying on the physicochemical properties and antioxidant activities of pumpkin (Cucurbita moschata Duch.) flours. Int. J. Food Sci. Technol. 43, 1195–1201. doi: 10.1111/j.1365-2621.2007.01590.x
Ramos-Cabrer, P., Van Duynhoven, J. P., Timmer, H., and Nicolay, K. (2006). Monitoring of moisture redistribution in multicomponent food systems by use of magnetic resonance imaging. J. Agric. Food Chem. 54, 672–677. doi: 10.1021/jf052246z
Srikiatden, J., and Roberts, J. S. (2007). Moisture transfer in solid food materials: a review of mechanisms, models, and measurements. Int. J. Food Prop. 10, 739–777. doi: 10.1080/10942910601161672
Takano, H., Naito, S., Ishida, N., Koizumi, M., and Kano, H. (2002). Fermentation process and grain structure of baked breads from frozen dough using freeze-tolerant yeasts. J. Food Sci. 67, 2725–2733. doi: 10.1111/j.1365-2621.2002.tb08805.x
Troutman, M. Y., Mastikhin, I. V., Balcom, B. J., Eads, T. M., and Ziegler, G. R. (2001). Moisture migration in soft-panned confections during engrossing and aging as observed by magnetic resonance imaging. J. Food Eng. 48, 257–267. doi: 10.1016/S0260-8774(00)00167-9
Wang, S., Lin, Z., Xia, K., Li, Y., and Tan, M. (2017). Dynamics of water mobility and distribution in Sur clam (Mactra chinensis) during dehydration and rehydration processes assessed by low-field NMR and MRI. J. Food Meas. Charact. 11, 1342–1354. doi: 10.1007/s11694-017-9512-7
Weglarz, W. P., Hemelaar, M., van der Linden, K., Franciosi, N., van Dalen, G., Windt, C., et al. (2008). Real-time mapping of moisture migration in cereal based food systems with Aw contrast by means of MRI. Food Chem. 106, 1366–1374. doi: 10.1016/j.foodchem.2007.04.077
Keywords: MRI, T2, pumpkin, drying, drying kinetics, shrinkage
Citation: Ripoli C, Adiletta G, Russo P, Funicello N, Iannone G, Di Matteo M and De Pasquale S (2021) Study of Pumpkin Drying Through Magnetic Resonance Imaging. Front. Sustain. Food Syst. 5:644829. doi: 10.3389/fsufs.2021.644829
Received: 21 December 2020; Accepted: 26 February 2021;
Published: 26 March 2021.
Edited by:
Mohammad U. H. Joardder, Rajshahi University of Engineering & Technology, BangladeshReviewed by:
Gülşah Çalişkan Koç, Adnan Menderes University, TurkeyBeatriz Mello, Federal University of São Carlos, Brazil
Copyright © 2021 Ripoli, Adiletta, Russo, Funicello, Iannone, Di Matteo and De Pasquale. This is an open-access article distributed under the terms of the Creative Commons Attribution License (CC BY). The use, distribution or reproduction in other forums is permitted, provided the original author(s) and the copyright owner(s) are credited and that the original publication in this journal is cited, in accordance with accepted academic practice. No use, distribution or reproduction is permitted which does not comply with these terms.
*Correspondence: Paola Russo, cGFvbGEucnVzc29AdW5pcm9tYTEuaXQ=