 Dajun Yu1
 Tiantian Lin1
 Kemper Sutton2
 Nick Lord3
 Renata Carneiro1Qing Jin1
 Bo Zhang3Thomas Kuhar2
 Steven Rideout3
 Jeremy Ross4
 Susan Duncan1
 Yun Yin1Hengjian Wang1
 Haibo Huang1*
- 1Department of Food Science and Technology, Virginia Tech, Blacksburg, VA, United States
- 2Department of Entomology, Virginia Tech, Blacksburg, VA, United States
- 3School of Plant and Environmental Sciences, Virginia Tech, Blacksburg, VA, United States
- 4Department of Crop, Soil, and Environmental Sciences, Cooperative Extension Service, University of Arkansas, Little Rock, AR, United States
The consumption of edamame [Glycine max (L.) Merr.] in the US has rapidly increased due to its nutritional value and potential health benefits. In this study, 10 edamame genotypes were planted in duplicates in three different locations in the US—Whitethorne, Virginia (VA), Little Rock, Arkansas (AR), and Painter, VA. Edamame samples were harvested at the R6 stage of the bean development when beans filled 80–90% of the pod cavity. Afterward, comprehensive chemical composition analysis, including sugars, alanine, protein, oil, neutral detergent fiber (NDF), starch, ash, and moisture contents, were conducted on powdered samples using standard methods and the total sweetness was calculated based on the measured sugars and alanine contents. Significant effects of the location were observed on all chemical constituents of edamame (p < 0.05). The average performance of the genotypes was higher in Whitethorne for the contents of free sucrose (59.29 mg/g), fructose (11.42 mg/g), glucose (5.38 mg/g), raffinose (5.32 mg/g), stachyose (2.34 mg/g), total sweetness (78.63 mg/g), and starch (15.14%) when compared to Little Rock and Painter. The highest soluble alanine (2.67 mg/g), NDF (9.00%), ash (5.60%), and moisture (70.36%) contents were found on edamame planted in Little Rock while edamame planted in Painter had the highest crude protein (43.11%) and oil (20.33%) contents. Significant effects of genotype were observed on most of the chemical constituents (p < 0.05) except NDF and raffinose. Among the 10 genotypes, R13-5029 consistently had high sucrose content and total sweetness across the three locations, meanwhile it had relatively high protein and fiber contents. Overall, the results indicate that to breed better edamame genotypes in the US, both genotype and planting location should be taken into considerations.
Introduction
Edamame, more commonly referred to as “vegetable or edible soybean” in the US and mao dou in China, belongs to the same species as grain soybean [Glycine max (L.) Merr.]. It is an important vegetable in Asia and has been widely consumed in China and Japan for centuries as a snack or side dish (Zeipina et al., 2017; Lara et al., 2019). In the US, consumption of edamame has been increasing, and it has become the second most highly consumed soy-food after soymilk because it is both nutritious and has potential health benefits (Zeipina et al., 2017). However, more than 70% of the edamame consumed in the US market is imported from overseas. Although there are several edamame lines, such as UA Kirksey and UA Mulberry, developed for US domestic production (Chen et al., 2017), it is still critically needed to continuously breed elite US edamame genotypes with high nutritional value and consumer acceptance to meet the ever-increasing market demand.
The increasing popularity of edamame is primarily due to its nutritional value and health benefits. The nutritional value of edamame is mainly determined by its chemical constituents, such as protein, fiber, starch, and sugars. It was reported that edamame is highly nutritious because of the content of high-quality protein with isoflavones (Zeipina et al., 2017). Edamame is also a good source of dietary fiber when supplemented in the diet (Johnson et al., 1999; Xu et al., 2012). Dietary fiber could help reduce blood cholesterol levels because of its viscosity, solubility, and ability to adsorb/bind molecules (Lin et al., 2020). Moreover, edamame contains a significant amount of health-promoting polyunsaturated fatty acids, such as linoleic acid and α-linolenic acid (Kumar et al., 2006a). In addition, edamame is a good source of vitamins (C, E, and thiamin), minerals, phytochemicals, and other active compounds (Johnson et al., 1999; Song et al., 2003; Kaiser and Ernst, 2013; Zeipina et al., 2017). With these superior nutritional constituents, edamame has potential health benefits to help reduce the risk of many diseases, such as cardiovascular disease, cancer, and osteoporosis (Sirtori, 2001).
Besides nutrition, sensory attributes are also important for consumer acceptance of edamame. Compared to soybean, edamame is slightly sweeter, has a softer texture, and a less beany and nutty flavor (Konovsky et al., 1994). Sweetness is one of the most important sensory attributes of edamame and is a primary indicator of edamame quality (Johnson et al., 1999). Carneiro et al. (2020) reported that sweetness is considered a major sensory attribute that leads to higher consumer acceptability. The sweetness of edamame is mainly determined by soluble sugars including sucrose, glucose, and fructose (Konovsky et al., 1994; Song et al., 2013; Zeipina et al., 2017). Alanine, which has a sweet taste, also contributes to sweetness (Kirimura et al., 1969). Therefore, identification edamame with higher soluble sugars and alanine levels to the market may increase the popularity of domestically produced edamame.
Many studies have been conducted to analyze the seed composition of soybeans but very few studies have specifically investigated the chemical composition of edamame. Recently, Jiang et al. (2020) evaluated the chemical composition (e.g., protein, oil, and sugar) of different edamame genotypes, which is essential for edamame research and breeding. However, planting location, another important factor to consider for producing edamame, was not considered in the Jiang et al. (2020) study. Previous studies have shown that the planting location often had a greater influence on the chemical composition of crops [e.g., peanut (Arachis hypogaea L.), amaranth (Amaranthus cruentus)] than genotype (Eheart et al., 1955; Berganza et al., 2003). Sakla et al. (1988) have evaluated the environmental effects on the chemical composition of three soybean varieties. The results showed that significantly different moisture, oil, carbohydrates, sucrose, and protein contents were due to the localities. No significant difference was observed on fiber and ash contents among different varieties and locations. The effects of environmental conditions on the chemical composition of soybean seeds were also reported in other literature (Cartter et al., 1942; McClure et al., 2017). However, Cartter et al. (1942) reported that varieties played a more important role in affecting the chemical composition of soybean seed in their studies compared to locations. Moreover, it is important to identify genotypes that can perform well at different locations. Besides chemical composition, it is also important to investigate the sweetness of edamame in order to breed edamame with high sensory attributes and thus increased consumer acceptance. Therefore, the objective of this study is to systematically evaluate the chemical composition and sweetness of 10 selected edamame genotypes grown in three locations in the US. Three soluble sugars (sucrose, fructose, and glucose) and free alanine were quantified to estimate edamame sweetness. Comprehensive chemical compounds including oligosaccharides (raffinose and stachyose), crude protein, oil, starch, moisture content of fresh beans, neutral detergent fiber (NDF), and ash content were also determined to build a complete chemical composition profile of the edamame and the data was used to observe the effect of planting location and genotype.
Materials and Methods
Plant Materials, Sample Pre-treatments, Chemicals, and Reagents
One commercial check (cultivar UA-Kirksey) and nine edamame breeding lines were planted in late May 2018 at three locations—Virginia Tech's Kentland Farm in Whitethorne VA, University of Arkansas Research Farm in Little Rock AR, and Virginia Tech's Eastern Shore Agricultural Research and Extension Center in Painter VA. All genotypes are from the maturity group V. The names of the selected genotypes are R13-5029, R14-6450, V10-3653, V13-0329, V13-0339, V13-1644, V15-0396, V16-0523, and V16-0547. Each genotype was grown in two replications and the plots were arranged in a randomized complete block design (RCBD). Each plot was 6.10 m long, 0.75 m inter-row spacing and a seeding rate of 20 seeds per m. Half pound of edamame pods was manually harvested at the R6 stage of soybean development when beans filled 80–90% of the pod cavity. Edamame samples were stored in coolers filled with ice bags and transferred to the food processing pilot plant at Virginia Tech (Whitethorne, VA, USA) for processing. The pods were blanched in boiling water (98.3 ± 0.1°C) for 1 min to inactivate enzymes and decrease the microbial load (Pao et al., 2008; Xu et al., 2012). Blanched samples were immediately cooled in an ice-water bath for 2 min to avoid overcooking (4.5 ± 0.5°C) and then dried with a paper towel until no flowing water was observed. Afterward, the beans were shelled out manually and stored at −80°C. Frozen beans were freeze-dried and then milled by an IKA MF 10 Basic Microfine Grinder (IKA®-Werke GmbH & Co. KG, Germany) and passed through a 500 μm sieve. All chemical standards (sugars and alanine) and sodium tetraborate decahydrate (Na2B4O7·10H2O) were purchased from Sigma-Aldrich (St. Louis, MO, USA). AdvanceBio AAA standards and reagents kit was purchased from Agilent for alanine analysis. The rest of the chemicals used in this study were purchased from Fisher Scientific (Hampton, NH, USA).
Free Sugars, Alanine, and Sweetness
Free Sugars and Free Alanine
The extraction of free sugars (sucrose, fructose, glucose, raffinose, and stachyose) and free alanine in edamame was conducted based on the method reported by Yu et al. (2016) and Machado et al. (2020), with some adjustments. Briefly, 1.5 mL of deionized water and 0.15 g of dry powdered edamame were mixed in a 2 mL centrifuge tube. The tube was placed on a tube revolver (Thermo ScientificTM, Waltham, MA, USA) and shaken for 2 h at room temperature, followed by centrifugation at 13,500 × g for 10 min. Afterward, 750 μL acetonitrile was added to 750 μL of the supernatant for purification. The mixture was shaken at room temperature for 10 min, and then centrifugated at 13,500 × g for 10 min. After centrifugation, 750 μL of the supernatant was filtered through a 0.2-μm membrane disc filter into a 1.5-mL HPLC vial and sugar content was determined using high-performance liquid chromatography (HPLC, 1260 Infinity II, Agilent Technologies, Santa Clara, CA, USA) equipped with a refractive index detector (RID). The Luna Omega 3 μm SUGAR column (150 × 4.6 mm, Phenomenex, Torrance, CA, USA) was used to separate different sugars. The column temperature was set at 40°C with a flow rate of 1.0 mL/min. The mobile phase was a mixed solution of acetonitrile/water (75:25 v: v) and the injection volume was 5 μL. The measurement of alanine content was conducted according to an application developed by Agilent (Palaniswamy, 2017) using the HPLC. Derivatization was done automatically by an autosampler using chemicals in the Agilent AdvanceBio AAA standards and reagents kit (p/n 5190-9426). The injection volume was 1.0 μL and alanine was separated in an Agilent AdvanceBio AAA C18 column, 4.6 × 100 mm, 2.7 μm, (40°C) at a flow rate of 1.5 mL/min with a gradient program. Mobile phase A contained 10 mM Na2HPO4, and 10 mM Na2B4O7 at pH of 8.2, while the mobile phase B was the mixed solution of acetonitrile, methanol, and water (45:45:10, v: v: v). Eluted alanine from the column was detected by a diode array detector at λ = 338 nm.
Sweetness
Sucrose, glucose, fructose, and alanine all contribute to the sweetness of edamame; therefore, all of them should be taken into consideration when determining edamame sweetness (Monteiro et al., 2007; Saldivar et al., 2010). Because sucrose, glucose, fructose, and alanine have different sweetness intensities, sucrose is commonly used as a reference to compare the sweetness intensities of different sugars and its sweetness is set at 1.00 (Brady, 2013). The relative sweetness (RS) of glucose, fructose, and alanine to the same concentration of sucrose is 0.40 – 0.79 (Brady, 2013), 1.00 – 1.75 (Brady, 2013), and 0.93 – 1.70 (Cameron, 1945) respectively. Thus, edamame sweetness was calculated using the following equation based on the concentrations and averaged relative sweetness of different sugars:
where C represented the concentration (mg/g) and RS was the average of the highest RS and the lowest RS of each sugar and alanine.
Protein, Oil, Neutral Detergent Fiber (NDF), Starch, Ash, and Moisture
The Kjeldahl method was used to measure the nitrogen content in edamame and the protein content was calculated by multiplying with a conversion factor of 6.25 (AOAC, 2005a). The oil in the edamame was extracted using petroleum ether, and its content was measured according to AOAC 2003.05 (AOAC, 2005b). The NDF in edamame was measured by the ANKOM fiber analyzer (ANKOM Technology, Macedon, NY, USA). In brief, the non-fiber component in 0.5 g of dry sample powder in a filter bag was washed out by a neutral detergent solution in the fiber analyzer. The dry weight after digestion was used to calculate the NDF content (Yu et al., 2020 and Ohair et al., 2020). To measure the ash content, edamame powder was placed in a muffle furnace at 550°C and burned for 12 h according to AOAC 942.05 (AOAC, 2005c; He et al., 2019). Starch content was determined using the method described by Vidal et al. (2009) by measuring hydrolyzed glucose by HPLC with RID using Bio-Rad Aminex HPX-87H (Bio-Rad Laboratories, Hercules, CA, USA). Except for the moisture content measurement, chemical composition analysis was conducted on powdered edamame samples prepared in section Plant Materials, Sample Pre-treatments, Chemicals, and Reagents and reported on a dry matter basis. To measure the moisture content, fresh beans were dried in an oven at 105°C until the weight was constant. Moisture content was calculated based on the weight difference before and after drying and reported on a wet matter basis.
Statistical Analysis
All measurements were conducted on biological replicates of edamame and results were presented as means ± standard deviation (n = 2). Pearson's correlation analysis between each of the free sugars and total sweetness was conducted using GraphPad Prism (8.3.0, GraphPad Software, San Diego, CA, USA). Two-way ANOVA was performed to test the significant effects of genotype, location, and genotype × location on each of the chemical constituents, followed by a post-hoc Tukey's HSD (Honestly Significant Difference) for a pair-wise comparison of means using the statistical software SPSS (22.0.0.0, IBM Corporation, Armonk, NY, USA). The statistical significance level was 0.05 (p < 0.05). Principle component analysis (PCA) was conducted by MATLAB (R2020a, MathWorks, Natick, MA, USA).
Results and Discussions
Free Sugars, Alanine, and Total Sweetness
Free Sugars
The free sugars, including sucrose, fructose, and glucose, predominately decide the sweetness of edamame (Song et al., 2013). Sucrose was the most abundant soluble sugar in edamame and there was considerable variation in the sucrose content among samples (Table 2). Significant effects of genotype, location, and their interaction (genotype × location) were observed (Table 1). The edamame planted in Whitethorne had an average sucrose content of 59.29 mg/g, which was much higher than the samples planted in Little Rock (42.82 mg/g) and Painter (40.60 mg/g). Different temperatures could be a reason for the higher sucrose content of edamame planted in Whitethorne. Wolf et al. (1982) and Kumar et al. (2010) reported that increased temperature during seed development led to decreased sucrose content of soybean seeds. The average temperatures in Whitethorne from June to October were 8–9°C lower than the average temperatures in Little Rock and 3–6°C lower than the average temperatures in Painter. Besides temperature, soil types and properties, daylight intensity, and precipitation could also be reasons for the variation in sucrose content. Nutrients and pH differ among different soils and they might lead to sucrose variations in crops. Zhao-Hui et al. (2008) reported that soil containing a higher level of potassium (K) led to a higher soluble sugar content in kidney beans. In the study of McEnroe and Coulter (1964), increasing soil pH from 6 to 7 lead to an increased sugar content in sugar beet. The light intensity affects the photosynthesis rate and thus the sugar content of vegetable crops. Xu et al. (2009) reported a positive correlation between light intensity and soluble sugar contents in non-heading Chinese cabbage. The same trend was also reported by Yang et al. (2009) that soluble sugars in pepper fruits decreased with decreasing light intensity. Precipitation can also lead to water stress or flooding which potentially affect sugar contents in crops. Under appropriate water stress, plants tend to accumulate soluble sugars to adjust their osmotic pressure. Okunlola et al. (2016) investigated the total sugar accumulation of three pepper varieties under water stress and observed higher total sugar contents in pepper with less irrigation. Flooding will cause soil nutrients loss and then affect the sugar contents in the vegetables (Clark, 2020).
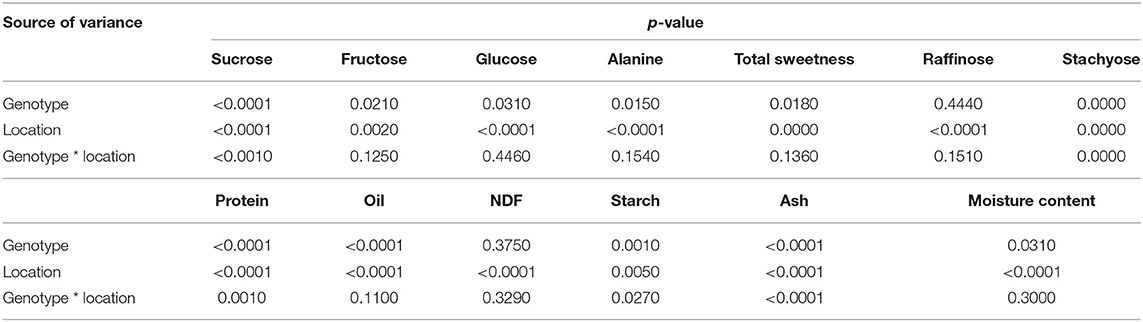
Table 1. p-values of the two-way ANOVA for all compositions.
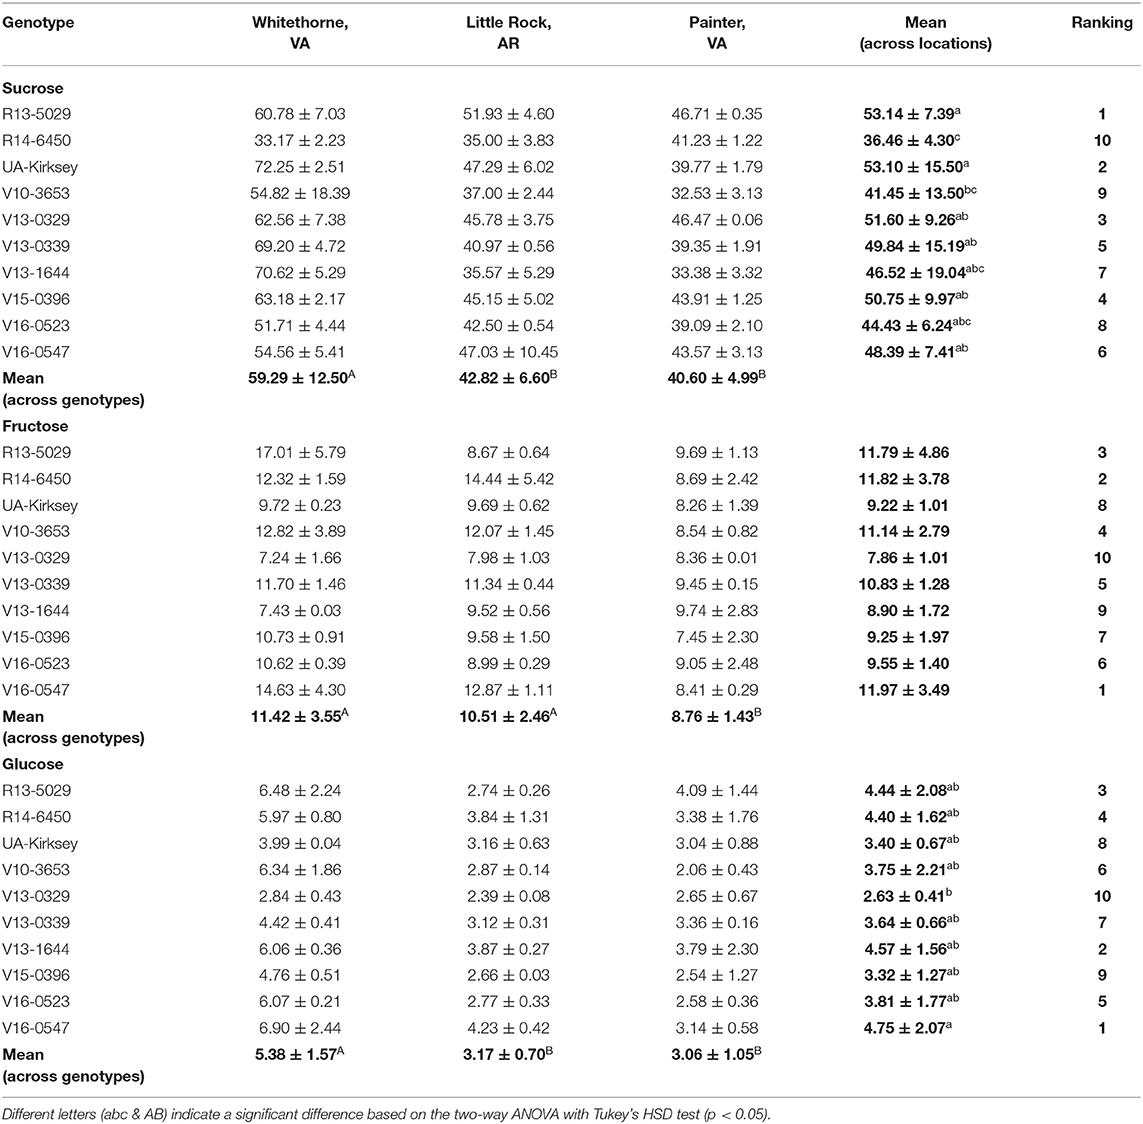
Table 2. Sucrose, fructose, and glucose contents (mg/g dry matter) of 10 edamame genotypes planted in three locations.
On average, R13-5029 had the highest sucrose content (53.14 mg/g) while R14-6450 and V10-3653 had the lowest sucrose content among all genotypes (36.46 and 41.45 mg/g, respectively). The highly significant effect of genotype × location indicated that genotypes ranked differently among themselves from location to location for sucrose content. In Whitethorne, the check cultivar UA-Kirksey had the highest sucrose content (72.25 mg/g) followed by genotype V13-1644 (70.62 mg/g) and V13-0339 (69.20 mg/g). In Little Rock, R13-5029 had the highest sucrose content of 51.93 mg/g and R14-6450 had the lowest sucrose content of 35.00 mg/g. In Painter, genotype R13-5029 had the highest sucrose content of 46.71 mg/g while V10-3653 had the lowest sucrose content (32.53 mg/g). Overall, genotype, location, and their interaction all had a significant influence on sucrose content.
The contents of fructose and glucose were lower than the content of sucrose in edamame (Table 2). Fructose and glucose contents were affected by location. Edamame planted in Whitethorne had the highest average fructose and glucose contents (11.42 and 5.38 mg/g, respectively) followed by the samples planted in Little Rock (10.51 and 3.17 mg/g) and Painter (8.76 and 3.06 mg/g). Although significant differences in fructose and glucose contents were observed among the three locations, these differences were relatively small compared to those in sucrose.
Alanine
Alanine also tastes sweet and contributes to the sweetness of edamame. The alanine contents of different edamame genotypes planted in different locations are listed in Table 3. The alanine contents were much lower than the free sugar contents in edamame. The overall range of alanine was 0.15 – 3.47 mg/g. This result was consistent with a previous study in which the authors reported a low alanine content range of 0.21 – 1.76 mg/g in edamame (Song et al., 2013). The variation in alanine content was mainly due to location—the edamame planted in Little Rock had a high average alanine content of 2.67 mg/g across genotypes, whereas the edamame planted in Painter and Whitethorne had relatively low average alanine contents of 1.87 and 0.43 mg/g, respectively. Significant effect of genotype on alanine was observed (Table 1) but no significant difference was found among different genotypes (Table 3).
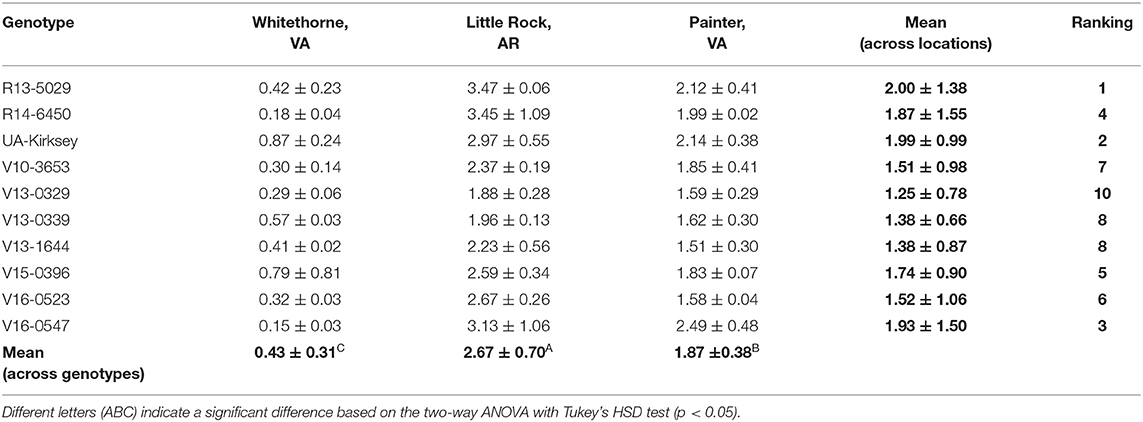
Table 3. Alanine contents (mg/g dry matter) of 10 edamame genotypes planted in three locations.
Total Sweetness
The total sweetness of edamame was calculated based on the concentrations of sugars and alanine and their relative sweetness to sucrose. The total sweetness of the 10 edamame genotypes at three locations is shown in Table 4. Location has a profound and significant effect on the total sweetness. Edamame samples planted in Whitethorne had the highest sweetness among the three locations. Therefore, locations having similar weather and soil type to Whitethorne could be considered for producing sweet edamame. It is worth noting that the genotype R13-5029 performed consistently well in all three locations—it ranks third, second, and first in total sweetness in Whitethorne, Little Rock, and Painter, respectively. The mean sweetness of R13-5029 across the three locations was 73.74 mg/g dry matter, higher than that of check cultivar UA-Kirksey (69.52 mg/g). Meanwhile, the genotype V16-0547 and V15-0396 also performed relatively well in all three locations and had the mean sweetness of 69.35 and 66.95 mg/g dry matter across the three locations. Therefore, these three top genotypes (R13-5029, V16-0547, and V15-0396) are the potential candidates for developing edamame with a high sweet taste. Overall, to breed sweeter edamame, both location and genotype need to be considered. Moreover, Pearson's correlation analysis between each of the free sugars (and alanine) and total sweetness showed that the sucrose content is strongly correlated with the total sweetness with a high correlation coefficient (r) of 0.94, whereas the r values between the fructose, glucose, and alanine content and the total sweetness were 0.44, 0.62, and−0.42, respectively. Therefore, in the future, it is recommended that studies with limited resources could infer total sweetness just based on the sucrose content measurement.
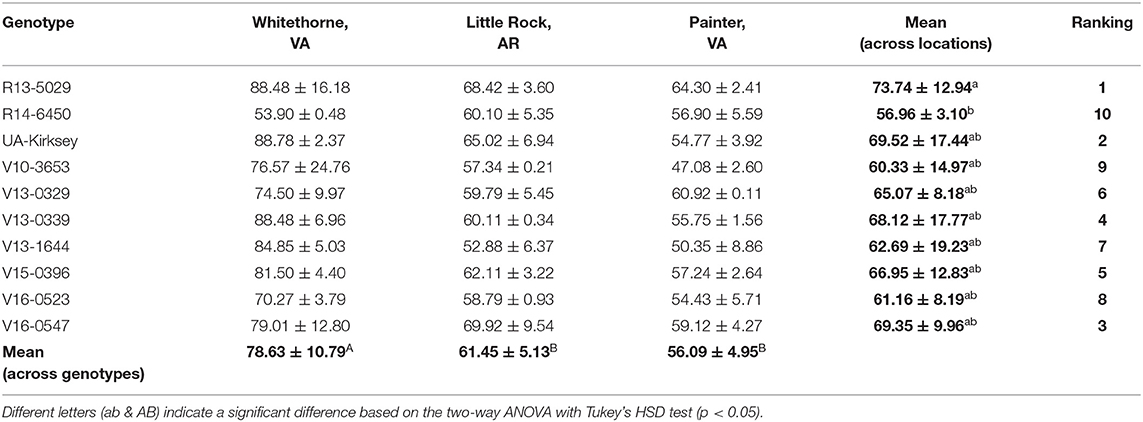
Table 4. Total sweetness (equivalent mg sucrose/g dry matter) of 10 different edamame genotypes planted in different locations.
Raffinose and Stachyose
Raffinose and stachyose belong to the raffinose family oligosaccharides (RFOs) and they are also important free sugars in edamame (Kumar et al., 2010). RFOs cannot be digested in the human gastrointestinal tract. When passed to the lower gut, their fermentation by intestinal microflora creates flatulence-inducing gases and leads to abdominal discomfort or even diarrhea (Kumar et al., 2010). Therefore, edamame genotypes with low levels of RFOs are usually desired. In this study, the raffinose contents of edamame were at the same level as glucose, and the stachyose content was closer to alanine. The variance analysis showed that location had a significant effect on both the raffinose and stachyose contents while genotype only affected the stachyose content (Table 1). Most of the samples in Little Rock and Painter did not have detectable stachyose (Table 5). Samples planted in Whitethorne had the highest raffinose and stachyose contents (5.32 and 2.34 mg/g, respectively) among the three locations. Compared to the study of Xu et al. (2016), the genotypes in this study had similar raffinose and stachyose contents with the genotype Asmara (4.6 and 1.1 mg/g) but higher raffinose and stachyose contents than the genotype Mooncake (1.6 and 0.7 mg/g). It is interesting to note that the raffinose and stachyose contents are positively correlated with sucrose, fructose and glucose contents (further illustrated in Figure 1). For example, the genotype R13-5029 had higher sucrose, fructose and glucose contents, and its raffinose and stachyose contents were also high. V15-0396 and V16-0547 also had relatively high raffinose content and detectable stachyose compared to UA-Kirksey. Therefore, if breeders want to select genotypes with high fructose and glucose contents, these genotypes will potentially have high raffinose and stachyose contents. It was reported that a person weighing 60 kg can consume as much as 38.4 g (male) or 57.6 g (female) of soybean oligosaccharides without any gastrointestinal troubles (Hata et al., 1991). Therefore, the genotypes used in this study are unlikely to cause diarrhea due to the low content of oligosaccharides. It would be meaningful to investigate which of raffinose and stachyose leads to more severe abdominal discomfort, however, this information is not readily available. Future research might be needed to provide this information.
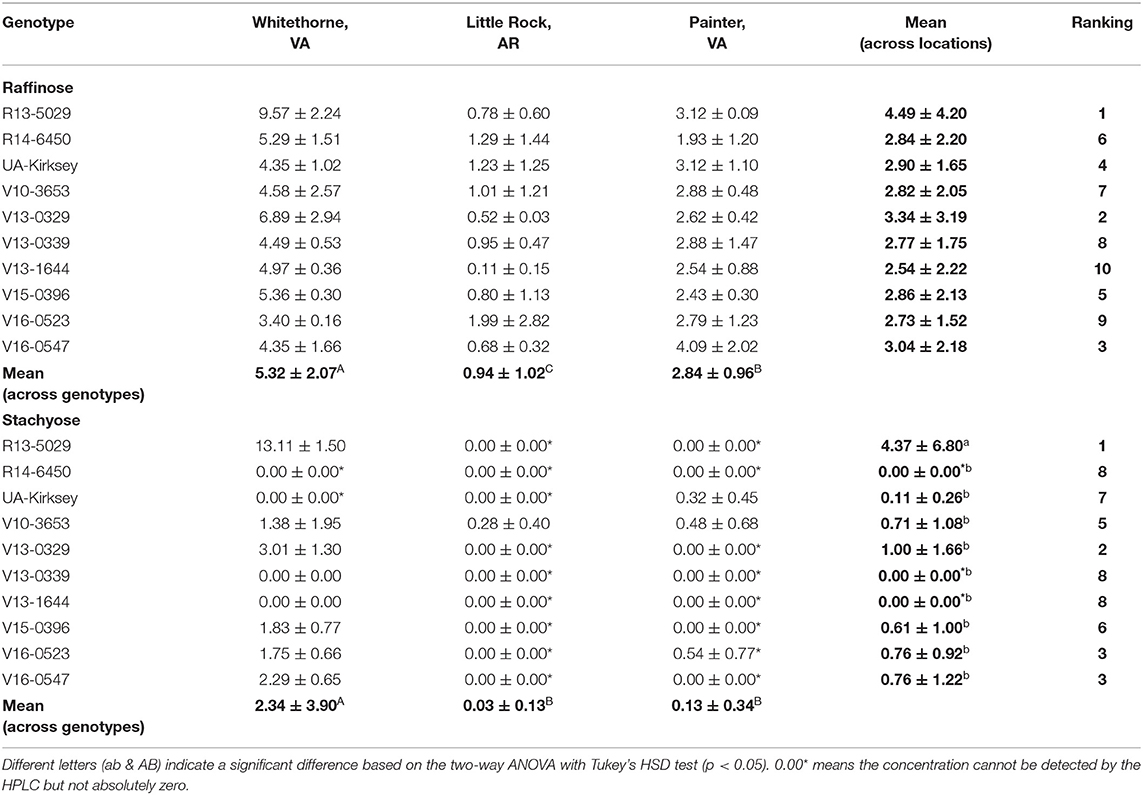
Table 5. Raffinose and stachyose contents (mg/g dry matter) of 10 edamame genotypes planted in different locations.
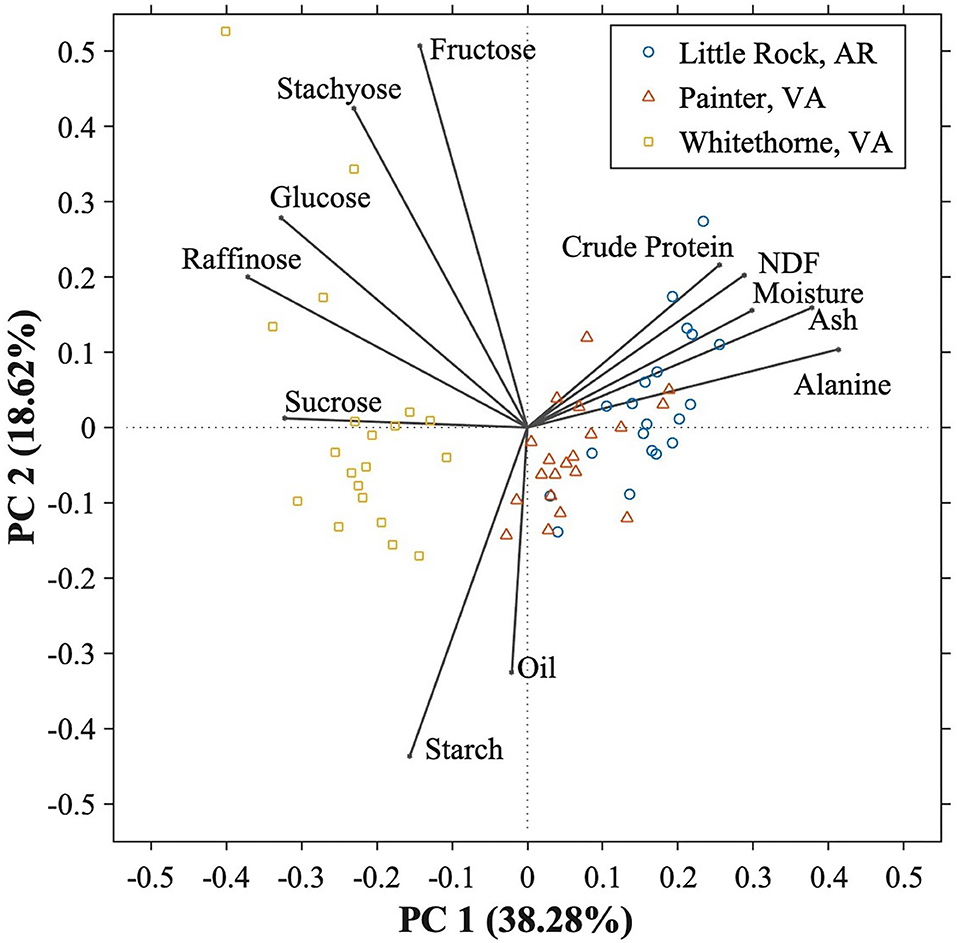
Figure 1. Principal component analysis (PCA) score plot and the component loading plot of PC1 vs. PC2 of the 10 different edamame genotypes planted in three different locations.
Other Chemical Compositions
Crude Protein
Protein is one of the most important constituents in edamame. The high-quality protein in edamame makes it a good alternative diet for vegans and vegetarians, thus, higher protein content is usually desired (Zeipina et al., 2017). In this study, the protein content ranged from 38.77 to 45.57% based on dry mass. This result is consistent with the study of Guo et al. (2020), in which the protein content of edamame ranged from 36 to 45%. The protein content in edamame was significantly affected by location (Tables 1, 6). The edamame planted in Painter and Little Rock had higher average protein content (43.11% and 42.47%, respectively) than the samples planted in Whitethorne (41.01%). The temperature could be a potential reason for protein variation. According to a previous study conducted by Wolf et al. (1982), protein content in soybean seeds increased when the day temperature was higher than 30°C. Increased protein content under higher temperatures has also been observed in a second study (Dornbos and Mullen, 1992). In our study, there were 81 days in Little Rock and 77 days in Painter between June and October had the highest temperature over 30°C compared to 25 days in Whitethorne, which could partially explain the high protein contents of edamame planted in Little Rock and Painter. Genotype also significantly influenced protein content. Among the 10 genotypes, UA-Kirksey had the highest mean protein content across locations (44.31%) while V13-0339 had the lowest protein content (40.26%). Regarding the top genotypes which had high sweetness, R13-5029 and V16-0527 had relatively high protein contents of 42.1 and 42.5%, respectively, while V15-0396 had a slightly lower protein content (41.0%) than R13-5029 and V16-0527. Genotype × location interaction also had a significant effect on protein content indicating that these genotypes ranked differently in protein content across the three locations.
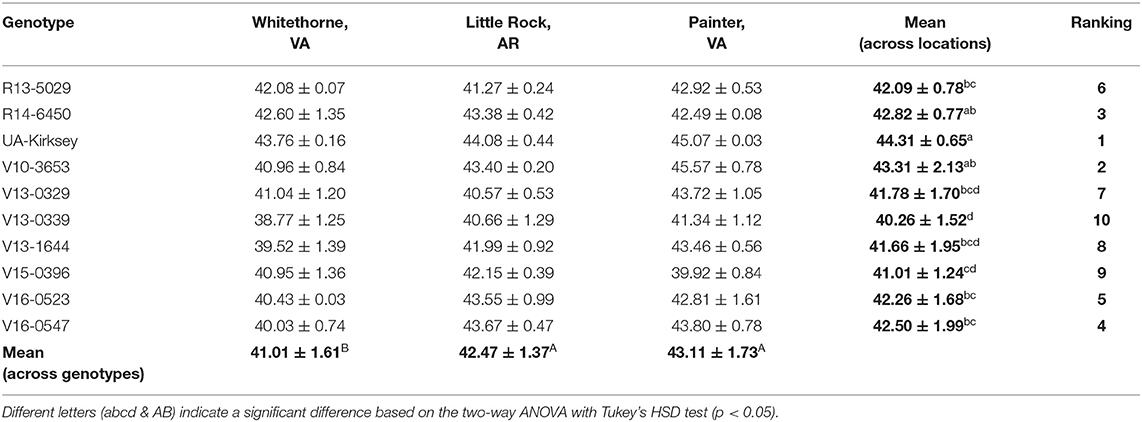
Table 6. Crude protein contents [%, dry basis (d.b.)] of 10 edamame genotypes planted in different locations.
Oil
The oil content of edamame ranged from 17.37 to 21.61% depending on different genotypes (Table 7). In a previous study, Xu et al. (2016) reported that the oil contents of two edamame varieties (Asmara and Mooncake) were between 17.2 and 18.9% when they were harvested at R6 stage. Unlike soybeans with their desirable higher oil content for vegetable oil and soy-diesel, a lower oil content is usually preferred for soy food products including edamame (Zhang et al., 2017). Location also had a significant effect on oil content (Table 1). The highest oil content was observed on V13-0339 in Painter and the lowest oil content was found on UA-Kirksey in Little Rock. Averaged across all genotypes, the edamame planted in Painter had the highest oil content (20.33%), and V13-1644 had the highest oil content when averaged across all three locations (20.91%). For the three top genotypes based on the sweetness, R13-5029 had a mean oil content of 18.76%, which is comparable to the mean oil content (18.66%) of the cultivar check UA-Kirksey. Genotypes V16-0547 and V15-0396 had mean oil contents of 19.15 and 18.99%, slightly higher than that of UA-Kirksey. The significant effects of planting environment and genotype and their interaction on the oil content of soybean seeds were observed in the studies of Kumar et al. (2006b) and Arslanoglu et al. (2011). However, in our study, no significant effect of genotype × location interaction was observed on the oil content, indicating that genotypes ranked similarly among themselves from location to location (Table 1).
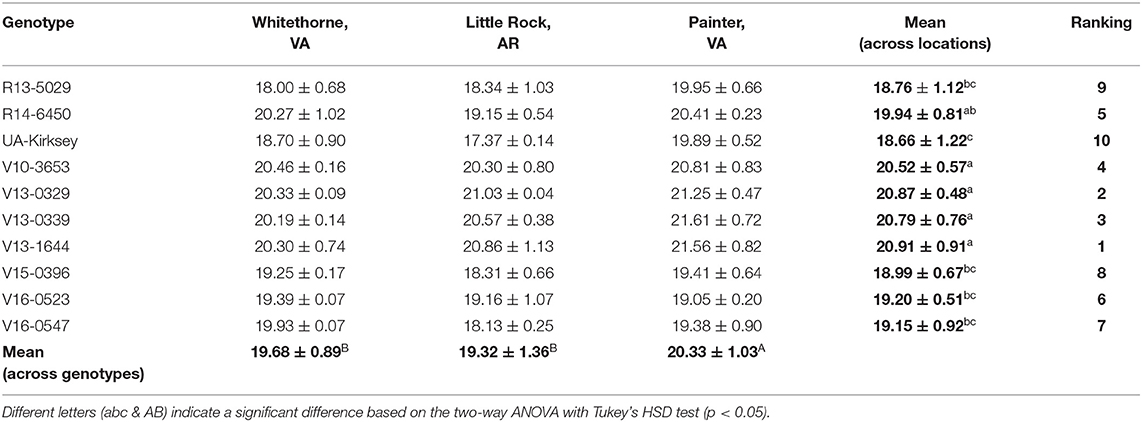
Table 7. Oil contents (%, d.b.) of 10 edamame genotypes planted in different locations.
Starch
Starch is the main carbohydrate in plant storage organs (Stevenson et al., 2006), but it is not well-studied in soybean or edamame because of its relatively low content and because soybean is usually considered as a protein and oil crop. Immature soybean usually has a starch content of 10–15% on a dry matter basis. The starch content of edamame in this study ranged from 11.99 to 16.58%, with the genotype V13-0339 planted in Whitethorne having the highest and V10-3653 planted in Little Rock the lowest (Table 8). Averaged across all genotypes, edamame planted in Whitethorne had the highest starch content (15.14%) and those planted in Painter had the lowest (14.15%). This observation is similar to the observation that edamame planted in Whitethorne had the highest sugar (sucrose, glucose, and fructose) content and those in Painter had the lowest sugar content. Averaged across all locations, genotype V13-0339 had the highest (15.60%) and V10-3653 had the lowest (13.06%) starch content. The two top genotypes R13-5029 and V16-0547 had a lower starch content of 13.42 and 14.59% than that of the check cultivar (14.92%). V15-0396 had a higher starch content (15.17%) than the check cultivar.
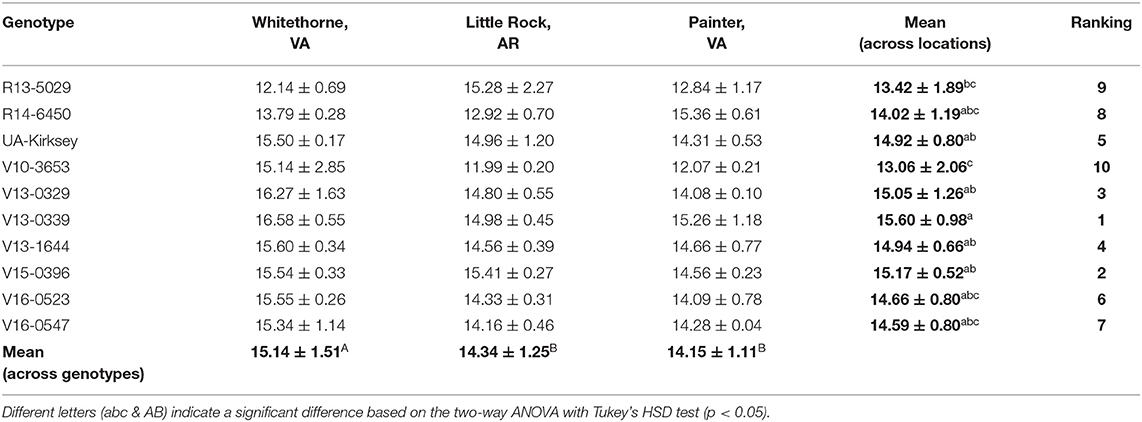
Table 8. Starch contents (%, d.b.) of 10 edamame genotypes planted in different locations.
Neutral Detergent Fiber (NDF)
Besides protein, oil, and starch, edamame also offers a good source of fiber. The NDF content of edamame in this study ranged from 7.14 to 9.81% (Table 9). This range was consistent with one previous study in which the authors reported a fiber content range of 6.7–10.7% in soybean seeds (Ciabotti et al., 2016). The fiber content of soybean seeds in another study was slightly lower, between 5.53 and 8.04% (Jiang et al., 2018). The highest NDF content was observed on genotype V13-1644 planted in Little Rock while the lowest NDF content was found on genotype V16-0547 planted in Whitethorne. Location had a significant effect on edamame NDF content (Table 1). Averaged across the genotypes, edamame planted in Little Rock had significantly higher NDF contents (9.00%) than samples harvested in Whitethorne (7.96%) and Painter (8.39%). The significant effect of genotype on the NDF content was not observed, probably because the genotypes chosen in this study were not genetically distant enough. In the future, more genotypes with a wide genetic distance should be included for identifying edamame with significantly higher fiber content. With the ever-increasing attention to the health benefits of fiber intake, edamame with a high fiber content is desired in the market as a health-promoting food. According to FDA regulations, a food product must contain over 10% of the Recommended Daily Intake (RDI) for fiber per serving to be claimed as a “good source” of fiber. Considering that the RDI for fiber is 25 grams per day and a typical serving size of edamame is 100 g (wet weight), edamame can be claimed as a good source of fiber if it contains at least 2.5 g fiber per 100 g of wet weight. In this study, all three top genotypes (R13-0529, V15-0396, and V16-0547) can be claimed as a “good source” of fiber according to the calculations of the fiber content on a wet basis.
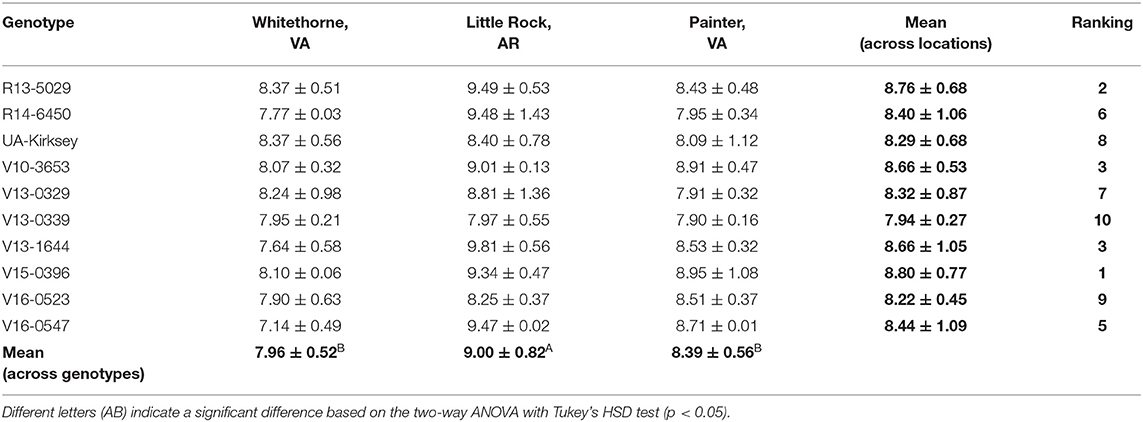
Table 9. Neutral detergent fiber contents (%,d.b.) of 10 edamame genotypes planted in different locations.
Ash
Ash has the lowest chemical composition except for oligosaccharides and alanine. Xu et al. (2016) has analyzed the ash contents of edamame samples over bean development and the ash content range was between 3.58 and 5.49%. In this study, the ash content range was from 4.29 to 5.83% (Table 10). The highest ash content was observed on V10-3653 in Little Rock and the lowest was found on V13-0339 planted in Whitethorne. Genotype, location, and their interaction all had a significant effect on the ash content of edamame (Table 1). Averaged across genotypes, edamame planted in Little Rock had the highest ash content (5.60%) while edamame planted in Whitethorne had the lowest ash content (4.67%). Averaged across three different locations, V13-1644 had the highest ash content (5.39%) while V16-0547 had the lowest ash content (5.08%).
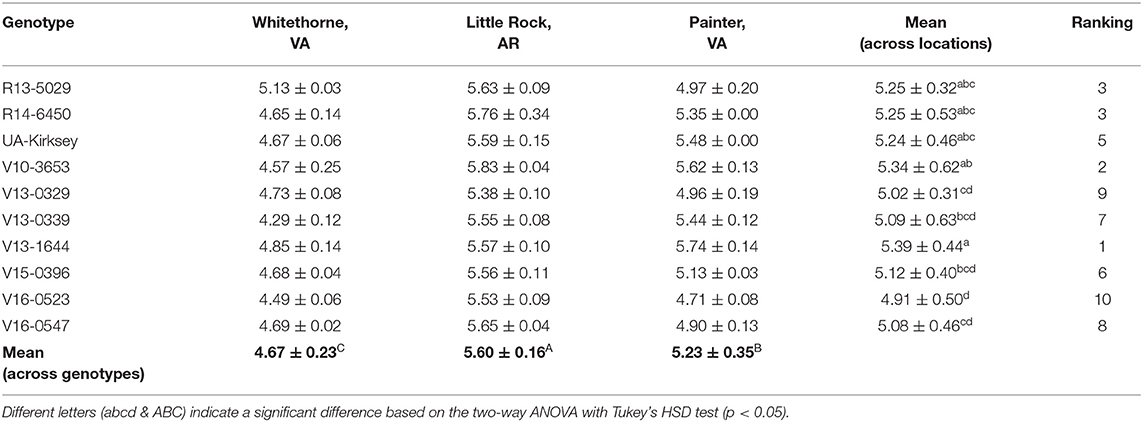
Table 10. Ash contents (%, d.b.) of 10 = edamame genotypes planted in different locations.
Moisture Content of Fresh Beans
Water takes up most of the wet weight of edamame and makes it easier to prepare and cook than soybean. In this study, the moisture content of fresh beans was in the range of 63.10–73.22% (Table 11). The highest moisture content was observed on V16-0547 planted in Little Rock and the lowest moisture content was found on V15-0396 planted in Whitethorne. Location had a significant effect on the moisture content of edamame. Averaged across all genotypes, edamame planted in Little Rock contained significantly more moisture than edamame planted in Whitethorne and Painter. Significant effect of genotype on the moisture content of edamame was found based on the ANOVA test. Averaged across all locations, the potential top genotype R13-5029 and V16-0547 had higher moisture content (69.80 and 69.62%, respectively) while V15-0396 had relatively low moisture contents (66.08%). No significant effect of genotype × location interaction was found on the moisture content of edamame. Moisture content decreases gradually during bean development, thus harvest time is another potential reason leading to differences in moisture contents (Xu et al., 2016). The optimal harvest time of edamame is when the beans fill 80–90% of the pod cavity and the pods are still green and immature. Harvesting edamame at the optimal harvest time can help ensure its optimal quality.
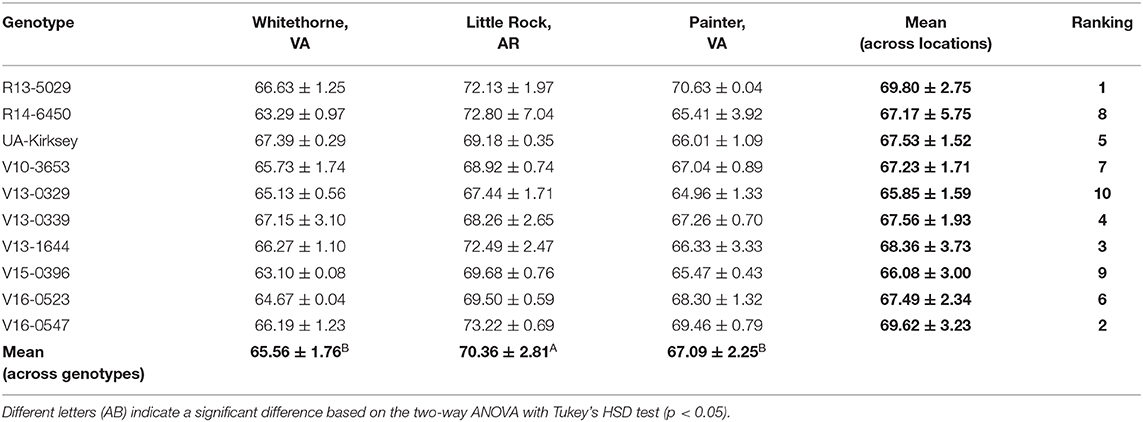
Table 11. Moisture contents [%, wet basis (w.b.)] of fresh beans of 10 edamame genotypes planted in different locations.
Principal Component Analysis
In this study, 12 chemical constituents were determined among 10 edamame genotypes planted in three locations. To better understand the relationships among these chemical constituents and how location affected the chemical composition of edamame, principal component analysis (PCA) was conducted. The first three principal components (PC) were able to explain 68.90% of the total variance. The first principal component (PC1) and the second principal component (PC2) accounted for 38.28 and 18.62% of the variance, respectively. Figure 1 consists of the PCA score plot and component loading plot of PC1 vs PC2 and it provided better visualization of the edamame samples. PC1 mainly consisted of sucrose, glucose, raffinose, alanine, crude protein, moisture, NDF, and ash, while PC2 mainly consisted of glucose, fructose, stachyose, protein, oil, and starch. In the component loading plot, each constituent is illustrated with a vector and the angle of any two vectors indicates the correlation between those two constituents. When the angle is exactly 90°, there is no correlation. With angles being between 0–90° and 90–180°, there is a positive or negative correlation, respectively (Bi et al., 2017). The component loading plot shows that the 12 chemical constituents were divided into three groups. The first group consisted of free sugars including sucrose, raffinose, glucose, stachyose, and fructose which indicates that free sugar contents were all positively correlated with each other. The second group contained crude protein, NDF, moisture, ash and alanine contents while starch and oil were in the last group. All chemical constituents in the second group were negatively correlated with sucrose, indicating that the samples having higher sucrose contents tend to have lower protein, NDF, moisture, ash, and alanine contents. Sucrose is positively correlated with starch but does not correlate with oil. This information is useful to breeders to balance the sweetness (sugars) and nutritional values (proteins, fibers) when breeding consumer-preferred edamame varieties.
The PCA score plot shows the distributions of edamame planted in three locations. The sample points close to each other have similar chemical compositions. The samples were divided into two clusters—one cluster mainly consisted of the samples planted in Whitethorne and the other cluster consisted of the samples planted in Painter and Little Rock. This indicates that location affected the chemical compositions of edamame. All samples planted in Whitethorne fell into the cluster where free sugars dominated, indicating that free sugars are the primary reason for separation of edamame planted in Whitethorne from the samples planted in Little Rock and Painter. The points of Little Rock's samples fell into the area which was dominated by crude protein, NDF, moisture, ash, and alanine contents. The chemical composition data showed that edamame planted in Little Rock had significantly higher crude protein, NDF, moisture, ash, and alanine contents. The samples planted in Painter were located between the samples planted in Whitethorne and Little Rock, indicating that the samples planted in Painter had a middle level of chemical compositions. Overall, the PCA analysis showed the pronounced effect of planting locations on the chemical composition of edamame. The information could provide the breeders with the guidance about how to choose locations for selecting/breeding for cultivars with specific traits.
Conclusions and Future Work
The effect of genotype and planting location on chemical compositions was investigated on 10 edamame genotypes planted in three locations—Whitethorne, VA; Little Rock, AR; and Painter, VA. The determined chemical constituents included soluble sugars (sucrose, glucose, fructose, raffinose, and stachyose), alanine, crude protein, oil, starch, moisture, neutral detergent fiber, and ash. The main findings are listed as follows:
a) Planting location had significant effects on all chemical constituents of edamame (p < 0.05). The edamame planted in Whitethorne had the highest soluble sugars, total sweetness, and starch contents while the edamame planted in Little Rock had the highest soluble alanine, NDF, moisture and ash contents. The edamame planted in Painter had the highest crude protein and oil contents.
b) Genotype had significant effects on all chemical constituents except for NDF and raffinose. Among the 10 genotypes, R13-5029 had the highest sucrose content, sweetness, and moisture contents while UA-Kirksey had the highest crude protein content. The highest oil content was observed on V13-1644 and the highest starch content was found on V13-0339.
c) R13-5029 consistently had high total sweetness across the three locations, meanwhile it had relatively high protein and fiber contents but low oil content. Therefore, it is identified as a potential genotype for future edamame production in the US.
d) The significant effect of genotype × location interaction was only observed on sucrose, stachyose, protein, and starch contents.
e) PCA analysis showed that there is a negative correlation between sucrose content and protein and fiber contents in edamame.
f) To breed better edamame genotypes for the US market, both genotype and location should be taken into consideration.
The limitation of this study is having only 1-year data to investigate the effect of planting location and genotype on the chemical composition of edamame. To further confirm the effects of planting location, multiple years of study needs to be conducted on the same genotypes planted in the three locations investigated in this study.
Data Availability Statement
The raw data supporting the conclusions of this article will be made available by the authors, without undue reservation.
Author Contributions
DY, BZ, SD, YY, and HH contributed to the conception and design of the study. RC helped with the edamame processing. KS, NL, BZ, TK, SR, and JR planted and harvested the edamame samples. DY conducted the experiments with the help of QJ and HW, and wrote the first draft. DY and TL worked on the data analysis. All authors provided feedback and helped shape the manuscript.
Funding
This research was supported by the USDA-NIFA, Grant No. 2018-51181-28384, Accession No. 1016465, and the Virginia Agricultural Experiment Station.
Conflict of Interest
The authors declare that the research was conducted in the absence of any commercial or financial relationships that could be construed as a potential conflict of interest.
Acknowledgments
The authors thank USDA-NIFA, Virginia Agricultural Experiment Station, and the Virginia Tech Graduate School Water-IGEP program for financial support. The authors also thank Kyle Adie, Joanna Chan, Malvika Damle, Colleen Dommel, Brett Driver, Yiming Feng, Michaela Foster, Andrea Hagen, Andrew King, Dmitriy Korotkov, Jiajun Li, Katy Lobeda, Katie Mathews, Joshua OHair, Sophie Pinton, Sydney Studioso, Karissa Triastari, Kim Waterman, Brian D. Wiersema, Jian Wu, and Wenying Zhang for receiving, cleaning, and processing edamame samples for chemical composition analysis.
References
AOAC (2005a). Official methods of analysis of AOAC INTERNATIONAL (2005). 18th ed. Gaithersburg, MD: AOAC International. Official Method 2001.11. Available online at: https://www.scribd.com/document/184788392/AOAC-2001-11-PROTEINA (accessed March 21, 2020).
AOAC (2005b). Official methods of analysis of AOAC INTERNATIONAL (2005). 18th ed. Gaithersburg, MD: AOAC International. Official Method 2003.05. Available online at: https://www.scribd.com/doc/128237003/Aoac-920-39-2003-05-Extracto-Etereo-Dietileter (accessed March 21, 2020).
AOAC (2005c). Official methods of analysis of AOAC INTERNATIONAL (2005). 18th ed. Gaithersburg, MD: AOAC International. Official Method 942.05. Available online at: https://www.scribd.com/doc/53398720/Aoac942-05-Ash (accessed March 21, 2020).
Arslanoglu, F., Aytac, S., and Oner, E. K. (2011). Effect of genotype and environment interaction on oil and protein content of soybean [Glycine max (L.) Merrill] seed. African J. Biotechnol. 10, 18409–18417. doi: 10.5897/AJB10.1879
Berganza, B. E., Moran, A. W., Guillermo Rodríguez, M., Coto, N. M., Santamaría, M., and Bressani, R. (2003). Effect of variety and location on the total fat, fatty acids and squalene content of amaranth. Plant Foods Hum. Nutr. 58, 1–6. doi: 10.1023/B:QUAL.0000041143.24454.0a
Bi, Y., Zhang, Y., Jiang, H., Hong, Y., Gu, Z., Cheng, L., Li, Z., and Li, C. (2017). Molecular structure and digestibility of banana flour and starch. Food Hydrocolloids 72, 219–227. doi: 10.1016/j.foodhyd.2017.06.003
Cameron, A. T. (1945). The relative sweetness of various sweet compounds and of their mistures. Can. J. Res. 23e, 139–166. doi: 10.1139/cjr45e-018
Carneiro, R. C., Duncan, S. E., O'Keefe, S. F., Yu, D., Huang, H., Yin, Y., et al. (2020). Utilizing consumer perception of edamame to guide new variety development. Front. Sustain. Food Syst. 4:556580. doi: 10.3389/fsufs.2020.556580
Cartter, J. L., Hopper, T. H., and Chemist, S. (1942). Influence of Variety, Environment, and Fertility Level on the Chemical Composition of Soybean Seed. USDA Tech. Bull. 787:66.
Chen, P., Orazaly, M., Florez, L., Moseley, D., Hart, T., Rogers, D., et al. (2017). Breeding new soybean cultivars with high yield and disease resistance. Soybean Res. Stud. 42, 20–22.
Ciabotti, S., Silva, Juhasz, Mendonça, C. D., Tavano, Mandarino, et al. (2016). Chemical composition, protein profile, and isoflavones content in soybean genotypes with different seed coat colors. Int. Food Res. J. 23, 621–629.
Clark, J. (2020). Managing soil and soil fertility after flooding. SDSU Extension. Available online at: https://extension.sdstate.edu/managing-soil-and-soil-fertility-after-flooding (accessed on March 21, 2020).
Dornbos, D. L., and Mullen, R. E. (1992). Soybean seed protein and oil contents and fatty acid composition adjustments by drought and temperature. J. Am. Oil Chem. Soc. 69, 228-231. doi: 10.1007/BF02635891
Eheart, J. F., Young, R. W., and Allison, A. H. (1955). Variety, type, year, and location effects on the chemical composition of peanuts. Food Res. 20, 497–505. doi: 10.1111/j.1365-2621.1955.tb16860.x
Guo, J., Rahman, A., Mulvaney, M. J., Hossain, M. M., Basso, K., Fethiere, R., et al. (2020). Evaluation of edamame genotypes suitable for growing in Florida. Agron. J. 112, 693–707. doi: 10.1002/agj2.20136
Hata, Y., Yamamoto, M., and Nakajima, K. (1991). Effects of soybean oligosaccharides on human digestive organs. J. Clin. Biochem. Nutr. 10, 135–144. doi: 10.3164/jcbn.10.135
He, Y., Kuhn, D.D., Ogejo, J.A., O'Keefe, S.F., Fraguas, C.F., Wiersema, B.D., et al. (2019). Wet fractionation process to produce high protein and high fiber products from brewer's spent grain. Food Bioprod. Process. 117, 266–274. doi: 10.1016/j.fbp.2019.07.011
Jiang, G., Katuuramu, D. N., Xu, Y., Ren, S., and Rutto, L. K. (2020). Analysis and comparison of seed protein, oil, and sugars in edamame dried using two oven-drying methods and mature soybeans. J. Sci. Food Agric. 100, 3987–3994. doi: 10.1002/jsfa.10443
Jiang, G. L., Chen, P., Zhang, J., Florez-Palacios, L., Zeng, A., Wang, X., et al. (2018). Genetic analysis of sugar composition and its relationship with protein, oil, and fiber in soybean. Crop Sci. 58, 2413–2421. doi: 10.2135/cropsci2018.03.0173
Johnson, D., Wang, S., and Suzuki, A. (1999). Edamame: A Vegetable Soybean for Colorado. Perspect. New Crop. New Uses. 385–387. Available online at: https://hort.purdue.edu/newcrop/proceedings1999/pdf/v4-385.pdf (accessed March 25, 2020).
Kaiser, C., and Ernst, M. (2013). Edamame. Center for Crop Diversification Crop Profile, University of Kentucky Cooperative Extension Service, p. 1–4.
Kirimura, J., Shimizu, A., Kimizuka, A., Ninomiya, T., and Katsuya, N. (1969). The contribution of peptides and amino acids to the taste of foodstuffs. J. Agric. Food Chem. 17, 689–695. doi: 10.1021/jf60164a031
Konovsky, J., Lumpkin, T. A., and Mcclary, D. (1994). Edamame: the vegetable soybean. Understand. Japan. Food Agrimarket 1988, 173–181. doi: 10.1201/9781003075172-15
Kumar, V., Rani, A., Billore, S. D., and Chauhan, G. S. (2006a). Physico-chemical properties of immature pods of Japanese soybean cultivars. Int. J. Food Prop. 9, 51–59. doi: 10.1080/10942910500471727
Kumar, V., Rani, A., Goyal, L., Kumar Dixit, A., Manjaya, J. G., Dev, J., et al. (2010). Sucrose and raffinose family oligosaccharides (RFOs) in soybean seeds as influenced by genotype and growing location. J. Agric. Food Chem. 58, 5081–5085. doi: 10.1021/jf903141s
Kumar, V., Rani, A., Solanki, S., and Hussain, S. M. (2006b). Influence of growing environment on the biochemical composition and physical characteristics of soybean seed. J. Food Compos. Anal. 19, 188–195. doi: 10.1016/j.jfca.2005.06.005
Lara, L. M., Wilson, S. A., Chen, P., and Atungulu, G. G. (2019). The effects of infrared treatment on physicochemical characteristics of vegetable soybean. Heliyon 5:e01148. doi: 10.1016/j.heliyon.2019.e01148
Lin, T., O'Keefe, S., Duncan, S., and Fernández-Fraguas, C. (2020). Manipulation of the dry bean (Phaseolus vulgaris L.) matrix by hydrothermal and high-pressure treatments: impact on in vitro bile salt-binding ability. Food Chem. 310:125699. doi: 10.1016/j.foodchem.2019.125699
Machado, S., Costa, A.S., Pimentel, F., Oliveira, M.B.P., and Alves, R.C. (2020). A study on the protein fraction of coffee silverskin: protein/non-protein nitrogen and free and total amino acid profiles. Food Chem. 326:126940. doi: 10.1016/j.foodchem.2020.126940
McClure, T., Cocuron, J. C., Osmark, V., McHale, L. K., and Alonso, A. P. (2017). Impact of environment on the biomass composition of soybean (Glycine max) seeds. J. Agric. Food Chem. 65, 6753–6761. doi: 10.1021/acs.jafc.7b01457
McEnroe, P., and Coulter, B. (1964). Effect of soil pH on sugar content and yield of sugar beet. Irish J. Agric. Res. 3, 63–69.
Monteiro, S. T., Minekawa, Y., Kosugi, Y., Akazawa, T., and Oda, K. (2007). Prediction of sweetness and amino acid content in soybean crops from hyperspectral imagery. ISPRS J. Photogramm. Remote Sens. 62, 2–12. doi: 10.1016/j.isprsjprs.2006.12.002
Ohair, J., Jin, Q., Yu, D., Wu, J., Wang, H., Zhou, S., and Huang, H. (2020). Non-sterile fermentation of food waste using thermophilic and alkaliphilic Bacillus licheniformis YNP5-TSU for 2, 3-butanediol production. Waste Manag. 120, 248–256. doi: 10.1016/j.wasman.2020.11.029
Okunlola, G. O., Akinwale, R. O., and Adelusi, A. A. (2016). Proline and soluble sugars accumulation in three pepper species (Capsicum spp.) in response to water stress imposed at different stages of growth. Sci. Cold Arid Regions 8, 205–211.
Palaniswamy, S. (2017). Determination of Amino Acid Composition of Cell Culture Media and Protein Hydrolysate Standard. Agilent Technologies, Inc.
Pao, S., Ettinger, M. R., Khalid, M. F., Mebrahtu, T., and Mullins, C. (2008). Microbiological quality of frozen “edamame” (vegetable soybean). J. Food Saf. 28, 300–313. doi: 10.1111/j.1745-4565.2008.00121.x
Sakla, A. B., Ghali, Y., El-Farra, A., and Rizk, L. F. (1988). The effect of environmental conditions on the chemical composition of soybean seeds: relationship between the protein, oil, carbohydrate and trypsin inhibitor content. Food Chem. 29, 221–231. doi: 10.1016/0308-8146(88)90135-5
Saldivar, X., Wang, Y. J., Chen, P., and Mauromoustakos, A. (2010). Effects of blanching and storage conditions on soluble sugar contents in vegetable soybean. LWT 43, 1368–1372. doi: 10.1016/j.lwt.2010.04.017
Sirtori, C. R. (2001). Risks and benefits of soy phytoestrogens in cardiovascular diseases, cancer, climacteric symptoms and osteoporosis. Drug Saf. 24, 665–682. doi: 10.2165/00002018-200124090-00003
Song, J., An, G., and Kim, C. (2003). Color, texture, nutrient contents, and sensory values of vegetable soybeans [Glycine max (L.) Merrill] as affected by blanching. Food Chem. 83, 69–74. doi: 10.1016/S0308-8146(03)00049-9
Song, J., Liu, C., Li, D., and Gu, Z. (2013). Evaluation of sugar, free amino acid, and organic acid compositions of different varieties of vegetable soybean [Glycine max (L.) Merr]. Ind. Crop. Prod. 50, 743–749. doi: 10.1016/j.indcrop.2013.08.064
Stevenson, D. G., Doorenbos, R. K., Jane, J., and Inglett, G. E. (2006). Structures and functional properties of starch from seeds of three soybean [Glycine max (L.) Merr.] varieties. Starch Stärke 58, 509–519. doi: 10.1002/star.200600534
Vidal, B. C., Rausch, K. D., Tumbleson, M. E., and Singh, V. (2009). Determining corn germ and pericarp residual starch by acid hydrolysis. Cereal Chem. 86, 133–135. doi: 10.1094/CCHEM-86-2-0133
Wolf, R. B., Cavins, J. F., Kleiman, R., and Black, L. T. (1982). Effect of temperature on soybean seed constituents: oil, protein, moisture, fatty acids, amino acids and sugars. J. Am. Oil Chem. Soc. 59, 230–232. doi: 10.1007/BF02582182
Xu, L., Jiang, F., Wu, Z., Wang, J., and Zhou, X. (2009). Effects of substrate water content and light intensity on growth and quality of non-heading Chinese cabbage. Jiangsu J. Agri. Sci. 25, 865–870.
Xu, Y., Cartier, A., Kibet, D., Jordan, K., Hakala, I., Davis, S., et al. (2016). Physical and nutritional properties of edamame seeds as influenced by stage of development. J. Food Meas. Charact. 10, 193–200. doi: 10.1007/s11694-015-9293-9
Xu, Y., Sismour, E., Pao, S., Rutto, L., Grizzard, C., and Ren, S. (2012). Textural and microbiological qualities of vegetable soybean (edamame) affected by blanching and storage conditions. J. Food Process. Technol. 3, 1–6. doi: 10.4172/2157-7110.1000165
Yang, S.Y., Li, J.H., and Zhu, L.L. (2009). Effects of light intensity on quality of pepper fruits. Northern Horticult. 2, 65–67. Available online at: https://en.cnki.com.cn/Article_en/CJFDTotal-BFYY200902022.htm
Yu, D., Sun, Y., Wang, W., O'Keefe, S. F., Neilson, A. P., Feng, H., et al. (2020). Recovery of protein hydrolysates from brewer's spent grain using enzyme and ultrasonication. Int. J. Food Sci. Technol. 55, 357–368. doi: 10.1111/ijfs.14314
Yu, X., Yuan, F., Fu, X., and Zhu, D. (2016). Profiling and relationship of water-soluble sugar and protein compositions in soybean seeds. Food Chem. 196, 776–782. doi: 10.1016/j.foodchem.2015.09.092
Zeipina, S., Alsina, I., and Lepse, L. (2017). Insight in edamame yield and quality parameters: a review. Res. Rural Dev. 2, 40–44. doi: 10.22616/rrd.23.2017.047
Zhang, Q., Li, Y., Chin, K. L., and Qi, Y. (2017). Vegetable soybean: seed composition and production research. Ital. J. Agron. 12, 276–282. doi: 10.4081/ija.2017.872
Keywords: edamame, sweetness, chemical composition, genotype, location
Citation: Yu D, Lin T, Sutton K, Lord N, Carneiro R, Jin Q, Zhang B, Kuhar T, Rideout S, Ross J, Duncan S, Yin Y, Wang H and Huang H (2021) Chemical Compositions of Edamame Genotypes Grown in Different Locations in the US. Front. Sustain. Food Syst. 5:620426. doi: 10.3389/fsufs.2021.620426
Received: 17 November 2020; Accepted: 13 January 2021;
Published: 12 February 2021.
Edited by:
Matteo Balderacchi, Independant Consultant, Piacenza, ItalyReviewed by:
Eric Etchikinto Agoyi, Université d'Abomey-Calavi, BeninAbdulwahab Saliu Shaibu, Bayero University Kano, Nigeria
Copyright © 2021 Yu, Lin, Sutton, Lord, Carneiro, Jin, Zhang, Kuhar, Rideout, Ross, Duncan, Yin, Wang and Huang. This is an open-access article distributed under the terms of the Creative Commons Attribution License (CC BY). The use, distribution or reproduction in other forums is permitted, provided the original author(s) and the copyright owner(s) are credited and that the original publication in this journal is cited, in accordance with accepted academic practice. No use, distribution or reproduction is permitted which does not comply with these terms.
*Correspondence: Haibo Huang, aHVhbmcxNTFAdnQuZWR1