 Lemlem Teklegiorgis Habtemariam
 Christoph Gornott
 Harry Hoffmann
 Stefan Sieber
- 1Potsdam Institute for Climate Impact Research (PIK), Member of the Leibniz Association, Potsdam, Germany
- 2Agroecosystem Analysis and Modelling, Faculty of Organic Agricultural Sciences, University of Kassel, Kassel, Germany
- 3Leibniz Center for Agricultural Landscape Research (ZALF), Müncheberg, Germany
- 4Thaer-Institute of Agricultural and Horticultural Sciences, Faculty of Life Sciences, Humboldt-Universität zu Berlin, Berlin, Germany
Evidence on whether diversifying farm production leads to improved household dietary diversity and nutrition remains inconclusive. Existing studies analyzing the link between production diversity and dietary diversity are mainly based on cross-sectional methods, which could be biased by omitted confounding factors. Using two waves of a panel household survey of 900 rural households in Tanzania, this paper examines the link between production diversity and dietary diversity, while minimizing potential confounding effects. We estimate four regression models with two different production diversity measures and two panel estimation methods—fixed effect (FE) and random effect (RE). In three out of the four models, production diversity is significantly and positively associated with the dietary diversity measure of the food consumption score. The production diversity indicator is represented by the total crop and livestock species count, as well as by counting only crop species. The total crop and livestock species count shows a significant positive association with dietary diversity across estimation methods while the positive association with crop species count is not significant in the FE method. Our results suggest that the selection of appropriate production diversity indicators tailored to the specific circumstances of the local agricultural system is likely one key factor in identifying a robust relationship between production diversity and dietary diversity.
Introduction
Undernutrition remains critical in many low-income countries despite the many global initiatives targeting it (Global Nutrition Report, 2020). Undernutrition occurs when people are unable to acquire sufficient energy, protein, and/or the micronutrients that are necessary for the body (WFP, 2012). The consequences of undernutrition are wide ranging, negatively affecting the health, growth, cognitive development, and, thus, economic productivity of affected individuals (Victora et al., 2008; Dewey and Begum, 2011). Reducing undernutrition by improving nutrient supplies can play a key role in improving the productivity of people, thus fostering economic development and sustainable livelihoods in low income and emerging countries (Alderman et al., 2007).
Diversifying diets helps to ensure the intake of essential nutrients needed for good health, and it is particularly important for low-income households in rural areas, where diets are typically dominated by starchy staples with low protein and micronutrient levels (Ruel, 2002). For these households, consuming food from a wide range of crop and livestock sources can contribute to improving their diet quality and nutritional status.
Diversification of farm production is recommended as a potential strategy to improve the diet diversity and nutrition of rural households (FAO, 2017). There are two primary pathways from production diversification to better household nutrition. First, diverse food production ensures the availability of diverse food items for individual consumption, which is subsequently likely to improve diet quality and nutrition. Second, diversifying farm production ensures increased and stable income by minimizing market risks in times of price volatility and production output variability, the latter of which is affected by events such as climate change (Demeke et al., 2017). Increased and stable income enables households to purchase and consume diverse food items. The direct production-consumption link is expected to be strong, especially for subsistence and semi-subsistence farming households (World Bank, 2007). As most rural households consume a considerable portion of their own production, a direct positive association between production diversity and dietary diversity is plausible (World Bank, 2007). However, other researchers, including Sibhatu et al. (2015), argue that diversification may not always be the best strategy for improving the dietary diversity of farming households due to the forgone income opportunity that would have been earned from specialization. Sibhatu et al. (2015) argue that the higher income from specialization may provide households with improved access to diversified foods from the market. Yet, this view is challenged by the findings of earlier studies suggesting that increasing income from agricultural commercialization alone does not substantially improve household nutrition [for a review of case studies see World Bank (2007)]. Newer studies continue to question if poor households realize the benefits of increased commercialization on nutritional outcomes as the propensity is to spend marginal income on non-nutritional purposes (Carletto et al., 2017). Nevertheless, beyond its nutritional benefits, literature shows that production diversification provides wide ranging benefits; it is, for example, a climate change risk management strategy and also promotes biodiversity. Therefore, the decision of whether to support diversification or not should not just take into consideration its direct and indirect nutritional implications, but also the respective effects on various production and market risks facing farm households.
Several studies empirically investigate the role of farm production diversification on rural household dietary diversity and nutrition. A detailed and systematic review of the empirical literature on production diversity and dietary diversity can be found in Sibhatu and Qaim (2018) and Jones (2017). The existing empirical research findings regarding the link between production diversification and household dietary diversity and nutrition are, however, inconclusive. While some studies report a positive association (e.g., Jones et al., 2014; Pellegrini and Tasciotti, 2014; Bellon et al., 2016), some find mixed results (e.g., Sibhatu et al., 2015; Koppmair et al., 2017), and still others report no relationship (e.g., Purwestri et al., 2017; Rajendran et al., 2017). Therefore, it remains unclear whether and, if so, to what extent, diversification leads to improved diet diversity.
As the existing empirical studies are diverse in terms of methods and employed indicators of production diversity and dietary diversity, the direct comparison of findings is difficult. The majority of existing studies rely on cross-sectional data. Cross-sectional studies often suffer from the econometric challenge of omitted confounding factors that may bias model estimates (Wooldridge, 2012, p. 88). The association between production diversity and dietary diversity might likewise be confounded by unobservable and household specific characteristics, such as ability, skill, and motivation. Households that diversify their food production due to better ability, skill, and motivation might also be more likely to diversify their diet. As it is often difficult to measure these variables, typically they are omitted from econometric models, which may lead to biased estimates. Some studies specifically focus on identifying associations without specifically addressing potential endogeneity issues. However, some existing studies do apply econometric approaches that allow for taking into account confounding effects and endogeneity issues when analyzing the impact of production diversity on dietary diversity using cross-sectional data (e.g., Dillon et al., 2014; Bellon et al., 2016; Hirvonen and Hoddinott, 2017; Zanello et al., 2019).
Starting in the late 2010s, growing efforts have attempted to exploit panel data sets and methods to strengthen the empirical evidence on the association between production diversity and dietary diversity (e.g., Islam et al., 2018; Mofya-Mukuka and Hichaambwa, 2018; Chegere and Stage, 2020; Sekabira and Nalunga, 2020). A major benefit of using panel methods is the ability to control for individual/household specific time constant unobserved effects that potentially have confounding effects, thus strengthening the robustness of modeling results (Wooldridge, 2012, p. 512). The current study adds to this growing body of literature by employing a panel data method to optimally identify the link between production diversity and dietary diversity. It further discusses the specific implications for policy makers and practitioners. It is based on data collected during two waves of a household survey of 900 rural households located in two environmentally different agro-climatic regions (sub-humid and semi-arid) in Tanzania. The two regions represent two different agricultural systems, thus allowing us to control for regional differences.
Study Areas and Data
The study is based on data collected during a two-wave household survey in the Dodoma and Morogoro regions of Tanzania (see Figure 1 for map of the study area). The Dodoma region is located in central Tanzania and features a semi-arid climate with annual rainfall between 350 and 500 mm and mean temperature of about 23°C. The Morogoro region is located in eastern Tanzania and is predominantly a semi-humid climate with annual rainfall of 600–800 mm. The annual mean temperature is about 25°C. Agriculture in both regions is predominantly semi-subsistence/subsistence farming. Together, Morogoro and Dodoma account for 70–80% of the farming systems types found in Tanzania (Graef et al., 2014). The agricultural system in Dodoma is primarily based on sorghum and millet with strong livestock integration, whereas the agricultural system in Morogoro is predominantly based on maize, sorghum, legumes, rice, and horticulture, but with limited livestock (Graef et al., 2014). Food insecurity in the two regions is high; a 2009 food security and vulnerability analysis report estimates about 41 and 39% of the households in Dodoma and Morogoro, respectively, have poor or borderline poor food consumption (WFP, 2010). The same report estimates the prevalence of child stunting to be around 45 and 38% in Dodoma and Morogoro, respectively.

Figure 1. Study area.
The household data was collected as part of the Trans-SEC project, which was implemented in the two regions. The project and its analytical framework are extensively described in Graef et al. (2014). In Dodoma, the household surveys were conducted in Chamwino district. In Morogoro, the surveys were conducted in Kilosa district. In the first step, three villages representing the typical agricultural system in each region were selected from each district, taking into consideration market access, cropping patterns, livestock integration, and village size. Subsequently, 150 households were randomly selected from each village (900 households in total). In the first survey wave, conducted in January and February 2014, data concerning all production activities during 2013 was collected. In the second wave, carried out in August and September 2016, the survey collected data concerning the previous 12 months. Despite the fact that the waves were collected at different points of the year, each wave captures the main agricultural production season in their reference period. Although the second wave was conducted in the same villages and households, only 820 households from the first wave were re-interviewed; thus, a slightly unbalanced panel data set resulted. We used Stata software which is able to handle the unbalanced characteristic of the panel dataset.
The survey instrument was a structured questionnaire comprising several sections to capture different aspects of farm households' income generating activities, food and non-food expenditures, as well as their food security status. The survey collected detailed information including data on household and farm characteristics, crop and livestock production activities, non-agricultural income generating activities, as well as household food consumption patterns and food sources. For the questions regarding food consumption, households were specifically asked to report on food consumption during the last normal week in the household. Additionally, data on household level variables that influence household diets, like if the household collects food products from public resources and if the household participates in food aid and nutrition programs, were collected.
Econometric Strategy
We are interested in modeling whether production diversity is linked to improved household dietary diversity. For this purpose, we consider the following form panel data regression model:
where the dependent variable DDit represents the dietary diversity status for household i in period t. PDit, the main variable of interest, stands for the degree of farm production diversity. Lastly, Xit is a vector of control variables, ai denotes a household specific unobserved effect fixed over time, and μit represents time varying idiosyncratic error. We apply this model to the whole sample collected from both regions and include region fixed effect as a control variable.
The regression model in Equation (1) can be estimated either by a random effect (RE) or fixed effect (FE) panel estimation method. While the random effect model assumes that the unobserved effect ai is uncorrelated with all the explanatory variables, the FE estimator does not impose this assumption. The Hausman test can be used to validate the assumption of independence made in the random effect model. The FE estimator is consistent, but inefficient if the assumption of independence is valid. The RE estimator is efficient if the assumption of independence is valid, but inconsistent otherwise. In this paper, we estimate Equation (1) using both the RE and FE methods and perform the Hausman test to validate the assumptions of the RE method. We apply an estimation method to obtain standard errors that are robust to heteroscedasticity and within-panel autocorrelation in the error term. In addition, in the Appendix. we present the result of a pooled regression that ignores the panel structure of our dataset and applies the OLS technique to the data.
In our analysis, we use the household food consumption score (FCS) indicator to measure the dietary diversity of households. The FCS is used as a proxy indicator of nutritional adequacy of households' diets in studies of production diversity and dietary diversity (e.g., Jones et al., 2014). Validation studies indicate that the FCS is a useful proxy that captures both quality and quantity aspects of household food consumption (Lovon and Mathiassen, 2014). To construct the FCS, information on household's food consumption frequency over a recall period of seven days before the survey is used. The consumption frequencies of the food groups are calculated and the value obtained for each food group is multiplied by a food group weight. Finally, the FCS is constructed by summing the weighted food group scores (Kennedy et al., 2010).
For the measurement of production diversity, we use two different count indexes. The first index is based on counts of the number of crop species, indicating the number of crop species cultivated by the household during the 12-month reference periods. As the common agricultural system in our study area comprises mixed farming with crop and livestock components, it is relevant to include the count of livestock species in the applied production diversity index to consider the comprehensiveness of the agricultural system. To do this, we use a second production diversity indicator based on the total count of crop and livestock species that the household cultivated and reared during the 12 months reference period. Several studies use these indexes or variations of them to measure the production diversity of farms (Jones et al., 2014; Sibhatu et al., 2015; Demeke et al., 2017).
In addition to production diversity, a number of other explanatory variables may affect household dietary diversity. Based on the existing literature (Jones et al., 2014; Sibhatu et al., 2015; Bellon et al., 2016; Demeke et al., 2017; Islam et al., 2018), we include a number of control variables in our analysis to account for socio-economic and market influences. This includes the age, gender, and educational level of the head of the household, as well as household size, total agricultural land area, non-agricultural income, distance from main road, region, and share of own food consumption. We use distance to the main road as a proxy indicator of market access and involvement of the household. The region variable accounts for differences in the agricultural systems in the two study regions.
Additionally, we include dummy variables for households that collect food, such as vegetables, fruits, and fish, from public resources, as well as households that participate in food aid and nutrition programs. Studies show that household food collection activities from public resources, in the forms of hunting, fishing, and food collection, are important for household dietary diversity (Koppmair et al., 2017). In rural areas of low-income countries, this type of food collection from public resources is common and contributes highly nutritious foods, such as fruits, nuts, fish, honey, and bush meat, to the household dietary diversity. Furthermore, participation in nutrition and food aid programs can affect diet diversity and, thus, we control for it in our model.
Result and Discussion
Descriptive Statistics
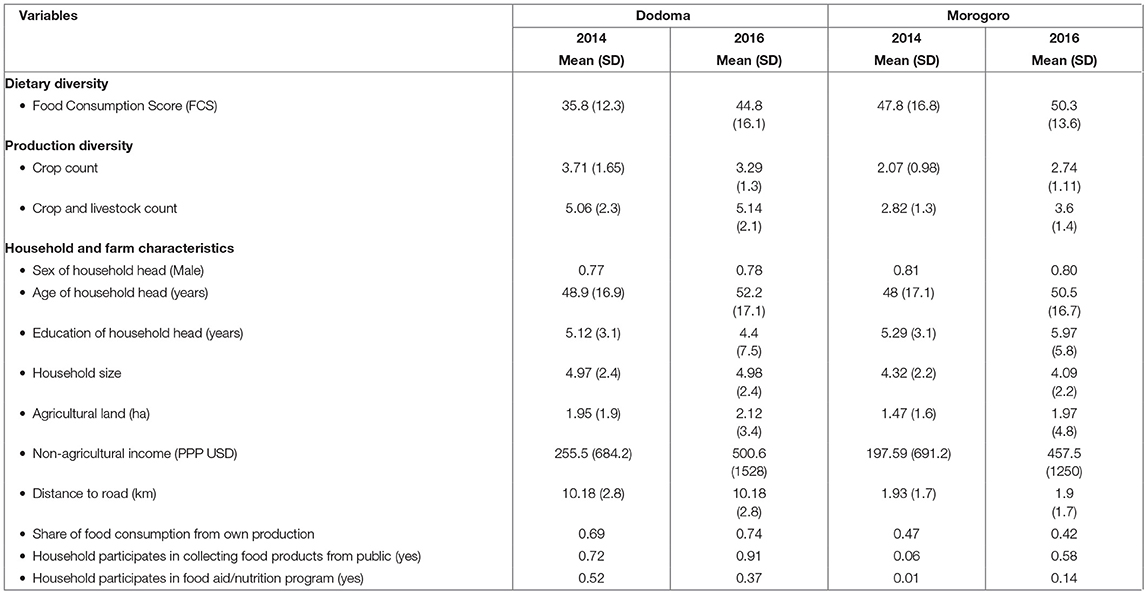
The descriptive statistics of variables for the 2014 and 2016 waves of survey data are presented in Table 1, while Table 2 presents the descriptive statistics of dietary and production diversity variables disaggregated by the two study regions. Detailed region disaggregated descriptive statistics are presented in the Appendix. Table 1 suggests that the average FCS, crop count, and crop and livestock count indicators are relatively higher for the 2016 survey data than for the 2014 data. Over all, the FCS values are lower than the values reported by Jones et al. (2014), which uses a similar FCS indicator for Malawi. Further, the average number of crop species grown on a farm is lower than what is reported by Sibhatu et al. (2015) for Kenya and Ethiopia. The region disaggregated diversity indicators' data in Table 2 show that the FCS indicator is higher for Morogoro than Dodoma in both survey waves. However, both the crop count and livestock count indicators are higher for Dodoma than Morogoro in both survey waves. The regional disaggregated data show an increase in crop and livestock counts in both regions in 2016, except for the Dodoma crop count, which decreases. It is assumed that farmers in Dodoma diversify their production activities more than farmers in Morogoro, probably as a risk management strategy because they face a drier climate. It is also documented in a previous study that crop diversification is generally being practiced by farmers in the study regions as an adaption strategy against climate change (Brüssow et al., 2019).
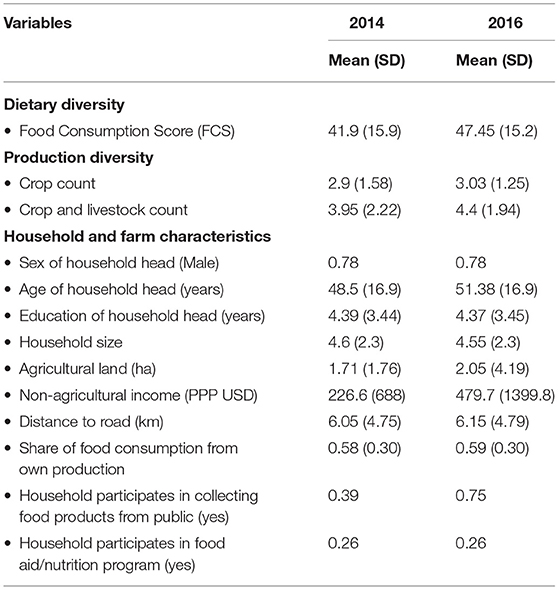
Table 1. Descriptive statistics of variables characteristics for 2014 and 2016 survey data using aggregated sample from Dodoma and Morogoro regions.
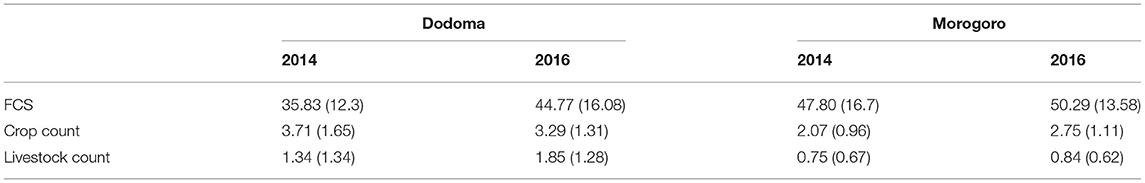
Table 2. Descriptive statistics of dietary and production diversity variables disaggregated by region.
The household and farm characteristics across the two survey waves are comparable in many of the variables used in our analysis, except the variable representing the household non-agricultural income and the variable representing the proportion of households participating in collecting food products from public resources. The 2016 sample shows relatively higher mean non-agricultural income (more than double of the average income for 2014) and a higher percent of households collecting food from public resources. For this latter group, which includes activities like fishing, hunting, honey harvesting, and collecting food from the forest, the proportion almost doubled in 2016 as compared to 2014. This increase in collecting food from public resources could partly be a result of promotional work carried out by the Trans-SEC project (the project did not have a specific intervention on collecting foods from public resources, however nutrition training was part of the project in some villages) and other programs in the regions that are teaching rural households how to extract more food resources from the wild. Since our data does not contain information on the activities of other projects, we cannot rule out the possibility that the effect of food collection is seen even in villages that have not received nutrition training by the Trans-SEC project. The mean share of food consumption from individual's own production is found to be around 0.6 in both years. Given the subsistence/semi-subsistence nature of the agricultural system in our study areas, it is reasonable that a substantial portion of the food consumed comes from own production. The proportion of food consumption from own production in our samples is higher than what is reported for Ethiopia (Sibhatu et al., 2015) and Malawi (Jones et al., 2014).
The most commonly produced crop and livestock species in the two regions are shown in Table 3. Despite changes in the proportion of households producing specific crop and livestock species, the overall set of crops and livestock species, commonly grown by households, remained similar across the two survey waves. Across the two regions, there are differences in the commonly grown crops. The most widely grown crop in semi-arid Dodoma is millet, while in sub-humid Morogoro it is maize. In both Dodoma and Morogoro, the most commonly raised livestock is chicken. The proportion of households involved in multiple livestock production is higher in Dodoma than in Morogoro.
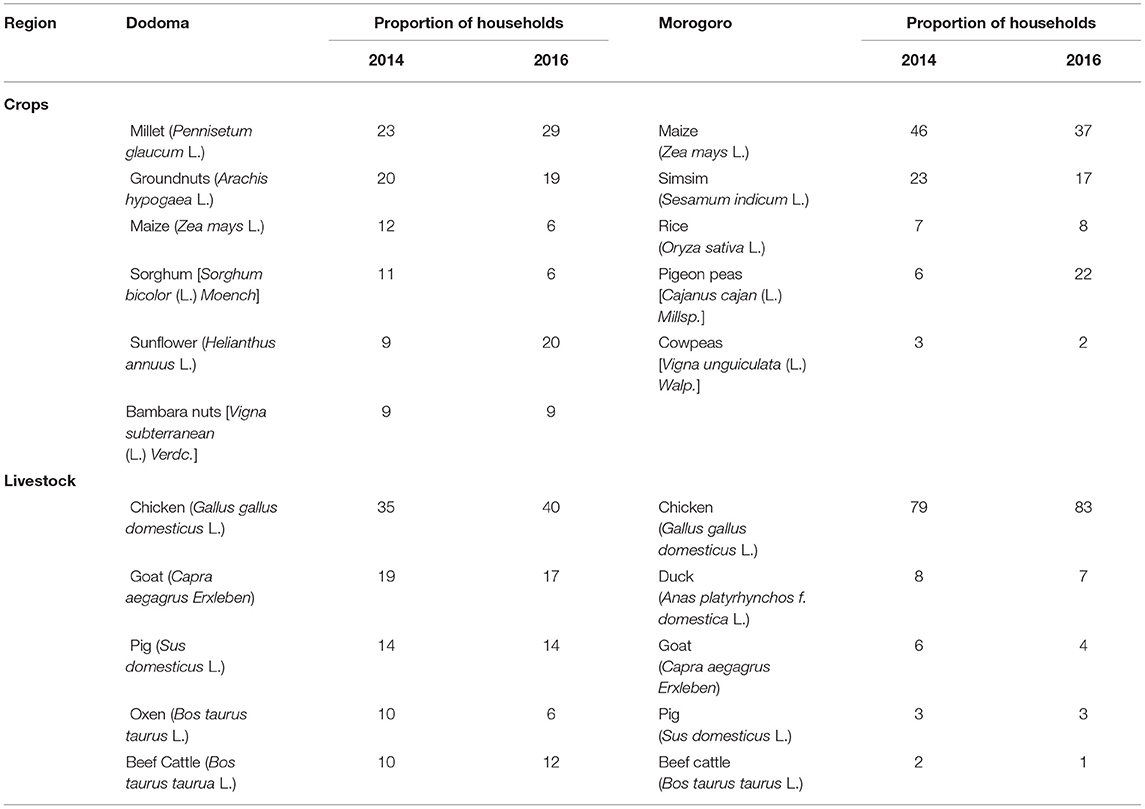
Table 3. Most commonly produced crop and livestock species and proportion of households producing the specific crop and livestock species disaggregated by region and survey year.
Table 4 shows the average number of days that a household consumed a specific food item over the seven-day recall period. In Dodoma, staples, vegetables, and pulses were frequently eaten foods in both waves. In 2016, the average frequency of eating roots, tubers and plantains, fish, meat, and staples increased in Dodoma, while the frequency of other food groups (e.g., pulses, fruits, milk, and eggs) decreased. In Morogoro, staples, vegetables, and fruits were the top three most frequently eaten foods in 2014, while the 2016 data shows pulses overtaking fruits. The average frequency of eating roots, tubers and plantains, pulses, and fish increased in 2016 in Morogoro, while the frequency of other food groups decreased. The frequency of staple food and vegetable consumption is stable over time in both regions. Households in Morogoro consume roots, tubers and plantains, fruits, fish, milk, and eggs more frequently than households in Dodoma. The average consumption of meat is slightly higher in Dodoma.
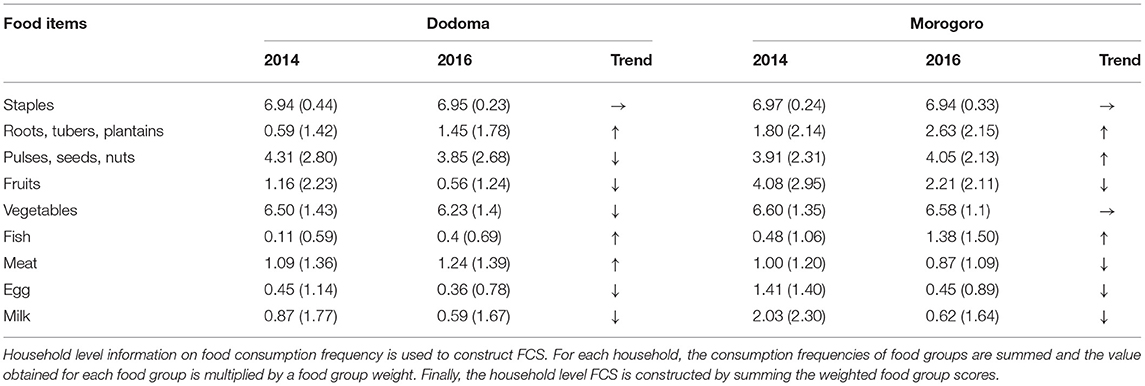
Table 4. The average number of days a household consumed food items of the following in a seven day recall period disaggregated by region and survey year.
The Effects of Production Diversity on Dietary Diversity
The results of panel regressions on the link between production diversity and dietary diversity are presented in Table 5. Columns 1 and 2 present the result of panel regression in which production diversity is measured as the number of crops for the RE and FE model estimations, respectively. Columns 3 and 4 show the results of panel regressions of RE and FE estimations in which production diversity is measured as the total count of crop and livestock species, respectively. The results of the Hausman tests, as indicated in Table 5, are significant in both cases, suggesting that the FE model is preferred over the RE model.
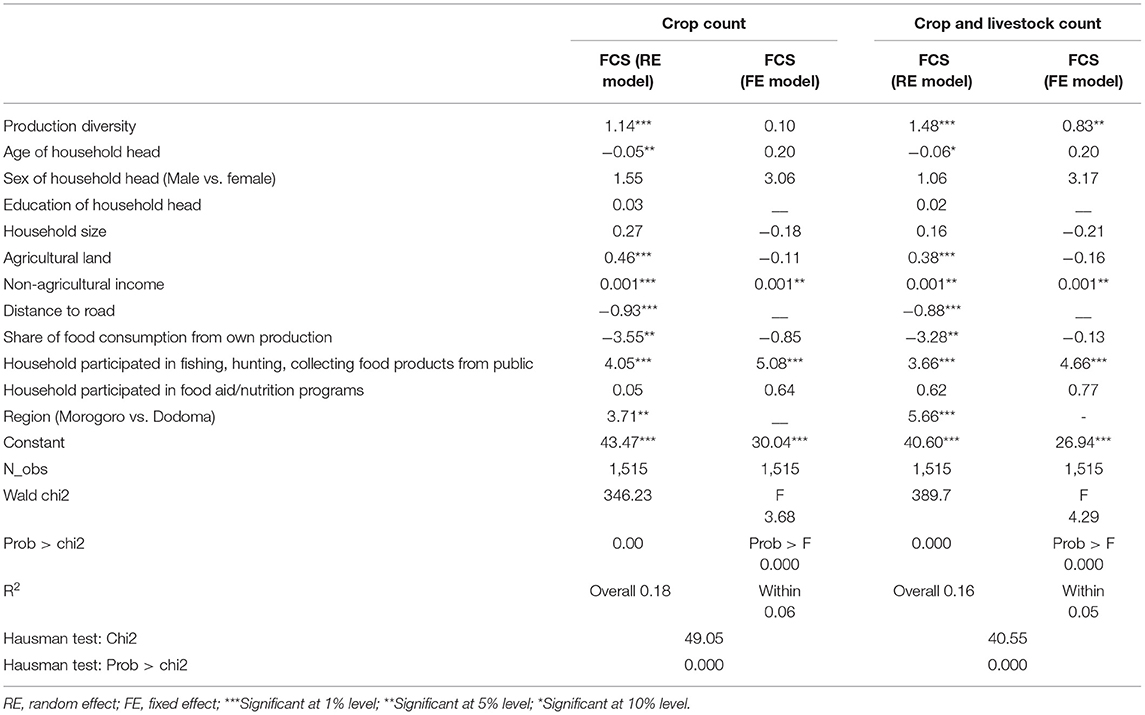
Table 5. Panel regression results on the association between production diversity and dietary diversity.
Production diversity shows a strong significant positive association (p <0.05 or p <0.01) in all models, except for one of the FE models using the crop count variable, where an insignificant positive association is seen. This demonstrates that the statistical significance of the positive link between production diversity and dietary diversity in the FE method depends on the production diversity indicator. A positive association of production diversity and dietary diversity is in line with many previous findings (e.g., Jones et al., 2014; Pellegrini and Tasciotti, 2014; Bellon et al., 2016). Using a different measure of production and dietary diversity, a study by Kissoly et al. (2020), which uses a cross-sectional analysis of the first wave of our dataset, also finds a positive association. However, there are other studies that find no association between production diversity and dietary diversity (e.g., Purwestri et al., 2017; Rajendran et al., 2017). Nevertheless, when comparing findings across studies, it is important to note that the method used to measure dietary and production diversity varies. For example, similar to our findings, Jones et al. (2014) report that relationships between production and dietary diversity change when accounting for livestock production in their study. They observe that the association of production diversity and dietary diversity becomes positive when accounting for both crop and livestock species, while this relationship is negative if only a simple crop count is used. On the other hand, Sibhatu and Qaim (2018) do not find that the choice of production diversity indicator is a significant influencing factor of dietary diversity in their meta-analysis. The FCS dietary diversity indicator used in our analysis gives weight to the nutritional contents of food groups; thus, household FCS values are likely to be heavily influenced by food items of animal origin. Therefore, if livestock species count is not included in the production diversity indicator, the relationship between production diversity and dietary diversity is likely to be biased in the context of mixed crop-livestock production systems. This is also true for our study area, where livestock production is an integral part of the mixed farming system and livestock products are often used for home consumption.
The Effects of Other Covariates
When comparing the coefficient estimates of the FE and RE models, the relationship between the various covariates and the food consumption score remained the same for all estimated variables, except age, agricultural land, and share of food consumption. In the FE model, the method transforms the data to eliminate ai by time-demeaning the variables prior to estimation, thus producing estimates by running OLS on these time-demeaned variables (Wooldridge, 2012). As a result, the fixed effect estimator does not provide estimates of time-invariant variables since time-invariant variables are removed by the fixed effect transformation along with ai. Accordingly, our FE models do not provide estimates for the time invariant variables, like region, distance to main road, and education of household head, in our models.
Using the two alternative measures of production diversity does not change the relationship between FCS and the various co-variates included in the respective models much, except for the magnitude changes of the coefficients. The control variables of household participation in food collection and region show significantly positive associations with food consumption. This is plausible given that food collection improves access to food by directly affecting availability of diverse foods. The coefficient of variable “food collection from public resources” shows a relatively strong effect in comparison to the other coefficients. This could be explained by the fact that foods collected from public resources, like fish, meat, and honey, have higher nutritional content. Collecting and consuming these foods can significantly increase the FCS of households. For the variable region, it means that, compared to households in Dodoma, households in Morogoro have significantly higher values of FCS measures. The region variable represents the biophysical potential of the environment to produce food that, in turn, affects food availability and diets through direct consumption or as source of income to purchase food. Thus, controlling for these regional differences is essential. Although our findings suggest lower FCS for farmers living in the semi-arid Dodoma, an area known to have had a high prevalence of food insecurity, the food insecurity situation in the region is showing improvement (WFP, 2010). The lower FCS in Dodoma is against the relatively higher production diversity observed in Dodoma in our dataset, which may suggest that, besides production diversity measures, there might be other factors contributing to the observed higher FCS in Morogoro. While non-agricultural income variable is statistically significant, it has a low magnitude positive effect on food consumption. Nevertheless, this positive association is reasonable as additional income could be used to purchase different kinds of food from the market; however, the small coefficient indicates that this source does not play an outstanding role in subsistence agriculture.
The analysis shows that the distance to main road has a significantly negative association with FCS in the models estimating a coefficient for distance. Thus, households living far from the main road have less dietary diversity than those living close to the main road. Distance to the main road is used as a proxy for measuring market access. Market access influences the degree of market participation and commercialization. Although there is a view that increased commercialization benefits the welfare and improves the nutrition of poor households, the empirical evidence is mixed (Carletto et al., 2017). While the covariates of age (p < 0.1) and the share of food consumption (p < 0.05) show a weak negative and a negative association with FCS in the RE models, respectively, the FE models show a non-significant positive association with age and a non-significant negative association with share of food consumption.
Potential Limitations
In our analysis, we assume that for subsistence/semi-subsistence households, the decision on what to produce (principally for own consumption) is mainly influenced by the agroecology and soil condition of the farm location rather than the household preferences for a particular type of food. For market-oriented farm households, the production choice may additionally be optimized by tradability of food products in the market. Therefore, we do not expect consumption decisions to strongly influence the choice of agricultural production. However, Bellon et al. (2016) suggest that, in some contexts, production decisions could be influenced by consumption decisions. Without specifically addressing reverse causality, our results must be interpreted as strong evidence of association rather than causality.
Conclusion and Policy Implications
In this paper, we analyze the link between farm production diversity and smallholder farm households' dietary diversity in two regions of rural Tanzania. Our results show that, in our study area, households with greater production diversity in terms of crop and livestock species have better dietary diversity. The implications of the empirical evidence must be interpreted within the context of smallholder farmers who are mainly producing food for their own consumption. It is important to investigate how different agricultural policy scenarios and settings may affect this relationship and contribute to improving the diet diversity situation for rural households. For subsistence farmers who mainly produce for their own consumption, we recommend engaging in optimum levels of production diversity to improve access to a diverse diet. Interventions from policy makers or practitioners that promote diversification and commercialization need to carefully consider potential future climatic, technological, and farming system changes. A more systematic comparison of scenarios among different settings and production orientations (market vs. subsistence oriented) might help to identify the optimal diversification scale for improving dietary diversity.
Data Availability Statement
The datasets presented in this article are not readily available because the corresponding author does not have the full right to transfer data. Requests to access the datasets should be directed to http://www.trans-sec.org.
Ethics Statement
Ethical review and approval was not required for the study on human participants in accordance with the local legislation and institutional requirements. Written informed consent for participation was not required for this study in accordance with the national legislation and the institutional requirements.
Author Contributions
LH developed the study plan and performed the analysis, and wrote the manuscript with inputs from CG, HH, and SS. All authors contributed to the article and approved the submitted version.
Conflict of Interest
The authors declare that the research was conducted in the absence of any commercial or financial relationships that could be construed as a potential conflict of interest.
Acknowledgments
We would like to thank the whole Trans-SEC project team involved in data collection, preparation, and processing. We would also like to thank the two reviewers for providing us with valuable and constructive comments.
References
Alderman, H., Behrman, J. R., and Hoddinott, J. (2007). Economic and nutritional analyses offer substantial synergies for understanding human nutrition. J. Nutr. 137, 537–544. doi: 10.1093/jn/137.3.537
Bellon, M. R., Ntandou-Bouzitou, G. D., and Caracciolo, F. (2016). On-farm diversity and market participation are positively associated with dietary diversity of rural mothers in Southern Benin, West Africa. PLoS ONE 11:e0162535. doi: 10.1371/journal.pone.0162535
Brüssow, K., Gornott, C., Faße, A., and Grote, U. (2019). The link between smallholders' perception of climatic changes and adaptation in Tanzania. Clim. Change 157, 545–563. doi: 10.1007/s10584-019-02581-9
Carletto, C., Corral, P., and Guelfi, A. (2017). Agricultural commercialization and nutrition revisited: empirical evidence from three African countries. Food Policy 67, 106–118. doi: 10.1016/j.foodpol.2016.09.020
Chegere, M. J., and Stage, J. (2020). Agricultural production diversity, dietary diversity and nutritional status: panel data evidence from Tanzania. World Dev. 129:104856. doi: 10.1016/j.worlddev.2019.104856
Demeke, M., Meerman, J., Scognamilo, A., Romeo, A., and Asfaw, S. (2017). Linking farm diversification to household diet diversification from a sample of Kenyan ultra-poor farmers: ESA Working Paper No 17-01. Rome: FAO.
Dewey, K. G., and Begum, K. (2011). Long-term consequences of stunting in early life. Matern. Child Nutr. 7(Suppl. 3), 5–18. doi: 10.1111/j.1740-8709.2011.00349.x
Dillon, A., McGee, K., and Oseni, G. (2014). Agricultural Production, Dietary Diversity, and Climate Variability. Jeneva: World Bank. doi: 10.1596/1813-9450-7022
Global Nutrition Report (2020). Action on Equity to End Malnutrition. Bristol: Development Initiatives.
Graef, F., Sieber, S., Mutabazi, K., Asch, F., Biesalski, H. K., Bitegeko, J., et al. (2014). Framework for participatory food security research in rural food value chains. Global Food Security 3, 8–15. doi: 10.1016/j.gfs.2014.01.001
Hirvonen, K., and Hoddinott, J. (2017). Agricultural production and children's diets: evidence from rural Ethiopia. Agric. Econ. 48, 469–480. doi: 10.1111/agec.12348
Islam, A. H. M. S., Braun, J., von Thorne-Lyman, A. L., and Ahmed, A. U. (2018). Farm diversification and food and nutrition security in Bangladesh: empirical evidence from nationally representative household panel data. Food Security 10, 701–720. doi: 10.1007/s12571-018-0806-3
Jones, A. D. (2017). Critical review of the emerging research evidence on agricultural biodiversity, diet diversity, and nutritional status in low- and middle-income countries. Nutr. Rev. 75, 769–782. doi: 10.1093/nutrit/nux040
Jones, A. D., Shrinivas, A., and Bezner-Kerr, R. (2014). Farm production diversity is associated with greater household dietary diversity in Malawi: findings from nationally representative data. Food Policy 46, 1–12. doi: 10.1016/j.foodpol.2014.02.001
Kennedy, G., Berardo, A., Papavero, C., Horjus, P., Ballard, T., Dop, M., et al. (2010). Proxy measures of household food consumption for food security assessment and surveillance: comparison of the household dietary diversity and food consumption scores. Public Health Nutr. 13, 2010–2018. doi: 10.1017/S136898001000145X
Kissoly, L. D., Karki, S. K., and Grote, U. (2020). Diversity in farm production and household diets_ comparing evidence from smallholders in Kenya and Tanzania. Front. Sust. Food Syst. 4:77. doi: 10.3389/fsufs.2020.00077
Koppmair, S., Kassie, M., and Qaim, M. (2017). Farm production, market access and dietary diversity in Malawi. Public Health Nutr. 20, 325–335. doi: 10.1017/S1368980016002135
Lovon, M., and Mathiassen, A. (2014). Are the World Food Programme's food consumption groups a good proxy for energy deficiency? Food Security 6, 461–470. doi: 10.1007/s12571-014-0367-z
Mofya-Mukuka, R., and Hichaambwa, M. (2018). Livelihood effects of crop diversification: a panel data analysis of rural farm households in Zambia. Food Security 10, 1449–1462. doi: 10.1007/s12571-018-0872-6
Pellegrini, L., and Tasciotti, L. (2014). Crop diversification, dietary diversity and agricultural income: empirical evidence from eight developing countries. Can. J. Dev. Stud. 35, 211–227. doi: 10.1080/02255189.2014.898580
Purwestri, R. C., Renz, L., Wirawan, N. N., Jati, I. R. A. P., Fahmi, I., and Biesalski, H. K. (2017). Is agriculture connected with stunting in Indonesian children living in a rice surplus area?: a case study in Demak regency, Central Java. Food Security 9, 89–98. doi: 10.1007/s12571-016-0634-2
Rajendran, S., Afari-Sefa, V., Shee, A., Bocher, T., Bekunda, M., dominick, I., and Lukumay, P. J. (2017). Does crop diversity contribute to dietary diversity?: evidence from integration of vegetables into maize-based farming systems. Agric. Food Security 6:67. doi: 10.1186/s40066-017-0127-3
Ruel, M. T. (2002). Is dietary diversity an indicator of food security or dietary quality? A Review of Measurement Issues and Research Needs. Food Nutr. Bull. 24, 231–232. doi: 10.1177/156482650302400217
Sekabira, H., and Nalunga, S. (2020). Farm production diversity: is it important for dietary diversity? Panel data evidence from Uganda. Sustainability 12:1028. doi: 10.3390/su12031028
Sibhatu, K. T., Krishna, V. V., and Qaim, M. (2015). Production diversity and dietary diversity in smallholder farm households. Proc. Natl. Acad. Sci. U.S.A. 112, 10657–10662. doi: 10.1073/pnas.1510982112
Sibhatu, K. T., and Qaim, M. (2018). Review: meta-analysis of the association between production diversity, diets, and nutrition in smallholder farm households. Food Policy 77, 1–18. doi: 10.1016/j.foodpol.2018.04.013
Victora, C. G., Adair, L., Fall, C., Hallal, P. C., Martorell, R., Richter, L., et al. (2008). Maternal and child undernutrition: consequences for adult health and human capital. Lancet 371, 340–357. doi: 10.1016/S0140-6736(07)61692-4
WFP (2010). United Rebuplic of Tanzania Comprehensive Food Security and Vulnerability Analysis (CFSVA). United Nations World Food Programme, Rome Italy.
WFP (2012). Nutrition at the World Food Programme Programming for Nutrition-Specific Interventions. World Food Program product sheet
Wooldridge, J. M. (2012). Introductory Econometrics: A Modern Approach, 5th Edn. Mason, OH: South-Western Cengage Learning.
World Bank (2007). From Agriculture to Nutrition:Pathways, Synergies and Outcomes. Report No. 40196-GLB. The World Bank Agriculture and Rural Development Department.
Zanello, G., Shankar, B., and Poole, N. (2019). Buy or make? Agricultural production diversity, markets and dietary diversity in Afghanistan. Food Pol. 87.
Appendix 1. Descriptive Statistics of Variables Characteristics for 2014 and 2016 Survey Data Disaggregated by Region
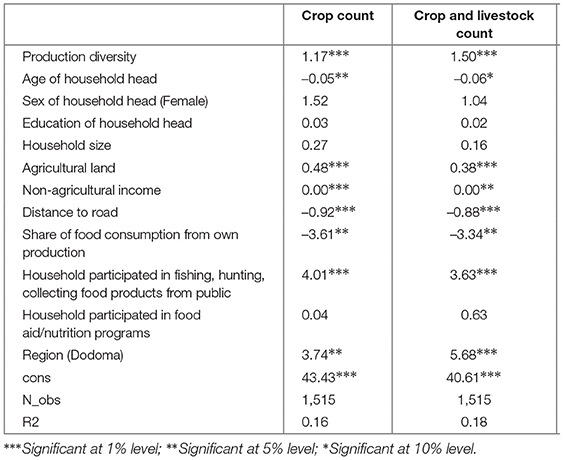
Appendix 2. Pooled Regression Results on The Association Between Production Diversity and Dietary Diversity
Keywords: dietary diversity, production diversity, panel methods, smallholders, Tanzania
Citation: Habtemariam LT, Gornott C, Hoffmann H and Sieber S (2021) Farm Production Diversity and Household Dietary Diversity: Panel Data Evidence From Rural Households in Tanzania. Front. Sustain. Food Syst. 5:612341. doi: 10.3389/fsufs.2021.612341
Received: 30 September 2020; Accepted: 12 April 2021;
Published: 17 May 2021.
Edited by:
Kathleen L. Hefferon, Cornell University, United StatesReviewed by:
Aida Turrini, Council for Agricultural Research and Economics, ItalyMaria Ewa Rembialkowska, Warsaw University of Life Sciences, Poland
Copyright © 2021 Habtemariam, Gornott, Hoffmann and Sieber. This is an open-access article distributed under the terms of the Creative Commons Attribution License (CC BY). The use, distribution or reproduction in other forums is permitted, provided the original author(s) and the copyright owner(s) are credited and that the original publication in this journal is cited, in accordance with accepted academic practice. No use, distribution or reproduction is permitted which does not comply with these terms.
*Correspondence: Lemlem Teklegiorgis Habtemariam, bGVtbGVtLmhhYnRlbWFyaWFtQHBpay1wb3RzZGFtLmRl