 Margaret D. March
 Paul R. Hargreaves
 Robert M. Rees
- Scotland's Rural College (SRUC), Edinburgh, United Kingdom
The UK livestock industry urgently needs to reduce greenhouse gas (GHG) emissions to contribute to ambitious climate change policy commitments. Achieving this requires an improved understanding of emission sources across a range of production systems to lower the burden associated with livestock products. Life cycle assessment (LCA) methods are used in this study to model milk production from two genetic merits of Holstein Friesian cows managed in two novel and two conventional UK dairy systems. Select merit cows sired by bulls with high predicted transmission for fat plus protein yield are compared with Control merit animals sired from UK average merit bulls. Cows were managed in conventional housed and grazed dairy systems with novel Byproduct and Homegrown feeding regimes. A LCA was used to quantify the effect of allocation and management of feed components on the carbon footprint of milk production. Natural variation in nutritional quality of dairy system rations was investigated to quantify uncertainty in the carbon footprint results. Novel production system data are used to assess the effect of introducing home grown legumes and co-product feeds. Control merit footprints across each of the management regimes were significantly higher (p<0.001) in comparison with a high production Select merit, on average by 15%. Livestock emissions (enteric, manure management and deposition) and embedded emissions (purchased feeds, fertiliser, and pesticides) were also significantly higher from control merit cows (p<0.01). Mass and economic allocation methods, and land use functional units, resulted in differences in performance ranking of the dairy systems, with larger footprints resulting from mass allocation. Pairwise comparisons showed GHG's from the systems to be significantly different in total and source category emissions, with significant differences in mean embedded emissions found between most management systems (p<0.05). Monte Carlo simulated system footprints considering the effect of variation in feed digestibility and crude protein also differed significantly from system footprints using standard methods (p < 0.001). Dairy system carbon footprint results should be expressed using multiple units and where possible calculations should incorporate variation in diet digestibility and crude protein content.
Introduction
The UK government is committed to reducing GHG emissions to net zero by 2050 with an even more ambitious target date of 2045 in Scotland (Committe on Climate Change, 2019). Agriculture is estimated to be responsible for 10–12% of global anthropogenic greenhouse gas (GHG) emissions (Smith et al., 2014). Emissions stemming from milk production in developed dairy regions such as the UK are estimated at between 1.2 and 1.4 kg CO2e/kg, respectively, which is lower than the global average of 2.5 kg CO2e/kg of fat and protein corrected milk (FPCM) (FAO, 2019). Dairy products have been processed and consumed in Britain since the Neolithic era and grassland, including rough grazing, covers ~80% of the land area in Scotland (Charlton et al., 2019). However, agriculture is now the second largest source of GHG emissions in Scotland and there is an urgent need for this sector to contribute to national GHG emission reductions (SG, 2018). GHG emissions from livestock need to be reduced at a time when global demand for these commodities is increasing (Opio et al., 2013; FAO, 2019). UK GHG emissions from agriculture have declined by ~14% since 1990, and reductions have largely arisen from a change to the Common Agriculture Policy (CAP), which ended a link between subsidy amounts and animal numbers (DBEIS, 2019, AHDB, 2014). Fewer total livestock numbers have led to lower stocking densities, less manure, and thus lower emissions (Rotz, 2004; del Prado et al., 2010; DBEIS, 2015). Formulating policies to enable further emission reductions on dairy farms will require an understanding of mitigation measures appropriate for specific production systems.
Models used to quantify GHG's are important tools to aid the understanding of mitigation pathways that lie within the intricate footprints of livestock systems (Opio et al., 2013). Estimates of GHG emissions from livestock systems contain uncertainties from model boundaries and allocation, variation in input values, or epistemic uncertainty arising from modelled biological processes, all of which present challenges for researchers and decision makers (IPCC, 2006; Flysjö et al., 2011; Opio et al., 2013; Röös and Nylinder, 2013). Epistemic uncertainty analyses of modelled dairy and beef livestock systems have shown that, overall, nitrous oxide (N2O) and methane (CH4) emissions from manure, fertiliser N input, and enteric CH4 contribute most to variability and can inflate GHG emissions in livestock footprints (Ross et al., 2014; Zehetmeier et al., 2014; Sykes et al., 2019). Variation of N2O emissions in dairy system footprints was found to mainly stem from the IPCC emission factor for volatilisation and atmospheric deposition of N (Ross et al., 2014). Sensitivity analysis provides a deeper technical understanding of complex systems and is recommended to clarify potential impacts, however Baldini et al. (2017) show that only 20% of 44 reviewed LCA studies of milk production published between 2009 and 2015 carried out sensitivity analysis.
Gradual improvements in methodology have allowed more precise estimates of emissions arising from agricultural systems. However, simultaneously annual global GHG emissions have continued to increase and the interval available to implement reduction strategies narrows (Boden et al., 2017). Numerous examples can be found in the literature comparing carbon footprints arising from various dairy production methods in Scotland (Ross et al., 2014) and across the world (Cederberg and Mattsson, 2000; Basset-mens et al., 2005; Flysjö et al., 2011; O'Brien et al., 2014) including suggestions for establishing a system emitting less CO2 per unit product or management type (O'Brien et al., 2012). However, differences in LCA methodology, allocation methods (for milk and meat) or functional unit hinder comparability (Baldini et al., 2017) and a meta-analysis of 30 published LCA's with 87 carbon footprints from pasture, mixed, and confinement dairy systems found no average footprint differences per kg of FPCM (Lorenz et al., 2019). Choice of functional unit is also important when expressing results from LCA studies assessing environmental impacts arising from differing dairy systems and when considering effects of intensification (Ross et al., 2017, Salou et al., 2017). As far as the authors are aware, allocation methods assessing feed components and their effect on dairy system carbon footprints are not available in literature.
Studies quantifying uncertainty and assessing sensitivity of milk production LCA's have investigated management changes, C sequestration (O'Brien et al., 2012), manure storage (O'Brien et al., 2012; Battini et al., 2014) and changes in energy consumption (Roer et al., 2013). Methodologies to model CH4 and N2O emissions from manure, and enteric CH4, require measurements of diet digestibility and crude protein (CP) (Dong et al., 2006). The consequences of dietary and other variabilities should be considered, and uncertainties communicated when quantifying dairy farm carbon footprints (Zehetmeier et al., 2014; Milne et al., 2015). Of the nine LCA studies reviewed by Baldini et al. (2017) that incorporated sensitivity analysis an assessment of variability of crude protein and digestibility was not reported, this information is not available in literature for multiple dairy systems as far as the authors are aware.
The digestibility of a dairy cow diet relates to the chemical composition of feed components and also the ration as a whole. Digestibility can be described as the fraction of a food that is absorbed, and this is affected by fibre content of feeds, of which the forage components tend to exhibit wider variation (McDonald et al., 2011). Predictions of enteric CH4 emissions are lower from diets with high digestibility (Röös and Nylinder, 2013) and diet digestibility has been shown to influence uncertainty in beef production footprints (Sykes et al., 2019). Rations containing optimum digestibility and balanced CP can lead to lower GHG emissions because a cow would require less feed to meet nutritional requirements. Conversely, too much CP leads to higher N excretions, which can cause nutrient surpluses that contribute to air and water pollution, as well as climate change. Edouard et al. (2019) showed that IPCC GHG estimates were not as accurate for high levels of dietary N because of increased NH3 emissions. When compared with soybean meal, the addition of legumes such as faba beans and peas in a ruminant ration were shown to have higher digestibility, CP and energy, which can be beneficial for dairy cow nutrition (Volpelli et al., 2012), as long as rations are balanced to ensure higher levels of CP do not reduce nitrogen use efficiency (NUE).
Legumes are found in a wide range of ecosystems and the majority are genetically distinct form other plant species due to a symbiotic relationship with rhizobia. These are soil bacteria located within root nodules with the ability to fix nitrogen from the atmosphere (Kenicer, 2005). Within crop rotations, legumes can displace the need for imported nitrogen fertilisers, as well as nurture and condition the soil, which can have positive environmental and resource security consequences along with disease suppressing qualities (Lüscher et al., 2014; Stagnari et al., 2017). Home-grown protein feeds for animal production are increasingly being encouraged in the EU to reduce the protein deficit that relies upon soya imports which can fluctuate in price and can be associated with rainforest loss (European Parliament, 2018; Taherzadeh and Caro, 2019). Introducing legumes such as spring beans into crop rotations has the potential to reduce emissions through displacement of fertilisers, which in Scotland would translate to 100 to 180 kg/ha less N per year for spring and winter cereals, respectively (Iannetta et al., 2019). Legumes are estimated to generate <20% of the emissions associated with synthetic fertilisers, however N2O emissions can still occur from leguminous crop residues (Senbayram et al., 2015; Stagnari et al., 2017). Increasing the ratio of corn to alfalfa silage on large and small dairy farms in northern US has been shown to raise farm gate GHG emissions per kg of FPCM (Kim et al., 2019). An increase in the use of forage legumes within dairy systems should therefore be considered to improve outcomes for livestock and the wider environment.
This study adds to literature on Scottish dairy farm carbon footprinting carried out by Ross et al. (2014) by presenting novel Homegrown and By-product feeding systems in comparison with more conventional management techniques. This paper seeks to clarify the impact of dairy systems on the environment using a modelling approach to address specific questions; (i) what effect does the method of allocation of emissions from animal feeds in dairy systems have on the carbon footprint of milk produced, (ii) what effect does alternative system inputs, such as legumes and co-products have on the composition of carbon footprints and (iii) what is the effect of variation in feed digestibility and CP content on the global warming potential of milk produced in dairy systems under a range of management scenarios. Carbon footprints from Holstein Friesian cows managed in novel and conventional UK dairy feeding regimes are presented using life cycle assessment (LCA) methods. Monte Carlo simulations were applied to describe uncertainty brought about by variation in nutritional quality of the diets. Carbon footprint results using mass and economic allocation of feed components, land use functional units and considering variation in CP and digestibility were compared by ranking performance. Knowledge surrounding effects of UK farm grown forage legumes on dairy carbon footprints and insight into the influence of variation of feed digestibility and CP content in LCA uncertainty are novel aspects of this study. Additional impact categories are not presented in this manuscript, in order to focus on GHG emissions and climate change.
Materials and Methods
Dairy Systems Description
Data in this study originates from the Langhill herd of Holstein Friesian cows which form one of the worlds' longest running genetic line × feeding systems experiments (Pollott and Coffey, 2008). Data were used from all cows belonging to the herds based at the SRUC's Crichton Royal Farm, Dumfries, Scotland between 2006 to 2010 and 2012 to 2015. A Select (S) group of cows sired by bulls with high predicted transmitting abilities (PTA) for fat plus protein yield are compared with a Control (C) group sired from UK average merit bulls (Pryce et al., 2001). System experiments were managed according to the same rules and each regime was designed to allow animals to express their potential for milk production, within the limitations based on the feed rations offered. All experimental cows were milked three times per day and if not grazing were housed in the same building, with cubicles and concrete passageways that were cleaned with automatic scrapers. A complete diet was offered as a total mixed ration (TMR), irrespective of milk yield and stage of lactation. The four dietary treatments compared in this analysis were,
i. a high forage (HF) composite system which can be defined as a conventional regime; grazing cows when availability of grass is adequate and housing during inclement winter months when animals are fed conserved forage and concentrate through a total mixed ration (TMR),
ii. a novel home grown (HG) partially housed system, defined here as a regime where all feed is grown on farm using legume-based protein sources with no purchased feeds except minerals, and where animals are housed for one period each day and fed a conserved forage TMR,
iii. a low forage (LF) conventional housed system with animals confined all year round and being fed a diet of conserved forage and concentrate through a TMR,
iv. a novel by-product (BP) fully housed system that required no on-farm land by feeding mainly non-human edible co-products from the food industry with no forages except straw.
Data were collected over 5 years from January 2006 to December 2010 for LF and HF systems and over 4 years for HG and BP systems from January 2012 to December 2015 providing eight systems in total defined as Low Forage Control (LFC), Low Forage Select (LFS), High Forage Control (HFC), High Forage Select (HFS), Byproduct Control (BPC), Byproduct Select (BPS), Homegrown Control (HGC) and Homegrown Select (HGS). During 2011, cows consuming an LF diet transitioned to BP diet and HF to a HG diet. Herd size for each sub-group was maintained at ~50 cows during the experiments. Herds were managed in feed groups which contained cows of both genetic merits and animals remained in the same system for three lactations or until there was a suitable replacement. Cows within each herd calved all year round (AYR) and were dried off 8 weeks prior to estimated calving date. Calving intervals for the LF and HF herds are presented in March et al. (2017). Youngstock were managed as one group, with rations attributed by age, for heifer calves 0–12 months, and from 12 to 24 months.
Data Collection
Each sub-group was treated as a whole farm in the life cycle inventory. Four dietary treatments and two genetic merits of cow allowed a comparison of eight diverse dairy production systems summarised annually. Milking and dry cow populations were evaluated for each sub-group and replacement animal populations were categorised by age for calves and heifers as 0–12, 12–24, >24 months. Milk yield was measured for individual animals at each milking with a sample taken once per week and analysed for fat and protein content by infra-red spectroscopy. Samples were analysed using a Milkoscan minor spectrophotometer (Foss Ltd., Denmark) and calibrated by methods of AOAC (2000). Outputs of milk were summed for the systems annually and weekly fat and protein constituents were averaged. Liveweights were recorded three times per day after milking and weekly liveweights were recorded for dry cows and replacements.
In each dietary regime Select and Control merits were housed together on one side of the building in two management groups which rotated every 3 days either being fed using automatic gates or behind a strap. A formulated TMR was offered daily, and average rations for each diet are presented in Table 1. Individual feed intakes for milking cows were measured using HOKO gates (Insentec BV, Marknesse, The Netherlands). LF and HF cows were fed 0.75 kg/day fresh weight of a standard 16% CP complementary parlour concentrate whilst milking. Dairy system inputs and outputs were determined annually using data extracted directly from SRUC's Langhill herd database and averages of production indicators are presented in Table 2 for Select and Table 3 for Control systems. Intakes of grass were not measured, however, periods of time spent grazing were recorded and samples of fresh grass were taken and analysed. Dry cows consumed a straw based diet and were then fed a transition diet 3 weeks before calving which consisted of 33% of the average daily dry matter intake of the appropriate milking cow ration plus 5 kg straw. Housed youngstock were managed as a group and offered a ration that included straw, distillers grains, and molasses.
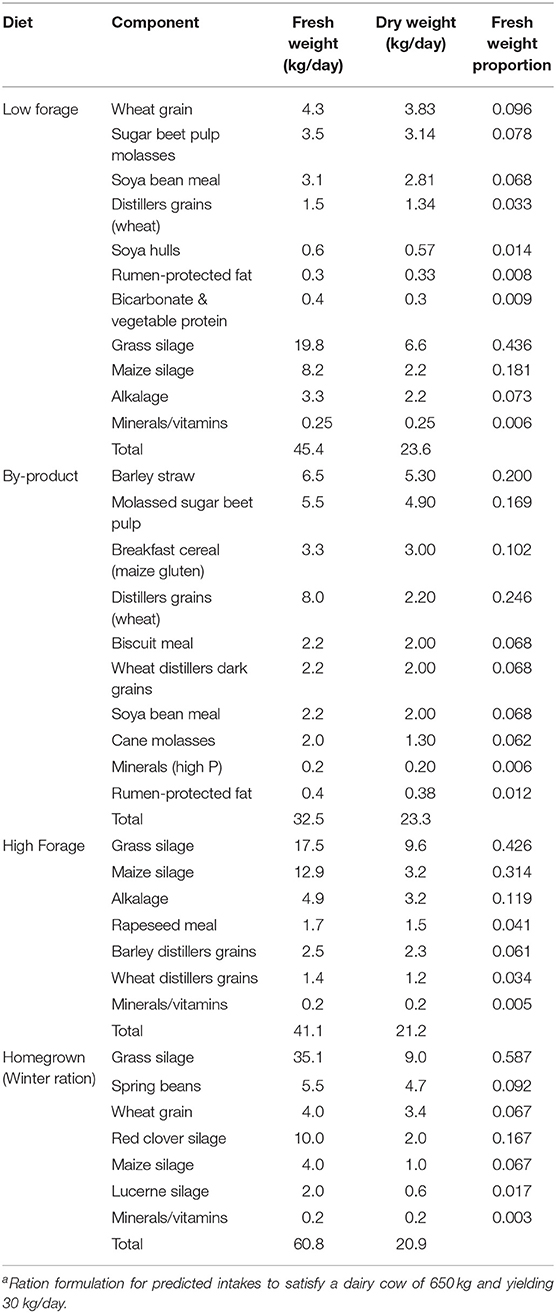
Table 1. Ration constituent proportions in fresh weight and dry weighta.
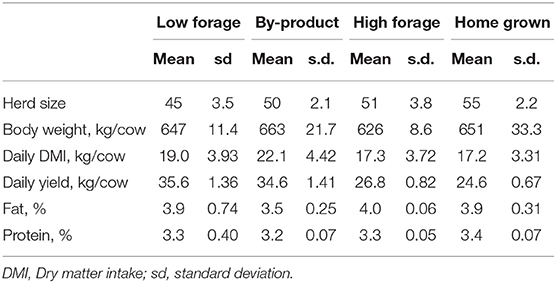
Table 2. Average annual production characteristics for high production select merit cows.
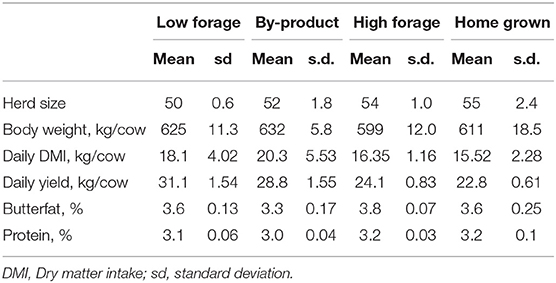
Table 3. Average annual dairy system production characteristics for control merit cows.
Forage components of the LF, HF and HG system diets were grown on the farm. Maize, wheat, and spring beans were sown annually, lucerne every 2 years and grassland for pasture and silage every 5 years. Up to three cuts of ryegrass silage were harvested each year and any instances of double cropping of fields were noted with the lengths of time attributed to each crop allocated accordingly. For example, a field to be sown for maize may have been cut for silage before ploughing and there were instances where a grass silage cut was taken from a field sown for red clover bales. Harvested crops were stored on farm in covered clamps. Land required annually for those systems consuming crops grown on the farm was determined from amounts and DM's of each crop component fed to the herds and the crop DM and yield at harvest. Dry matter losses occurred at harvest, during ensiling or baling with estimated losses from grass silage, wheat alkalage, red clover bales and maize silage applied when considering land requirements for sub-groups because crops were not grown or ensiled separately for each of the dairy systems. An estimate of surface and effluent DM losses in the ensiling clamp were added to an estimate of wilting, leaching, respiration and mechanical field losses of crop to determine total land requirement by crop (Bastiman and Altman, 1985; Xiccato et al., 1994). Total land for each system year was calculated by adding on-farm land required to an estimate of off-farm land. Off-farm land was approximated using economic allocation of feed components within each of the diets, national data for crops SAC Consulting (2016) and Feedprint (Vellinga et al., 2013) for processed feeds. Table 4 presents estimated feed component land use requirements and GHG emissions associated with mass and economic allocation methods for purchased feed inputs. TMR's were sampled monthly and wet chemistry analysis provided measurements of metabolisable energy (ME) content, dry matter (DM), digestibility and crude protein (CP) content of the ration (AOAC, 2000). Within the BP system only non-human edible purchased concentrates and straw were consumed (Table 1). Leguminous by-products, soya bean meal and soya hulls were included in the LF and BP housed system TMR's at proportions of 14 and 9%, respectively. Legumes grown on the farm for the HG system represented 25% of the winter TMR and there were no legumes or leguminous by-product components fed within the HF regime (Table 1).
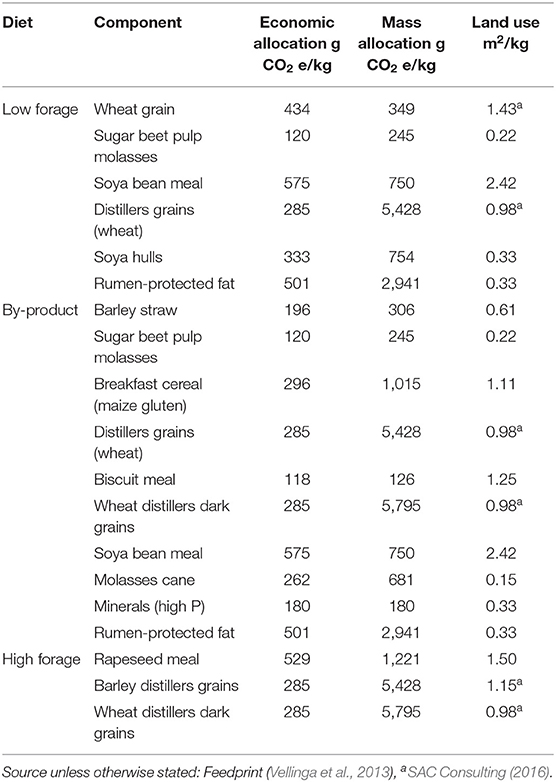
Table 4. GHG emissions and land use factors applied to dairy system purchased feed components.
Applications of nitrogen (N), phosphorus (P), and potassium (K) fertilisers and organic fertiliser to crops grown on the farm were determined by the farm manager using a long-term nutrient management plan. Fertiliser use data recorded for each crop area with application rate and fertiliser type was compiled annually and apportioned to each system by crop land requirement for that system. Organic fertiliser was applied as solid manure or as liquid slurry using a splash plate, trailing shoe, or by shallow injection. Manure was managed as solid or liquid storage or deposited at pasture. Liquid manure was pumped from the building and stored in uncovered slurry tanks and solid manure was stored uncovered outdoors. All youngstock and dry cow manure was managed as solid storage. All manure from housed milking cows was stored in liquid storage. Types, amounts and application rates of insecticide, fungicide and herbicide sprays applied to each crop were obtained from the Langhill herd database and directly from the supplier (pers. comm. Richard Bray). Forestry and other land managed within the farm boundary such as broadleaf woodland and biodiversity strips were apportioned using annual data prepared by the farm manager for farm subsidy applications (Pers. Comm. H. McClymont, SRUC) depending on the age and type of woodland.
Use of petrol and diesel, including the fuel needs of contractors, for each required activity was recorded in the Langhill database and then attributed to a feeding system by task, such as fertiliser application, and then by genetic group. Activities on the farm that required fuel related to crop management included fertiliser applications and herd management, such as feeding. Electricity use (kWh) was estimated from average milk yield per cow in each system using the method of Sheane et al. (2010) which applies 0.051 kWh/kg milk for yields of 6,500–8,500 litres per cow and 0.045 kWh/kg milk for yield >8,500 litres. Electricity was estimated from milk yield because power consumed was not recorded separately for each of the systems. Average annual energy use data is provided in the Supplementary Material. Annual diet digestibility and CP for each of the systems were determined from proportional intakes from monthly TMR and feed component sample analysis.
Life Cycle Assessment
Goal and Scope
Life Cycle Assessment (LCA) is a key approach to determine environmental or other impacts along a product chain and is carried out according to ISO 10440 and ISO 10444 standards. This research applies an attributional “cradle to farm gate” LCA method as defined by the British Standards Institute (BSI) PAS2050 (BSI, 2011) for the assessment of the life cycle GHG emissions of goods and services. Boundaries applied in this study were “cradle to farm gate” which included all stages from production of farm inputs and raw materials until the milk or animals left the farm. This boundary included supply chain input resources and emissions that are generated off farm, such as those associated with growing and manufacturing purchased feeds, transport, fertiliser manufacture as well as fuel and electricity production. On farm system components included applications of fertilisers, sprays, fuel, crops and field activities, animal feed, livestock of all ages and the management of their manure. Minor emission sources excluded on the basis of materiality PAS2050 (BSI, 2011) in this study were indirect emissions such as staff travel, maintenance of farm buildings, disposal of dead animals and ancillary purchases such as medicine and disinfectants used to clean infrastructure.
A standard functional unit (FU) related to dairy LCA's of fat and protein corrected milk was applied using the following equation (IDF, 2015),
FU's applied in this study are one kilogramme of FPCM milk leaving the farm gate, total hectares of land required and FPCM production per hectare of total land required. When considering intensification land use is important, because globally land availability is a limiting factor for agriculture (Salou et al., 2017). Area based emissions are used in policy setting and results presented in this research allow comparisons with other studies that consider land such as O'Brien et al. (2012); Ross et al. (2017); Salou et al. (2017).
Allocation describes how GHG's are attributed to the products, and possible co-products that leave the farm and the methods applied affect the estimation of emissions. In this case, as no crops were sold, co-products included animals culled and manure exported from the system. Methods of allocation available in LCA studies include biological causality, system expansion, economic allocation, mass allocation and no allocation (Audsley et al., 1997). In this study a whole farm approach is taken and emissions are allocated between milk and meat using no allocation to meat and 100% to milk. Emissions from co-product feeds were allocated proportionally by component as described by Vellinga et al. (2013). Greenhouse gas emissions attributed to feeds purchased for the LF, HF and BP systems followed an economic allocation method by feed component in the first instance and a mass allocation method as a comparison, shown in Table 4. This comparison is reported for Select merit herds in the BP, LF, HF and HG feed systems. Additional impact categories are not presented in this study to focus on types and sources of GHG emissions from a range of dairy systems.
Inventory Analysis
A life cycle inventory of annual data from five system years 2006–2010 for HF and LF diets and four system years 2012–2015 for HG and BP treatments was compiled for both genetic merits. Emissions from livestock were calculated using monthly herd dynamic data that was prepared for each of the systems for all years to determine livestock within each of the age categories, those culled, died, or sold, as well as dry and transition cows. Manure management emissions for each of the systems were allocated by the length of time cattle spent at either liquid storage, solid storage or depositing at pasture. Data showing proportions of time that cattle spent in each manure management category are provided in the Supplementary Material. Liquid slurry stems from the housed milking cows and the proportions of time spent grazing were determined and used to allocate deposition directly at pasture. Dry, transition cows and young stock generated solid manure. Manure generated by the dairy systems that was not applied to the crops was exported.
Livestock emissions from dairy cattle included those stemming from manure and enteric CH4, direct and indirect N2O from manure management, and additionally leaching of N from the soil, and ammonia (NH3) volatilisation arising from the application and deposition of manure. Amounts of N excreted were estimated from N consumed minus N utilised for production, growth and maintenance, which were derived from dry matter intake and CP content of the diets (Dong et al., 2006). Tier II emission factors (EF's) were applied for livestock and manure management and Tier I for fertiliser and crop residue N2O (de Klein et al., 2006; Dong et al., 2006). GHG emissions from production, processing, and distribution are embedded in purchased feeds brought onto the farm. Embedded emissions from fertiliser included those associated with manufacture and distribution, which, in the case of the Haber process for N, can be energy intensive. The global warming potentials associated with each feed component within the TMR's of the four diets are presented in Table 4. The LF and HF diets included a proportion of distillery products and the BP system comprised of purchased co-products from the bakery, distillery, brewing and confectionary industries. Estimated GHG emissions per kg for crops in the HG diet are presented in the Supplementary Material and the GWP of minerals in the LF, HF and HG diets was 261 kg CO2e/kg using mass and economic allocation (Vellinga et al., 2013). The CT (2010) database was used to source emission factors applied to the production of fertilisers and pesticides (Table 5). Land category emissions arising from fertiliser application include N2O from soil, volatilisation, leaching and run-off as well as N2O emissions from crop residues. Carbon sequestration of farm woodland (by age and type) is modelled using Tier 1 IPCC (2006) methodology and reported separately as a reduction of net emissions. Selected emission factors and equations applied within this study are shown in Table 5.
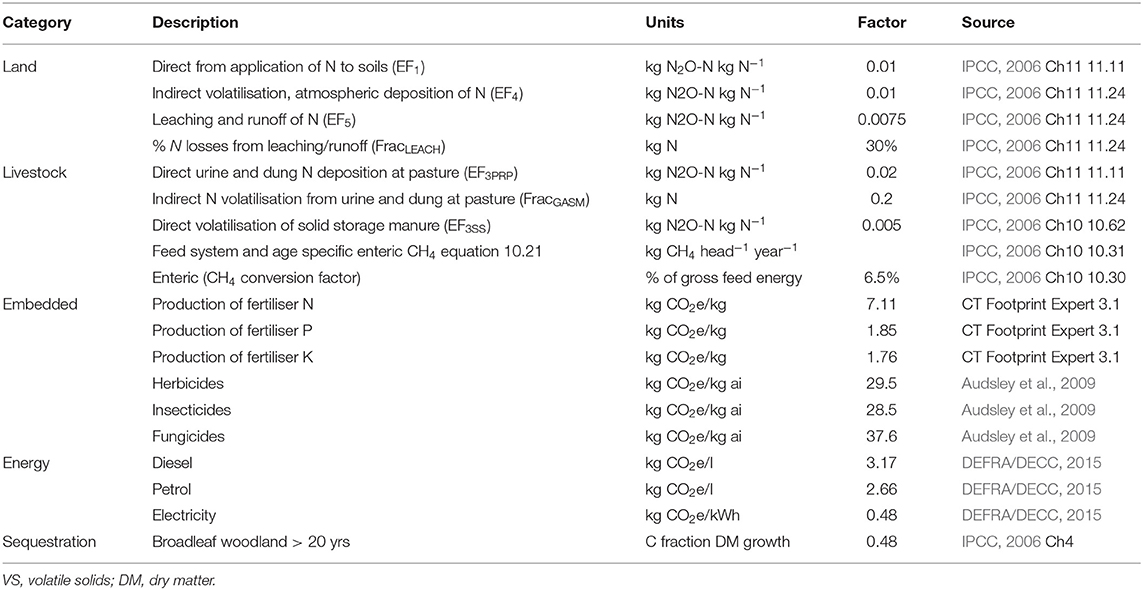
Table 5. Selected emission factors and calculations applied within the model.
LCA - Impact Assessment
The impact category of interest in this study is climate change, which was assessed by estimating total GHG emissions expressed in kg CO2e stemming from the annual inventories of the dairy systems. The inventory prepared for each of the eight systems provided annual farm inputs and outputs from 36 distinct annual inventories which refer to nine calendar years in total for subsequent analysis using SRUC's Agricultural Resource Efficiency Calculator (Agrecalc) v1.4 (SRUC, 2014). Agrecalc (SRUC, 2014) is a carbon foot-printing and resource efficiency tool designed to model emissions at farm level using IPCC methodology (Dong et al., 2006). A PAS2050 (BSI, 2011) accredited model is available online and the tool is used by consultants, farmers, and livestock researchers (Toma et al., 2013; Sykes et al., 2017). Factors applied in Agrecalc (SRUC, 2014) to convert GHG emission flows to CO2e were 25 and 298, for emissions of CH4 and N2O, respectively.
Statistical Analysis
Statistical analyses were carried out in R version 3.5.2 (R Core Team, 2013) using lme4, car, and lattice packages (Bates et al., 2015), to determine the effect of dairy production system upon product GHG emissions. Footprints applied in the statistical analysis were estimated using economic allocation of feeds and a FPCM FU for comparability with other studies. A linear mixed model was fitted and included fixed effects of feeding regime, genetic merit, and a random effect of year. An ANOVA, and a Tukey pairwise comparison test was carried out to determine significance of the production systems using the following model,
Where,
Sensitivity and Uncertainty Analysis
Stochastic simulations were carried out using ModelRisk5 (Vose Software) to assess the effect of annual variation in neutral cellulase gammanase digestibility (NCGD) and CP content of the rations on dairy system GHG emissions. Agrecalc (SRUC, 2014) was used to estimate baseline carbon footprints from all feed systems and both genetic merits using economic allocation of feeds and average annual values for NCGD and CP content. A FPCM FU is used for consistency and ease of comparability. Variation applying mass allocation of purchased feed emissions is not assessed in this study. Monte Carlo simulation using repeated random sampling was used to generate distributions of footprints for the dairy systems that accounted for uncertainty stemming from variability in NCGD and CP content for each treatment group. Descriptive statistics for the NCGD and CP distributions are shown in Table 6. Exponential and Log Laplace distributions were fitted to NCGD and CP analysis results, respectively, and Monte Carlo simulations with 10,000 iterations (seed = 2,605) were carried out. To determine if there was a significant difference in sensitivity the footprint outputs from the linear mixed model detailed in the previous section were refitted and modelled and an Anova was carried out to test for a significant difference between the models.
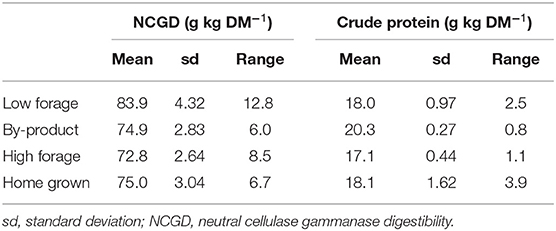
Table 6. Diet digestibility and crude protein content, mean sd and range.
Results
Statistical Analysis
An ANOVA was conducted to compare GHG's and test for significant differences between the four feeding regimes and two genetic merits using an economic allocation of feed emissions and results (Table 7). Normality checks and Levene's test were carried out and the assumptions were met. The effect of the interaction was significant (p < 0.01). There was a significant difference in mean GHG's per kg FPCM between the feed groups [F(3, 28) = 15.6, p < 0.001] and the genetic merits [F(1, 28) = 46.5, p < 0.001]. Post hoc comparisons using the Tukey test showed mean Select and Control merit GHG totals to be significantly different (p < 0.05) in LF, BP and HF feed types but no significant difference was found between the HG and HF diet. Tukey test results showed that the LF diet was significantly different from BP (p < 0.05), the HF and the HG (p < 0.001) diets for GHG totals. Significant differences in mean embedded emissions were found between all management systems (p < 0.05) and livestock emissions were all significantly different (p < 0.05) apart from HFS and HGS regimes (Table 7).
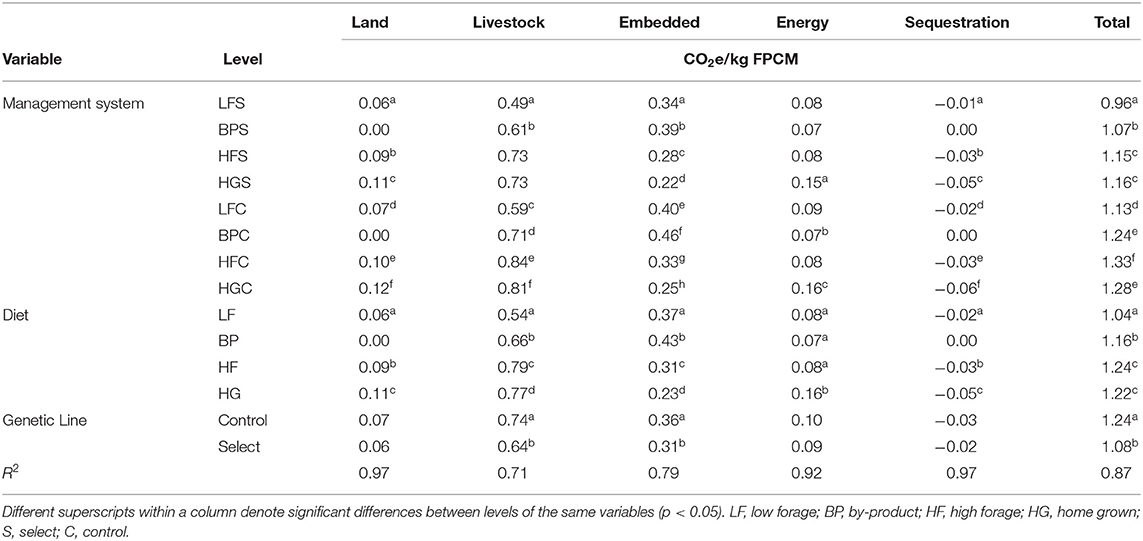
Table 7. Least square means (lsm) of dairy system GHG's by emission type.
Effect of Allocation Method
For Select merit herds the average annual carbon footprint for milk produced in each of the dairy systems was calculated using both economic and mass allocation of feed components which resulted in large differences in the ranking of the different systems (Figure 1). In the housed systems, with economic allocation, the BP diet is associated with higher emissions per kg product at 1.07 kg CO2e/kg FPCM compared with the LF system, which averaged 0.95 kg CO2e (Table 7). Economic allocation of feed components in the HF and HG grazed system footprints led to similar product emissions per kg of FPCM at 1.15 and 1.16 kg CO2e, respectively, as a result of lower embedded emissions in the HG system (Table 7) that were outweighed by higher emissions from energy and fuels. The HG system is connected with higher fuel use associated with crop production on farm. Economic allocation of emissions for the HF and HG TMR's were 206 and 252 kg of CO2e, respectively. Mass allocation of feed components led to increases in system footprints per kg FPCM because emissions were higher for all diet TMR's, except HG. TMR emissions were 473, 2,072, 757 and 252 kg CO2e/tonne, for the LF, BP, HF and HG systems, respectively. On average, in the housed systems, BP diet emissions increased per kg product from 1.07 to 3.79 kg CO2e/kg FPCM using economic and mass allocation, respectively. LF system product emissions averaged 0.95 kg CO2e/kg FPCM using economic allocation and 1.3 kg CO2e/kg FPCM using mass allocation (Figure 1). Control merit results followed the same rank order and are reported in the Supplementary Material.
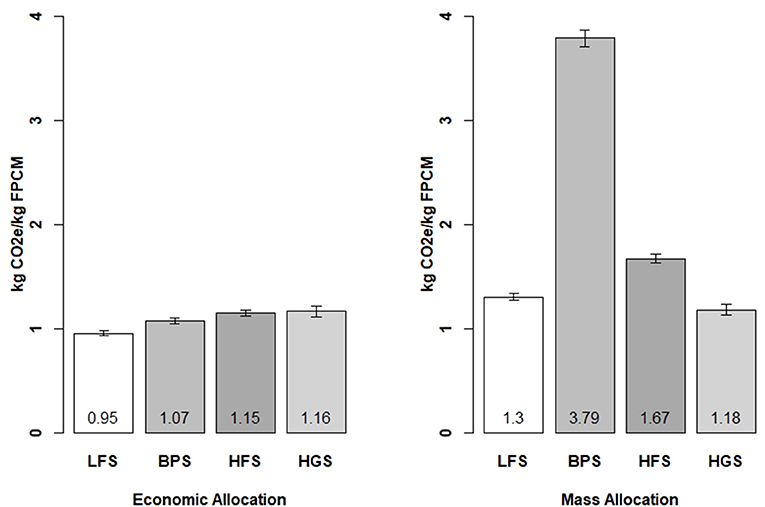
Figure 1. Select merit dairy system average annual footprints per kg of FPCM using Economic and Mass allocation of feed components.
Sensitivity and Uncertainty Analysis
Simulated footprints were generated using economic allocation of feeds to obtain distributions of dairy management system results if variation in NCGD and CP levels were considered. Mean dairy system footprint simulations considering the effect of NCGD and CP variation differed significantly from mean system footprints estimated using average annual NCGD and CP values (p < 0.001). Mean milk footprints were increased in the BP and HF systems and decreased in the LF and HG systems, in comparison with applying an average annual figure for digestibility and CP. Accounting for nutritional variation of the rations throughout the year had widened footprint ranges and altered comparative dairy system performance ranking. Select merit cows in the BP regime incurred greater average emissions per kg FPCM, at 1.21 kg CO2e, when compared to the LFS, HGS and HFS systems which averaged 0.92, 1.15, and 1.17 kg CO2e/kg FPCM, respectively (Figure 2). Average Control merit footprints followed the same rank and were higher than the Select merit in the same system at 1.09, 1.26, 1.35, and 1.42 kg CO2e/kg FPCM for LFC, HGC, HFC and BPC systems, respectively (Figure 2). Higher average diet digestibility combined with a lower average CP content in the LF system (Table 6) led to lower mean emissions, in comparison with BP, HF and HG diets in both genetic merits (Table 7) and the standard method applying an average annual figure for digestibility and CP. When compared to the LF, BP and HF regimes Select merit cows managed in the HG system attracted a wider range of potential carbon footprints (Figure 2).
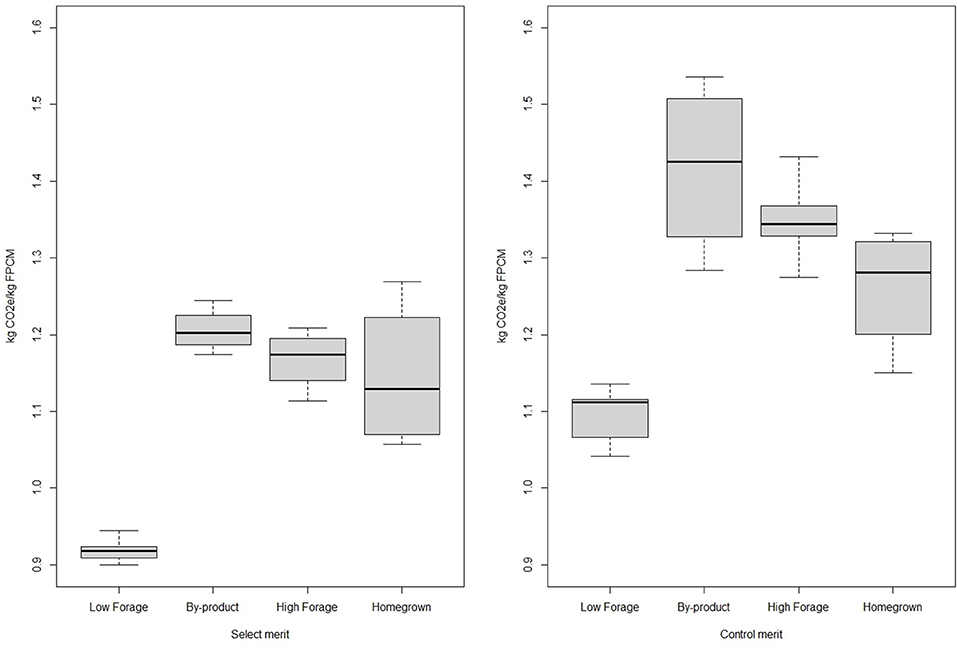
Figure 2. Box plots for Select and Control merits showing economic allocation dairy system emissions with effect of NCGD and CP variation in the ration.
Sources of GHG's within the carbon footprints varied by dairy management regime, therefore farm mitigation strategies may prove more effective if applied by system type. Land and crop GHG emissions stem from crop residues, manure and fertiliser application and these ranged from zero in the BPS system to 0.11 kg CO2e in the HGS system (Table 8). Embedded emissions are generated by energy consumed in the manufacture of feeds, fertilisers and pesticides and also in the use of bedding. Embedded emissions were greatest in the BPS housed system, at 0.46 kg CO2e /kg FPCM, because all feed and bedding were imported. The HGS grazed system attracted higher embedded emissions than the HFS system, as a larger area of on farm crop land replaced purchased feeds (Table 8).

Table 8. Dairy system GHG emissions (kg CO2e/kg FPCM) by category using economic allocation of feeds and considering nutritional variation of both CP and NCGD.
Livestock emissions that arise from enteric fermentation and manure management were greater in the HF and BP systems, at 0.79 and 0.68 kg CO2e/kg FPCM, compared with 0.57 and 0.66 kg CO2e/kg FPCM in the LF and HG systems, respectively (Figure 3). Higher emissions arose from greater amounts of manure stored in the BP system and from depositions while at pasture in the HF system. Emissions related to energy use were greater in the HG system, as this stemmed from the fuel used for crop related activities. Sequestered carbon estimated to occur within the woodland in the LF, HF and HG systems, lowered Select merit footprints by 0.01, 0.03, and 0.05 kg CO2e/kg FPCM, respectively (Table 8). Control merit footprints were reduced by 0.02, 0.03, and 0.06 kg CO2e/kg FPCM, for the LF, HF and HG, systems, respectively (Table 8).
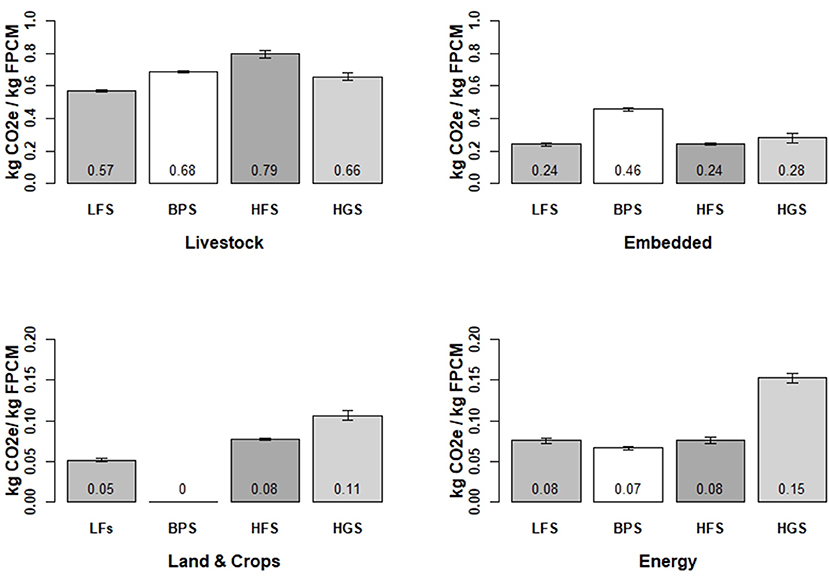
Figure 3. Dairy system GHG's by emission source type with standard error considering NGCD not including C sequestration.
Effect of Increased Legume Forages
Economic allocation of feed components generated similar average product emissions for HF and HG systems at 1.15 and 1.16 kg, respectively (Table 7). Mass allocation increased the HF milk footprint to 1.67 kg CO2e/kg due to the proportion of distillers' grains in the ration. Accounting for nutritional variation slightly reduced the HG average to 1.15 kg CO2e per kg FPCM and increased the HF to 1.17 kg CO2e/kg FPCM (Table 8). If C sequestration was not included, the footprints were, on average, equivalent at 1.19 kg CO2e/kg FPCM (Table 8). Trade-offs between livestock manure emissions and energy use to grow crops has led to similar milk total emissions being returned from the HG and HF systems (Table 7). Total on-farm land use per milking cow increased from an average of 0.86 ha to 1.23 ha when comparing the HF and HG systems. The HG system attracted greater embedded emissions than the HF system, these stemmed from the use of fungicide and herbicide applications to the wheat and spring beans.
Effect of Genetic Merit
Control merit total product footprints across each of the management regimes were significantly higher (p < 0.001) in comparison with high production Select merit cows, on average by 15% (Table 7). Livestock and embedded emissions were also significantly higher from control merit cows (p < 0.01). On average, comparing raw milk quality across each of the management regimes, Control merit cows yielded less milk volume and produced lower percentage fat and protein content (Table 3) than Select merit animals consuming the same diet (Table 2). When encompassing nutritional variation lowest to highest mean system ranking for Control merit was LF, HG, HF, BP and this rank order was preserved for Select mean footprints (Figure 2). Control merit carbon footprints were higher than the Select merit animals apart from in the LF system, where the Control merit resulted in slightly lower emissions than Select merits in the BP, HG and HF management. The housed LF regime incurred less GHG's / kg FPCM than the BP system irrespective of merit or allocation method mainly because of emissions embedded in the production of feeds. Raw milk at the farm gate produced by Control merit cows, within the BP system, were associated with greater product emissions at 1.42 kg CO2e/kg FPCM, than other systems and merits.
Effect of Land Use as a Functional Unit
On average, considering both on and off-farm land requirements for Select merit cows (Table 9), the BP system required the least amount of land in total, due to the high proportion of human inedible crop products and industry co-products. Land as a functional unit showed the HG system as least GHG intensive. When output of product is included with total land, it was the BP dairy system that emitted fewer GHG per hectare (Table 10).
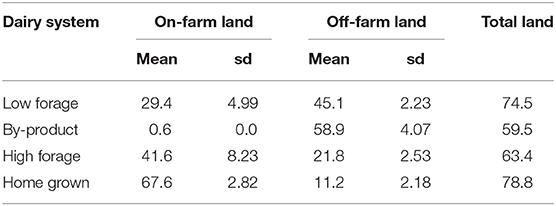
Table 9. Select merit dairy system land use (ha) on and off farm (mean and standard deviation).
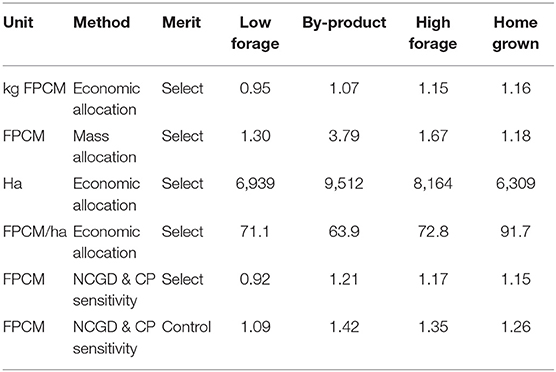
Table 10. Dairy system mean GHG emissions (kg CO2e) per functional unit.
Discussion
Using an LCA approach, this study demonstrates the importance of allocation method used to attribute GHG emissions of animal feeds and, in addition, the effect of nutritional variation on the carbon footprint of novel and conventional UK dairy systems. The ranked performance of dairy management types depends on the approach used to calculate impact and whether or not uncertainty is included (Table 11). Economic allocation resulted in mean dairy system emissions that ranged from 0.95 to 1.16 kg CO2e/kg FPCM and 1.13 to 1.28 kg CO2e/kg FPCM for S and C merit, respectively (Table 7). Mean system emissions were lower than the UK average of 1.25 kg CO2e (AHDB, 2014), except for C merit cows in HG and HF regimes (Table 7). Results expressing emissions totals per kg FPCM and per hectare produced in this study are in line with similar research such as Salou et al. (2017) and O'Brien et al. (2014). Carbon footprint results presented for the housed and composite systems are also in line with confinement and mixed systems reported in a review of 30 LCA studies from 15 different countries (Lorenz et al., 2019).
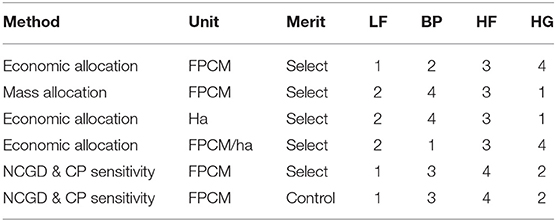
Table 11. Ranked dairy system mean total GHG emissions (kg CO2e).
Effect of Allocation Method and Uncertainty Analysis
Carbon footprints were, on average, higher using mass allocation EF's, and accounting for uncertainty, stemming from changes in diet CP and digestibility, altered the dairy system ranking. Mass allocation of feed component emissions raised product emissions on average by 41%, for the LF and HF rations, which comprised of a mixture of grown crops and purchased concentrates. The BP ration was formulated from mainly non-human edible food and drink industry co-products and the TMR produced only marginally less GHG's than the LF diet. With economic allocation, ration EF's per tonne in the LF diet was 256 kg CO2e and 249 kg CO2e in the BP diet. Milk quality in the BP diet was, on average, lower in fat and protein content in comparison with the LF system. In the grazed HF system, mass allocation of feed components increased product footprints because distillers' grains and rapeseed meal elevated emissions. The effect of the elevation in TMR emissions using mass allocation in the HF system is not as pronounced as in the BP system due to the time spent grazing by HF cows. The HG grazed system footprints were least effected by allocation method as purchased feed was limited to minerals and diet component EF's were all equivalent apart from wheat grain. Ration EF's increased using mass allocation because feed components such as industry co-products tend to be associated with higher emissions when additional processing into animal feed is required.
Nutritional quality of animal feed varies, and in this study feed analyses showed a higher mean CP and lower mean digestibility in the BP ration when compared to the LF system. The BP system had the lowest ranges in digestibility and CP content, possibly because there was no effect of local climate on farm grown crops in this ration. Reducing the CP intake of the dairy cow diet would help in reducing GHG emissions (particularly N2O) and UK research has shown that loss of production can be lower than expected (Reynolds et al., 2016). Other environmental and financial strategies to improve nitrogen use efficiency, such as home-grown legumes, should have positive consequences for GHG emissions through increased protein supply and the reduced need for N application from imported inorganic fertilisers.
Effect of Increased Legume Forages
The HF system ration included feeds requiring crop rotations of grass silage, maize and wheat, which required N fertilisers and were ensiled on farm. Crop products were combined with purchased concentrates and on average the HF diet consisted of ~75% forage on a DM basis and 1.3 tonnes of concentrate per cow (March et al., 2017). In comparison with the HF diet, the HG ration required less maize crop, as the purchased distillers' grains and rapeseed meal were replaced with farm grown proteins, such as, spring beans and lucerne. The HG herds were grazed for an average of 26% of the year, whereas the HF cows were grazed for an average of 30% annually and attracted greater emissions from dung and urine deposition at pasture. For Select merit cows, however, feed intakes on a DM basis were similar in both the HF and HG systems (Table 2). Average milk yield reduced slightly, by 98 kg per cow from 7,575 kg in the HFS system to 7,477 kg in the HGS system, although, milk quality was similar in both the systems (Table 2).
The HG system is a comparatively high emitter using economic allocation however, Table 11 shows this regime outranked all the other systems using mass allocation because no additional emissions are generated by imported products. In this case mass allocation methods and sensitivity analysis of nutritional variability highlight the benefits of a self-sufficient agricultural system, which may contain positive consequences when incorporating mitigation measures or when moving to more circular economic methods of farming. The HG system also had the lowest area-based emissions, a consequence of the replacement of synthetic N fertilisers by N inputs through biological fixation in comparison with the HF system. Legumes altered the composition of the footprints however the long-term effects of soil conditioning or crop disease prevention were not quantified by carbon footprinting and carbon sequestration modelling needs to be improved (Sykes et al., 2017) to reflect these and other desirable consequences. Mitigation of emissions related to inputs could be achieved in the HG system by reducing pesticide use and using renewable energies on farm.
Effect of Genetic Merit
On average across all diets, product emissions from Control merit cows using an economic allocation were 15% higher, indicating that improving genetic merit offers an immediate emissions reduction strategy, mainly through increased milk yields. In addition, GHG emissions can be reduced by selecting for feed efficiency (Bell et al., 2011). This could be accelerated using techniques such as genomics in the herd to enhance overall feed efficiency and in vitro fertilisation (Gifford and Gifford, 2013; Pryce and Bell, 2017; Hailu, 2018). Financial analysis of the LF and HF regimes found a Control merit cow in a housed regime to be least profitable because milk yields were not sufficiently high to justify the feed costs (March et al., 2017). Considering the diets, the total emissions differed significantly (p < 0.05), apart from the HF and HG rations, however, livestock, energy and embedded emission types did differ significantly between these systems. This highlights that dairy systems mitigation potentials, and measures implemented, should be quantified and designed by considering the production method and the emission source.
Effect of Land Use as a Functional Unit
Novel rations such as those used in the BP system required less land, however, incorporating high percentages of co-product based animal feeds can lead to greater GHG emissions as a consequence of upstream processing, such as drying or milling, which can be energy intensive (Vellinga et al., 2013). Ruminant diets for high yielding cows can be formulated to achieve lower emissions, and to make more efficient use of human inedible co-products (Wilkinson and Garnsworthy, 2017), however, not all co-product feeds are low carbon, and feeding TMR's all year round usually requires cows to be housed in adequate modern animal housing facilities with slurry storage systems. In Scotland, industry co-products have traditionally been used as animal feeds, however, feeds such as distillers' grains contain added water, which stems from the mashing stage of the whisky making process. This can hugely inflate mass balance emissions, and for some products drying grains requires a substantial input of energy, as the water content has to be reduced from ~75% to under 10% (Bell et al., 2012). Product quality in the BP system was also reduced (Tables 2, 3), this was reflected through lower milk fat and protein which have financial consequences for farm income.
Comparisons of low input grass based, mixed, and fully housed intensive dairy systems are valuable to explore uncertainty and mitigation pathways, rather than to justify efficacy of a particular method of farming. Between and within countries agricultural practises vary and livestock farming is to some extent governed by history, culture, and tradition (Boogaard et al., 2011). Overall focus should be turned to mitigation of emissions, adaptation to changing climates, improving comparability of LCA's, and communicating uncertainty. GHG emissions from dairy farming can be mitigated through multiple pathways such as increasing the longevity of cows within a herd, improving fertility, lowering initial calving age and by reducing enteric methane and improving digestibility of cow rations (Garnsworthy, 2004; Wilkinson and Garnsworthy, 2017). Reduced enteric CH4 and increased digestibility could be achieved through the reformulation of the diet or through feeding additives and supplements (Knapp et al., 2011, 2014). In less intensive dairy systems, enteric CH4 emissions can be reduced by increasing yields (Yan et al., 2010). Renewable energies and technologies such as anaerobic digestion can be effective in reducing emissions from manure storage, with one study reporting reductions of up to 36% (Weiske et al., 2006; Battini et al., 2014).
Conclusions
Mass and economic allocation methods, and land use functional units, are shown to generate alternatively ranked footprint results. Monte Carlo simulated system footprints considering the effect of variation in feed digestibility and crude protein differed significantly from system footprints using standard methods. Implications are that dairy farm footprint calculations should incorporate the variation in diet digestibility and crude protein content where possible. Using an economic allocation, a localised home-grown feeding regime had the highest C footprint, however, this more self-sufficient system was associated with the lowest footprint using mass allocation and attracted the lowest area-based emissions, when not considering milk output. This result suggests the need for dairy system footprint results to be expressed in multiple units and to be mindful that methods used to allocate inputs can affect carbon footprint results. It is expected that in developing economy-wide reductions in greenhouse gas emissions, mass and area-based assessments of mitigation are most likely to guide the delivery of policy objectives.
Data Availability Statement
The datasets presented in this article are not readily available because raw data is not publicly available. Requests to access the datasets should be directed to Margaret D. March, bWFnZ2llLm1hcmNoQHNydWMuYWMudWs=.
Ethics Statement
The animal study was reviewed and approved by SRUC Animal Experiments Committee (AEC).
Author Contributions
MM, RR, and AS contributed to the concept and methodology. MM and AS carried out the analysis. All authors contributed to the article and approved the submitted version.
Funding
This research was funded by the TRUE project, under the EU Horizon2020 Research and Innovation Programme (Grant Agreement number 727973) and the Scottish Government's Strategic Research Development Programme.
Conflict of Interest
The authors declare that the research was conducted in the absence of any commercial or financial relationships that could be construed as a potential conflict of interest.
Acknowledgments
Thanks to staff and technicians at SRUC's Crichton Royal Farm, to Ian Archibald (SRUC, Database Manager) and to Prof. Richard Dewhurst for his comments. The authors would like to thank two anonymous reviewers for their constructive comments.
Supplementary Material
The Supplementary Material for this article can be found online at: https://www.frontiersin.org/articles/10.3389/fsufs.2021.588158/full#supplementary-material
References
AHDB (2014). Greenhouse Gas Emissions on British Dairy Farms: DairyCo Carbon Foot Printing Study: Year 3. Stoneleigh Park, Kenilworth, Warwickshire: Agriculture and Horticulture Development Board. Available online at: https://dairy.ahdb.org.uk/media/988076/411045_carbon_footprint_report_year_3_final.pdf (accessed November 30, 2019).
AOAC (2000). Official Methods of Analysis, 17th Edn. Gaithersburg, MD: The Association of Official Analytical Chemists.
Audsley, E., Alber, S., Clift, R., Cowell, S., Crettaz, P., Gaillard, G., et al. (1997). Harmonisation of Environmental Life Cycle Assessment for Agriculture. Final Report, Concerted Action AIR3-CT94-2028, European Commission, DG VI Agriculture, Brussels. Available online at: https://www.researchgate.net/publication/258966401_EU_Concerted_Action_report_HARMONISATION_OF_ENVIRONMENTAL_LIFE_CYCLE_ASSESSMENT_FOR_AGRICULTURE_Final_Report_Concerted_Action_AIR3-CT94-2028 (accessed July 15, 2020).
Audsley, E., Stacey, K., Parsons, D. J., and Williams, A. G. (2009). Estimation of the Greenhouse Gas Emissions From Agricultural Pesticide Manufacture and Use. Cranfield, Bedford: Cranfield University. Available online at: https://dspace.lib.cranfield.ac.uk/bitstream/handle/1826/3913/Estimation_of_the_greenhouse_gas_emissions_from_agricultural_pesticide_manufacture_and_use2009.pdf;jsessionid=CFBFA3B3D5626A0579878C68E5D5FEFC?sequence=1 (accessed July 15, 2020).
Baldini, C., Gardoni, D., and Guarino, M. (2017). A critical review of the recent evolution of Life Cycle Assessment applied to milk production. J. Clean. Prod. 140, 421–435. doi: 10.1016/j.jclepro.2016.06.078
Basset-mens, C., Ledgard, S. F., and Carran, A. (2005). First life cycle assessment of milk production from New Zealand dairy farm systems. Conf. Palmerst. North New Zeal. 2003, 258–265. Available online at: www.anzsee.org/anzsee2005papers/Basset-Mens_LCA_NZ_milk_production
Bastiman, B., and Altman, J. F. B. (1985). Losses at various stages in silage making. Res. Dev. Agric. 2, 19–25.
Bates, D., Mächler, M., Bolker, B. M., and Walker, S. C. (2015). Fitting linear mixed-effects models using lme4. J. Stat. Softw. 67, 1–48. doi: 10.18637/jss.v067.i01
Battini, F., Agostini, A., Boulamanti, A. K., Giuntoli, J., and Amaducci, S. (2014). Mitigating the environmental impacts of milk production via anaerobic digestion of manure: case study of a dairy farm in the Po Valley. Sci. Total Environ. 481, 196–208. doi: 10.1016/j.scitotenv.2014.02.038
Bell, J., Morgan, C., Dick, G., and Reid, G. (2012). Distillery Feed Byproducts Briefing. Edinburgh: SAC Consulting. Available online at: https://www.sruc.ac.uk/info/20005/sac_consulting/812/distillery_feed_by-products_briefing (accessed February 16, 2021).
Bell, M. J., Wall, E., Russell, G., Simm, G., and Stott, A. W. (2011). The effect of improving cow productivity, fertility, and longevity on the global warming potential of dairy systems. J. Dairy Sci. 94, 3662–3678. doi: 10.3168/jds.2010-4023
Boden, T. A., Marland, G., and Andres, R. J. (2017). Global, Regional, and National Fossil-Fuel CO2 Emissions. Oak Ridge, TN: Carbon Dioxide Information Analysis Center, Oak Ridge National Laboratory, U.S. Department of Energy.
Boogaard, B. K., Oosting, S. J., Bock, B. B., and Wiskerke, J. S. C. (2011). The sociocultural sustainability of livestock farming: An inquiry into social perceptions of dairy farming. Animal 5, 1458–1466. doi: 10.1017/S1751731111000371
BSI (2011). PAS 2050:2011 Specification for the Assessment of the Life Cycle Greenhouse Gas Emissions of Goods and Services. London: British Standards Institute.
Cederberg, C., and Mattsson, B. (2000). Life cycle assessment of milk production - a comparison of conventional and organic farming. J. Clean. Prod. 8, 49–60. doi: 10.1016/S0959-6526(99)00311-X
Charlton, S., Ramsøe, A., Collins, M., Craig, O. E., Fischer, R., Alexander, M., et al. (2019). New insights into Neolithic milk consumption through proteomic analysis of dental calculus. Archaeol. Anthropol. Sci. 11, 6183–6196. doi: 10.1007/s12520-019-00911-7
Committe on Climate Change (2019). Net Zero: The UK's Contribution to Stopping Global Warming. Committe on Climate Change. Available online at: https://www.theccc.org.uk/publication/net-zero-the-uks-contribution-to-stopping-global-warming/ (accessed November 30, 2019).
DBEIS (2015). UK Greenhouse Gas Emissions, Final Figures. Department for Business, Energy and Industrial Strategy. Available online at: https://assets.publishing.service.gov.uk/government/uploads/system/uploads/attachment_data/file/604350/2015_Final_Emissions_statistics.pdf (accessed November 30, 2019).
DBEIS (2019). UK Greenhouse Gas Emissions. Department for Business, Energy and Industrial Strategy. Available online at: https://assets.publishing.service.gov.uk/government/uploads/system/uploads/attachment_data/file/829336/2019_Green-house-gas-reporting-methodology.pdf (accessed November 30, 2019).
de Klein, C., Novoa, R. S. A., Ogle, S., Smith, K. A., Rochette, P., Wirth, T. C., et al. (2006). “N2O emissions from managed soils, and CO2 emissions from lime and urea application,” in 2006 IPCC Guidelines for National Greenhouse Gas Inventories, v 4 chapter 11, eds S. Eggleston, L. Buendia, K. Miwa, T. Ngara, and K. Tanabe (Kanagawa: Institute for Global Environmental Strategies).
DEFRA/DECC (2015). GHG Conversion Factors for Company Reporting. London. Available online at: https://www.gov.uk/government/publications/greenhouse-gas-reporting-conversion-factors-2015 (accessed November 30, 2019).
del Prado, A., Chadwick, D., Cardenas, L., Misselbrook, T., Scholefield, D., and Merino, P. (2010). Exploring systems responses to mitigation of GHG in UK dairy farms. Agric. Ecosyst. Environ. 136, 318–332. doi: 10.1016/j.agee.2009.09.015
Dong, H., Mangino, J., and McAllister, T. A. (2006). “Volume 4, Chapter 10 - emissions from livestock and manure management,” in IPCC Guidelines for National Greenhouse Gas Inventories, eds S. Eggleston, L. Buendia, K. Miwa, T. Ngara, and K. Tanabe (Hayama: IPCC).
Edouard, N., Charpiot, A., Robin, P., Lorinquer, E., Doll,é, J. B., and Faverdin, P. (2019). Influence of diet and manure management on ammonia and greenhouse gas emissions from dairy barns. Animal 13, 2903–2912. doi: 10.1017/S1751731119001368
European Parliament (2018). European Strategy for the Promotion of Protein Crops – Encouraging the Production of Protein and Leguminous Plants in the European Agriculture Sector. Available online at: http://www.europarl.europa.eu/doceo/document/A-8-2018-0121_EN.pdf?redirect (accessed November 30, 2019).
FAO (2019). Climate Change and the Global Dairy Cattle Sector – The Role of the Dairy Sector in a Low-Carbon Future. Licence: CC BY-NC-SA- 3.0 IGO. Food and Agriculture Organization. Available online at: https://dairysustainabilityframework.org/wp-content/uploads/2019/01/Climate-Change-and-the-Global-Dairy-Cattle-Sector.pdf (accessed November 30, 2019).
Flysjö, A., Cederberg, C., Henriksson, M., and Ledgard, S. (2011). How does co-product handling affect the carbon footprint of milk? Case study of milk production in New Zealand and Sweden. Int. J. Life Cycle Assess. 16, 420–430. doi: 10.1007/s11367-011-0283-9
Garnsworthy, P. C. (2004). The environmental impact of fertility in dairy cows: a modelling approach to predict methane and ammonia emissions. Anim. Feed Sci. Technol. 112, 211–223. doi: 10.1016/j.anifeedsci.2003.10.011
Gifford, J. A. H., and Gifford, C. A. (2013). Role of reproductive biotechnologies in enhancing food security and sustainability. Anim. Front. 3, 14–19. doi: 10.2527/af.2013-0019
Hailu, G. (2018). The Role of Animal Genomics in Reducing Greenhouse Gas Emissions Paper Prepared for CAPI. Department of Food, Agricultural and Resource Economics, Ontario Agricultural College, University of Guelph. Available online at: https://capi-icpa.ca/wp-content/uploads/2018/09/CAPI_Genomic-Technology-GHG-Emissions-Reduction_Hailu.pdf (accessed July 15, 2020).
Iannetta, P. P. M., Rees, R. M., and Squire, G. R. (2019). The Practical Effectiveness of Nitrogen-Fixing Crops: Policy Briefing. Published by the James Hutton Institute on behalf of Climatexchange. Available online at: https://www.climatexchange.org.uk/media/4086/nitrogen-fixing-crops-in-scotland_cxc-summary-final.pdf (accessed July 15, 2020). doi: 10.13140/RG.2.2.18813.61927
IDF (2015). A Common Carbon Footprint Approach for the Dairy Sector, the IDF Guide to Life Cycle Assessment Methodology, Bulletin of the International Dairy Federation 479/2015. International Dairy Federation. Available online at: https://store.fil-idf.org/product/a-common-carbon-footprint-approach-for-the-dairy-sector-the-idf-guide-to-standard-life-cycle-assessment-methodology/ (accessed February 15, 2021).
IPCC (2006). IPCC Guidelines for National Greenhouse Gas Inventories Volume 4 Agriculture, Forestry and Other Land Use Chapter 4 Forest Land 2006. Hayama: Intergovernmental Panel on Climate Change.
Kenicer, G. (2005). Legumes of the World. Edited by G. Lewis, B. Schrire, B. MacKinder & M. Lock. Royal Botanic Gardens, Kew. 2005. xiv + 577pp., colour photographs & line drawings. Edinburgh J. Bot. 62, 195–196. doi: 10.1017/S0960428606190198
Kim, D., Stoddart, N., Rotz, C. A., Veltman, K., Chase, L., Cooper, J., et al. (2019). Analysis of beneficial management practices to mitigate environmental impacts in dairy production systems around the Great Lakes. Agric. Syst. 176, 1–12. doi: 10.1016/j.agsy.2019.102660
Knapp, J. R., Firkins, J. L., Aldrich, J. M., Cady, R., Hristov, A. N., Weiss, W. P., et al. (2011). Cow of the Future Research Priorities for Mitigating Enteric Methane Emissions from Dairy. Innov. Cent. U.S. Dairy, 1–43. Available online at: http://qa03.usdairy.com/Sustainability/Documents/CowoftheFutureResearchPrioritiesWhitePaper.pdf (accessed November 30, 2019).
Knapp, J. R., Laur, G. L., Vadas, P. A., Weiss, W. P., and Tricarico, J. M. (2014). Invited review: Enteric methane in dairy cattle production: quantifying the opportunities and impact of reducing emissions. J. Dairy Sci. 97, 3231–3261. doi: 10.3168/jds.2013-7234
Lorenz, H., Reinsch, T., Hess, S., and Taube, F. (2019). Is low-input dairy farming more climate friendly? A meta-analysis of the carbon footprints of different production systems. J. Clean. Prod. 211, 161–170. doi: 10.1016/j.jclepro.2018.11.113
Lüscher, A., Mueller-Harvey, I., Soussana, J. F., Rees, R. M., and Peyraud, J. L. (2014). Potential of legume-based grassland-livestock systems in Europe: a review. Grass Forage Sci. 69, 206–228. doi: 10.1111/gfs.12124
March, M. D., Shalloo, L., Roberts, D. J., and Ryan, W. (2017). Financial evaluation of Holstein Friesian strains within composite and housed UK dairy systems. Livest. Sci. 200, 14–22. doi: 10.1016/j.livsci.2017.03.018
McDonald, P., Edwards, R. A., Greenhalgh, J. F. D., Morgan, C. A., Sinclair, L. A., and Wilkinson, R. G. (2011). “Animal nutrition,” in Animal Nutrition, 7th Edn. ed P. McDonald (Harlow: Prentice Hall/Pearson), 377.
Milne, A. E., Glendining, M. J., Lark, R. M., Perryman, S. A. M., Gordon, T., and Whitmore, A. P. (2015). Communicating the uncertainty in estimated greenhouse gas emissions from agriculture. J. Environm. Manage 160, 139–153. doi: 10.1016/j.jenvman.2015.05.034
O'Brien, D., Brennan, P., Humphreys, J., Ruane, E., and Shalloo, L. (2014). An appraisal of carbon footprint of milk from commercial grass-based dairy farms in Ireland according to a certified life cycle assessment methodology. Int. J. Life Cycle Assess. 19, 1469–1481. doi: 10.1007/s11367-014-0755-9
O'Brien, D., Shalloo, L., Patton, J., Buckley, F., Grainger, C., and Wallace, M. (2012). Evaluation of the effect of accounting method, IPCC v. LCA, on grass-based and confinement dairy systems' greenhouse gas emissions. Animal 6, 1512–1527. doi: 10.1017/S1751731112000316
Opio, C., Gerber, P., Mottet, A., Falcucci, A., Tempio, G., MacLeod, M., et al. (2013). Greenhouse Gas Emissions From Ruminant Supply Chains – A Global Life Cycle Assessment. Rome: Food and Agriculture Organization of the United Nations (FAO). Available online at: http://www.fao.org/3/i3461e/i3461e.pdf (accessed July 15, 2020).
Pollott, G. E., and Coffey, M. P. (2008). The effect of genetic merit and production system on dairy cow fertility, measured using progesterone profiles and on-farm recording. J. Dairy Sci. 91, 3649–3660. doi: 10.3168/jds.2007-0913
Pryce, J. E., and Bell, M. J. (2017). The impact of genetic selection on greenhouse-gas emissions in Australian dairy cattle. Anim. Prod. Sci. 57, 1451–1456. doi: 10.1071/AN16510
Pryce, J. E., Coffey, M. P., and Simm, G. (2001). The relationship between body condition score and reproductive performance. J. Dairy Sci. 84, 1508–1515. doi: 10.3168/jds.S0022-0302(01)70184-1
R Core Team (2013). R: A Language and Environment for Statistical Computing. Vienna: R Foundation for Statistical Computing. Available online at: http://www.R-project.org/ (accessed July 15, 2020).
Reynolds, C. K., Crompton, L. A., Humphries, D. J., and Jones, A. K. (2016). “Long term implications of feeding low protein diets to first lactation dairy cows,” in Proceedings of the 5th EAAP International Symposium on Energy and Protein Metabolism and Nutrition (Wageningen Academic Publishers). Available online at: https://www.reading.ac.uk/web/files/apd/apd_resfpqnue_poster3.pdf
Roer, A. G., Johansen, A., Bakken, A. K., Daugstad, K., Fystro, G., and Strømman, A. H. (2013). Environmental impacts of combined milk and meat production in Norway according to a life cycle assessment with expanded system boundaries. Livest. Sci. 155, 384–396. doi: 10.1016/j.livsci.2013.05.004
Röös, E., and Nylinder, J. (2013). Uncertainties and Variations in the Carbon Footprint of Livestock Products. Report 063. Uppsala: Department of Energy and Technology, Swedish University of Agricultural Sciences. Available online at: https://pub.epsilon.slu.se/10766/7/roos_e_nylinder_j_130828.pdf (accessed July 15, 2020).
Ross, S. A., Chagunda, M. G. G., Topp, C. F. E., and Ennos, R. (2014). Effect of cattle genotype and feeding regime on greenhouse gas emissions intensity in high producing dairy cows. Livest. Sci. 170, 158–171. doi: 10.1016/j.livsci.2014.09.011
Ross, S. A., Topp, C. F. E., Ennos, R. A., and Chagunda, M. G. G. (2017). Relative emissions intensity of dairy production systems: employing different functional units in life-cycle assessment. Animal 11, 1381–1388. doi: 10.1017/S1751731117000052
Rotz, C. A. (2004). Management to reduce nitrogen losses in animal production. J. Anim. Sci. 82(E-Suppl.), 119–137.
SAC Consulting (2016). The Farm Management Handbook, 37th Edn., ed K. Craig, Edinburgh: Technopole Centre. Available online at: https://www.fas.scot/publication/farm-management-handbook-20162017/
Salou, T., Le Mouël, C., and van der Werf, H. M. G. (2017). Environmental impacts of dairy system intensification: the functional unit matters! J. Clean. Prod. 140, 445–454. doi: 10.1016/j.jclepro.2016.05.019
Senbayram, M., Wenthe, C., Lingner, A., Isselstein, J., Steinmann, H., Kaya, C., et al. (2015). Legume-based mixed intercropping systems may lower agricultural born N2O emissions. Energy. Sustain. Soc. 6, 1–9. doi: 10.1186/s13705-015-0067-3
SG (2018). Climate Change (Emissions Reduction Targets) (Scotland) Bill. Scottish Government. Available online at: https://www.parliament.scot/S5_Bills/Climate%20Change%20(Emissions%20Reduction%20Targets)%20(Scotland)%20Bill/SPBill30S052018.pdf (accessed November 30, 2019).
Sheane, R., Lewis, K., Hall, P., Holmes-Ling, P., Kerr, A., Stewart, K., et al. (2010). Scottish Dairy Supply Chain Greenhouse, Methodology Report. Available online at: https://digital.nls.uk/pubs/scotgov/2011/methodologyreport.pdf (accessed July 15, 2020).
Smith, P., Bustamante, M., Ahammad, H., Clark, H., Dong, H., Elsiddig, E., et al. (2014). “Forestry and other land use (AFOLU),” in Climate Change 2014: Mitigation of Climate Change. Contribution of Working Group III to the Fifth Assessment Report of the Intergovernmental Panel on Climate Change, eds O. Edenhofer, R. Pichs-Madruga, Y. Sokona, E. Farahani, S. Kadner, K. Seyboth (Cambridge; New York, NY: Cambridge University Press).
SRUC (2014). AgRE Calc. Scotlands Rural College. Available online at: http://www.sruc.ac.uk/info/120355/carbon_and_climate/1333/agricultural_resource_efficiency_calculator_agre_calc(accessed July 15, 2020).
Stagnari, F., Maggio, A., Galieni, A., and Pisante, M. (2017). Multiple benefits of legumes for agriculture sustainability: an overview. Chem. Biol. Technol. Agric. 4, 1–13. doi: 10.1186/s40538-016-0085-1
Sykes, A. J., Topp, C. F. E., and Rees, R. M. (2019). Understanding uncertainty in the carbon footprint of beef production. J. Clean. Prod. 234, 423–435. doi: 10.1016/j.jclepro.2019.06.171
Sykes, A. J., Topp, C. F. E., Wilson, R. M., Reid, G., and Rees, R. M. (2017). A comparison of farm-level greenhouse gas calculators in their application on beef production systems. J. Clean. Prod. 164, 398–409. doi: 10.1016/j.jclepro.2017.06.197
Taherzadeh, O., and Caro, D. (2019). Drivers of water and land use embodied in international soybean trade. J. Clean. Prod. 223, 83–93. doi: 10.1016/j.jclepro.2019.03.068
Toma, L., March, M., Stott, A. W., and Roberts, D. J. (2013). Environmental efficiency of alternative dairy systems: A productive efficiency approach. J. Dairy Sci. 96, 7014–7031. doi: 10.3168/jds.2013-6911
Vellinga, T. V., Blonk, H., Marinussen, M., van Zeist, W. J., de Boer, I. J. M., and Starmans, D. (2013). Methodology used in feedprint: a tool quantifying greenhouse gas emissions of feed production and utilization. Livest. Res. Rep. 674:121.
Volpelli, L. A., Comellini, M., Gozzi, M., Masoero, F., and Moschini, M. (2012). Pea (Pisum Sativum) and faba beans (Vicia faba) in dairy cow diet: Effect on milk production and quality. Ital. J. Anim. Sci. 11, 217–222. doi: 10.4081/ijas.2012.e40
Weiske, A., Vabitsch, A., Olesen, J. E., Schelde, K., Michel, J., Friedrich, R., et al. (2006). Mitigation of greenhouse gas emissions in European conventional and organic dairy farming. Agric. Ecosyst. Environ. 112, 221–232. doi: 10.1016/j.agee.2005.08.023
Wilkinson, J. M., and Garnsworthy, P. C. (2017). Dietary options to reduce the environmental impact of milk production. J. Agric. Sci. 155, 334–347. doi: 10.1017/S0021859616000757
Xiccato, G., Cinetto, M., Carazzolo, A., and Cossu, M. E. (1994). The effect of silo type and dry matter content on the maize silage fermentation process and ensiling loss. Anim. Feed Sci. Technol. 49, 311–323. doi: 10.1016/0377-8401(94)90055-8
Yan, T., Mayne, C. S., Gordon, F. G., Porter, M. G., Agnew, R. E., Patterson, D. C., et al. (2010). Mitigation of enteric methane emissions through improving efficiency of energy utilization and productivity in lactating dairy cows. J. Dairy Sci. 93, 2630–2638. doi: 10.3168/jds.2009-2929
Keywords: carbon footprint, allocation, nutrition, dairy cattle, functional unit, LCA
Citation: March MD, Hargreaves PR, Sykes AJ and Rees RM (2021) Effect of Nutritional Variation and LCA Methodology on the Carbon Footprint of Milk Production From Holstein Friesian Dairy Cows. Front. Sustain. Food Syst. 5:588158. doi: 10.3389/fsufs.2021.588158
Received: 28 July 2020; Accepted: 24 March 2021;
Published: 30 April 2021.
Edited by:
Nikolaos Katsoulas, University of Thessaly, GreeceReviewed by:
Vasileios Anestis, Agricultural University of Athens, GreeceAnna Vatsanidou, Benaki Phytopathological Institute, Greece
Copyright © 2021 March, Hargreaves, Sykes and Rees. This is an open-access article distributed under the terms of the Creative Commons Attribution License (CC BY). The use, distribution or reproduction in other forums is permitted, provided the original author(s) and the copyright owner(s) are credited and that the original publication in this journal is cited, in accordance with accepted academic practice. No use, distribution or reproduction is permitted which does not comply with these terms.
*Correspondence: Margaret D. March, bWFnZ2llLm1hcmNoQHNydWMuYWMudWs=