 Stewart A. Jennings1*
 Ann-Kristin Koehler1
 Kathryn J. Nicklin1
 Chetan Deva1
 Steven M. Sait2
 Andrew J. Challinor1
- 1Institute for Climate and Atmospheric Science, School of Earth and Environment, University of Leeds, Leeds, United Kingdom
- 2Faculty of Biological Sciences, School of Biology, University of Leeds, Leeds, United Kingdom
The contribution of potatoes to the global food supply is increasing—consumption more than doubled in developing countries between 1960 and 2005. Understanding climate change impacts on global potato yields is therefore important for future food security. Analyses of climate change impacts on potato compared to other major crops are rare, especially at the global scale. Of two global gridded potato modeling studies published at the time of this analysis, one simulated the impacts of temperature increases on potential potato yields; the other did not simulate the impacts of farmer adaptation to climate change, which may offset negative climate change impacts on yield. These studies may therefore overestimate negative climate change impacts on yields as they do not simultaneously include CO2 fertilisation and adaptation to climate change. Here we simulate the abiotic impacts of climate change on potato to 2050 using the GLAM crop model and the ISI-MIP ensemble of global climate models. Simulations include adaptations to climate change through varying planting windows and varieties and CO2 fertilisation, unlike previous global potato modeling studies. Results show significant skill in reproducing observed national scale yields in Europe. Elsewhere, correlations are generally positive but low, primarily due to poor relationships between national scale observed yields and climate. Future climate simulations including adaptation to climate change through changing planting windows and crop varieties show that yields are expected to increase in most cases as a result of longer growing seasons and CO2 fertilisation. Average global yield increases range from 9 to 20% when including adaptation. The global average yield benefits of adaptation to climate change range from 10 to 17% across climate models. Potato agriculture is associated with lower green house gas emissions relative to other major crops and therefore can be seen as a climate smart option given projected yield increases with adaptation.
1. Introduction
Potato is the most important non-grain crop and 4th most important crop in terms of global production (FAO, 2019). Global potato production has increased by about 20% since 1990, although production is still 50% below that of wheat, maize, and rice (FAO, 2019). Global production is skewed toward the northern hemisphere and especially Europe, which has around 50% of global growing area and relatively high yields (Birch et al., 2012; FAO, 2019). Asia is now catching Europe up as a major global producer, with India, Bangladesh, and China increasing potato yields and area grown (FAO, 2019). Africa has also seen an increase in potato growing areas since 1990 (FAO, 2019). These regions rely on potatoes for a growing proportion of calories, meaning that potatoes have increasing potential to combat food insecurity, especially given their relatively high nutrient content (Lutaladio and Castaldi, 2009; Devaux et al., 2014).
Given the increased importance of potatoes globally there is an ever-growing need to understand the impacts of climate change on potato agriculture. Temperature can limit potatoes to being grown at higher elevations in hotter countries, with it being a common lowland crop only in temperate areas—tuber growth is inhibited above 33°C (Ingram and McCloud, 1984; Wolf et al., 1990; Timlin et al., 2006). For respectable yields, over 500 mm of water is required over a typical growing season of 120–150 days (FAO, 2019). Therefore, without farmer management adaptations to climate change such as shifting planting dates or varieties potato yields may fall in areas already marginal for potato growth due to water limitations or rising temperatures (Raymundo et al., 2018).
Most Potatoes have indeterminate growth—i.e., crop maturity is not driven solely by environmental and genetic factors. Management decisions are also key to when potatoes are harvested. Temperature is the most important climatic variable determining duration, but the relationship of climate variables to duration of developmental stages weakens after tuber initiation (Kooman et al., 1996). Typically, potatoes are harvested when senescence has taken place for some time, allowing canopy die back, and depending on management decisions the crop haulm is cut back using mechanical or chemical methods and left for several days. Skin hardening of tubers takes place during this time (Wilcockson et al., 1985). Management factors include the desired starch or dry matter content of tubers (Noda et al., 2004), time taken for skin hardening (Wilcockson et al., 1985), local pest and disease pressures, level of soil moisture (excessively dry or wet soils making harvest impractical) and market prices for different varieties (Burton, 1989; Harris, 1992).
Crop management must not only adapt to climate change to maintain sufficient production but do so in a way that reduces green house gas emissions as much as possible—i.e., cropping systems must be climate smart (FAO, 2010). Transformative changes for climate smart agriculture can include changes to crops that cope with climate change impacts and emit relatively low emissions (Lipper et al., 2014). Potatoes have relatively low agricultural emissions compared to other crops (Flynn et al., 2005; Haile-Mariam et al., 2008; Nemecek et al., 2012; Clune et al., 2017). For example, CO2 emissions have been shown to be lower for potato than sweet corn (Haile-Mariam et al., 2008), nitrous oxide emissions are lower for potato than cereal crops (Flynn et al., 2005) and in general, root crops have lower global warming potential than cereals, other vegetables and fruit crops (Nemecek et al., 2012; Clune et al., 2017). Clune et al. (2017) conducted a meta-analysis of life cycle assessment and associated global warming potential for 168 food crops and livestock products, with potato having the third lowest average global warming potential.
Despite the importance of understanding the potential of potatoes to contribute to a climate smart future, there has been a lack of previous potato modeling studies compared to other crops, especially at the global scale. Hijmans (2003) is one of very few examples, but this study only examined the impacts of temperature changes on potential yields, not including changes to CO2 and precipitation. Being a C3 crop, potato yields are likely to increase with elevated CO2 due to CO2 fertilisation (Finnan et al., 2005; Fleisher et al., 2008). Including these impacts is especially important as some studies suggest rising CO2 to be more important than other mean climatic changes (Haverkort et al., 2013) and that CO2 fertilisation for potatoes could be higher than for other C3 crops (Magliulo et al., 2003). Raymundo et al. (2018) include a CO2 parameterisation in global potato simulations but do not consider adaptations of variety and planting date changes in the future. Raymundo et al. (2018) project global yield decreases by the mid twenty-first century of 2–6% and Hijmans (2003) decreases of 9–18% when considering adaptation to climate change but not CO2 fertilisation.
Climate change impact studies may lose accuracy if they do not include at least some autonomous adaptation measures (Challinor et al., 2018). Of the 91 published analyses on climate change impacts on crop yields included in The Intergovernmental Panel on Climate Change 5th Assessment report, 33 included adaptation measures (Porter et al., 2014). These measures were limited to changes in planting date, irrigation, crop variety, and fertiliser (Challinor et al., 2014b). In reality many adaptation measures exist that are not included in crop modeling studies due to current model limitations or a lack of knowledge of specific place-based processes (Beveridge et al., 2018), especially at the global scale.
Crop-climate impacts studies increasingly examine yield changes when allowing planting dates and varieties to vary in the future climate, rather than using so-called “dumb farmer” planting dates and varieties that do not vary in the future climate (Deryng et al., 2014; Rosenzweig et al., 2014). Previous global gridded modeling studies have featured simulations that allow planting dates and crop phenologies to vary as well as simulations that keep these fixed to those used in the historical climate (Deryng et al., 2014; Müller et al., 2017).
Changing planting dates and varieties in the future may not be straightforward due to factors not typically taken into account in modeling studies, including market pressures, pests and diseases, other crops, and irrigation water availability (Hijmans, 2003). Many adaptation scenarios can be envisaged, ranging from the so-called “dumb farmer” who does not react at all to climate change, to the “clairvoyant farmer,” who reacts with no restrictions to resources for adaptation—for example complete access to alternative crop varieties (Schneider et al., 2000; Füssel, 2007). The most realistic adaptation scenario will be context specific, depending on regional constraints such as variety availability or the growing seasons of alternative crops. For this reason, global studies necessarily make assumptions that will not apply to all regions—an example of global studies losing regional skill (Challinor et al., 2014a). Some studies preferentially avoid a dumb farmer scenario, assuming that farmers will adapt in some ways to climate change and if not including adaptation the impacts of climate change will be inaccurate (e.g., Mendelsohn et al., 2000; Hijmans, 2003).
Here we simulate climate change impacts on potato yields globally, taking into account CO2 fertilisation alongside adaptation to climate change, unlike previous global potato climate change modeling studies (Hijmans, 2003; Raymundo et al., 2018). In accordance with the overarching objectives of this speciality section of Frontiers in Sustainable Food Systems (Whitfield et al., 2018), we assess future climate impacts on potato yields and comment on the climate-smartness of these projections.
2. Materials and Methods
We firstly evaluate the ability of the potato model to simulate potato yields globally in the historical period of 1980–2009. After this assessment of model skill, simulations are used to assess the impacts of climate change on yields, simulating yields both in the baseline period (1990–2010) and in the future (2040–2060) with adaptations to climate change. “Adaptation” in model simulations refers to changes to planting windows and varieties. Technology trends on yields are not accounted for.
Non-adaptation simulations are included as a point of reference to adaptation simulations, which are seen as more realistic as they avoid the “dumb farmer” bias (Schneider et al., 2000; Füssel, 2007). We are assuming that farmers have complete access to the varieties simulated which is seen as more realistic than assuming constant planting dates and varieties between now and 2050 (Mendelsohn et al., 2000). Given the relatively low emissions associated with potato agriculture, if yields are projected to be maintained/increase then these potato adaptations are deemed climate smart, given that changes to planting windows and varietal durations will not by themselves lead to increased emissions.
2.1. The GLAM-Potato Crop Model
The General Large Area Model for annual crops (GLAM; Challinor et al., 2004) is a process-based crop model, designed to operate at the spatial scale of global and regional climate models (Challinor et al., 2003).
The modeling philosophy of GLAM can be summarised as “appropriate model complexity.” Less complex models may omit important processes, potentially leading to poor model skill. More complex models do not necessarily result in improved model performance, however. If the quality of the input data required by complex models is poor, results could also be poor (Jamieson et al., 1998; Jagtap and Jones, 2002). Some studies have suggested that on larger spatial scales some processes become less important (Hansen and Jones, 2000; Challinor et al., 2004), allowing a less complex model to perform equally well. The relatively low number of parameters in GLAM reduces model sensitivity to poor quality input data (Challinor et al., 2004) and means that less extensive calibration is necessary, reducing the risk of “overtuning” the model to data at certain sites (Cox et al., 2006).
GLAM was originally developed for groundnut simulation as described by Challinor et al. (2004). Being modular, it is relatively easy to modify for other crops and has since been used to simulate spring wheat (Koehler et al., 2013), winter wheat (Li, 2008), maize (Bergamaschi et al., 2013), soybean (Osborne et al., 2013), and sorghum (Nicklin, 2013). See Supplementary Section 1.1 for a complete description of modifications made to the model for the simulation of potatoes. A brief description of the model is given here.
The crop is planted within a specified planting window when soil moisture and temperature are sufficient (see Supplementary Section 1.1.1), or at the end of the planting window if these conditions are not met (this is referred to as “emergency planting”). The length of the potato growing season is dependent on the accumulation of thermal time and photoperiod. Daily thermal time is calculated as the amount by which daily mean temperature exceeds a base temperature up to an optimum temperature, at which development is fastest. Temperatures above the optimum lead to a gradual decline in development rate up to a maximum temperature, above which development is halted. For potato, tuber initiation is also sensitive to photoperiod—this is parameterised using a photoperiod response function (Streck et al., 2007) which is multiplied by the thermal time calculated for each day during this developmental stage. The four growth stages for potato are: (i) planting to emergence, (ii) emergence to tuber initiation (sensitive to photoperiod), (iii) tuber initiation to senescence, and (iv) senescence to harvest.
GLAM-potato parameterised crop growth using transpiration efficiency (TE) and radiation use efficiency (RUE) approaches (Osborne et al., 2013). Parameterisation of CO2 fertilisation is achieved through increases in these parameters as described in section 2.3. Each day the biomass assimilated is the minimum of that associated with TE or RUE. Potential evapotranspiration rates are defined as in Priestley and Taylor (1972). At harvest maturity crop biomass is partitioned to yield using a harvest index approach. A yield gap parameter CYG accounts for factors not explicitly simulated in the model such as pests, diseases, and non-optimal management (including the level of fertiliser use). Heat stress around tuber initiation is parameterised according to the methods of Osborne et al. (2013).
2.2. Input Data
2.2.1. Climate Data
GLAM requires daily minimum and maximum temperature, precipitation, and solar radiation data. The EWEMBI data set (Lange, 2019) is used as the climate input data for evaluation of GLAM in the historical period. The EWEMBI data set was compiled for bias correction of climate input data for the Inter-Sectoral Impact Model Intercomparison Project (ISI-MIP; Frieler et al., 2017).
The EWEMBI data cover the globe at 0.5 degree spatial and daily temporal resolution. Data sources of EWEMBI are ERA-Interim reanalysis data (ERAI; Dee et al., 2011), WATCH forcing data methodology applied to ERA-Interim reanalysis data (WFDEI; Weedon et al., 2014), eartH2Observe forcing data (E2OBS; Calton, 2016), and NASA/GEWEX Surface Radiation Budget data (SRB; Stackhouse, 2011). The SRB data were used to bias-correct E2OBS shortwave and longwave radiation (Lange, 2018).
ISI-MIP 2b bias-corrected input data are used for the climate change analysis (Hempel et al., 2013; Frieler et al., 2017). EWEMBI data are used for the bias-correction, as described in Lange (2018).
Four GCMs are used (HadGEM2-ES, GFDL-ESM2M, IPSL-CM5A-LR, MIROC5). ISI-MIP data are selected for use as they represent a globally-coherent data set that is a reasonable subset of the CMIP5 ensemble, as demonstrated by McSweeney and Jones (2016).
The period 2040–2060 is chosen for the future climate simulations as by 2050 population growth is projected to stabilise and there is a need to understand how to feed this population without worsening climate change by emitting more green house gases (Foley, 2011). The RCP 8.5 scenario is used, representing current climate change trajectories (i.e., a pessimistic future), although there is relatively little difference in climate change across RCPs by 2050 (Moss et al., 2010). A baseline period of 1990–2010 is used to compare to the future time period as this is centered on the historical growing area information and contains the same number of years as the future period.
2.2.2. Potato Growing Area, Irrigation, and Soil Data
Global growing areas and irrigation are from the MIRCA data set (Monthly Irrigated and Rainfed Crop Areas—Portmann et al., 2010—Figure 1), representing growing areas in the year 2000 (the center of our historical period). Grid cells are selected for simulation if they contain potato growing area, as defined by MIRCA. Irrigation is determined by a majority grid cell approach. If a grid cell has >50% of its growing area irrigated, irrigated simulations are used for that grid cell. Otherwise simulations for the grid cell are rainfed. A supplementary irrigation routine is used for this study; if soil moisture on a given day falls below a threshold defined as 60% of available soil moisture, up to 1 cm of water is added to the uppermost soil layer until soil moisture is at field capacity (Lundstrom and Stegman, 1988; Critchley et al., 2013).
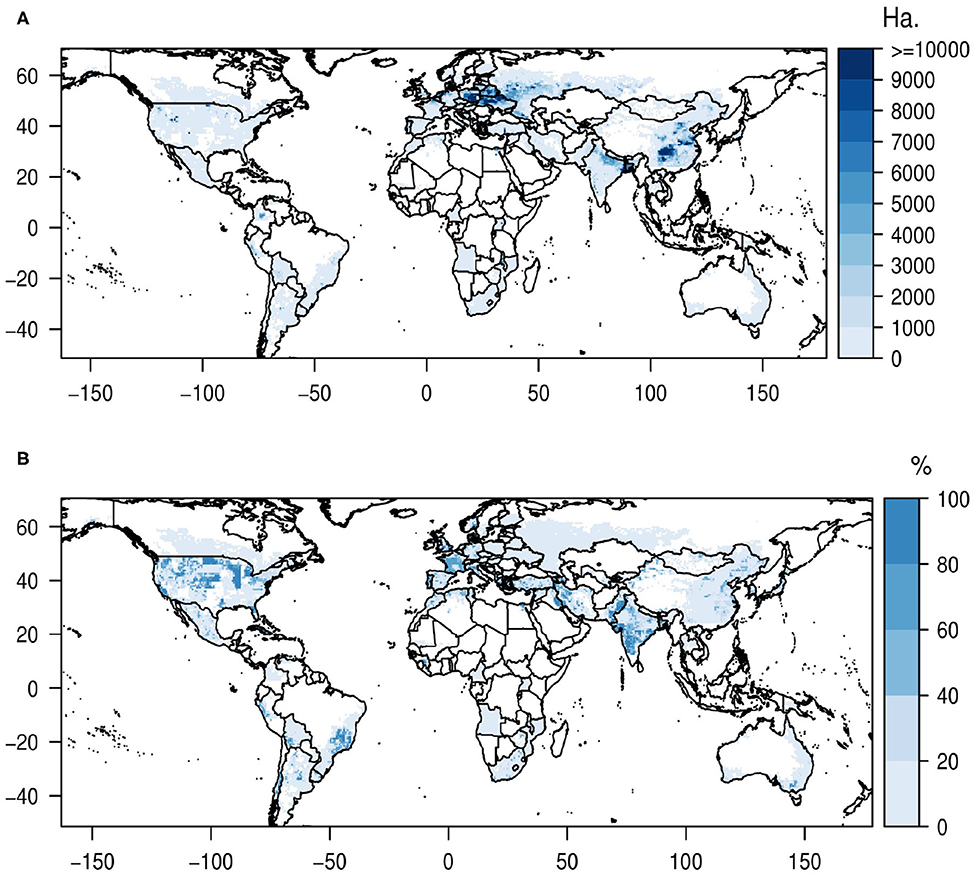
Figure 1. (A) Growing areas per grid cell in hectares. (B) Percentage of potato area that is irrigated per grid cell.
Shapefiles from the Database of Global Administrative Areas are used to define national boundaries (http://www.gadm.org/). Soil, area, and irrigation data required for global GLAM simulations are gridded onto a 0.5° grid to match the climate data using the statistical package R (R Core Team, 2017) and the Geospatial Data Abstraction software Library (GDAL/OGR contributors, 2019). In any grid cell containing two or more countries, the grid cell is assigned to the country with the largest fraction of area in that grid cell.
Soil data are from the Global Soil Dataset for Earth System Modeling (Shangguan et al., 2014). The soil input parameters required for GLAM (drained lower limit, drained upper limit, and saturation limit) are calculated using the method of Saxton et al. (1986). Saxton et al. (1986) use percentage values of sand and clay to calculate these hydrological parameters. These values are then averaged over the top seven soil layers (necessary to include the 1 m maximum soil depth used in GLAM-potato) and aggregated to the 0.5° grid.
2.2.3. Yield Data
FAOSTAT country-level yield data (FAO, 2019) are used to calibrate and evaluate GLAM-potato. Data examined are from the years 1980 to 2009 to coincide with available climate data. 2010 yield data are excluded from evaluation simulations as some simulations go into a second calendar year.
FAOSTAT define the year associated with the yield data as that when the majority of the harvest took place. The year associated with the yield data in GLAM is the year associated with planting. As such, countries with the bulk of harvest taking place in a different year to planting need to be identified so GLAM associates the correct year with the yield data. These countries (Angola, Argentina, Lesotho, Malawi, Mauritania, Mali, Morocco, Mozambique, Namibia, Papua New Guinea, Rwanda, South Africa, Swaziland, Zimbabwe, Bolivia, Brazil, Cuba, Peru, Venezuela, Australia, Timor-Leste, Bangladesh, India, Pakistan, Fiji, Indonesia, Sri Lanka, UAE, and Vietnam) are predominately in the southern hemisphere. Information used to identify the main growing seasons in each country is from the World Potato Atlas provided by the International Potato Center, Colombia (CIP, 2009), and FAO crop calendars (FAO, 2019). When this information provides no clear single main growing season the median harvest dates from Sacks et al. (2010) are used to determine the main growing season for the country.
Yield data trends could be due to factors not accounted for in the model (e.g., technology changes) or due to changes in climate during a time series. Both simulated and observed yields are detrended when evaluating the model—this ensures that any trends are removed from both observed and simulated yields to compare like-with-like.
Before this process, each time series is examined to identify any sudden large changes in mean yield levels across the time series that show large changes to growing area or other fundamental significant shifts in yield observations that modeling would not account for. These are deemed to be such “multi-state” time series if upon visual inspection they exhibit large changes in mean yields that are sustained for three or more years. Such time series are excluded from the analysis. Countries excluded for exhibiting such multi-state time series are in Supplementary Table 1. An exception is made for China—which shows some multi-state yield data—as it produces the most potatoes globally. The longest of the two distinct sections of yield data is selected to evaluate the model in China. Data are also dropped from each time series if there are consecutive years with identical yields, these being deemed unrealistic.
The yield time series are detrended using the R function lowess in the gplots package. Lowess is described in Cleveland (1979). The parameter f is set to 0.8 as Cleveland (1979) state that values between 0.2 and 0.8 are suitable for most applications; higher f-values provide greater smoothing of data without distorting variability. Very little difference was found when testing values across this range so 0.8 was chosen to give greater smoothing.
Lastly, any country with fewer than 5 years of data is excluded. A total of 102 countries are simulated. Details of which countries are simulated and years simulated for each country can be seen in Supplementary Table 1.
2.3. Model Parameter Configuration
GLAM-potato is used to simulate the abiotic impacts of climate change. Future simulations assume the same growing area, irrigation, and CYG as the baseline, meaning that pest and disease and technology impacts are assumed to not change. The same methods to calculate planting windows and varieties are used in the baseline and future climates, enabling us to calculate the benefits of adaptation (Lobell, 2014). For non-adaptation simulations, the baseline planting dates and varieties are fixed in the future climate. If these combinations are no longer viable given the conditions used to select planting dates and varieties they are excluded from non-adaptation simulations.
Table 2 lists all crop-specific parameter values used in GLAM-potato. Specific information on crop growth parameters is not available across different regions, therefore these are kept constant at mid-points from reported ranges rather than optimising parameters locally. Exceptions are the maximum rate of change of leaf area index, the maximum rate of change of harvest index and the maximum normalised transpiration efficiency, which are set to the maximum of the values reported in the literature in order to potentially simulate the highest yields.
The combination of variety and planting window that returns the highest yield in initial simulations is used in each grid cell, similarly to the methods of Osborne et al. (2013), Dawson et al. (2016), Rose et al. (2016), and Hijmans (2003). As shown in Table 1, Varieties T1-T5 consist of progressively higher thermal time requirements for harvest maturity. Cardinal temperatures are fixed at a mid-point from across the reported range (see Table 2). Along with the five hypothetical varieties of potato, 12 possible planting windows are simulated at every grid cell. The combination of variety and planting window that results in the highest mean simulated yield along with realistic crop durations (<180 days) and a majority of years without emergency planting is chosen for each grid cell. These caps are imposed to simulate realistic crop phenology and as potato harvesting is a complex process involving climatic and non-climatic factors (Kooman et al., 1996), with the majority of potato seasons not being longer than 180 days.
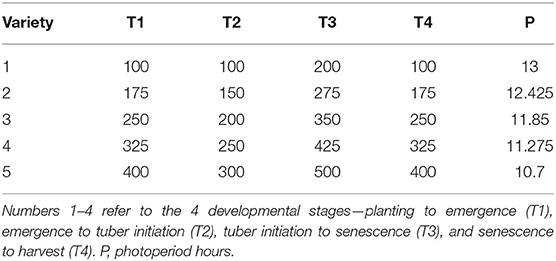
Table 1. Thermal times and critical photoperiods used for the different varieties (°C).
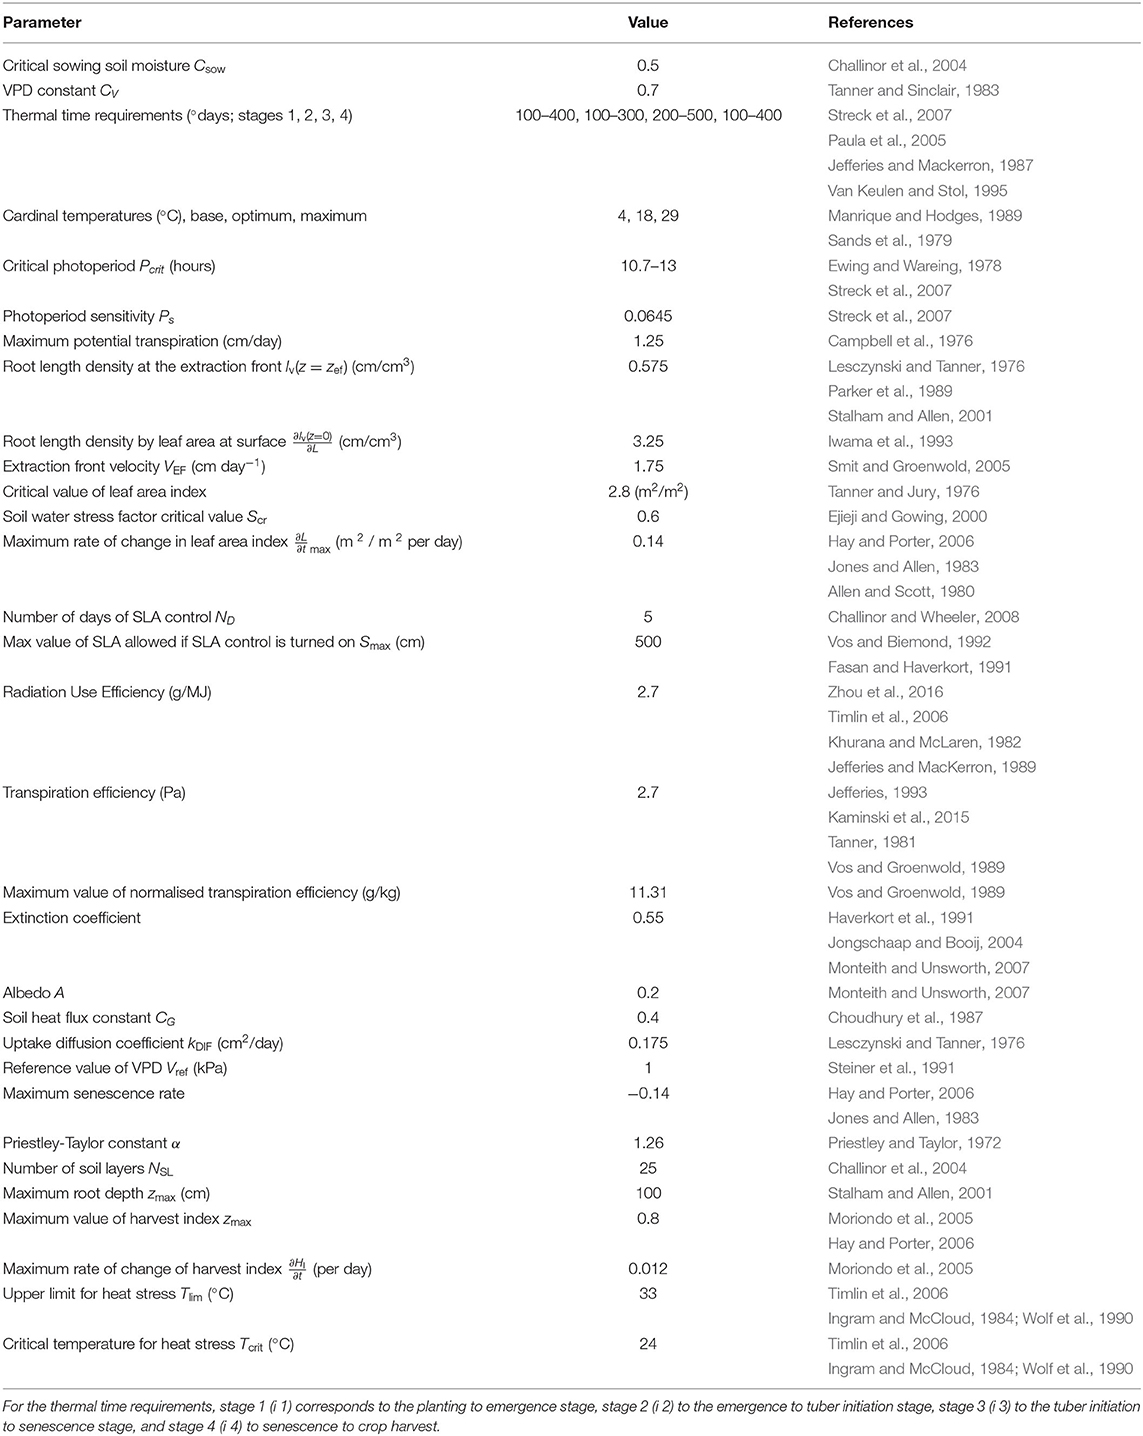
Table 2. Parameters used in GLAM-potato, with ranges and units where applicable.
The parameter CYG is used to calibrate to mean observed yield levels to account for spatial differences in crop management that are not explicitly included in GLAM. One value of CYG is calibrated for each country as country-level observed yield data are available for this global analysis (as also used in Raymundo et al., 2018). A simulated national-level yield time series is calculated for each country for calibrating CYG by dividing total country production (calculated using the simulated yields in each grid cell and the potato growing area for that grid cell) by total area for each year. This provides a simulated yield time series for calibration of CYG.
One half of each observed yield time series is used for calibration and the other half for model evaluation (the lengths of time series varying, depending on the data available in each country). The half of the time series with the most significant correlations between observed yields and temperature and rainfall was chosen for evaluation, as GLAM is specifically designed to simulate these relationships. The relative root mean square error (RRMSE) is used to assess the accuracy of mean simulated yield levels and correlation coefficients are used to determine the skill of the model in simulating interannual observed yield variability.
To take into account CO2 fertilisation, GLAM is parameterised to match yield responses as recorded by Free Air CO2 and Free-Air Carbon dioxide Enrichment (FACE) (Kimball, 2016), showing potato yield increases of 22–33%. These FACE responses are representative of a 353 ppm concentration in the baseline (c. year 1990) and a 550 ppm concentration of CO2 in the future—the equivalent of year 2053 for RCP 8.5. Initial simulations are conducted where parameters are varied to choose a combination that gives sensible global yield increases and reductions in transpiration to match FACE data. These simulations were conducted on the first half of the time series to match baseline CO2 conditions.
GLAM parameters concerned with biomass growth (radiation use efficiency RUE, transpiration efficiency TE, and the maximum normalised transpiration efficiency TENMAX) are increased incrementally, and the physiologically-limited potential transpiration PTM is decreased, ensuring that reductions in transpiration are driven by physiological (stomatal closure) and not energetic limitations (Challinor et al., 2005; Challinor and Wheeler, 2008). The combination of parameters that best matched FACE yield response ratios globally and achieve a decrease in transpiration was an increase in RUE, TE, and TENMAX by 20% and a decrease in PTM by 50%. This resulted in a mean global yield increase of 23% and the desired global mean decrease in transpiration.
3. Results
Results sections are presented below firstly for the global GLAM evaluation in the baseline (section 3.1), and secondly for the impacts of climate change on potatoes (section 3.2).
Variables used in maps represent averages over the years of simulation, with data taken from across the simulated growing seasons (i.e., simulated planting to harvest maturity). Climate variables are the mean daily values over the growing season.
3.1. Global Model Evaluation
The mean country-level relative root mean square error (RRMSE) is 24%, meaning that mean yields are well captured (see Supplementary Figure 3 for plots showing mean observed and simulated yields). The observed yield standard deviation, averaged across countries, is 0.32 T/Ha. The simulated mean standard deviation is 0.43 T/Ha, meaning that simulated yield variability is similar in magnitude to observations although slightly overestimated. Correlations between observed and simulated yields for the baseline period are shown in Figure 2. The majority of countries have positive correlation coefficients. Most significant yield correlations are in Europe where stronger relationships between observed yields and climate inputs exist. The 18 countries with positive correlations and p-values < 0.1 are Argentina, Australia, Austria, Belarus, Belgium, Costa, Czech Republic, France, Germany, Hungary, Latvia, Macedonia, Mauritania, Netherlands, Poland, Slovakia, United Kingdom, and Uzbekistan.
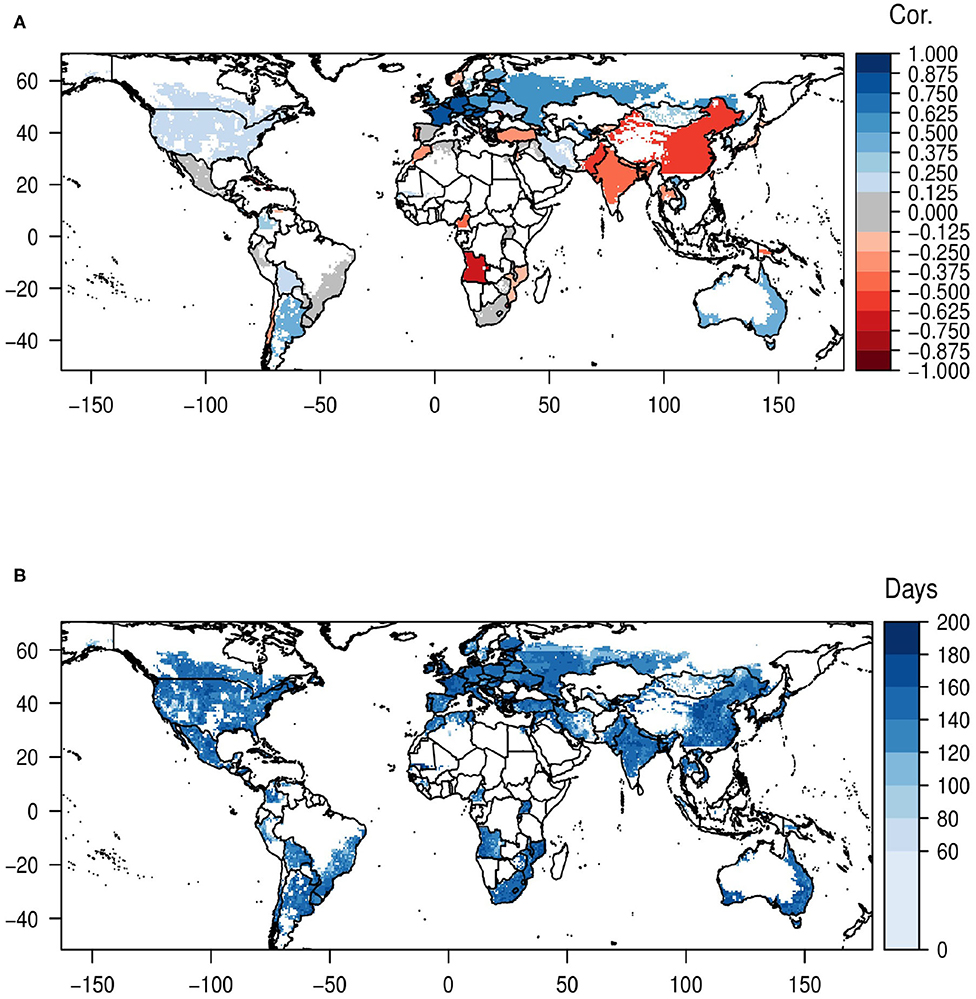
Figure 2. (A) Correlation coefficient between simulated and observed national yields. (B) Mean simulated duration of growing season.
Low model skill occurs when relationships between observed yields and climate variables are not well-captured, or more commonly when these observed relationships are weak (see Supplementary Figures 4–6). Only four of 102 countries showed significant correlations between observed yields and both rainfall and temperature.
Simulated growing season durations are shown in Figure 2B. These are typically 120–140 days in the northern hemisphere and higher in subtropical and tropical regions. The start of the planting window and varieties chosen for the baseline evaluation are shown in Figure 3. Planting windows typically begin in the first half of the year in Europe and North America. In subtropical and tropical regions planting tends toward the latter half of the year, although there is variation, as expected given the varied potato growing seasons in these regions. Observed planting dates from experimental sites across 17 countries in Raymundo et al. (2017) are significantly correlated with mean planting dates in GLAM (correlation of 0.77, p-value < 0.001).
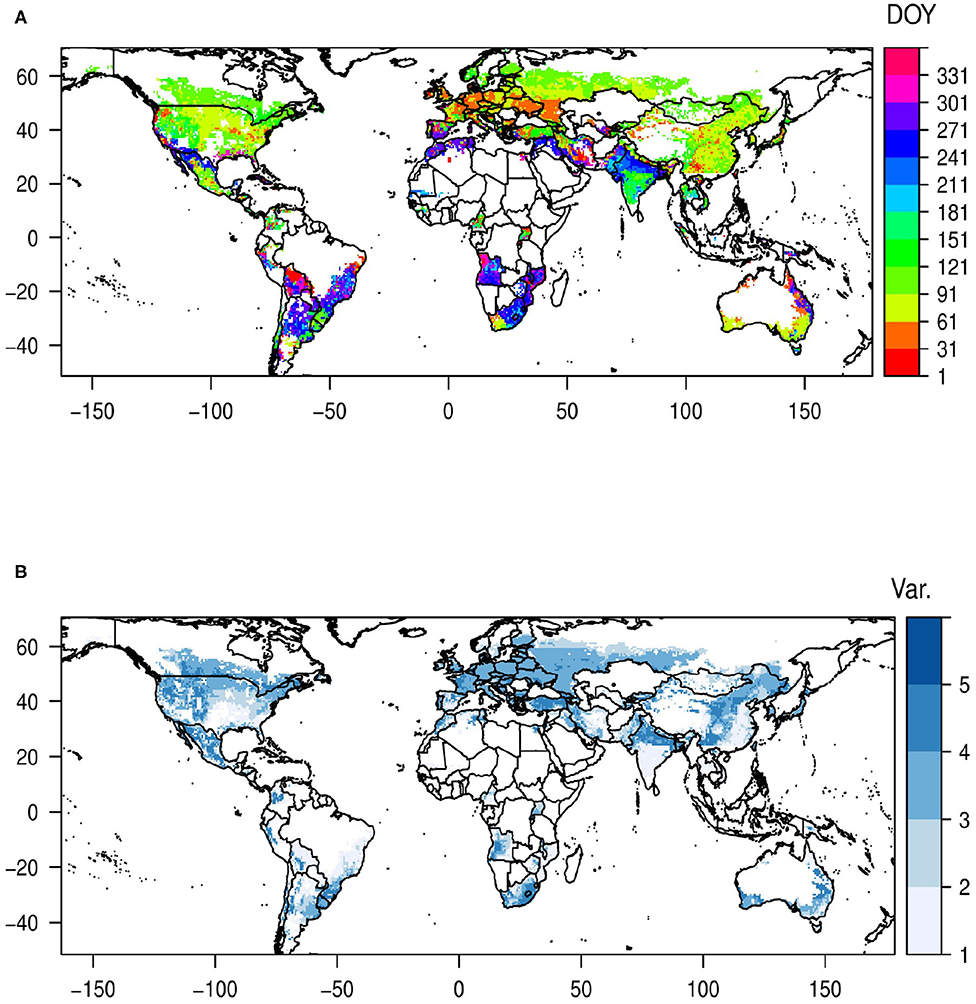
Figure 3. (A) Start of selected planting window. (B) Variety chosen for each grid cell in the baseline climate.
Important potato growing countries of the USA, India, and China show poor correlation coefficients between observed and simulated yields. These countries show different signs of temperature correlations in the two halves of the time series used for model calibration and evaluation, making evaluation difficult as the model is calibrated on a section of time series with a drastically different relationship to temperature. In some countries (Angola, Ukraine, Russia, and China) model skill is poor when the time series being evaluated on is short (often only 9 years); there are limits to the inferences that should be made on correlations based on such short time series, and when relationships between observed yields and climate variables change so drastically in different sections of the time series. In China, for example, climate-yield relationships are not well simulated and model skill is poor. Two agri-ecological zones dominate potato agriculture: the northern region and the south western region (CIP, 2009). The northern region contains the most potato production, and here planting is most commonly in the spring (Zhao et al., 2018). GLAM also simulates spring planting dates in China, and captures mean yields well. Correlations between observed yield and temperature are not well-simulated, although the second half of the time series has an opposite (positive) relationship between observed yields and temperature which GLAM simulates accurately.
Correlations between observed yields and temperature and rainfall are low in most areas of the USA. Planting windows and durations are sensible however, being in the northern hemisphere spring and harvesting in late summer, and mean yields are accurately represented.
In India, the most important areas for potato cultivation are across the Indo-Gangetic plain. Potato is a winter crop here, sown from October to November (CIP, 2009). Year-round production occurs in high altitude southern areas. Simulations match these observed planting dates. A negative correlation between rainfall and observed yields is not picked up in GLAM in these areas, although durations, planting dates and mean yields are well captured in the country, as is the magnitude of observed yield variability.
3.2. Global Future Yield Changes
Global median yield increases range from 9 to 20% with adaptation to climate change (see Figure 4 for mean yield changes across climate models globally and Supplementary Figures 10–13 for yield changes associated with each climate model). Standard deviations of simulated yields change marginally from 0.45 to 0.50 T/Ha in the baseline to 0.50 to 0.62 T/Ha in the future adaptation simulations (ranges across climate models).
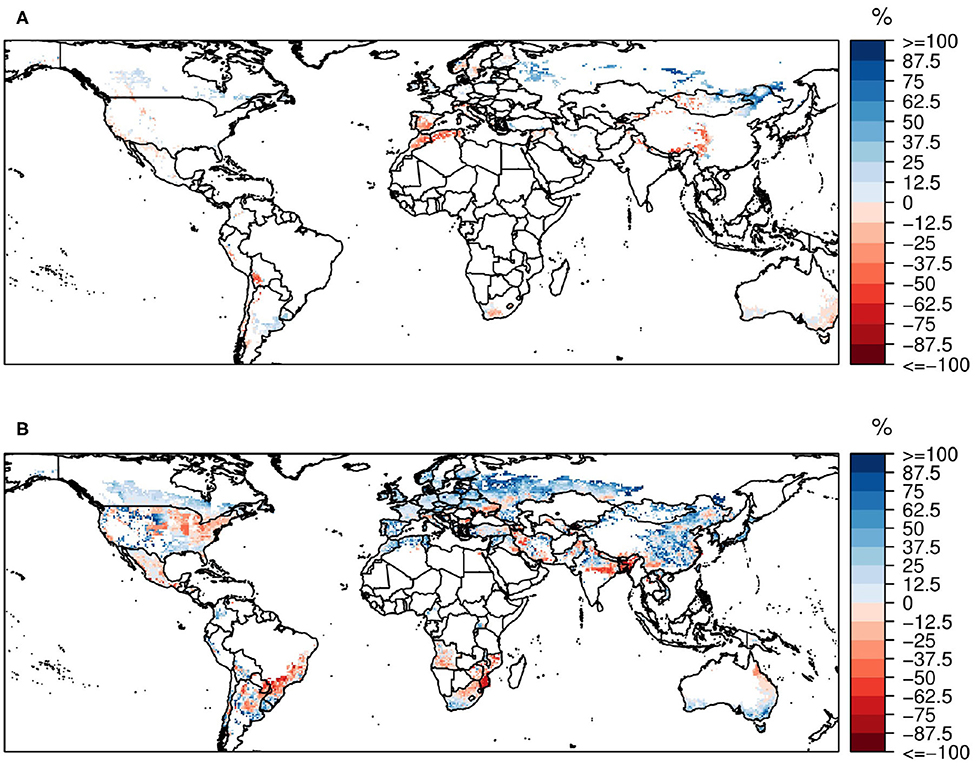
Figure 4. Yield percentage change from baseline climate to 2040–2060. Values shown are mean values across climate models. (A) Non-adaptation simulations. (B) Adaptation to future climate.
When taking into account only the grid cells that contain both adaptation and non-adaptation future climate simulations, median benefits of adaptation simulations over non-adaptation simulations range from 10 to 17% (depending on the climate model). This is slightly less than the global benefit of CO2 fertilisation in this analysis of 23% (see section 2.3). In the non-adaptation future climate simulations over half of grid cells are excluded (see Supplementary Figure 14B), meaning that at least some change to baseline sowing windows or varieties is necessary in order to fulfill selection criteria of durations <180 days and a majority of years successfully planting the crop within the chosen planting window. Without removing these grid cells a fair comparison across adaptation and non-adaptation simulations cannot be made given these model selection criteria. Yield gains of 6–14% are seen on average globally in non-adaptation simulations for the grid cells that are remaining.
Figures 5, 6 show positive and negative yield changes by country for the adaptation and non-adaptation simulations, respectively. Most countries show yield increases in adaptation simulations, and more high area countries show yield increases than decreases (therefore contributing a greater amount to global production). Yield increases are primarily driven by the length of the growing season being maintained or increasing in the adaptation simulations as well as CO2 fertilisation.
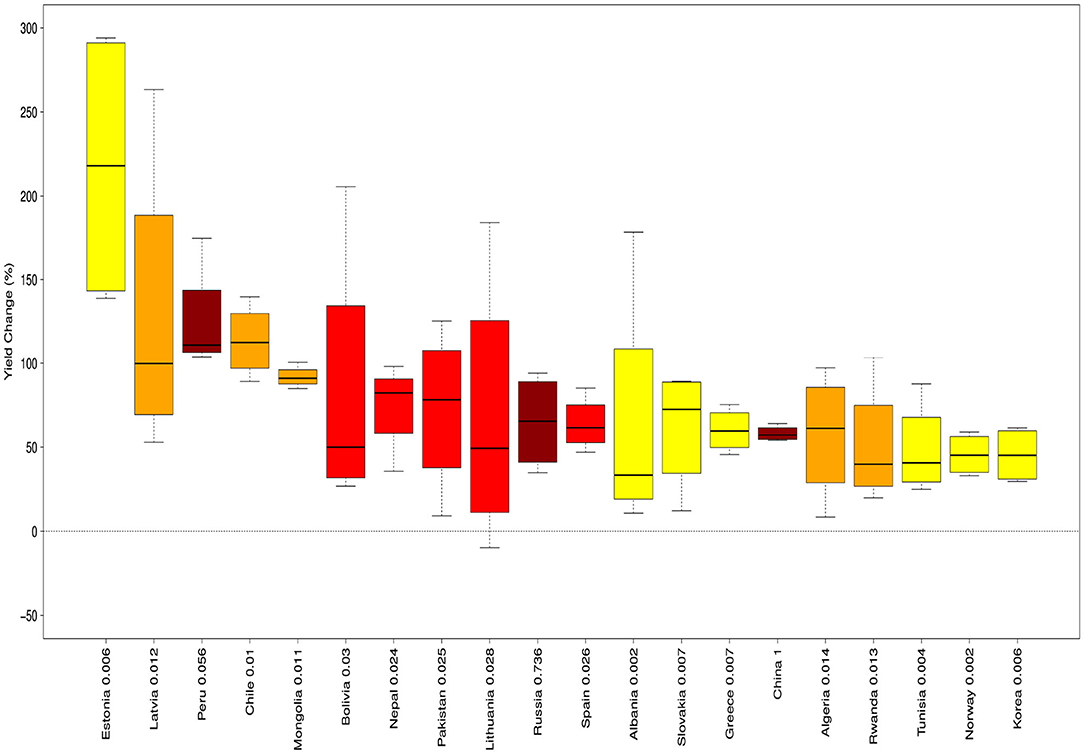
Figure 5. Countries associated with the 20 largest increases in mean yields across climate models from the baseline to 2040–2060, with ranges across climate models, for the adaptation simulations. Boxplots show medians, interquartile ranges and the whiskers extend to 1.5 times the interquartile range. Dark red boxes show top 10 countries for growing area, light red = top 25, orange = top 50%, and yellow = bottom 50%. Numbers next to country names refer to the normalised growing area for each country, with a value of 1 indicating the largest growing area in one country, which is 4,394,406 ha in China.
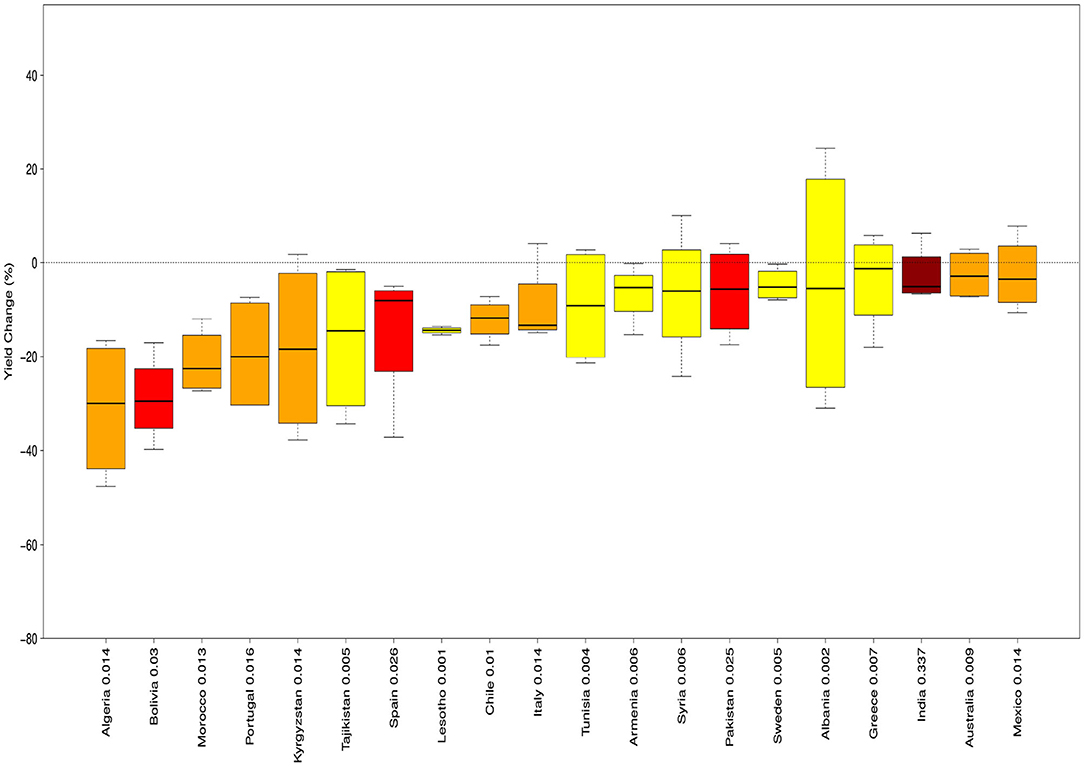
Figure 6. Countries associated with the 20 largest decreases in mean yields across climate models from the baseline to 2040–2060, with ranges across climate models, for the non-adaptation simulations. Boxplots show medians, interquartile ranges and the whiskers extend to 1.5 times the interquartile range. Dark red boxes show top 10 countries for growing area, light red = top 25, orange = top 50%, and yellow = bottom 50%. Numbers next to country names refer to the normalised growing area for each country, with a value of 1 indicating the largest growing area in one country, which is 4,394,406 ha in China.
Planting dates and varieties selected in the future climate are shown for one of the four climate models in Figure 7 (other model planting dates and varieties are similar and are shown in Supplementary Figures 7–9). The adaptation simulations that allow planting dates and varieties to shift in the future climate show that in the northern hemisphere in particular, planting takes place later (into the autumn) or earlier (into the spring) in the growing season to take advantage of the warmer conditions in parts of the year that contain sufficient rainfall (Supplementary Figure 15B). Climate model projections show similar warming in most growing areas but shifting growing seasons mean there are lower temperatures in south east USA and China (Supplementary Figure 15B). Durations usually do not vary substantially, as is expected in adaptation simulations (Supplementary Figure 17B). Tropical regions in Africa and South America show yields sometimes decreasing due to sharp reductions in rainfall and duration.
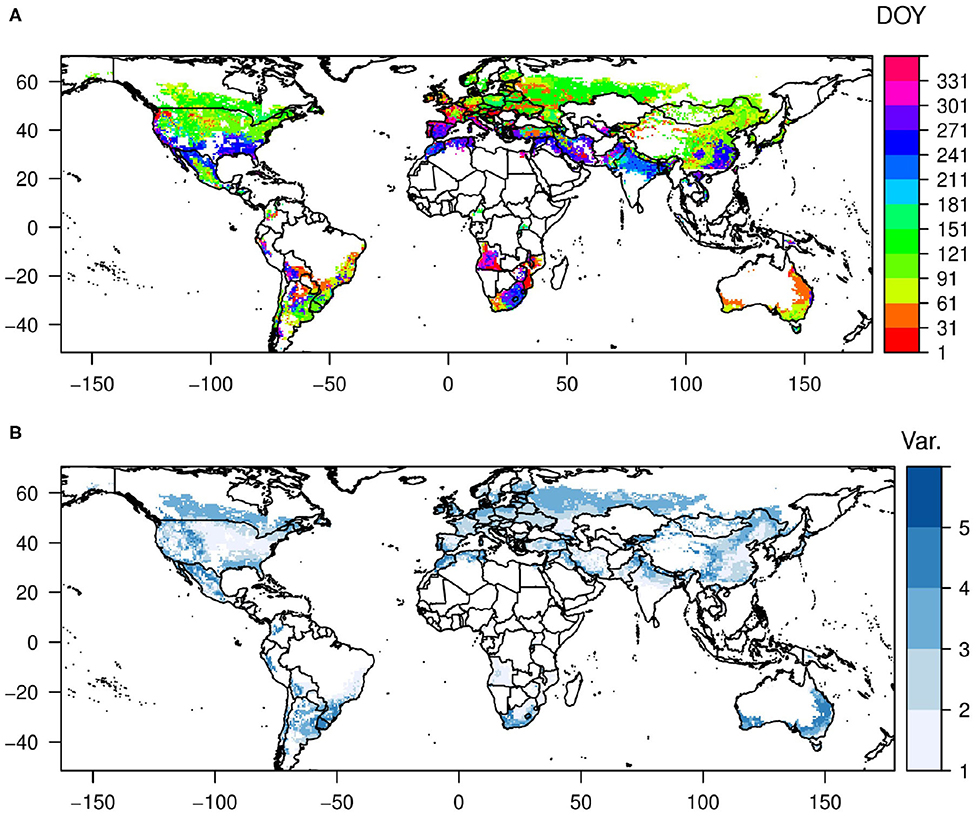
Figure 7. (A) Start of the planting window. (B) Varieties chosen for 2040–2060 using the HadGEM2-ES model.
Climate projections show that temperatures over the growing season will increase in most of Europe by approximately 2°C by 2050 (Supplementary Figure 15A). Growing season total rainfall is projected to decrease in many growing areas in Europe, although it increases in parts of Russia and strong yield gains are projected as a result (Supplementary Figure 16A). South Asian countries show yield decreases even when including adaptation to climate change. This is due to rising temperatures and decreases in growing season duration (see Supplementary Figures 15, 17). In these countries, temperatures rise to the point where growth and development of potato become adversely impacted in model simulations.
4. Discussion
This analysis shows that potato yields are likely to increase globally by 2050 due to CO2 and adaptation benefits—even with the more pessimistic RCP8.5 scenario simulated in this study. The range of global average yield increases shown across climate models is 9–20% with adaptation. The benefits of adaptation simulations over non-adaptation simulations range from 10 to 17% globally, depending on the climate model. Hijmans (2003) reported similar benefits to potato yields from adaptation—from about 10–15% globally, as do Challinor et al. (2014b), although for other major crops. These projected adaptation benefits are substantial, although less than yield increases due to CO2 fertilisation (Kimball, 2016). The importance of adaptation is also highlighted by the many grid cells that do not meet duration and planting window conditions in future non-adaptation simulations. These simulations suggest that changes to potato growing seasons are needed in order to realise yield benefits.
The yield gains reported in this study are higher than those reported by Hijmans (2003) and Raymundo et al. (2018), although neither of these studies incorporate both CO2 fertilisation and gains from adaptation. When including the level of adaptation benefit reported in this study and in Hijmans (2003), similar yield increases can be inferred from the projections of Raymundo et al. (2018), given the 5.6% decrease for RCP8.5 by 2055 they report without adaptation. If including the 22–33% yield increases from CO2 fertilisation as reported by Kimball (2016), the global yield decreases projected by Hijmans (2003) of 9–18% would also be positive. Fleisher et al. (2017) show that uncertainty across currently available potato models can be large, highlighting the need for more global potato yield impacts studies that need to include both CO2 fertilisation and climate change adaptation for more detailed comparisons to be made.
In section 3.1, we evaluate GLAM model performance, concluding that observed yield variability is adequately captured when it is driven by climate variables and that mean yields and the magnitude of yield variability are well-captured. Correlations between observed and simulated yields are insignificant in most cases however (18 countries showing significant correlations). This is due to most relationships between observed yields and climate variables also being insignificant in most cases at the national scale—only four of 102 countries had significant relationships between yields and both rainfall and temperature. Crop models that simulate only direct climate influences on yield (such as the model used in this study as described in section 2.1) cannot be expected to simulate observed yield variability when this is due to non-climatic factors. Given that when strong, consistent relationships between observed yields and climate inputs exist the model performs well, we have confidence in model projections of future yields, especially given the sensible planting dates selected in important growing areas.
Past global potato modeling studies do not report correlation coefficients for assessing observed yield interannual variability or model outputs such as growing season length. Previous global crop modeling studies for other crops show skill in some cases at representing mean yield levels and interannual variability (e.g., Müller et al., 2017). Müller et al. (2017) however found poor model skill for Chinese wheat and soybean, illustrating the difficulties in evaluating crop models in these important growing regions using national scale yield data. Raymundo et al. (2018) show mixed results in representing the variability and mean of FAO national yields across the globe. Their results showed higher simulated than observed yield variability and high RRMSE (56% on average globally), especially in China and Russia.
In India and China, correlations are poor between observed and simulated yields. In India, it is possible that the lack of a flooding parameterisation in GLAM is hampering model skill. In both of these countries however, correlations between temperature and observed yields change drastically in the two halves of the time series used for calibration and evaluation, making evaluation with correlations challenging. Planting dates are in general satisfactorily simulated in the important potato growing regions in these two countries, giving us confidence in the model's predictive potential.
The larger countries simulated in this analysis usually have poor model skill and this is probably not a coincidence. The use of national scale yield data is likely a part of the reason for poor skill as the variability of the national scale yield data may not apply to that at the level of the grid cell. The FAOSTAT yield data are associated with the year when the majority of the harvest takes place. Large and climatically-variable countries such as China and India have planting dates at different times of the year in different regions, and therefore the yield data for a given year may not be representative of all grid cells. Shorter time series of yield data are also often associated with poor model skill; again this is probably no coincidence, as data quality could be associated with the quantity of data available.
Further confidence can be gained by comparing model projections for these three countries with results from other potato yield projection studies. In China, yields are projected to increase in Raymundo et al. (2018) and decrease in eastern USA (Tubiello et al., 2002; Raymundo et al., 2018), as does this analysis. India yields are projected to increase in the Indo-Gangetic plain in Raymundo et al. (2018) unlike the decreases projected here however. Raymundo et al. (2018) do not go into details as to why yields change in different regions, and do not publish plots showing e.g., temperature or rainfall changes from which to infer such conclusions. Other studies also show yield decreases projected in this important Indian region however (Hijmans, 2003; Kumar et al., 2015).
Projections in this study show that CO2 fertilisation can help to mitigate negative influences of climate change. Other studies have shown similar results: for example. Haverkort et al. (2013) found that increasing CO2 more than compensated for yield losses due to rising temperatures and reduced water availability for South African potatoes by 2050. Ozone-induced damage can also be compensated to some extent, although the size of the effects from CO2 fertilisation and ozone damage are uncertain (Magliulo et al., 2003; Finnan et al., 2005; Fleisher et al., 2008; Feng and Kobayashi, 2009; Raymundo et al., 2018). Projected future yield losses for potato from ozone damage are estimated to be around 12% on average across studies (Feng and Kobayashi, 2009). Decreasing the projected yield changes simulated in this study by projected median ozone damage still leads to positive yield change overall however. CO2 and ozone impacts on potato tuber quality and nutrition are complex—studies have reported losses in protein, calcium, and potassium tuber content but impacts on tuber quality are uncertain (Vorne et al., 2002; Högy and Fangmeier, 2009). More studies are needed to make robust statements about the implications of nutrient loss with climate change.
Changing planting dates and varieties may not be straightforward due to market pressures, pests, and diseases, other crops and water availability (Hijmans, 2003; van Bussel, 2011). There is a large diversity of potato varieties that could be exploited by breeders to help improve tolerance to climate change impacts (Schafleitner et al., 2011), but the access of new varieties to farmers will likely remain problematic in some developing countries. The realism of altering planting dates will likely depend on factors not accounted for in this study, namely other crops, market pressures, and pest and disease impacts. The assumption that pests and disease impacts will remain the same may underestimate impacts given that pests and diseases are expected to saturate areas in which their host crops are found (Bebber et al., 2014).
Moore and Lobell (2014) found that the rate at which farmers adapt to warming is an important source of uncertainty in climate impact projections. Although the representation of adaptation used in this study is arguably optimistic as access to varieties and planting window changes are unrestricted, other adaptations are not included which could help in adapting to climate change such as tolerance to excess water, low water, or heat stress. The lack of representation of a more diverse array of adaptation options is common in crop modeling studies (Beveridge et al., 2018; Challinor et al., 2018). Given that the modeled yield variability captures the magnitude of observed yield variability, and that many regions maintain or even increase rainfall with adaptations of changing sowing dates and varieties, it is likely that if freely allowing changes to when potatoes are grown, then yields can be maintained in the future. Extreme conditions are usually avoided and therefore these adaptations can be seen as successfully avoiding the need to adapt in other ways (although in some cases, including other adaptation benefits will likely lead to further yield increases).
The impacts of climate change on potato are favourable compared to other major crops. Challinor et al. (2014b) provide a meta-analysis of climate change impact projections and conclude that losses are likely for maize, rice, and wheat without adaptation, with maize likely to see yield declines even with adaptation. Rosenzweig et al. (2014) concur that maize yields will suffer from climate change, with wheat, soybean, and rice yields likely to decline with warming at lower latitudes. Soybean and wheat were also projected to mostly see yield declines by Osborne et al. (2013). With other major crops likely to see yield decreases due to climate change, the case for potato being a strong future cropping option becomes stronger, especially given the high nutrient content of potato (Lutaladio and Castaldi, 2009) and the increase in potato growing areas in food insecure regions (FAO, 2019).
Given the substantial contribution agricultural systems make to global emissions it is important to consider the implications of adaptation options for emissions (Challinor et al., 2018; Whitfield et al., 2018). The adaptation options simulated here are not associated with increased emissions. Other potential adaptations, such as increasing use of fertiliser, involve increases to emissions (Baggs et al., 2003). An assessment of climate smartness can therefore be made without the need for direct quantification of the kind demonstrated by Arenas-Calle et al. (2019). Given that potato is a low emission crop (Flynn et al., 2005; Haile-Mariam et al., 2008; Nemecek et al., 2012; Clune et al., 2017) and that the adaptation options shown here do not lead to increased emissions, global potato agriculture can be viewed as part of a climate smart agricultural future.
5. Conclusion
This study shows that when including adaptation to climate change, yield increases range from 9 to 20% globally depending on the climate model input. The emissions associated with potato agriculture are lower than most other staple crops and potato yields show higher yield increases with adaptation by 2050 than other major crops. We therefore suggest that potatoes are a viable climate smart crop that can adapt to play an important role in a sustainable future food system.
Data Availability Statement
Data available upon request. The raw data supporting the conclusions of this article will be made available by the authors, without undue reservation.
Author Contributions
SJ, AC, and A-KK contributed to the conception and design of the study. SJ performed the analysis and prepared the manuscript. CD and KN assisted with data preparation. All authors contributed to manuscript revision and read and approved the submitted version.
Funding
This work was supported by the Natural Environment Research Council [grant number NE/L501542/1.].
Conflict of Interest
The authors declare that the research was conducted in the absence of any commercial or financial relationships that could be construed as a potential conflict of interest.
Acknowledgments
The authors wish to thank the members of the Climate Impacts Group, School of Earth and Environment, University of Leeds, for insightful comments on the analysis. The authors also wish to acknowledge Richard Rigby for assistance with technical support.
Supplementary Material
The Supplementary Material for this article can be found online at: https://www.frontiersin.org/articles/10.3389/fsufs.2020.519324/full#supplementary-material
References
Allen, E., and Scott, R. K. (1980). An analysis of growth of the potato crop. J. Agric. Sci. 94, 583–606. doi: 10.1017/S0021859600028598
Arenas-Calle, L. N., Whitfield, S., and Challinor, A. J. (2019). A Climate Smartness Index (CSI) based on greenhouse gas intensity and water productivity: application to irrigated rice. Front. Sustain. Food Syst. 3:105. doi: 10.3389/fsufs.2019.00105
Baggs, E., Stevenson, M., Pihlatie, M., Regar, A., Cook, H., and Cadisch, G. (2003). Nitrous oxide emissions following application of residues and fertiliser under zero and conventional tillage. Plant Soil 254, 361–370. doi: 10.1023/A:1025593121839
Bebber, D. P., Holmes, T., and Gurr, S. J. (2014). The global spread of crop pests and pathogens. Glob. Ecol. Biogeogr. 23, 1398–1407. doi: 10.1111/geb.12214
Bergamaschi, H., Costa, S. M. S. D., Wheeler, T. R., and Challinor, A. J. (2013). Simulating maize yield in sub-tropical conditions of southern Brazil using GLAM model. Pesquisa Agropec. Bras. 48, 132–140. doi: 10.1590/S0100-204X2013000200002
Beveridge, L., Whitfield, S., and Challinor, A. (2018). Crop modelling: towards locally relevant and climate-informed adaptation. Clim. Change 147, 475–489. doi: 10.1007/s10584-018-2160-z
Birch, P. R., Bryan, G., Fenton, B., Gilroy, E. M., Hein, I., Jones, J. T., et al. (2012). Crops that feed the world 8: potato: are the trends of increased global production sustainable? Food Sec. 4, 477–508. doi: 10.1007/s12571-012-0220-1
Calton, B., Schellekens, J., and Martinez-de la Torre, A. (2016). Water Resource Reanalysis v1: Data Access and Model Verification Results.
Campbell, M. D., Campbell, G. S., Kunkel, R., and Papendick, R. I. (1976). A model describing soil-plant-water relations for potatoes. Am. Potato J. 431–441. doi: 10.1007/BF02852657
Challinor, A., Martre, P., Asseng, S., Thornton, P., and Ewert, F. (2014a). Making the most of climate impacts ensembles. Nat. Clim. Change 4, 77–80. doi: 10.1038/nclimate2117
Challinor, A., Muller, C., Asseng, S., Deva, C., Nicklin, K., Wallach, D., et al. (2018). Improving the use of crop models for risk assessment and climate change adaptation. Agric. Syst. 159, 296–306. doi: 10.1016/j.agsy.2017.07.010
Challinor, A., Slingo, J., Wheeler, T., Craufurd, P., and Grimes, D. (2003). Toward a combined seasonal weather and crop productivity forecasting system: determination of the working spatial scale. J. Appl. Meteorol. 42, 175–192. doi: 10.1175/1520-0450(2003)042<0175:TACSWA>2.0.CO;2
Challinor, A., and Wheeler, T. (2008). Use of a crop model ensemble to quantify CO2 stimulation of water-stressed and well-watered crops. Agric. For. Meteorol. 148, 1062–1077. doi: 10.1016/j.agrformet.2008.02.006
Challinor, A., Wheeler, T., Craufurd, P., Slingo, J., and Grimes, D. (2004). Design and optimisation of a large-area process-based model for annual crops. Agric. For. Meteorol. 124, 99–120. doi: 10.1016/j.agrformet.2004.01.002
Challinor, A., Wheeler, T., Slingo, J., and Hemming, D. (2005). Quantification of physical and biological uncertainty in the simulation of the yield of a tropical crop using present-day and doubled CO2 climates. Philos. Trans. R. Soc. Lond. B Biol. Sci. 360, 2085–2094. doi: 10.1098/rstb.2005.1740
Challinor, A. J., Watson, J., Lobell, D. B., Howden, S. M., Smith, D. R., and Chhetri, N. (2014b). A meta-analysis of crop yield under climate change and adaptation. Nat. Clim. Change 1–5. doi: 10.1038/nclimate2153
Choudhury, B., Idso, S., and Reginato, R. (1987). Analysis of an empirical model for soil heat flux under a growing wheat crop for estimating evaporation by an infrared-temperature based energy balance equation. Agric. For. Meteorol. 39, 283–297. doi: 10.1016/0168-1923(87)90021-9
Cleveland, W. S. (1979). Robust locally weighted regression and smoothing scatterplots. J. Am. Stat. Assoc. 74, 829–836. doi: 10.1080/01621459.1979.10481038
Clune, S., Crossin, E., and Verghese, K. (2017). Systematic review of greenhouse gas emissions for different fresh food categories. J. Clean. Prod. 140, 766–783. doi: 10.1016/j.jclepro.2016.04.082
Cox, G., Gibbons, J., Wood, A., Craigon, J., Ramsden, S., and Crout, N. (2006). Towards the systematic simplification of mechanistic models. Ecol. Model. 198, 240–246. doi: 10.1016/j.ecolmodel.2006.04.016
Critchley, W., Siegert, K., Chapman, C., and Finket, M. (2013). Water Harvesting: A Manual for the Design and Construction of Water Harvesting Schemes for Plant Production. Scientific Publishers.
Dawson, T. P., Perryman, A. H., and Osborne, T. M. (2016). Modelling impacts of climate change on global food security. Clim. Change 134, 429–440. doi: 10.1007/s10584-014-1277-y
Dee, D. P., Uppala, S., Simmons, A., Berrisford, P., Poli, P., Kobayashi, S., et al. (2011). The ERA-Interim reanalysis: configuration and performance of the data assimilation system. Q. J. R. Meteor. Soc. 137, 553–597. doi: 10.1002/qj.828
Deryng, D., Conway, D., Ramankutty, N., Price, J., and Warren, R. (2014). Global crop yield response to extreme heat stress under multiple climate change futures. Environ. Res. Lett. 9:034011. doi: 10.1088/1748-9326/9/3/034011
Devaux, A., Kromann, P., and Ortiz, O. (2014). Potatoes for sustainable global food security. Potato Res. 57, 185–199. doi: 10.1007/s11540-014-9265-1
Ejieji, C., and Gowing, J. (2000). A dynamic model for responsive scheduling of potato irrigation based on simulated water-use and yield. J. Agric. Sci. 135, 161–171. doi: 10.1017/S0021859699008102
Ewing, E. E., and Wareing, P. F. (1978). Shoot, stolon, and tuber formation on potato (Solanum tuberosum L.) cuttings in response to photoperiod. Plant Phisol. 61, 348–353. doi: 10.1104/pp.61.3.348
FAO (2010). Climate Smart Agriculture: Policies, Practices and Financing for Food Security, Adaptation and Mitigation. Rome: Food and Agriculture Organization.
Fasan, T., and Haverkort, A. (1991). The influence of cyst nematodes and drought on potato growth. 1. Effects on plant growth under semi-controlled conditions. Netherl. J. Plant Pathol. 97, 151–161. doi: 10.1007/BF01995964
Feng, Z., and Kobayashi, K. (2009). Assessing the impacts of current and future concentrations of surface ozone on crop yield with meta-analysis. Atmos. Environ. 43, 1510–1519. doi: 10.1016/j.atmosenv.2008.11.033
Finnan, J., Donnelly, A., Jones, M., and Burke, J. (2005). The effect of elevated levels of carbon dioxide on potato crops: a review. J. Crop Improv. 13, 91–111. doi: 10.1300/J411v13n01_06
Fleisher, D. H., Condori, B., Quiroz, R., Alva, A., Asseng, S., Barreda, C., et al. (2017). A potato model intercomparison across varying climates and productivity levels. Glob. Change Biol. 23, 1258–1281. doi: 10.1111/gcb.13411
Fleisher, D. H., Timlin, D. J., and Reddy, V. (2008). Elevated carbon dioxide and water stress effects on potato canopy gas exchange, water use, and productivity. Agric. For. Meteorol. 148, 1109–1122. doi: 10.1016/j.agrformet.2008.02.007
Flynn, H. C., Smith, J., Smith, K. A., Wright, J., Smith, P., and Massheder, J. (2005). Climate-and crop-responsive emission factors significantly alter estimates of current and future nitrous oxide emissions from fertiliser use. Glob. Change Biol. 11, 1522–1536. doi: 10.1111/j.1365-2486.2005.00998.x
Foley, J. A. (2011). Can we feed the world sustain the planet? Sci. Am. 305, 60–65. doi: 10.1038/scientificamerican1111-60
Frieler, K., Lange, S., Piontek, F., Reyer, C. P., Schewe, J., Warszawski, L., et al. (2017). Assessing the impacts of 1.5 C global warming-simulation protocol of the Inter-Sectoral Impact Model Intercomparison Project (ISIMIP2b). Geosci. Model Dev. doi: 10.5194/gmd-10-4321-2017
Füssel, H.-M. (2007). Adaptation planning for climate change: concepts, assessment approaches, and key lessons. Sustain. Sci. 2, 265–275. doi: 10.1007/s11625-007-0032-y
GDAL/OGR contributors (2019). GDAL/OGR Geospatial Data Abstraction Software Library. Open Source Geospatial Foundation.
Haile-Mariam, S., Collins, H., and Higgins, S. (2008). Greenhouse gas fluxes from an irrigated sweet corn (Zea mays L.)-potato (Solanum tuberosum L.) rotation. J. Environ. Qual. 37, 759–771. doi: 10.2134/jeq2007.0400
Hansen, J., and Jones, J. (2000). Scaling-up crop models for climate variability applications. Agric. Syst. 65, 43–72. doi: 10.1016/S0308-521X(00)00025-1
Haverkort, A., Franke, A., Engelbrecht, F., and Steyn, J. (2013). Climate change and potato production in contrasting South African agro-ecosystems 1. Effects on land and water use efficiencies. Potato Res. 56, 31–50. doi: 10.1007/s11540-013-9230-4
Haverkort, A. J., Uenk, D., Veroude, H., and Van De Waart, M. (1991). Relationships between ground cover, intercepted solar radiation, leaf area index and infrared reflectance of potato crops. Potato Res. 34, 113–121. doi: 10.1007/BF02358105
Hempel, S., Frieler, K., Warszawski, L., Schewe, J., and Piontek, F. (2013). A trend-preserving bias correction - the ISI-MIP approach. Earth Syst. Dyn. Discuss. 4, 49–92. doi: 10.5194/esdd-4-49-2013
Hijmans, R. J. (2003). The effect of climate change on global potato production. Am. J. Potato Res. 80, 271–279. doi: 10.1007/BF02855363
Högy, P., and Fangmeier, A. (2009). Atmospheric CO2 enrichment affects potatoes: 2. Tuber quality traits. Eur. J. Agron. 30, 85–94. doi: 10.1016/j.eja.2008.07.006
Ingram, K. T., and McCloud, D. E. (1984). Simulation of potato crop growth and development. Crop Sci. 24:21. doi: 10.2135/cropsci1984.0011183X002400010006x
Iwama, K., Hukushima, T., Yoshimura, T., and Nakaseko, K. (1993). Influence of planting density on root growth and yield in potato. Jpn. J. Crop Sci. 62, 628–635. doi: 10.1626/jcs.62.628
Jagtap, S. S., and Jones, J. W. (2002). Adaptation and evaluation of the CROPGRO-soybean model to predict regional yield and production. Agric. Ecosyst. Environ. 93, 73–85. doi: 10.1016/S0167-8809(01)00358-9
Jamieson, P., Porter, J., Goudriaan, J., Ritchie, J., Van Keulen, H., and W. Stol. (1998). A comparison of the models AFRCWHEAT2, CERES-Wheat, Sirius, SUCROS2 and SWHEAT with measurements from wheat grown under drought. Field Crops Res. 55, 23–44. doi: 10.1016/S0378-4290(97)00060-9
Jefferies, R. (1993). Use of a simulation model to assess possible strategies of drought tolerance in potato (Solanum tuberosum L.). Agric. Syst. 41, 93–104. doi: 10.1016/0308-521X(93)90083-E
Jefferies, R., and MacKerron, D. (1989). Radiation interception and growth of irrigated and droughted potato (Solanum tuberosum). Field Crops Res (Cambirdge: Cambridge University Press). 22, 101–112. doi: 10.1016/0378-4290(89)90061-0
Jefferies, R. A., and Mackerron, D. K. L. (1987). Thermal Time as a Non-Destructive Method of Estimating Tuber Initiation in Potatoes, 249–252. doi: 10.1017/S0021859600064339
Jones, J. L., and Allen, E. J. (1983). Effects of date of planting on plant emergence, leaf growth, and yield in contrasting potato varieties. J. Agric. Sci. 101, 81–95. doi: 10.1017/S002185960003639X
Jongschaap, R. E. E., and Booij, R. (2004). Spectral measurements at different spatial scales in potato: relating leaf, plant and canopy nitrogen status. Int. J. Appl. Earth Observ. Geoinform. 5, 205–218. doi: 10.1016/j.jag.2004.03.002
Kaminski, K. P., Kørup, K., Kristensen, K., Nielsen, K., Liu, F., Topbjerg, H. B., et al. (2015). Contrasting Water-Use Efficiency (WUE) responses of a potato mapping population and capability of modified ball-berry model to predict stomatal conductance and WUE measured at different environmental conditions. J. Agron. Crop Sci. 201, 81–94. doi: 10.1111/jac.12091
Khurana, S., and McLaren, J. (1982). The influence of leaf area, light interception and season on potato growth and yield. Potato Res. 25, 329–342. doi: 10.1007/BF02357290
Kimball, B. A. (2016). Crop responses to elevated CO2 and interactions with H2O, N, and temperature. Curr. Opin. Plant Biol. 31, 36–43. doi: 10.1016/j.pbi.2016.03.006
Koehler, A.-K., Challinor, A. J., Hawkins, E., and Asseng, S. (2013). Influences of increasing temperature on Indian wheat: quantifying limits to predictability. Environ. Res. Lett. 8:034016. doi: 10.1088/1748-9326/8/3/034016
Kooman, P., Fahem, M., Tegera, P., and Haverkort, A. (1996). Effects of climate on different potato genotypes 2. Dry matter allocation and duration of the growth cycle. Eur. J. Agron. 5, 207–217. doi: 10.1016/S1161-0301(96)02032-1
Kumar, S. N., Govindakrishnan, P., Swarooparani, D., Nitin, C., Surabhi, J., and Aggarwal, P. (2015). Assessment of impact of climate change on potato and potential adaptation gains in the Indo-Gangetic Plains of India. Int. J. Plant Prod. 9, 151–170. Available online at: https://hdl.handle.net/10568/76568
Lange, S. (2018). Bias correction of surface downwelling longwave and shortwave radiation for the EWEMBI dataset. Earth Syst. Dyn. 9, 627–645. doi: 10.5194/esd-9-627-2018
Lange, S. (2019). EartH2Observe, WFDEI and ERA-Interim data Merged and Bias-corrected for ISIMIP (EWEMBI). GFZ Data Services.
Lesczynski, D., and Tanner, C. (1976). Seasonal variation of root distribution of irrigated, field-grown Russet Burbank potato. Am. Potato J. 53, 69–78. doi: 10.1007/BF02852656
Li, S. (2008). Investigating the impacts of climate change on wheat in China (Ph.D. thesis). Department of Meteorology, University of Reading, Reading, United Kingdom.
Lipper, L., Thornton, P., Campbell, B. M., Baedeker, T., Braimoh, A., Bwalya, M., et al. (2014). Climate-smart agriculture for food security. Nat. Clim. Change 4, 1068–1072. doi: 10.1038/nclimate2437
Lobell, D. B. (2014). Climate change adaptation in crop production: beware of illusions. Glob. Food Sec. 3, 72–76. doi: 10.1016/j.gfs.2014.05.002
Lundstrom, D. R., and Stegman, E. C. (1988). Irrigation Scheduling by the Checkbook Method (Fargo, ND: North Dakota State University (NDSU) Extension Service).
Lutaladio, N., and Castaldi, L. (2009). Potato: the hidden treasure. J. Food Compos. Anal. 22, 491–493. doi: 10.1016/j.jfca.2009.05.002
Magliulo, V., Bindi, M., and Rana, G. (2003). Water use of irrigated potato (Solanum tuberosum L.) grown under free air carbon dioxide enrichment in central Italy. Agric. Ecosyst. Environ. 97, 65–80. doi: 10.1016/S0167-8809(03)00135-X
Manrique, L. A., and Hodges, T. (1989). Estimation of tuber initiation in potatoes grown in tropical environments based on different methods of computing thermal time. Am. Potato J. 66, 425–436. doi: 10.1007/BF02853188
McSweeney, C. F., and Jones, R. G. (2016). How representative is the spread of climate projections from the 5 CMIP5 GCMs used in ISI-MIP? Clim. Serv. 1, 24–29. doi: 10.1016/j.cliser.2016.02.001
Mendelsohn, R., Morrison, W., Schlesinger, M. E., and Andronova, N. G. (2000). Country-specific market impacts of climate change. Clim. Change 45, 553–569. doi: 10.1023/A:1005598717174
Monteith, J., and Unsworth, M. (2007). Principles of Environmental Physics. New York, NY: Academic Press.
Moore, F. C., and Lobell, D. B. (2014). Adaptation potential of European agriculture in response to climate change. Nat. Clim. Change 4, 1–5. doi: 10.1038/nclimate2228
Moriondo, M., Bindi, M., and Sinclair, T. (2005). Analysis of solanaceae species harvest-organ growth by linear increase in harvest index and harvest-organ growth rate. J. Am. Soc. Hortic. Sci. 130, 799–805. doi: 10.21273/JASHS.130.6.799
Moss, R. H., Edmonds, J. A., Hibbard, K. A., Manning, M. R., Rose, S. K., van Vuuren, D. P., et al. (2010). The next generation of scenarios for climate change research and assessment. Nature 463, 747–56. doi: 10.1038/nature08823
Müller, C., Elliott, J., Chryssanthacopoulos, J., Arneth, A., Balkovic, J., Ciais, P., et al. (2017). Global gridded crop model evaluation: benchmarking, skills, deficiencies and implications. Geosci. Model Dev. 10:1403. doi: 10.5194/gmd-10-1403-2017
Nemecek, T., Weiler, K., Plassmann, K., Schnetzer, J., Gaillard, G., Jefferies, D., et al. (2012). Estimation of the variability in global warming potential of worldwide crop production using a modular extrapolation approach. J. Clean. Prod. 31, 106–117. doi: 10.1016/j.jclepro.2012.03.005
Nicklin, K. J. (2013). Seasonal crop yield forecasting in semi-arid West Africa (Ph.D. Thesis). University of Leeds, Leeds, United Kingdom.
Noda, T., Tsuda, S., Mori, M., Takigawa, S., Matsuura-Endo, C., Saito, K., et al. (2004). The effect of harvest dates on the starch properties of various potato cultivars. Food Chem. 86, 119–125. doi: 10.1016/j.foodchem.2003.09.035
Osborne, T., Rose, G., and Wheeler, T. (2013). Variation in the global-scale impacts of climate change on crop productivity due to climate model uncertainty and adaptation. Agric. For. Meteorol. 170, 183–194. doi: 10.1016/j.agrformet.2012.07.006
Parker, C., Carr, M., Jarvis, N., Evans, M., and Lee, V. (1989). Effects of subsoil loosening and irrigation on soil physical properties, root distribution and water uptake of potatoes (Solanum tuberosum). Soil Till. Res. 13, 267–285. doi: 10.1016/0167-1987(89)90003-2
Paula, F. L. M., Streck, N. A., Heldwein, A. B., Bisognin, D. A., Paula, A. L., and Dellai, J. (2005). Thermal time of some developmental phases in potato (Solanum tuberosum L.). Ciência Rural 35, 1034–1042. doi: 10.1590/S0103-84782005000500008
Porter, J. R., Xie, L., Challinor, A. J., Cochrane, K., Howden, S. M., Iqbal, M. M., et al. (2014). “Food security and food production systems,” in Climate Change 2014: Impacts, Adaptation, and Vulnerability. Part A: Global and Sectoral Aspects. Contribution of Working Group II to the Fifth Assessment Report of the Intergovernmental Panel on Climate Change, eds C. B. Field, V. R. Barros, D. J. Dokken, K. J. Mach, M. D. Mastrandrea, T. E. Bilir, M. Chatterjee, K. L. Ebi, Y. O. Estrada, R. C. Genova, B. Girma, E. S. Kissel, A. N. Levy, S. MacCracken, P. R. Mastrandrea, and L. L. White (Cambridge; New York, NY: IPCC; Cambridge University Press), 485–533.
Portmann, F., Siebert, S., and Döll, P. (2010). MIRCA2000 - Global monthly irrigated and rainfed crop areas around the year 2000: a new high-resolution data set for agricultural and hydrological modeling. Glob. Biogeochem. Cycles 1:24. doi: 10.1029/2008GB003435
Priestley, C. H. B., and Taylor, R. J. (1972). On the assessment of surface heat flux and evaporation using large-scale parameters. Month. Weath. Rev. 100, 81–92. doi: 10.1175/1520-0493(1972)100<0081:OTAOSH>2.3.CO;2
R Core Team (2017). R: A Language and Environment for Statistical Computing. Vienna: R Foundation for Statistical Computing.
Raymundo, R., Asseng, S., Prassad, R., Kleinwechter, U., Concha, J., Condori, B., et al. (2017). Performance of the SUBSTOR-potato model across contrasting growing conditions. Field Crops Res. 202, 57–76. doi: 10.1016/j.fcr.2016.04.012
Raymundo, R., Asseng, S., Robertson, R., Petsakos, A., Hoogenboom, G., Quiroz, R., et al. (2018). Climate change impact on global potato production. Eur. J. Agron. 100, 87–98. doi: 10.1016/j.eja.2017.11.008
Rose, G., Osborne, T., Greatrex, H., and Wheeler, T. (2016). Impact of progressive global warming on the global-scale yield of maize and soybean. Clim. Change 134, 417–428. doi: 10.1007/s10584-016-1601-9
Rosenzweig, C., Elliott, J., Deryng, D., Ruane, A. C., Müller, C., Arneth, A., et al. (2014). Assessing agricultural risks of climate change in the 21st century in a global gridded crop model intercomparison. Proc. Natl. Acad. Sci. U.S.A. 111, 3268–3273. doi: 10.1073/pnas.1222463110
Sacks, W. J., Deryng, D., Foley, J. A., and Ramankutty, N. (2010). Crop planting dates: an analysis of global patterns. Glob. Ecol. Biogeogr. 19, 607–620. doi: 10.1111/j.1466-8238.2010.00551.x
Sands, P., Hackett, C., and Nix, H. (1979). A model of the development and bulking of potatoes (Solanum tuberosum L.) I. Derivation from well-managed field crops. Field Crops Res. 2, 309–331. doi: 10.1016/0378-4290(79)90031-5
Saxton, K., Rawls, W., Romberger, J., and Papendick, R. (1986). Estimating generalized soil-water characteristics from texture. Soil Sci. Soc. Am. J. 50, 1031–1036. doi: 10.2136/sssaj1986.03615995005000040039x
Schafleitner, R., Ramirez, J., Jarvis, A., Evers, D., Gutierrez, R., and Scurrah, M. (2011). “Adaptation of the potato crop to changing climates,” in Crop Adaptation to Climate Change, eds S. S. Yadav, R. J. Redden, J. L. Hatfield, H. Lotze-Campen, A. J. W. Hall (Chichester: Wiley-Blackwell), 287–297.
Schneider, S. H., Easterling, W. E., and Mearns, L. O. (2000). “Adaptation: sensitivity to natural variability, agent assumptions and dynamic climate changes,” in Societal Adaptation to Climate Variability and Change, eds S. M. Kane and G. W. Yohe (Dordrecht: Springer). doi: 10.1007/978-94-017-3010-5_11
Shangguan, W., Dai, Y., Duan, Q., Liu, B., and Yuan, H. (2014). A global soil data set for earth system modeling. J. Adv. Model. Earth Syst. 6, 249–263. doi: 10.1002/2013MS000293
Smit, A. L., and Groenwold, J. (2005). Root characteristics of selected field crops: data from the Wageningen Rhizolab (1990-2002). Plant Soil 272, 365–384. doi: 10.1007/s11104-004-5979-1
Stackhouse, P. W. (2011). Surface Meteorology and Solar Energy. Atmospheric Science Data Center, NASA.
Stalham, M., and Allen, E. (2001). Effect of variety, irrigation regime and planting date on depth, rate, duration and density of root growth in the potato (Solanum tuberosum) crop. J. Agric. Sci. 137, 251–270. doi: 10.1017/S0021859601001332
Steiner, J. L., Howell, T. A., and Schneider, A. D. (1991). Lysimetric evaluation of daily potential evapotranspiration models for grain sorghum. Agron. J. 83, 240–247. doi: 10.2134/agronj1991.00021962008300010055x
Streck, N. A., de Paula, F. L. M., Bisognin, D. A., Heldwein, A. B., and Dellai, J. (2007). Simulating the development of field grown potato (Solanum tuberosum L.). Agric. For. Meteorol. 142, 1–11. doi: 10.1016/j.agrformet.2006.09.012
Tanner, C. (1981). Transpiration efficiency of potato. Agron. J. 73, 59–64. doi: 10.2134/agronj1981.00021962007300010014x
Tanner, C., and Jury, W. (1976). Estimating evaporation and transpiration from a row crop during incomplete cover 1. Agron. J. 68, 239–243. doi: 10.2134/agronj1976.00021962006800020007x
Tanner, C., and Sinclair, T. (1983). “Efficient water use in crop production: research or re-search?” in Limitations to Efficient Water Use in Crop Production, eds H. M. Taylor, W. R. Jordan, and T. R. Sinclair (Madison, WI: American Society of Agronomy), 1–27. doi: 10.2134/1983.limitationstoefficientwateruse.c1
Timlin, D., Rahman, S. M. L., Baker, J., Reddy, V. R., Fleisher, D., and Quebedeaux, B. (2006). Whole plant photosynthesis, development, and carbon partitioning in potato as a function of temperature. Agron. J. 98, 1195–1203. doi: 10.2134/agronj2005.0260
Tubiello, F., Rosenzweig, C., Goldberg, R., Jagtap, S., and Jones, J. (2002). Effects of climate change on US crop production: simulation results using two different GCM scenarios. Part I: wheat, potato, maize, and citrus. Clim. Res. 20, 259–270. doi: 10.3354/cr020259
Van Keulen, H., and Stol, W.. (1995). “Agro-ecological zonation for potato production,” in Potato Ecology and Modelling of Crops Under Conditions Limiting Growth. Current Issues in Production Ecology, Vol. 3, eds A. J. Haverkort and D. K. L. MacKerron (Dordrecht: Springer), 357–371. doi: 10.1007/978-94-011-0051-9_23
Vorne, V., Ojanperä, K., De Temmerman, L., Bindi, M., Högy, P., Jones, M., et al. (2002). Effects of elevated carbon dioxide and ozone on potato tuber quality in the European multiple-site experiment 'CHIP-project'. Eur. J. Agron. 17, 369–381. doi: 10.1016/S1161-0301(02)00072-2
Vos, J., and Biemond, H. (1992). Effects of nitrogen on the development and growth of the potato plant. 1. Leaf appearance, expansion growth, life spans of leaves and stem branching. Ann. Bot. 70, 27–35. doi: 10.1093/oxfordjournals.aob.a088435
Vos, J., and Groenwold, J. (1989). Genetic differences in water-use efficiency, stomatal conductance and carbon isotope fractionation in potato. Potato Res. 32, 113–121. doi: 10.1007/BF02358219
Weedon, G. P., Balsamo, G., Bellouin, N., Gomes, S., Best, M. J., and Viterbo, P. (2014). The WFDEI meteorological forcing data set: WATCH Forcing Data methodology applied to ERA-Interim reanalysis data. Water Resour. Res. 50, 7505–7514. doi: 10.1002/2014WR015638
Whitfield, S., Challinor, A. J., and Rees, R. M. (2018). Frontiers in climate smart food systems: outlining the research space. Front. Sustain. Food Syst. 2:2. doi: 10.3389/fsufs.2018.00075
Wilcockson, S., Allen, E., Scott, R., and Wurr, D. (1985). Effects of crop husbandry and growing conditions on storage losses of pentland crown potatoes. J. Agric. Sci. 105, 413–435. doi: 10.1017/S0021859600056471
Wolf, S., Marani, A., and Rudich, J. (1990). Effects of temperature and photoperiod on assimilate partitioning in potato plants. Ann. Bot. 66, 513–520. doi: 10.1093/oxfordjournals.aob.a088060
Zhao, J., Zhan, X., Jiang, Y., and Xu, J. (2018). Variations in climatic suitability and planting regionalization for potato in northern China under climate change. PLoS ONE 13:e0203538. doi: 10.1371/journal.pone.0203538
Keywords: adaptation, climate change, climate smart agriculture (CSA), yields, potato
Citation: Jennings SA, Koehler A-K, Nicklin KJ, Deva C, Sait SM and Challinor AJ (2020) Global Potato Yields Increase Under Climate Change With Adaptation and CO2 Fertilisation. Front. Sustain. Food Syst. 4:519324. doi: 10.3389/fsufs.2020.519324
Received: 11 December 2019; Accepted: 04 November 2020;
Published: 15 December 2020.
Edited by:
Jan Verhagen, Wageningen University and Research, NetherlandsReviewed by:
Pytrik Reidsma, Wageningen University and Research, NetherlandsLibère Nkurunziza, Swedish University of Agricultural Sciences, Sweden
Copyright © 2020 Jennings, Koehler, Nicklin, Deva, Sait and Challinor. This is an open-access article distributed under the terms of the Creative Commons Attribution License (CC BY). The use, distribution or reproduction in other forums is permitted, provided the original author(s) and the copyright owner(s) are credited and that the original publication in this journal is cited, in accordance with accepted academic practice. No use, distribution or reproduction is permitted which does not comply with these terms.
*Correspondence: Stewart A. Jennings, cy5hLmplbm5pbmdzQGxlZWRzLmFjLnVr