 Kamaljit Banger
 Joshua Nasielski
 Ken Janovicek
 Bill Deen
- Plant Agriculture, University of Guelph, Guelph, ON, Canada
Corn yield response to nitrogen (N) rates typically follows a flat plateau polynomial function with a relatively “flat” region on either side of the Economically Optimum N Rate (EONR). This flat region indicates that a wide range of N rates can approximate the maximum returns achieved at the EONR. To avoid yield penalties due to N stress, farmers tend to over- apply N which results in complex tension between farmers and other stakeholder groups. Using 10-years field data (2009–2018) from Elora, Ontario, we estimated the magnitude of cost to farmers if optimal N rate is based on both economic and environmental costs, and assessed whether incorporating environmental costs into optimum N rate increases profit variability. A cropping system model (DeNitrification and Decomposition model, DNDC) was calibrated and validated for corn yield and environmental N losses against five N rates (30, 58, 87, 145, and 218 kg N ha−1) during 2009–2018. Our results suggest that N rates could vary by 46–91 kg N ha−1 around the EONR without reducing profits substantially (<$25 ha−1 of maximum profits) during 2009–2018. When environmental costs were accounted for, environmentally optimal N rate was reduced by 11–54 kg N ha−1 (7–31% of EONR) with maximum reductions in N rates occurred in an extremely dry (2012) year. With conservative estimates of the environmental costs of N loss, our study suggests that the environmental benefits accrued at environmentally optimal N rates are 2–4-folds' greater than the reduction in net farmer income. This indicates that the environmental returns to policies which compensate farmers for applying environmentally optimal N are large. Results of this study further suggest that farmers need to adjust N rates depending on the weather in a growing season.
Introduction
Improving nitrogen (N) management in the North American corn belt is essential for increasing food production and reducing environmental degradation (Frink et al., 1999; Ladha et al., 2005; Ewing and Runck, 2015). In corn production, <50% of applied N is used by the growing crop thus leaving a remainder vulnerable to loss through leaching or gaseous pathways (Cassman et al., 2002). For instance, excessive N leaching from fields makes groundwater unfit for human consumption and causes eutrophication in streams, lakes, and coastal oceans (Howarth and Marino, 2006; Anderson et al., 2008; Dodds et al., 2009). Fertilizers are responsible for nitrous oxide (N2O) emissions, which is a potent greenhouse gas and also plays an important role in stratospheric ozone depletion (IPCC, 2014). Therefore, N management must address the twin challenges that under- N application results in yield penalties while over- application above crop needs causes environmental degradation and unnecessary economic losses.
Currently, farm-level N fertilizer application decisions are primarily driven by crop yields and farm profits, not environmental concerns (Sawyer et al., 2006; N-Calculator, 2020). The Economically Optimal N Rate (EONR), commonly used to estimate N application rates is defined as the N rate where a unit of fertilizer N provides a yield increase equal in value to the cost of the N fertilizer (Sawyer et al., 2006; Morris et al., 2018). While the yield response to N function used to derive EONR implicitly considers crop N demand, soil N supply, and N losses to the environment, EONR estimation does not explicitly considers environmental costs associated with N loss. Conversion of yield response and N fertilizer rate into an economic profit response results in a relationship typically represented by a polynomial function with a relatively “flat” region on either side of the EONR (Rajsic and Weersink, 2008; Cabas et al., 2010). The existence of a flat profit response suggests that actual N rate can deviate above or below the EONR without significantly impacting profitability (Pannell, 2006). The existence of a flat payoff response has two implications for N fertilizer management decisions. Firstly, even though EONR is highly variable (Sogbedji et al., 2001; Derby et al., 2004; Tremblay et al., 2012; Dhital and Raun, 2016), farmers have limited economic incentives to invest in new technologies aimed at more accurately estimating EONR (Liu et al., 2006). Secondly, given the similar economic risks of under-application vs. over-application of N fertilizer relative to EONR, farmers opt for over-application (Rajsic and Weersink, 2008), and, as a result, increase environmental risks whilst also missing an opportunity to realize economic gains. Farmer tendency to over apply relative to EONR results in a complex tension between farmers and other stakeholder groups (Ewing and Runck, 2015). For instance, in Central Iowa and Southern Minnesota, US, corn yields are very high due to better agronomic management and particularly due to high N rates (NAAS, 2015). At the same time, urban residents of this region may pay more than US$4.00 per 1,000 gallons of water so that local water supplies meet U.S. Environmental Protection Agency standards of 10 mg of nitrate-N () per liter (Powlson et al., 2008). Thus, farmers often feel a social responsibility to adjust N rates and reduce environmental degradation.
Canadian corn production is concentrated in the humid areas of eastern Canada, where monthly precipitation is relatively evenly distributed across the growing season. As such, N losses are possible during both the growing and non-growing season. For example, gaseous N losses such as ammonia volatilization and N2O emissions accounted for 65 kg N ha−1 in the broadcast and 27 kg N ha−1 in the injected fertilizer management scenarios when total N rate was 148 kg N ha−1 (Drury et al., 2017). At provincial scale in Ontario, Drury et al. (2007) estimated that residual soil N remaining in soil at the end of growing season during 1986–2001 was 30–36 kg N ha−1, most of which is potentially leachable during the fall, winter and early spring prior to planting (Drury et al., 2007). As such, there is normally little residual fertilizer N available for subsequent crops, and fall application of N fertilizer is rare in part due to the high potential of N losses. Commonly in Ontario, N is applied to corn fields as urea and incorporated via some form of tillage prior to planting in the spring. Often, some N (30 kg N ha−1 or less) is also applied close to the seed trench during planting, a practice colloquially called “starter” fertilization because this N is positionally available to corn roots as the crops starts growing. Rather than applying the majority of N pre-plant, a growing proportion of Ontario farmers apply N in-season, typically as liquid urea ammonium nitrate that is either injected in the soil profile or streamed onto the soil surface.
However, existing Decision Support Systems (DSS) in the Northern Corn Belt do not currently account for environmental costs associated with N losses due to fertilizer management (Banger et al., 2017). Recently, Morris et al. (2018) highlighted this inability to account for environmental costs as one of the important limitation of existing N management DSS in the US Corn Belt. Some private sector tools such as Adapt-N, Climate FieldView, and Encirca estimate different N loss pathways in response to fertilizer management (Sela et al., 2016; FieldView, 2019) but they only consider N losses to enable estimation of N fertilizer replacement costs. In order to achieve economic profits and ecosystem sustainability, it is critical to account for the ecosystem services hampered by different N loss pathways from a field (Banger et al., 2017). Several researchers have estimated the damages to different ecosystem services per unit of N loss in terms of economic cost (Birch et al., 2011; Compton et al., 2011; Sobota et al., 2015). Accounting for both economic and environmental costs in the DSS could encourage collaborations between farmers and other stakeholders such as municipalities, provincial, and federal regulatory agencies to form practical strategies for overall ecosystem sustainability. Moreover, as long as an “environmentally” optimal N rate is within the range of the flat payoff response around (i.e., above and below) the EONR, incorporating environmental costs may result in only trivial reductions in net farm-level returns.
To develop new N management DSS and facilitate collaboration avenues between farmers and other stakeholders, we estimated EONR and assessed environmental losses in a 10-yr continuous corn experiment in Ontario, Canada. We assessed the magnitude and year to year variations in the environmental cost in response to N rates in Canadian corn production. Therefore, the objectives of this study were to (1) estimate the magnitude of cost to farmers if economic and environmental costs are included into a “environmentally optimal” N rate; and (2) to assess whether incorporating environmental costs into optimum N rate increases profit variability.
Methods
The field experiment was located in Elora, Ontario (43°38'31.1” N 80°24'14.8” W) in a tile drained continuous corn system. The soil was silt loam (Albic fluvisol, WRB 2006) with pH of 7.7, in which sand, silt, clay, and soil organic carbon were 32, 48, 20, and 4.5%, respectively. During the study period (2009–2018), the field was managed with fall moldboard plow and spring secondary tillage prior to planting. Approximately, 79,000 plants ha−1 maize hybrids (DKC 39-97) seeds were planted on 0.76 m row spacing. Both potassium and phosphorus were applied in the fall prior to plowing, with rates based on provincial soil test recommendations. At planting, 30 kg N ha−1 fertilizer (15-15-15-2Zn) was applied in bands 5 cm beside and 5 cm below the seed. Main plots were split into individual treatment plots (82 m2) and received one of five N rates as urea ammonium nitrate (UAN) side-dressed at the V6 growth stage (Abendroth et al., 2011) at 7 cm soil depth in the center of the rows at 0, 28, 57, 115, and 188 kg N ha−1. In this way, total N rate was of 30 kg N ha−1 (N1), 57 kg N ha−1 (N2), 87 kg N ha−1 (N3), 145 kg N ha−1 (N4), 218 kg N ha−1 (N5). In general, a consistent N rate application over a long-term can result in strong legacy effects, which may pose difficulties in estimating N rate at EONR. To avoid legacy effects, the five N rate treatments were constantly randomized from year-to year, and every 2nd year was a “reset year”' when treatment plots receive a uniform N application of 145 kg N ha−1 (Table 1). For analysis of N rate effects on yield and EONR, we did not use 145 kg N ha−1 (legacy treatment) after every N rate treatment. In N rate treatments, corn yield, aboveground N uptake, and soil N concentration was recorded each year from all treatments. Further details on the data collection protocols can be obtained from previous publications (Nasielski et al., 2020).
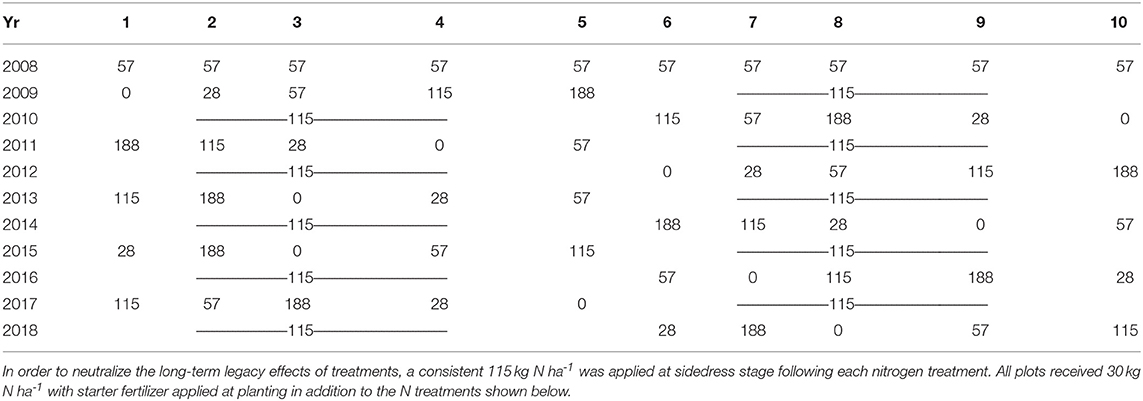
Table 1. Experimental design for assessing the effects of nitrogen rate on corn yield and environmental losses during 2009–2018.
In this study, we used a well-calibrated and validated cropping system model (DeNitrification Decomposition, DNDC v. CAN, version 9.5). During 10-yr time period, DNDC model has been calibrated and validated for local conditions for corn yield, N2O emissions, and leaching losses by previous researchers (Abalos et al., 2016b; Congreves et al., 2016a; Jarecki et al., 2018; Nasielski et al., 2020) A detailed description of the model subcomponents and design can be found in previous publications (Kroebel et al., 2011; Smith et al., 2013; Abalos et al., 2016a; Congreves et al., 2016b; Dutta et al., 2016; Banger et al., 2020). In brief, the model input datasets were developed for Elora experimental research station. Daily weather data (maximum and minimum temperature, solar radiation, precipitation, wind speed, humidity) were obtained from the weather station maintained by Environment Canada on the research station. To initialize the model, a 10-year spin up corn-soy-barley rotation was run prior to the analyzed simulations using actual weather data (1999–2008) collected on-station, to stabilize C:N dynamics of the cropping system. The simulation process was continuous, with the 10 years simulated sequentially without annual reset. The actual dates of planting, harvest, tillage, and fertilization from the field experiment were used in the model for every year, and the “reset year” was simulated but not included in the analysis. Overall, 50 simulations were performed (five N rate treatments for 10 years). In this study, validated version of DNDC was used to assess the impact of five N rate treatments [N1, N2, N3, N4, and N5] yield and N loss pathways in 10 simulated years (2009–2018). Over a 10-yr period, the DNDC estimated daily environmental N losses (N2O and NOx gas emissions, leaching and NH3 volatilization) were aggregated to the crop year period (time period from May 1 to 30 April).
For three N loss pathways, we used literature values for environmental costs (Table S1). Sobota et al. (2015) reviewed potential damage costs of N ($/kg N) to air, land, and water resources in the US in the early 2000s. All the specific environmental costs were divided into three categories (low, median, and high). For leaching included damages to eutrophication and colon cancer. For ammonia volatilization, we used respiratory diseases, changes in carbon sequestration, and loss of biodiversity (Table S1). We used only three environmental damages due to N2O emissions including greenhouse effect, UV exposure to crops, and UV exposure to humans. Our environmental costs for individual N loss pathways were obtained from Europe and the US, particularly in the Chesapeake Bay watershed (Dodds et al., 2009; Birch et al., 2011; Van Grinsven et al., 2013; Sobota et al., 2015). Given that environmental, recreational, and health costs of N contamination may differ in Canadian ecosystems, we provided conservative estimations for environmental costs associated with N loss pathways. For example, we excluded several environmental costs which were less meaningful for Ontario corn production such as the damages to the coastal ecosystems (Compton et al., 2011). Additionally, we used a low potential environmental cost category for all the N loss pathways (Sobota et al., 2015). While environmental costs of N losses are thus only rough approximations for Ontario corn production, the goals of our study were to highlight twin challenges and identify some policy solutions for reducing environmental degradation while maintaining or improving crop yields.
In this study, EONR was estimated based on the corn yield in five N rates used in the DNDC simulations. We used 10-yr average prices for corn (OMAFRA, 2019) and fertilizer (McEwan, 2019) to estimate EONR. Quadratic plateau yield response to N curves were fitted using the nlin procedure of SAS version 9.4. Constraints were imposed such that the fitted linear coefficient is ≥0 and the fitted quadratic coefficient is ≤0. These constraints force the fitting of a non-response (plateau) starting at the lowest N rate for cases with an overall tendency for decreasing yields with increasing N rates or a positive linear response for cases that have accelerating rates of yield response with increasing N rates.
To estimate EONRenv, firstly we calculated the environmental cost associated with three N loss pathways for every unit of N applied. After N cost returns were calculated on a 1 kg N ha−1 interval as the difference of the monetary value of corn yield estimated from the quadratic-plateau response equations and the monetary cost of fertilizer N applied. After N cost returns including environmental costs were calculated by also subtracting the monetary environmental N costs estimated on the same 1 kg N ha−1 intervals. Yearly estimates for ENOR and ENORenv occurred at the N rates that maximize these 2 after N cost responses each year. In this way, EONR is the maximum economic N rate that takes into account corn price and fertilizer N cost but not environmental costs while EONRenv takes into account corn price, N cost as well as environmental costs.
In this study, we used a two-way analysis of variance without replications (ANOVA) to test if two factors including N rate (N1, N2, N3, N4, and N5) and year (10 years from 2009 to 2018) were significantly different. Corn yield, N loss, and environmental cost variables were evaluated at five N rates during 2009–2018. ANOVA test if results are significant overall, but it does not identify where those differences in group means exist. To identify which specific group's means are different, we used Tukey's Honest Significant Difference (HSD) test (Tukey, 1991). This post-hoc test identifies pairwise differences among all possible sample means. In this study, we have identified differences between five N rates and 10 yrs at p < 0.05 level of significance.
Results
Corn Yield and Environmental Nitrogen Losses
Across the 10-yr period, corn yield ranged from 3.6 to 11.5 Mg ha−1 in five N rate treatments (Figure 1). In N1, corn yield remained below 4.74 Mg ha−1 which increased significantly (p < 0.05) in N2 (5.2–6.5 Mg ha−1), N3 (6.9–7.3 Mg ha−1), and N4 and N5 (7.4–11.5 Mg ha−1). Corn yields in N4 and N5 were not statistically different during 2009–2018. When the three DNDC estimated N loss pathways ( leaching, ammonia volatilization, and N2O emissions) were aggregated, total N loss varied from 3.9 kg to 56.5 kg N ha−1 across the treatments during 2009–2018 (Figure 2). Unlike corn yield, environmental N loss was statistically similar in N1, N2, and N3 (3.9–16.4 kg N ha−1) which increased substantially once fertilizer N rate exceeded 87 kg N ha−1 across the years. For instance, N loss was significantly (p < 0.05) greater in the N5 (33.8–56.5 kg N ha−1) followed by N4 (12.8–29.6 kg N ha−1) than N1, N2, and N3 treatments (3.9–16.4 kg N ha−1). The model predicted that the years with extreme dry (2012) and extreme wet (2013) growing season had relatively higher environmental N loss than other years (Figure S1).
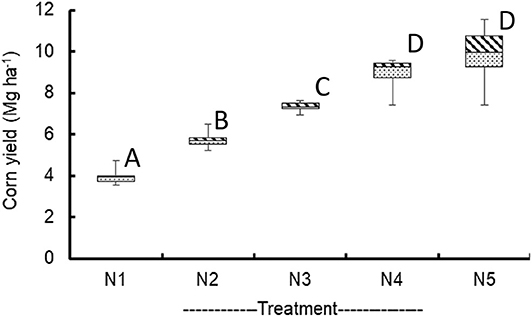
Figure 1. Crop yield in the five nitrogen rate treatments during 2009–2018. In all the treatments, 30 kg N ha−1 was applied at planting and rest was sidedressed in the growing season. Total N rates in five treatments were as follows: N1: 30 kg N ha−1; N2: 57 kg N ha−1; N3: 87 kg N ha−1; N4: 145 kg N ha−1; N5: 218 kg N ha−1. Treatments indicated by letters are significantly different from each other with a p-value of 0.05 based on a Tukey HSD (Honestly Significant Difference).
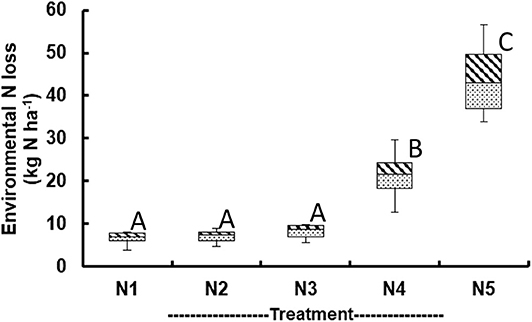
Figure 2. DNDC estimated environmental nitrogen loss (kg N ha−1) from corn production. In the treatments, 30 kg N ha−1 was applied at planting and rest was sidedressed in the growing season. Total N rates in five treatments were as follows: N1: 30 kg N ha−1; N2: 57 kg N ha−1; N3: 87 kg N ha−1; N4: 145 kg N ha−1; N5: 218 kg N ha−1. Treatments indicated by letters are significantly different from each other with a p-value of 0.05 based on a Tukey HSD (Honestly Significant Difference).
DNDC simulated leaching accounted for 44–89% of total N loss in the five N treatments over the 10-yr study period (Figure 3A). Although the magnitude of leaching, ammonia volatilization, and N2O emissions increased with N rate (Figure S2), their relative proportions to total N loss changed substantially. For instance, the contribution of leaching to total N loss was greater in N1, N2, N3 (79–89% of total N loss) and decreased substantially in N4 and N5 (44–45% of total N loss). This occurred because of disproportionally greater increase in ammonia volatilization than leaching due to increase N rates. For instance, ammonia volatilization losses were 0 in N1 and increased to 50–53% of total N loss in N4 and N5. Ten-yr average N2O emissions were smaller (4–11% of total N loss) than leaching and ammonia volatilization losses during 2009–2018. Environmental cost associated with the leaching, ammonia volatilization, and N2O emissions was significantly (p < 0.05) greater in N5 ($152–353 ha−1) followed by N4 ($88–201 ha−1) than other treatments ($41–160 ha−1) during 2009–2018 (Figure 3B).
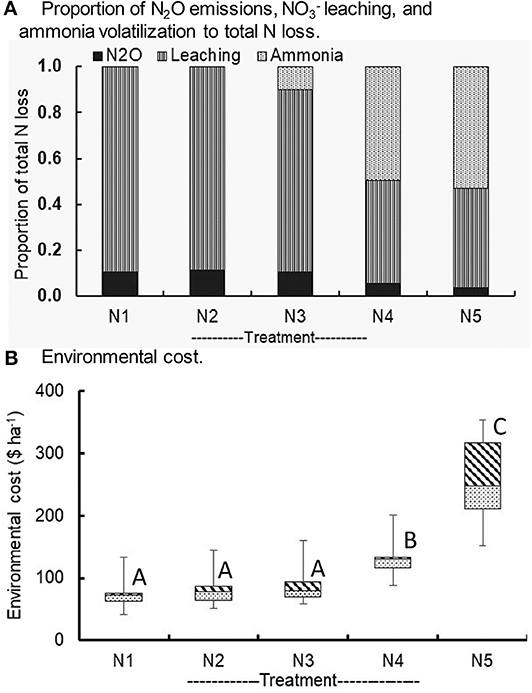
Figure 3. Ten-yr average proportion of three nitrogen loss pathways (N2O emissions, leaching, and ammonia volatilization) and their environmental costs. In the treatments, 30 kg N ha−1 was applied at planting and rest was sidedressed in the growing season. Total N rates in five treatments were as follows: N1: 30 kg N ha−1; N2: 57 kg N ha−1; N3: 87 kg N ha−1; N4: 145 kg N ha−1; N5: 218 kg N ha−1 Treatments indicated by letters are significantly different from each other with a p-value of 0.05 based on a Tukey HSD (Honestly Significant Difference). (A) Proportion of N20 emissions, leaching, and ammonia volatilization to total N loss. (B) Environmental cost.
Effects of Accounting for Environmental Costs on Corn Yield
Over 10-yrs, EONR varied from 151 to 218 kg N ha−1; averaging 189 kg N ha−1 (Figure 4). In 4 years (2010, 2013, 2014, and 2018), EONR was >189 kg N ha−1, while EONR ranged from 151 to 188 kg N ha−1 in other years. Farm-level profits at EONR ranged from $1,281 to $2,391 ha−1 during the study period. EONR and economic returns were not significantly correlated since the years with greater EONR did not always result in high economic profits (Figure 4). Our results suggest that farmers had a wide range of flexibility in adjusting N rates without significantly reducing economic profits during 2009–2018. For instance, N rate between 122 and 213 kg N ha−1 achieved economic profits within $25 ha−1 of maximum profit range in 2012. In other years, there was a flexibility of adjusting N rates by 46–77 kg N ha−1 from EONR within the economic threshold of $25 ha−1 (Figure 4). The second highest environmental N loss occurred in 2013 (12.5–52.8 kg N ha−1) which had 9–58% higher May-August cumulative rainfall than other years during 2009–2018.
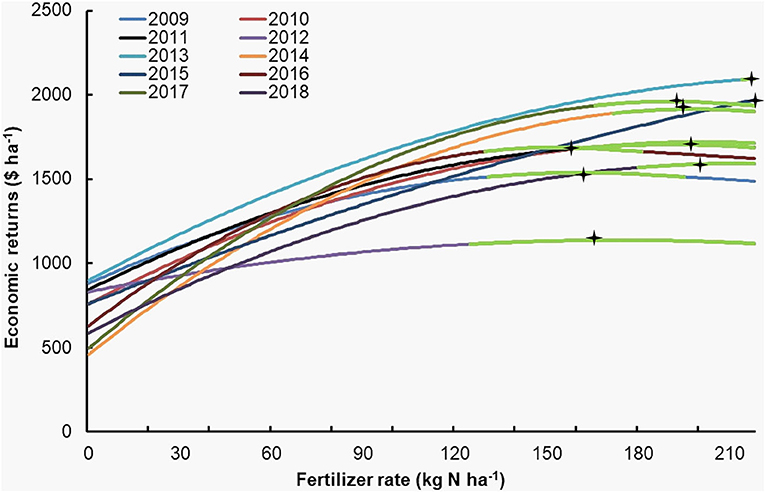
Figure 4. Relationship between net returns to nitrogen costs and nitrogen rates during 2009–2018. The underlying yield responses were fitted using a quadratic-plateau model. After N cost return response was calculated as the value of com estimated from quadratic plateau yield response equations subtract the cost of N required to attain the estimated yield. Green colored line indicates the threshold within 25$ ha−1 of economic profits. Star indicates the maximum economic rate of nitrogen fertilizer.
When environmental cost was incorporated into the estimate of optimal N rate, “environmentally optimal N rate” (EONRenv) ranged from 115 to 192 kg N ha−1, representing a reduction of 11–54 kg N ha−1 relative to EONR (Table 2). The yearly N rate reductions in EONRenv were 7–31% of EONR. The highest reduction in the N-rate occurred in 2012, which received 77% lower May-August cumulative rainfall (498 mm) compared to the 30-yr long-term average (Figure S1). In contrast, the second most reduction in the EONRenv occurred in 2013, which had 9–58% higher May-August cumulative rainfall than other years during 2009–2018. Reduced N rate at EONRenv corresponded with reductions in corn yields. Relative to EONR, corn yields at EONRenv were reduced by 1–7% (Table 2). Reductions in N rate to account for environmental costs, reduced farm level economic profits by 0.4–2.8% (a net reduction of $7–66 ha−1) relative to profits at N rates associated with EONR during 2009–2018. Although farm level economic profits were reduced at EONRenv, the reduction in environmental costs at EONRenv were 2–4-folds greater than the farm level economic losses during 2009–2018 (Table 2).
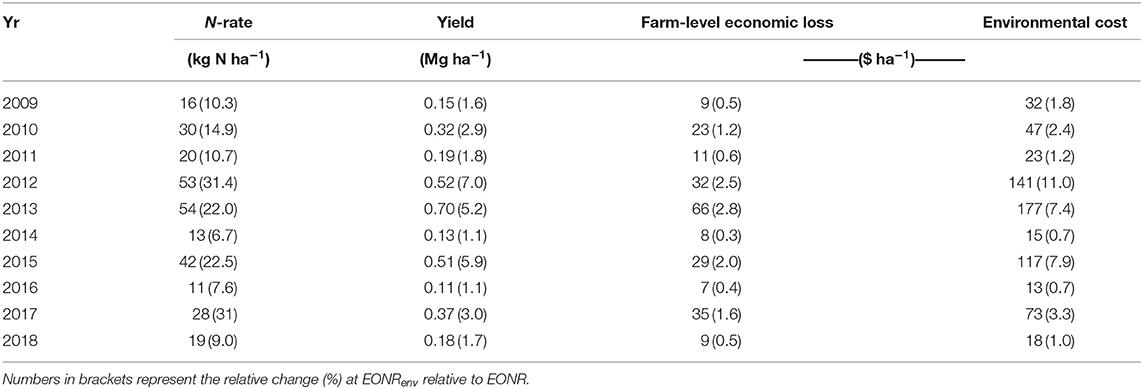
Table 2. Reduction in nitrogen rates, yield, farm level economic loss, and environmental costs at EONRenv relative to EONR.
Discussion
Our results from a 10 year data set where soil type and management were held constant strengthens previous observations that corn N response and resulting EONR is highly variable due to the complex interactions in crop growth, weather variability, and environmental losses (Vetsch and Randall, 2004; Xie et al., 2013; Morris et al., 2018). Although EONR is highly variable our analysis also suggests that failure to apply exactly at EONR has relatively low farm level economic impact in most years. Conversion of N yield responses to profit responses demonstrates that in any given year, N rates can vary substantially from EONR (46–91 kg N ha−1) without significant reductions in farm level economic profits (<$25 ha−1 of maximum economic profits) (Figure 4). These results correspond with other studies demonstrating a flat profit response and limited impact on profit when actual N rate deviates from EONR (Pannell, 2006; Rajsic and Weersink, 2008; Cabas et al., 2010). The uncertainty in EONR across years and existence of flat profit functions within each year has two implications. First, it reduces the incentive for farmers to adopt strategies to identify EONR and apply at that rate. Figure 4 demonstrates that accurate prediction of EONR was not actually required in 9 of 10 years in which a consistent application of 180 kg N ha−1 fell within $25 ha−1 of maximum farm-level profit threshold plateau (Figure 4). Second, as has been shown by Rajsic and Weersink (2008), it may result in farmers having a tendency to over- apply N fertilizers to ensure there is sufficient N for years with unexpectedly high EONR. While farmers respond to the existence of flat profit functions by increasing N rate, other members of society would like to see N rate reduced below EONR to reduce environmental costs associated with N application. To address this twin challenge of simultaneously improving food production and reducing environmental degradation, using a 10-yr corn experiment we estimated an environmentally optimal N rate, EONRenv that accounts for environmental costs of N fertilizer application. To the best of our knowledge, very limited research has been conducted to assess the environmental cost associated with N management in the U.S. (Compton et al., 2011; Sobota et al., 2015), and no such study is available for Canadian corn production. Therefore, it is very difficult to compare the results of this study with previous findings.
Our results suggested when N rate was optimized to also consider environmental costs, N rate reductions of 7–31% (11–54 kg N ha−1) compared to EONR were required (Table 2). As a consequence of these N rate adjustments, environmental costs due to N fertilizer application were reduced by $13–177 ha−1 during 2009–2018. In Iowa and New York, Sela et al. (2016) have shown that Adapt-N estimated N rates were 34% lower (53 and 31 kg ha−1) than farmer applied N rates, which also reduced environmental loss by 38% (28 kg ha−1). In 2004–2008, a sensor based N applications were able to achieve a net reduction of 16 kg N ha−1 compared to grower selected rates in 55 on-farm trials (Scharf et al., 2011). Our research is fundamentally different from these studies. Unlike previous studies which compare improved estimates of N fertilizer application rates against N rates selected by the farmers, we have estimated changes in N rates when environmental costs are accounted as farm inputs. Our study assessed magnitude of cost to farmers if environmentally optimal N rate is based on both economic and environmental costs.
Although reduction in N rates associated with EONRenv had significant environmental benefits, it caused farm-level economic losses ranging from $7 to $66 ha−1 with an average value of $26 ha−1 during 2009–2018 (Table 2). Based on our analysis, incorporation of environmental costs in 4 out of 10 years caused reductions of >$25 ha−1 (Table S2). More importantly, our results suggest that the greatest reductions in farm-level economic profits occurred in an extremely dry and an extremely wet year. For instance, when rainfall in May-August was lower than normal in 2012, EONRenv was 31% lower than EONR (Table 2). On the other hand, EONRenv shifted much below EONR due to greater rainfall in May-August which resulted substantial environmental N losses. It should be noted that our analysis compares farm level costs at EONR to EONRenv. But as was already previously discussed, farmers may have a tendency to over-apply N given the uncertainty in EONR over the years. As a consequence, our analysis may actually overestimate farm level costs of EONRenv. But if farmers do tend to apply above EONR this also means a reduction in environmental costs, as well as yield reductions, associated with EONRenv are underestimated in our analysis.
Using data from a field experiment at Elora, our results suggest that tensions between farmers and other stakeholders are inevitable if EONRenv is. In 4 out of 10 years the farm level cost would not be trivial. These tensions stem from the fundamental differences in the philosophies on how various stakeholders view farm profits and environmental conditions, and their decision making around N use reflects these preferences. From a farmer's standpoint, it is challenging to adopt environmentally optimal N rates as farmers desire to maximize profits (Ewing and Runck, 2015), although it may not be sustainable in the long-term. For policy makers, it is difficult to regulate fertilizer use. Therefore, it is increasingly of policy concern because better management practices (BMPs) are voluntarily adopted by corn growers of North America (Tomer et al., 2013). We believe that positive outcome oriented agricultural policies should engage different stakeholders such as farmers, municipalities, consultants, and policy makers. We have several encouraging examples across the globe where farmers have collaborated with other stakeholders to reduce nutrient pollution in a watershed. For instance, in New Zealand, a community-based audited self-management approach has been successfully implemented. In this context, farmers and regulatory body are working together to improve the quality and quantity of shared local water sources in a watershed (Holley, 2015). Farmers and stakeholders collaborate to assess N carrying capacity and explore ways to achieve a specified environmental goal, while independent third parties verify the goals. Our results have shown that if farmers are compensated for economic losses to adjust N rates, environmental benefits to the society would be 6-fold that of the cost of compensation to farmers (Table 2). The US Department of Agriculture's (USDA) has introduced a practice standard for nutrient management that incentivizes farmers to use an adaptive management approach. In Canada, federal, provincial, and local governments can be involved in the cost sharing of environmental initiatives such as Environmental Farm Plan, Carbon Clean Water Act, and Carbon Credits. Our study highlights that the concept of environmental cost will help set goals in light of political, economic, and social support. It would also involve standardizing methods to estimate environmental costs in Canadian agroecosystems.
The outcome of this research has an imperative implication for developing new N management DSS. In the North American Corn Belt, the majority of the farmers apply fertilizers either before or at planting using a constant N rate (Randall and Schmitt, 1998; IFA, 2013). Our results demonstrate that a constant application of 180 kg N ha−1 was able to achieve economic profits within $25 ha−1 of maximum farm-level profit threshold (Figure 4). When both farm-level economic and environmental costs are considered, we advocate split instead of single fertilizer application so that farmers have flexibility in adjusting N rates based on weather during a growing season. We emphasize that farmers should consider flat profit response curve above which farm-level profits do not accrue rather environmental costs increase substantially (Rajsic and Weersink, 2008). In 6 out of 10 years, EONRenv shifted away from the $25 ha−1 of maximum farm-level profit threshold plateau. It suggests that farm-level economic losses for reducing environmental costs were substantial in 6 of 10 years. Without economic incentives, farmers are not likely to adopt environmentally optimal N rates. Therefore, different stakeholders should work with farmers and explore practical ways to compensate for farm-level economic losses incurred in order to adjust N rates. To help farmers and facilitate engagements between different stakeholders in adjusting N rates, new generation N management DSS must incorporate environmental costs (Banger et al., 2017; Morris et al., 2018). Future studies should focus on developing a DSS which farmers can use to assess environmental tradeoffs associated with N rates in a growing season.
Data Availability Statement
All datasets generated for this study are included in the article/Supplementary Material.
Author Contributions
KB and BD developed the conceptual framework of the manuscript. JN calibrated and validated the model. KJ and JS conducted the analysis. KB, BD, KJ, JN, and JS wrote the manuscript draft. All authors contributed to the article and approved the submitted version.
Funding
This research was undertaken thanks in part to funding from the International Plant Nutrition Institute, the Canada First Research Excellence Fund - Grant #499005, and Grain Farmers of Ontario - Grant #53198.
Conflict of Interest
The authors declare that the research was conducted in the absence of any commercial or financial relationships that could be construed as a potential conflict of interest.
Supplementary Material
The Supplementary Material for this article can be found online at: https://www.frontiersin.org/articles/10.3389/fsufs.2020.00096/full#supplementary-material
References
Abalos, D., Brown, S. E., Vanderzaag, A. C., Gordon, R. J., Dunfield, K. E., and Wagner-Riddle, C. (2016a). Micrometeorological measurements over 3years reveal differences in N2O emissions between annual and perennial crops. Glob. Change Biol. 22, 1244–1255. doi: 10.1111/gcb.13137
Abalos, D., Smith, W. N., Grant, B. B., Drury, C. F., MacKell, S., and Wagner-Riddle, C. (2016b). Scenario analysis of fertilizer management practices for N2O mitigation from corn systems in Canada. Sci. Total Environ. 573, 356–365. doi: 10.1016/j.scitotenv.2016.08.153
Abendroth, L., Elmore, R. W., Boyer, M. J., and Marlay, S. (2011). Corn Growth and Development Ames, IA: Iowa State University.
Anderson, D. M., Burkholder, J. M., Cochlan, W. P., Glibert, P. M., Gobler, C. J., Heil, C. A., et al. (2008). Harmful algal blooms and eutrophication: examining linkages from selected coastal regions of the United States. Harmful Algae. 8, 39–53. doi: 10.1016/j.hal.2008.08.017
Banger, K., Wagner-Riddlge, C., Grant, B., Smith, W., Drury, C., and Yang, J. (2020). Modifying fertilizer rate and application method reduces environmental nitrogen losses and increases corn yield in Ontario. Sci. Total Environ. 722:137851. doi: 10.1016/j.scitotenv.2020.137851
Banger, K., Yuan, M., Wang, J., Nafziger, E. D., and Pittelkow, C. M. (2017). A vision for incorporating environmental effects into nitrogen management decision support tools for U.S. maize production. Front Plant Sci. 28:1270. doi: 10.3389/fpls.2017.01270
Birch, M. B. L., Gramig, B. M., Moomaw, W. R., Doering, O. C., and Reeling, C. J. (2011). Why metrics matter: evaluating policy choices for reactive nitrogen in the chesapeake bay watershed. Environ. Sci. Technol. 45, 168–174. doi: 10.1021/es101472z
Cabas, J., Weersink, A., and Olale, E. (2010). Crop yield response to economic, site and climatic variables. Clim. Change 101, 599–616. doi: 10.1007/s10584-009-9754-4
Cassman, K. G., Dobermann, A., and Walters, D. T. (2002). Agroecosystems, nitrogen-use efficiency, and nitrogen management. Ambio 31, 132–140. doi: 10.1579/0044-7447-31.2.132
Compton, J. E., Harrison, J. A., Dennis, R. L., Greaver, T. L., Hill, B. H., Jordan, S. J., et al. (2011). Ecosystem services altered by human changes in the nitrogen cycle: a new perspective for US decision making. Ecol. Lett. 14, 804–815. doi: 10.1111/j.1461-0248.2011.01631.x
Congreves, K. A., Dutta, B., Grant, B. B., Smith, W. N., Desjardins, R. L., and Wagner-Riddle, C. (2016a). How does climate variability influence nitrogen loss in temperate agroecosystems under contrasting management systems? Agric. Ecosyst. Environ. 227, 33–41. doi: 10.1016/j.agee.2016.04.025
Congreves, K. A., Grant, B. B., Dutta, B., Smith, W. N., Chantigny, M. H., Rochette, P., et al. (2016b). Predicting ammonia volatilization after field application of swine slurry: DNDC model development. Agric. Ecosyst. Environ. 219, 179–189. doi: 10.1016/j.agee.2015.10.028
Derby, N. E., Casey, F. X. M., Knighton, R. E., and Steele, D. D. (2004). Midseason nitrogen fertility management for corn based on weather and yield prediction. Agron. J. 96, 494–501. doi: 10.2134/agronj2004.4940
Dhital, S., and Raun, W. R. (2016). Variability in optimum nitrogen rates for maize. Agron. J. 108, 2165–2173. doi: 10.2134/agronj2016.03.0139
Dodds, W. K., Bouska, W. W., Eitzmann, J. L., Pilger, T. J., Pitts, K. L., Riley, A. J., et al. (2009). Eutrophication of US freshwaters: analysis of potential economic damages. Environ. Sci. Technol. 43, 12–19. doi: 10.1021/es801217q
Drury, C. F., Yang, J. Y., De Jong, R., Yang, X. M., Huffman, E. C., Kirkwood, V., et al. (2007). Residual soil nitrogen indicator for agricultural land in Canada. Can. J. Soil Sci. 87, 167–177. doi: 10.4141/S06-064
Drury, C. F., Yang, X. M., Reynolds, W. D., Calder, W., Oloya, T. O., and Woodley, A. L. (2017). Combining urease and nitrification inhibitors with incorporation reduces ammonia and nitrous oxide emissions and increases corn yields. J. Environ. Qual. 46, 939–949. doi: 10.2134/jeq2017.03.0106
Dutta, B., Smith, W. N., Grant, B. B., Pattey, E., Desjardins, R. L., and Li, C. (2016). Model development in DNDC for the prediction of evapotranspiration and water use in temperate field cropping systems. Environ. Model. Softw. 80, 9–25. doi: 10.1016/j.envsoft.2016.02.014
Ewing, P. M., and Runck, B. C. (2015). Optimizing nitrogen rates in the midwestern United States for maximum ecosystem value. Ecol. Soc. 20:18. doi: 10.5751/ES-06767-200118
FieldView (2019). Climate FieldView. Available online at: https://climate.com/features/fertility-management (accessed October 20, 2019).
Frink, C. R., Waggoner, P. E., and Ausubel, J. H. (1999). Nitrogen fertilizer: retrospect and prospect. Proc. Natl. Acad. Sci. U.S.A. 96, 1175–1180. doi: 10.1073/pnas.96.4.1175
Holley, C. (2015). Crafting Collaborative Governance: Water Resources, California's Delta Plan, and Audited Self-Management in New Zealand. UNSW Law Research Paper no. 2015-15 ed Social Science Research Network. Environmental Law Reporter Omafra.
Howarth, R. W., and Marino, R. (2006). Nitrogen as the limiting nutrient for eutrophication in coastal marine ecosystems: evolving views over three decades. Limnol. Oceanogr. 51, 364–376. doi: 10.4319/lo.2006.51.1_part_2.0364
IFA (2013). Fertilizer Consumption Statistics. Paris: International Fertilizer Industry Association.
IPCC (2014). Climate change. Mitigation of Climate Change. Contribution of working group III to the fifth assessment report of the Intergovernmental Panel on Climate Change. Cambridge, NY: IPCC.
Jarecki, M., Grant, B., Smith, W., Deen, B., Drury, C., VanderZaag, A., et al. (2018). Long-term trends in corn yields and soil carbon under diversified crop rotations. J. Environ. Qual. 47, 635–643. doi: 10.2134/jeq2017.08.0317
Kroebel, R., Smith, W. N., Grant, B. B., Desjardins, R. L., Campbell, C. A., Tremblay, N., et al. (2011). Development and evaluation of a new Canadian spring wheat sub-model for DNDC. Can. J. Soil Sci. 91, 503–520. doi: 10.4141/cjss2010-059
Ladha, J. K., Pathak, H., Krupnik, T. J., Six, J., and van Kessel, C. (2005). Efficiency of fertilizer nitrogen in cereal production: retrospects and prospects. Adv. Agron. 87, 85–156. doi: 10.1016/S0065-2113(05)87003-8
Liu, Y. Y., Swinton, S. M., and Miller, N. R. (2006). Is site-specific yield response consistent over time? Does it pay?. Am. J. Agricu. Econ. 88, 471–483. doi: 10.1111/j.1467-8276.2006.00872.x
McEwan, K. (2019). Reports on Farm Input Prices. Available online at: https://www.ridgetownc.com/research/research_reports_topic.cfm?ref=FARM%5FINPUT%5FPRICES (accessed October 20, 2019).
Morris, T. F., Murrell, T. S., Beegle, D. B., Camberato, J. J., Ferguson, R. B., Grove, J., et al. (2018). Strengths and limitations of nitrogen rate recommendations for corn and opportunities for improvement. Agron. J. 110, 1–37. doi: 10.2134/agronj2017.02.0112
NAAS (2015). National Agricultural Statistics Service. Available online at: https://www.nass.usda.gov (accessed October 20, 2019).
Nasielski, J., Grant, B., Smith, W., Niemeyer, C., Janovicek, K., and Deen, B. (2020). Effect of nitrogen source, placement and timing on the environmental performance of economically optimum nitrogen rates in maize. Field Crops Res. 246:107686. doi: 10.1016/j.fcr.2019.107686
OMAFRA (2019). Statistics-Field Crops. Available online at: http://www.omafra.gov.on.ca/english/stats/crops/estimate_hist_metric.xlsx (accessed October 20, 2019).
Pannell, D. J. (2006). Flat earth economics: the far-reaching consequences of flat payoff functions in economic decision making. Rev. Agric. Econ. 28, 553–566. doi: 10.1111/j.1467-9353.2006.00322.x
Powlson, D. S., Addisott, T. M., Benjamin, N., Cassman, K. G., de Kok, T. M., van Grinsven, H., et al. (2008). When does nitrate become a risk for humans?. J. Environ. Qual. 37, 291–295. doi: 10.2134/jeq2007.0177
Rajsic, P., and Weersink, A. (2008). Do farmers waste fertilizer? A comparison of ex post optimal nitrogen rates and ex ante recommendations by model, site and year. Agricu. Syst. 97, 56–67. doi: 10.1016/j.agsy.2007.12.001
Randall, G. W., and Schmitt, M. A. (1998). “Advisability of fall-applying nitrogen,” in Proceedings of the 1998 Wisconsin Fertilizer, Aglime, and Pest Management Conference (Madison: University of Wisconsin), 90–96.
Sawyer, J., Nafziger, E., Randall, G., Bundy, L., Rehm, G., and Joern, B. (2006). Concepts and Rationale for Regional N Rate Guidelines for Corn. Ames, IA: Iowa State University Extension Regional Publication PM2015.
Scharf, P. C., Shannon, D. K., Palm, H. L., Sudduth, K. A., Drummond, S. T., Kitchen, N. R., et al. (2011). Sensor-based nitrogen applications out-performed producer-chosen rates for corn in on-farm demonstrations. Agron. J. 103, 1683–1691. doi: 10.2134/agronj2011.0164
Sela, S., van Es, H. M., Moebius-Clune, B. N., Marjerison, R., Melkonian, J., Moebius-Clune, D., et al. (2016). Adapt-N outperforms grower-selected nitrogen rates in northeast and midwestern united states strip trials. Agron. J. 108, 1726–1734. doi: 10.2134/agronj2015.0606
Smith, W. N., Grant, B. B., Desjardins, R. L., Kroebel, R., Li, C., Qian, B., et al. (2013). Assessing the effects of climate change on crop production and GHG emissions in Canada. Agricu. Ecosyst. Environ. 179, 139–150. doi: 10.1016/j.agee.2013.08.015
Sobota, D. J., Compton, J. E., McCrackin, M. L., and Singh, S. (2015). Cost of reactive nitrogen release from human activities to the environment in the United States. Environ. Res. Lett. 10:025006. doi: 10.1088/1748-9326/10/2/025006
Sogbedji, J. M., van Es, H. M., Klausner, S. D., Bouldin, D. R., and Cox, W. J. (2001). Spatial and temporal processes affecting nitrogen availability at the landscape scale. Soil Tillage Res. 58, 233–244. doi: 10.1016/S0167-1987(00)00171-9
Tomer, M. D., Porter, S. A., James, D. E., Boomer, K. M. B., Kostel, J. A., and McLellan, E. (2013). Combining precision conservation technologies into a flexible framework to facilitate agricultural watershed planning. J. Soil Water Conserv. 68, 113A−120A. doi: 10.2489/jswc.68.5.113A
Tremblay, N., Bouroubi, Y. M., Belec, C., Mullen, R. W., Kitchen, N. R., Thomason, W. E., et al. (2012). Corn response to nitrogen is influenced by soil texture and weather. Agron. J. 104, 1658–1671. doi: 10.2134/agronj2012.0184
Tukey, J. W. (1991). The philosophy of multiple comparisons. Stat. Sci. 6, 100–116. doi: 10.1214/ss/1177011945
Van Grinsven, H. J. M., Holland, M., Jacobsen, B. H., Klimont, Z., Sutton, M. A., and Willems, W. J. (2013). Costs and benefits of nitrogen for europe and implications for mitigation. Environ. Sci. Technol. 47, 3571–3579. doi: 10.1021/es303804g
Vetsch, J. A., and Randall, G. W. (2004). Corn production as affected by nitrogen application timing and tillage. Agron. J. 96, 502–509. doi: 10.2134/agronj2004.5020
Keywords: corn, EONR: economically optimum N rate, environmental cost, nutrient recommendation, climate extremes
Citation: Banger K, Nasielski J, Janovicek K, Sulik J and Deen B (2020) Potential Farm-Level Economic Impact of Incorporating Environmental Costs Into Nitrogen Decision Making: A Case Study in Canadian Corn Production. Front. Sustain. Food Syst. 4:96. doi: 10.3389/fsufs.2020.00096
Received: 24 October 2019; Accepted: 29 May 2020;
Published: 16 July 2020.
Edited by:
Fardausi Akhter, Agriculture and Agri-Food Canada (AAFC), CanadaReviewed by:
William May, Agriculture and Agri-Food Canada (AAFC), CanadaEmma Louise Burns, Australian National University, Australia
Copyright © 2020 Banger, Nasielski, Janovicek, Sulik and Deen. This is an open-access article distributed under the terms of the Creative Commons Attribution License (CC BY). The use, distribution or reproduction in other forums is permitted, provided the original author(s) and the copyright owner(s) are credited and that the original publication in this journal is cited, in accordance with accepted academic practice. No use, distribution or reproduction is permitted which does not comply with these terms.
*Correspondence: Kamaljit Banger, a2FtYWwuYmFuZ2VyQGdtYWlsLmNvbQ==