 Sarah C. Goslee
- USDA ARS Pasture Systems and Watershed Management Research Unit, University Park, PA, United States
The spatial heterogeneity of vegetation types on a landscape has been linked to multiple ecosystem functions, including habitat for wildlife and pollinators, water cycling, human aesthetic values, and nutrient cycling. Although agricultural land uses are sometimes combined into a single unit when quantifying landscape heterogeneity, diverse cropping systems are a valuable alternative to near-monocultural croplands and contribute more strongly to ecosystem service provision, including services such as pest regulation and carbon sequestration that are of direct interest for agriculture. The USDA Cropland Data Layer was used to characterize crop diversity across the contiguous US for 2008–2018. Percentage of each crop type, along with non-crop uses such as forest and development, were calculated for each 4 km PRISM climate data grid cell. To better understand the drivers of crop diversity, Random Forest modeling was used to assess the importance of climate, soils, and irrigation for patterns of crop effective richness for the contiguous United States, stratified by USDA Land Resource Region. The models explained 57–89% of the variation in maximum crop diversity, with irrigation being by far the most important explanatory variable in regions where it was employed. The drivers of change from 2008 to 2018 were less clear. Random Forest models explained only 20–60% of the change in agricultural diversity over the 11-year period; both soil and climate properties were important, with no clear dominant drivers. Potential crop effective richness was greater than actual across the entire region studied, but substantial increases would require irrigation. Major changes in agricultural systems and infrastructure may be necessary to increase agricultural diversity at large spatial extents, and declining availability of water for irrigation could threaten the agricultural systems that are now most diverse.
Introduction
Multifunctional managed landscapes are necessary for the maintenance of the ecosystem services that sustain both humans and their environment. Not all landscapes are equal: some uses and configurations are more effective at maintaining ecosystem services than others. Large areas of a single land cover, core areas, provide habitat for species that cannot be found in more disturbed areas. Increasing human population requires increasing agricultural productivity without compromising the ecosystem; such developments will require detailed understanding of the positive and negative ecological consequences of agricultural management decisions (Bommarco et al., 2013). Manipulation of crop diversity within existing agricultural areas may offer a pathway for improving ecosystem service provision in agroecosystems without compromising food security.
Agriculture is a major component of landscapes in the United States, where 35% of the land surface is used for cropland and pasture (USDA, 2019), and fills the crucial ecosystem service of providing food, fiber and fuel. Both total agricultural area and agricultural diversity within that area are determinants of ecosystem service provision. At a global scale, separate factors drive agricultural diversity and agricultural expansion (Martin et al., 2019); the same is likely true at smaller scales.
More diverse agricultural landscapes have been demonstrated to provide environmental benefits (Altieri, 1999). Choice of crop identity and spatial and temporal configuration contribute to agricultural diversity. Spatial diversity improves habitat for birds, wildlife, and pollinators (Jerrentrup et al., 2017). Temporal diversity in the form of multi-species rotations and cover crops has been shown to increase soil carbon storage and improve nutrient cycling (McDaniel et al., 2014; Spawn et al., 2019). Agricultural diversity also benefits the farmer, by buffering unexpected events and potentially reducing revenue variability, and may reduce agrochemical usage, including pesticides and fertilizers (Di Falco and Perrings, 2005).
Globally, crop diversity has decreased with increased reliance on a few dominant commodity crops, even as the total crop richness has increased (Khoury et al., 2014; Martin et al., 2019). About 90% of the calories consumed globally are provided by 20 crop species; this reliance on only a few dominant crops may threaten food security at national and global scales (Khoury et al., 2014; Massawe et al., 2016). In the central U.S., monoculture cropping has increased (Plourde et al., 2013). Production costs, existence of markets, and subsidies and crop insurance programs all contribute to the maintenance of monocultural crops (Bowman and Zilberman, 2013). Contrary to ecological theory, diverse crop portfolios do not lead to revenue stability when high market prices and agricultural subsidies promote monocultures of specific crops (Di Falco and Perrings, 2005; Weigel et al., 2018).
Crop selection is heavily dependent on market prices (Weigel et al., 2018), infrastructure, and landscape history. Nonetheless, agricultural decisions are embedded in a biophysical template which constrains the choices available. Crop-specific requirements for temperature and water availability determine the palette of crop species which may be selected. Irrigation augments water availability, but water and temperature experienced by crops are predominantly functions of climate and soil properties.
Crop selection decisions made at field and farm scales have consequences for ecosystem service provision at those same scales, and also at landscape scales. While some ecosystem services, such as soil erosion and nutrient cycling, are primarily determined by field-scale conditions, others, including wildlife habitat and pollinator suitability, are relevant at larger scales. For instance, bees are known to forage within a 3–5 km radius (Kennedy et al., 2013).
Previous studies of crop diversity have summarized patterns of change over longer timescales using USDA National Census of Agriculture data, but have not attempted to relate those patterns to quantitative environmental variables because the county-scale nature of that dataset makes it difficult to do so (e.g., Aguilar et al., 2015; Hijmans et al., 2016). The USDA Cropland Data Layer (CDL) provides 30-m resolution gridded agricultural land cover data for the contiguous United States for 2008–2018, for major agricultural crops/land covers (Boryan et al., 2011). This dataset offers the richest available information about the spatial distribution of commercially-important crops, and forms the basis for potential assessments of agricultural diversity at a variety of scales.
The objectives of this analysis were to identify the relationships between biophysical variables representing temperature and water availability and the agricultural area and crop diversity across the contiguous United States from 2008 to 2018. Characterizing the drivers of agricultural land use patterns at this scale will enable better regional understanding of potential ecosystem service provision, both under current conditions and given expected changes in climate. Specifically, the maximum diversity and area across the 11-year period were modeled for each USDA Land Resource Region (LRR) using machine learning techniques, as were the changes in diversity and area from 2008–2013 to 2013–2018, and across the entire timespan. The maximum value model for the full US was used to predict the potential agricultural diversity across the region, by identifying areas that are similar and dissimilar to current areas of high diversity.
Methods
Assembling a complex dataset comprising agricultural land cover, climate, soils properties, and irrigation data at continental scale necessarily requires consideration of trade-offs and arbitrary choices. Data sources are provided at different spatial and temporal scales, and merging them effectively is a complex affair. Care must be taken at all steps to preserve the attributes most relevant to the questions posed, while recognizing that no perfect solutions (yet) exist. For this study, the guiding principle was to aggregate all datasets to the coarsest spatial resolution dataset, the 4 km PRISM daily climate data (PRISM Climate Group, 2018), using procedures appropriate for each type of data.
To facilitate analysis and interpretation, the 20 LRRs, an agriculturally-based regionalization, were used to organize the analyses (Table 1; USDA, 2006). Given the diversity of climates and agricultural practices in the US, any implicit assumption that important drivers are consistent across the entire continent is flawed. Dividing the analysis based on predetermined agricultural regions allows the identification of regional patterns in determinants of agricultural diversity and area. However, for characterizing potential diversity, the full contiguous US was modeled and used for prediction. Extrapolating from a model trained on a single region limits the predictions to only those practices currently found within that region. A model trained on the contiguous US makes it possible to extrapolate agricultural potentials across regions, a more interesting analysis.
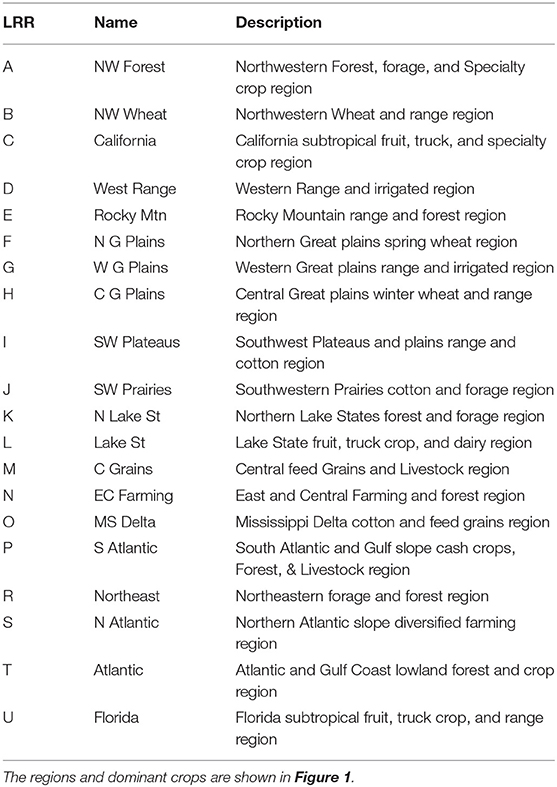
Table 1. USDA Land Resource Regions (USDA, 2006).
Agricultural Diversity
The USDA Cropland Data Layer provides spatially-referenced area data for major crops (Boryan et al., 2011). Aggregating the 30 m data to a coarser spatial scale reduced reliance on pixel-scale accuracy, and integrated over crop rotation patterns in space rather than in time. Aggregated proportional areas were used to calculate both the percentage of each grid cell in agricultural land cover, and the percentage of grid cell area in each CDL-identified crop. This dataset was not developed for tracking change over time, and may also be inaccurate in its representation of field boundaries and sub-pixel areas (Reitsma et al., 2016; Lark et al., 2017). Because each year is classified independently of previous years, comparing two time points without considering the intervening years may lead to erroneous results. Aggregating to a 4 km grid cell smoothed over many of these issues, because individual CDL pixels were not being compared, and any uncertainty on pixel boundaries is far smaller than the overall area of interest. It would possibly still be inappropriate to investigate a single grid cell, but this analysis of the CDL provided an effective overview of trends at the continental scale.
For the purposes of this study, double-cropped areas were counted as their own individual crop category. Thus, double-cropped winter wheat and soybeans was counted as distinct from winter wheat alone. The contribution of double-cropping to crop diversity is clearly higher than that of a single crop, although this may not be the most effective adjustment. Pasture/hay was also counted as a crop type since it is an agricultural land cover. No attempt was made to propagate error in crop identification to the diversity measurements.
Defining diversity is a second complex issue, one that has spawned an extensive literature (e.g., Devictor et al., 2010). Taxonomic diversity? Functional diversity? Phylogenetic diversity? Structural diversity? For the purposes of this analysis, agricultural diversity has been defined as the crop effective richness (CER), calculated from the Shannon diversity of percentage area of each CDL-identified crop within a 4 km grid cell. Effective richness increases interpretability of information-theoretic indices such as the Shannon diversity by expressing them as the number of equally-abundant species that would have the same diversity index (Jost, 2006). Effective crop richness retains both richness and evenness components, but expresses the combined value in terms of number of crop species, an intuitively familiar metric. Note however that the lowest possible value of CER when used with Shannon diversity is 1, rather than 0. In this study, use of CER brings the implicit assumption that it is possible to raise at least one crop species everywhere in the region studied, even if there is currently no agriculture conducted there.
Environmental Data
The potential driver variables were chosen to represent temperature and water availability, basic requirements for plant growth. The PRISM daily gridded climate data formed the basis of the dataset (PRISM Climate Group, 2018). Derived variables representing aspects of precipitation and temperature relevant for crops were calculated for the period 2001–2015; selected variables follow Wang et al. (2017), and include a subset of BIOCLIM indices such as precipitation during the warmest quarter, maximum and minimum monthly temperatures, and temperature seasonality (Busby, 1991), and additional agronomic variables such as growing degree days (Table 2).
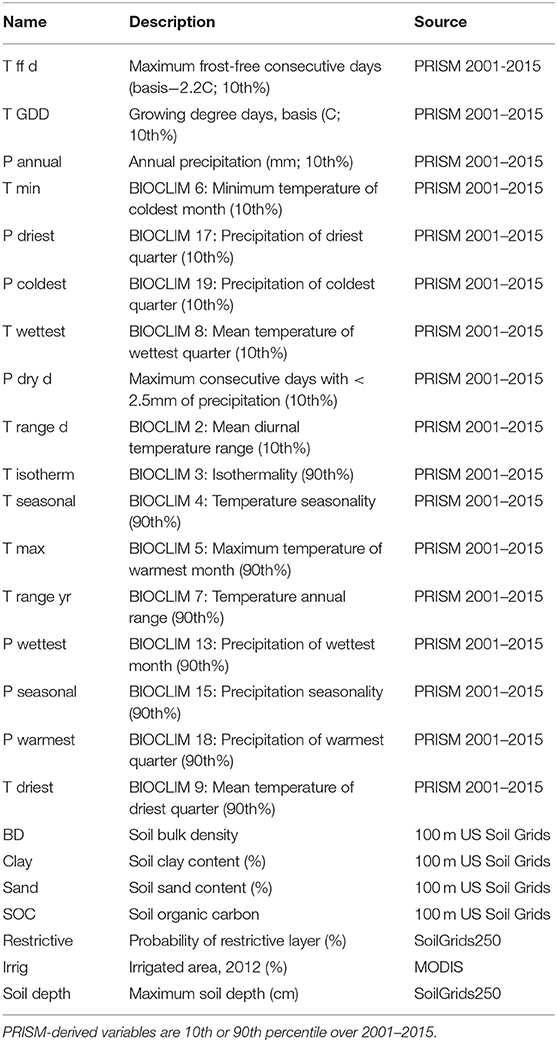
Table 2. Climate and soils variables describing aspects of temperature and water availability relevant for crop productivity.
Soils properties were calculated as weighted mean values of the top 100 cm from two separate gridded digital reanalysis products. Texture and chemical properties came from a 100 m US soils dataset (Ramcharan et al., 2018), while soil depth and probability of a restrictive layer were aggregated from the global SoilGrids250 product (Hengl et al., 2017). Spatially-referenced gridded irrigation data were aggregated from the MODIS-derived 2012 gridded 1 km irrigated agriculture layer (Pervez and Brown, 2010; Brown and Pervez, 2014) to produce percentage of grid cell area that was irrigated. This was referenced to the 2012 total agricultural area for each cell to produce percentage of agricultural area that was irrigated; the resulting value was trimmed at 0 and 100% to reduce data inconsistencies.
All datasets were projected into Albers Equal Area and aggregated to the PRISM grid using GRASS GIS [cite]. Fewer than 1,000 grid cells did not have complete data for all climate, soils, CDL, and irrigation layers, resulting in 475,605 grid cells for analysis. All analyses were conducted in R 3.6.0 (R Core Team, 2019). The packages sp 1.3-1 (Pebesma and Bivand, 2005; Bivand et al., 2013) and ggplot2 3.2.0 (Wickham, 2016) were essential for display of results.
Statistical Methods
The core of the analysis is the machine learning method Random Forest (RF), a flexible tree-based regression approach. The fast implementation in the ranger 0.11.2 package (Wright and Ziegler, 2017) provides sophisticated tools for assessing variable importance. While RF models are empirical, rather than process- or theory-based, the shape of the relationship between the dependent variable and each independent variable was assessed using partial dependence plots (pdp 0.7.0 package in R; Greenwell, 2017). Preliminary testing using five-fold cross validation demonstrated that for this dataset, 1,000 trees was adequate, and that increasing the number of variables per tree beyond the default did not produce enough improvement in model fit to justify the large increase in runtime. Impurity, the variance of the regression responses, was used to assess variable importance within the forest, and a permutation test with 100 permutations was used to identify potentially important variables at p < 0.1.
Like most regression-based methods, RF models analyze the mean value across all samples at a particular level of an independent variable (or within a node, for tree models such as this). For modeling the potential values of variables where the minimum value is unconstrained (there can be zero agricultural diversity at any point, regardless of site characteristics), quantile RF enables the analysis of maximum values (quantregForest 1.3-7; Meinshausen, 2017). For this study, the 90th quantile was used for prediction. This ability to predict quantiles, not just means, good capability to assess importance of individual predictor variables, and the general familiarity of ecologists with Random Forest models all contributed to the selection of RF rather than another machine learning model for this study.
Three sets of models were constructed. The first was for the maximum value of CER for each grid cell over the 11 years of CDL data available. The maximum value within a grid cell was used, to reduce the effect of interannual fluctuations due to factors other than biophysical potentials. Each LRR was modeled separately. The second set of models described the overall change in CER from 2008 to 2011, again stratified by LRR. Finally, models of maximum CER were constructed for the contiguous US, treating irrigated and rainfed areas separately. The full US was used to parameterize the models to ensure that predicted CER values were not constrained only to those already present in the LRR, but extrapolated across the entire set of possibilities found in the dataset.
Results
The relative abundance of different groups of dominant crops in the 2018 CDL highlights the regional patterns of agriculture in the contiguous US, and sets the stage for more detailed analysis of crop diversity (Figure 1). The values are scaled to the maximum percentage abundance for each crop, so for instance the greatest percentage area of corn was planted in the Central Feed Grains region, while the greatest area of cotton production was in the Mississippi Delta and Central Great Plains regions. Agriculture dominates the Great Plains regions, Mississippi Delta, California and the Northwest Wheat LRRs (Figure 1A). Large regions of arid rangeland in the Southwest and forest in the northern and eastern US have patchy or no agricultural areas (Figure 2A). Irrigation in 2012 was most common in the Mississippi Delta, California, and Western Range regions, as well as portions of the Central Great Plains and Florida, and smaller portions of other areas (Figure 2B).
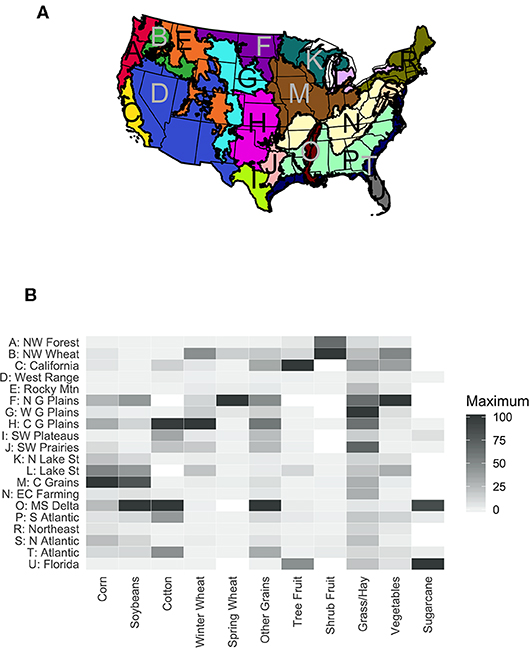
Figure 1. The boundaries of each of the twenty USDA Land Resource Regions (A) and the dominant crop area in each from the 2018 Cropland Data Layer (B). The full names of each region are given in Table 1.
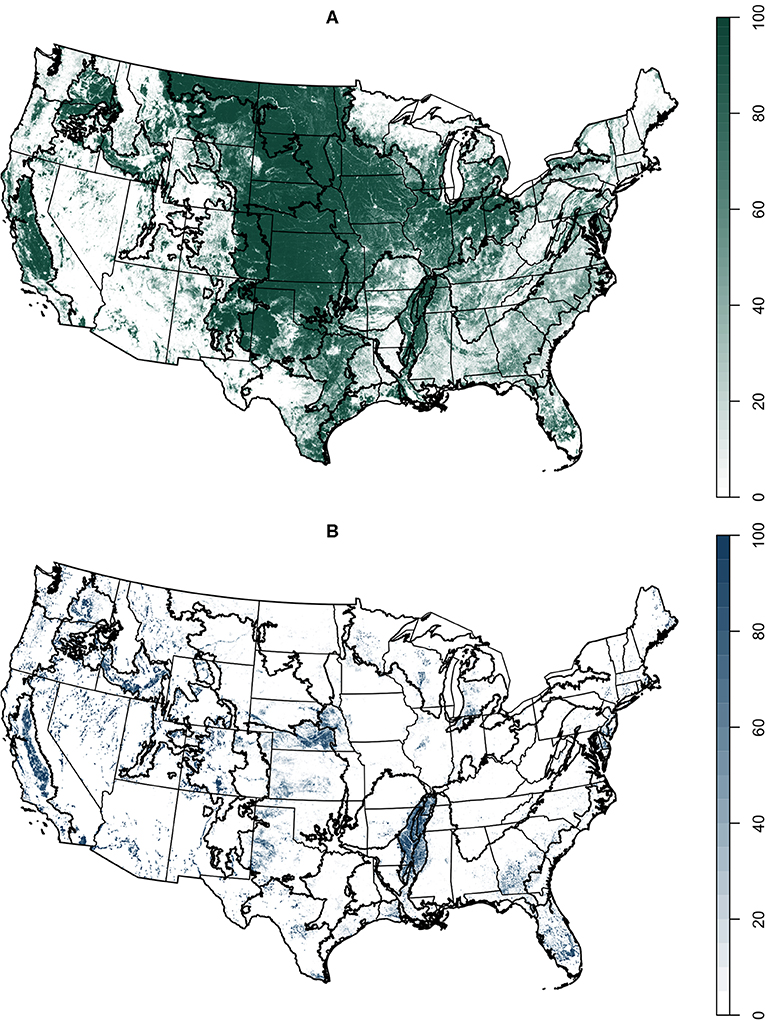
Figure 2. (A) Maximum percentage of agricultural land, 2008–2018. (B) Irrigated agricultural area, 2012.
The agriculturally-dominated Central Great Plains nonetheless had low agricultural diversity; the northern regions, California, and the southeast had the highest diversity (Figure 3). California had the maximum value of CER per grid cell (17.5), while the Lake States had the highest average value (5.3). The Northern Great Plains and the Northern Atlantic Slope also had high average CER; these areas have both extensive and diverse agriculture. Change in CER over the 11 years of data currently available was highly patchy (Figure 4). The Mississippi Delta lost the most CER overall, an average of −0.8. The Northeast (−0.3) and the Atlantic (−0.1) LRRs were the only other regions with a negative mean change in CER. The Northern Great Plains and the Southwest Plateaus both increased by an average of 0.4. California had both the greatest losses and gains within individual grid cells, −9.8 and 9.2 species.
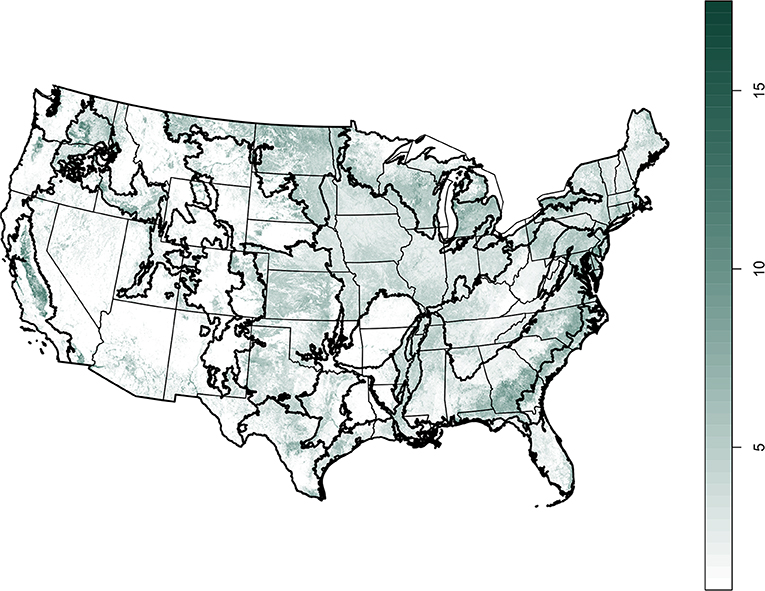
Figure 3. Maximum crop effective richness, 2008–2018.
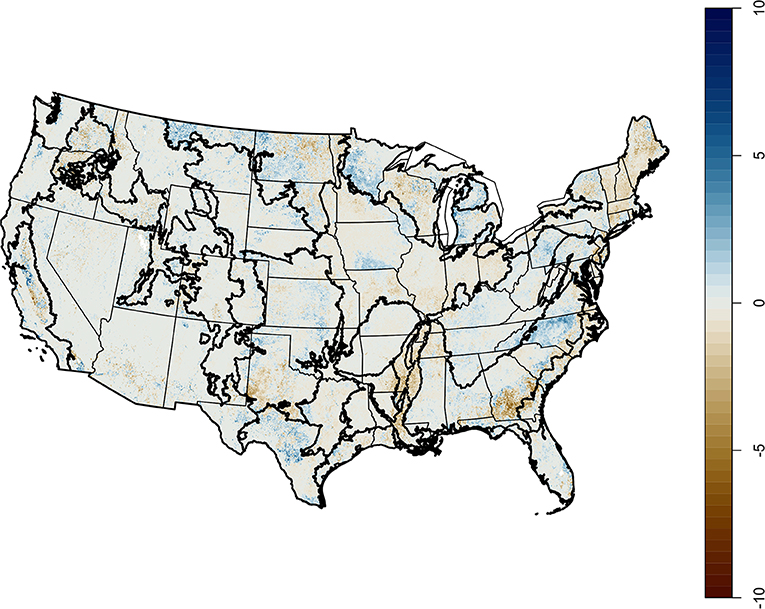
Figure 4. Change in annual crop effective richness, 2008–2018.
The RF models of CER explained 57.1–89.1% (Mississippi Delta and California, respectively; average 75.7%) of the variance in crop diversity (Figure 5A). There was a general tendency for the LRRs with a broad range of CER values to be the best-fit by the models; machine learning techniques like RF perform best across a range of potential predictors, rather than in regions where very little area is in agriculture (West Range), or where almost all of the area is in homogeneous agriculture (Mississippi Delta). Variability in crop diversity was substantially related to temperature and water availability. Growing degree days, length of the growing season, minimum and maximum temperature, and temperature seasonality were the major temperature variables; soil texture, irrigation, and presence of a soil restrictive layer were frequently-important controls on water availability, more so than precipitation directly.
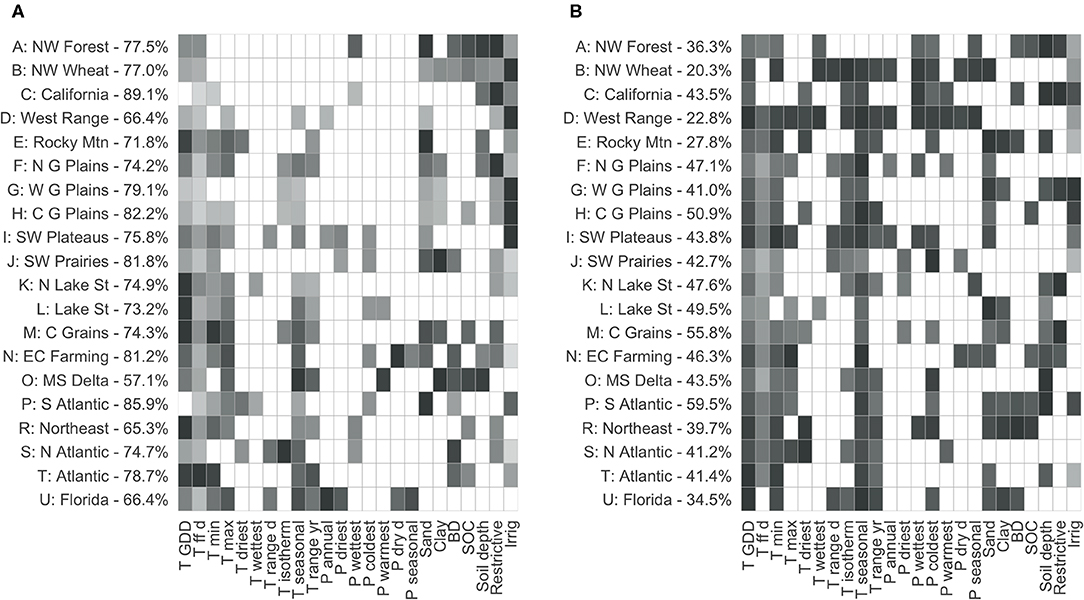
Figure 5. Relative variable importance for the significant variables for each LRR model models of maximum crop effective richness (A) and change in crop effective richness (B), 2008–2018. The darkest is the most important for each region; lighter colors are relative to that maximum. Region labels include the variance explained for that model. Color scale is as for Figure 1B.
It was more difficult to model change in CER 2008–2018: RF models did not explain as much variance, nor were certain variables as clearly important (Figure 5B). Only 20.3% of the variance was explained in the Northwestern Wheat region, while 59.5% was explained in the South Atlantic LRR (mean 41.8%). This was not unexpected: while temperature and water availability constrain potential agricultural uses, many other factors, such as market availability, population density, and agricultural policy, go into determining actual uses. There was no relationship across LRRs between change in CER and maximum CER (r2 = 0.022, p = 0.5283), between maximum agricultural area and maximum CER (r2 = 0.087, p = 0.2056), or between change in CER (r2 = 0.001, p = 0.9722). Growing degree days, temperature seasonality, and soil texture were again frequently important variables.
The shape of the partial dependence plots for maximum CER and change in CER differed across regions, demonstrating the importance of stratifying very large datasets when variable interpretation is desired. Growing degree days illustrates this clearly; the Northern Lake States (K) and the Northern Great Plains (F) showed opposite relationships with CER, even over the same range in growing degree days (Figure 6A). Relationships between environmental variables and change in CER did not necessarily have the same shape as with maximum CER (Figure 6B). For instance, in the Atlantic Coast LRR (T), CER declined with increasing growing degree days, but change increased with growing degree days, while for the Northern Great Plains, both CER and change in CER declined with growing degree days.
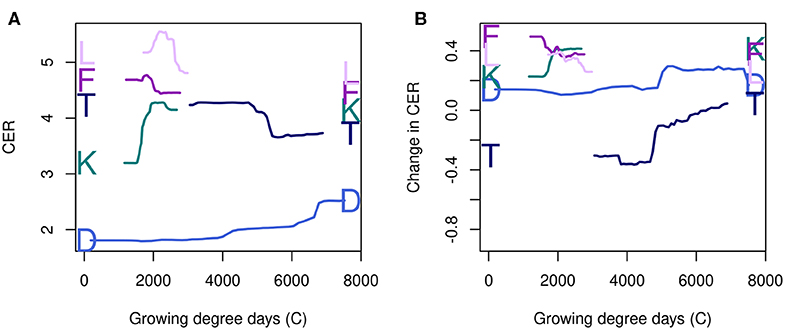
Figure 6. Partial dependence plots for growing degree days for both maximum CER (A) and change in CER (B), for several LRRs showing different responses, following the colors and letter code given in Figure 1 and Table 1.
Describing Potential Diversity
The final phase of the analysis was to develop quantile RF models of irrigated and rainfed maximum CER across the entire United States. These models characterize potential CER by identifying regions similar to those where diverse agriculture is currently found, and cannot extrapolate beyond existing systems. The RF models were quite good, explaining 79.6% of the variance in CER in irrigated areas, and 84.8% in primarily rainfed grid cells. These models were then used to predict the 90th percentile of potential CER across the contiguous US, based on soils and climate.
Agricultural diversity could be increased with irrigation in most parts of the US (Figure 7). The Mississippi Delta would not increase, because its agricultural systems are already designed for irrigation. Florida CER also did not increase with irrigation; this region has high annual precipitation, but uses irrigation to compensate for precipitation variability (Zhang et al., 2018). Western Range, however, showed a large potential increase in agricultural diversity with irrigation. Interestingly, so did the Northern Lake States.
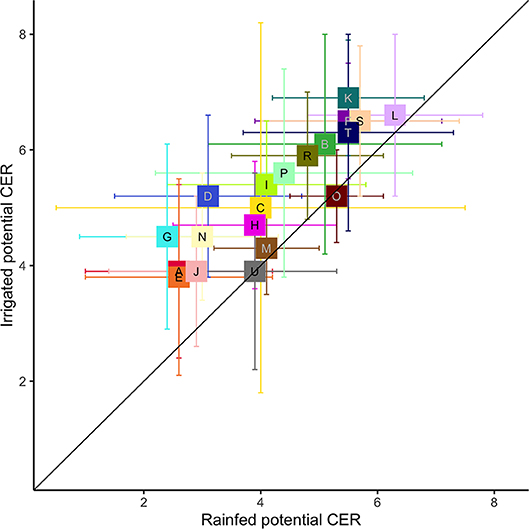
Figure 7. The 90th percentile of maximum CER predicted by irrigated and rainfed RF models for the contiguous US. Values are mean and standard deviation for each LRR, following the colors and letter code given in Figure 1 and Table 1.
In all cases, the maximum potential agricultural diversity, the higher of the irrigated and rainfed predictions, was greater than the current agricultural diversity (Figure 8). Mapping that potential change (Figure 9), shows that some of the gain, particularly in the Northern Lake States, would come at the cost of clearing forest to expose areas of favorable climate and soils. Many areas could support more diverse agricultural systems if they were irrigated.
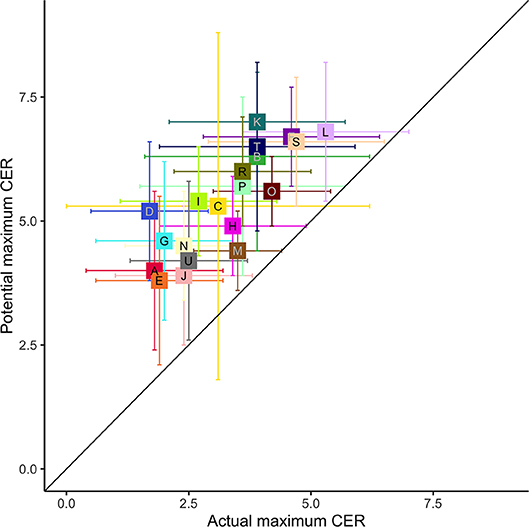
Figure 8. The actual maximum CER for 2008–2018 and the maximum predicted value (rainfed or irrigated). Values are mean and standard deviation for each LRR, following the colors and letter code given in Figure 1 and Table 1.
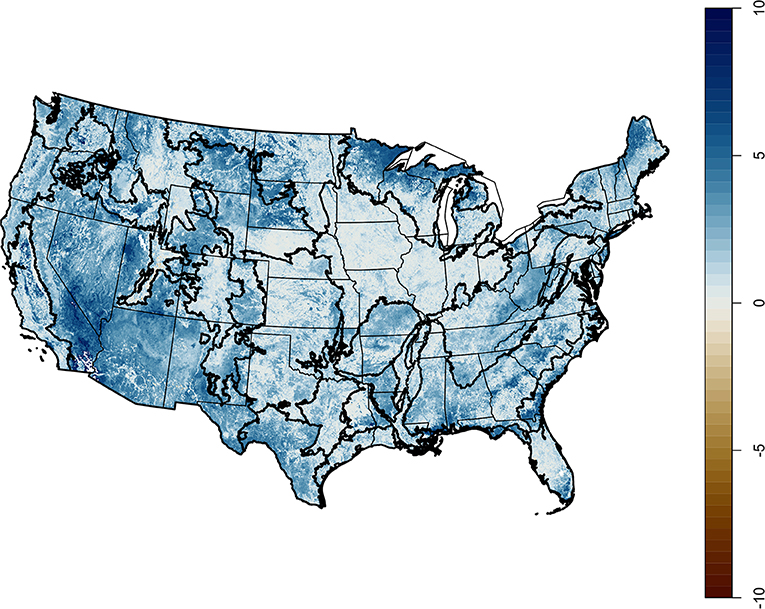
Figure 9. The potential change in CER if the most diverse current system were applied across the contiguous US, given soils and climate.
Discussion
Analyses of crop diversity in the county-scale agricultural census data have found similar regional patterns (Aguilar et al., 2015; Hijmans et al., 2016), although these studies did not then go on to identify important driving variables. At the scale of LRRs, both temperature and water availability were important, although both the magnitude and shape of the relationship, and the relative importance of specific variables, varied considerably. When considering continental-scale ecological patterns, it is crucial to employ methods that can identify regional differences.
Increasing crop diversity may provide immediate benefits, such as the reduction of pathogen transmission and pest outbreaks, or more amorphous benefits by buffering climate variability (Lin, 2011). Potential crop effective richness is higher than the current level in nearly all of the coterminous US. However, irrigation is needed to achieve that potential, and both climate change and declines in aquifer levels make increasing irrigation, or even maintaining current levels, a difficult proposition. Instead, it may be necessary to evaluate the effect of transitioning to rainfed agriculture on crop diversity. For instance, the diverse agricultural systems in the California LRR are strongly dependent on irrigation (Matios and Burney, 2017). A transition to rainfed would result in change of crops and loss of overall diversity, unless new agricultural systems can be developed through alterations in policy, infrastructure, and breeding or selection of crops and varieties that are productive without irrigation.
These models do not include other constraints on agricultural usage: both topography (e.g., mountains) and current land use (development) render a site unsuitable for agriculture, as does certain ownership patterns, such as state and national forests and reserves. Clearing forests for agriculture would not be an overall benefit, regardless of potential agricultural diversity. The coarsest dataset included had a 4 km resolution. In some regions of the US, that is very large relative to local agricultural patterns, while in others it is rather small. No attempt to quantify landscape configuration within that grid cell was done for this study, although crop diversity was much less important for diversity of multiple taxa than compositional factors such as field size and overall agricultural area (Fahrig et al., 2015; Duflot et al., 2017).
The CDL does not capture sub-field heterogeneity, and does not identify either within-crop genetic diversity or within-field diversity in pasture and Harland, both of which may be important for ecosystem services (Jackson et al., 2007; Sanderson et al., 2007; Finger and Buchmann, 2015; Reiss and Drinkwater, 2018). This study does not explicitly include temporal diversity due to the use of cover crops or rotations, substituting instead the maximum CER in any of the 11 years. Pooling all years to create a multiyear maximum diversity, instead of a spatial-only maximum diversity, might instead better capture temporal diversity created by complex rotations, which has been shown to be environmentally beneficial (Davis et al., 2012; McDaniel et al., 2014).
Decision support tools are being developed to assess tradeoffs in ecosystem services associated with different cropping systems (e.g., Tayyebi et al., 2016), but not enough information is available on the role of crop diversity within these systems to adequately quantify outcomes. Decisions on diversification are made at the farm- and field-scales, but have consequences for both ecosystem services and food security at much broader spatial extents. Tools such as crop models may provide linkages between agricultural management and fine-scale patterning and ecosystem services (Lin, 2011), within the broader biophysical context.
Agricultural field management practices such as tillage and pesticide application have very strong implications for ecosystem service provision. Future research will explore methods for including this information in regional and national analyses, as well as incorporating spatial and temporal components of agricultural diversity, and a more nuanced consideration of functional and structural crop diversity. Functional diversity may be more important for agroecosystems functioning than taxonomic diversity, as used here, although taxonomic diversity provides provisioning and insurance services (Jackson et al., 2007; Martin and Isaac, 2018).
Variables related to temperature and water availability were effective at modeling current maximum agricultural diversity, but not as good at modeling change in agricultural diversity. Economic and policy incentives often benefit monoculture systems more than diverse systems (Lin, 2011). Weigel et al. (2018) found lower agricultural diversity on higher-quality soils, where agriculture can be concentrated on the most valuable crops with the least risk. That appears to be the case in the most heavily-agricultural and most productive regions of the US as well. The importance of water availability suggests that other relevant management practices, such as the installation of tile drains, could be a major driver in some areas. No comprehensive dataset on this practice is currently available, but would be highly useful.
As for any statistical method, Random Forest models can only be used to predict within the bounds of the training data. In this context, RF models can identify areas that are like currently-diverse areas, but they cannot predict the role of entirely new systems. This limitation is clearly visible in the small potential increase in diversity predicted in the Central Grains region: the current agricultural system for that combination of climate and soils is so heavily dominated by monoculture grain and soybeans that the RF models cannot predict anything else. Within that limitation, these models can be used to predict potential changes in diversity due to addition or removal of irrigation, and due to changes in temperature and precipitation. Most studies of climate change effects on agriculture concentrate on crop yield, rather than area or diversity (e.g., Kang et al., 2009). The models developed in this study are based on standard climatic indices, and can be used with climate projections to model potential future outcomes if the same agricultural systems continue to be employed.
Conclusions
Agricultural ecosystems are maintained at a lower rate of biodiversity than the natural ecosystems found in comparable regions (Altieri, 1999); increasing agricultural diversity may improve ecosystem services such as nutrient cycling, pest and pathogen control, and even the provision of high-quality foodstuffs. Crop diversity as currently constituted in the United States is heavily reliant on irrigation. To achieve greater ecosystem service benefits from increased crop diversity, alternative agricultural systems must be developed. The spatial and temporal scale of the analysis here focused on structural and systemic aspects of crop diversity, rather than on individual crop selection, but clearly there will be a role for crop species and varieties that are productive under these alternative systems, as long as the use of one or a few varieties only does not reduce system diversity rather than enhance it.
The biophysical constraints on diversity imposed by temperature and water availability explain much of the broad pattern of diversity in the US, although the pattern of change in diversity is less clearly explained. Variable importance, and even the shape of the relationship between particular variables and crop effective richness, differs by region.
Management-based control of potential diversity through irrigation is the primary control on agricultural diversity. In the western US, climate change and declining water supply may require the transition of irrigated agriculture to rainfed by the end of this century; the eastern US may be able to support an increase in irrigated area with development of infrastructure (Elliott et al., 2014).
It may not be possible to optimize both agricultural diversity and food production everywhere (Holt et al., 2016). Nonetheless, a spatial understanding of the potential crop diversity offered by current agricultural systems aids in planning regional and national policies, and in evaluating the effects of novel practices that increase spatial and temporal agricultural diversity.
Data Availability Statement
The datasets analyzed for this study are publicly available from the referenced sources.
Author Contributions
SG designed the project, conducted the analyses, and drafted the manuscript.
Funding
This research was supported by the U.S. Department of Agriculture, Agricultural Research Service. Mention of trade names or commercial products in this publication is solely for the purpose of providing specific information and does not imply recommendation or endorsement by the U.S. Department of Agriculture. USDA is an equal opportunity provider and employer.
Conflict of Interest
The author declares that the research was conducted in the absence of any commercial or financial relationships that could be construed as a potential conflict of interest.
Acknowledgments
Doug Miller and Martina Calovi provided insightful comments at various stages of this project. This research was a contribution from the Long-Term Agroecosystem Research (LTAR) network. LTAR is supported by the United States Department of Agriculture.
References
Aguilar, J., Gramig, G. G., Hendrickson, J. R., and Archer, D. W. (2015). Crop species diversity changes in the United States: 1978–2012. PLoS ONE 10:e0136580. doi: 10.1371/journal.pone.0136580
Altieri, M. A. (1999). The ecological role of biodiversity in agroecosystems. Agric. Ecosyst. Environ 74, 19–31. doi: 10.1016/S0167-8809(99)00028-6
Bivand, R. S., Pebesma, E., and Gomez-Rubio, V. (2013). Applied Spatial Data Analysis with R, Second edition. New York, NY: Springer. doi: 10.1007/978-1-4614-7618-4
Bommarco, R., Kleijn, D., and Potts, S. G. (2013). Ecological intensification: harnessing ecosystem services for food security. Trends Ecol. Evol. (Amst) 28, 230–238. doi: 10.1016/j.tree.2012.10.012
Boryan, C., Yang, Z., Mueller, R., and Craig, M. (2011). Monitoring US agriculture: the US Department of Agriculture, National Agricultural Statistics Service, Cropland Data Layer Program. Geocarto. Int. 26, 341–358. doi: 10.1080/10106049.2011.562309
Bowman, M. S., and Zilberman, D. (2013). Economic factors affecting diversified farming systems. Ecol. Soc. 18:33. doi: 10.5751/ES-05574-180133
Brown, J. F., and Pervez, M. S. (2014). Merging remote sensing data and national agricultural statistics to model change in irrigated agriculture. Agric. Syst 127, 28–40. doi: 10.1016/j.agsy.2014.01.004
Davis, A. S., Hill, J. D., Chase, C. A., Johanns, A. M., and Liebman, M. (2012). Increasing cropping system diversity balances productivity, profitability and environmental health. PLoS ONE 7:e47149. doi: 10.1371/journal.pone.0047149
Devictor, V., Mouillot, D., Meynard, C., Jiguet, F., Thuiller, W., and Mouquet, N. (2010). Spatial mismatch and congruence between taxonomic, phylogenetic and functional diversity: the need for integrative conservation strategies in a changing world. Ecol. Lett. 13, 1030–1040. doi: 10.1111/j.1461-0248.2010.01493.x
Di Falco, S., and Perrings, C. (2005). Crop biodiversity, risk management and the implications of agricultural assistance. Ecol. Econom. 55, 459–466. doi: 10.1016/j.ecolecon.2004.12.005
Duflot, R., Ernoult, A., Aviron, S., Fahrig, L., and Burel, F. (2017). Relative effects of landscape composition and configuration on multi-habitat gamma diversity in agricultural landscapes. Agric. Ecosyst. Environ. 241, 62–69. doi: 10.1016/j.agee.2017.02.035
Elliott, J., Deryng, D., Müller, C., Frieler, K., Konzmann, M., Gerten, D., et al. (2014). Constraints and potentials of future irrigation water availability on agricultural production under climate change. Proc. Natl. Acad. Sci. U.S.A. 111, 3239–3244. doi: 10.1073/pnas.1222474110
Fahrig, L., Girard, J., Duro, D., Pasher, J., Smith, A., Javorek, S., et al. (2015). Farmlands with smaller crop fields have higher within-field biodiversity. Agric. Ecosyst. Environ. 200, 219–234. doi: 10.1016/j.agee.2014.11.018
Finger, R., and Buchmann, N. (2015). An ecological economic assessment of risk-reducing effects of species diversity in managed grasslands. Ecol. Econ. 110, 89–97. doi: 10.1016/j.ecolecon.2014.12.019
Greenwell, B. M. (2017). pdp: An R package for constructing partial dependence plots. R J. 9, 421–436. doi: 10.32614/RJ-2017-016
Hengl, T., de Jesus, J. M., Heuvelink, G. B. M., Gonzalez, M. R., Kilibarda, M., Blagotić, A., et al. (2017). SoilGrids250m: Global gridded soil information based on machine learning. PLoS ONE 12:e0169748. doi: 10.1371/journal.pone.0169748
Hijmans, R. J., Choe, H., and Perlman, J. (2016). Spatiotemporal patterns of field crop diversity in the United States, 1870–2012. Agricul. Environ. Lett. 1:160022. doi: 10.2134/ael2016.05.0022
Holt, A. R., Alix, A., Thompson, A., and Maltby, L. (2016). Food production, ecosystem services and biodiversity: we can't have it all everywhere. Sci Total Environ. 573, 1422–1429. doi: 10.1016/j.scitotenv.2016.07.139
Jackson, L. E., Pascual, U., and Hodgkin, T. (2007). Utilizing and conserving agrobiodiversity in agricultural landscapes. Agric. Ecosyst. Environ. 121, 196–210. doi: 10.1016/j.agee.2006.12.017
Jerrentrup, J. S., Dauber, J., Strohbach, M. W., Mecke, S., Mitschke, A., Ludwig, J., et al. (2017). Impact of recent changes in agricultural land use on farmland bird trends. Agric. Ecosyst. Environ. 239, 334–341. doi: 10.1016/j.agee.2017.01.041
Kang, Y., Khan, S., and Ma, X. (2009). Climate change impacts on crop yield, crop water productivity and food security – A review. Progress Nat. Sci. 19, 1665–1674. doi: 10.1016/j.pnsc.2009.08.001
Kennedy, C. M., Lonsdorf, E., Neel, M. C., Williams, N. M., Ricketts, T. H., Winfree, R., et al. (2013). A global quantitative synthesis of local and landscape effects on wild bee pollinators in agroecosystems. Ecol. Lett. 16, 584–599. doi: 10.1111/ele.12082
Khoury, C. K., Bjorkman, A. D., Dempewolf, H., Ramirez-Villegas, J., Guarino, L., Jarvis, A., et al. (2014). Increasing homogeneity in global food supplies and the implications for food security. Proc. Natl. Acad. Sci. U.S.A. 111, 4001–4006. doi: 10.1073/pnas.1313490111
Lark, T. J., Mueller, R. M., Johnson, D. M., and Gibbs, H. K. (2017). Measuring land-use and land-cover change using the U.S. Department of Agriculture's Cropland Data Layer: Cautions and recommendations. Int. J. Appl. Earth Observ. Geoinform. 62, 224–235. doi: 10.1016/j.jag.2017.06.007
Lin, B. B. (2011). Resilience in agriculture through crop diversification: Adaptive management for environmental change. Bioscience 61, 183–193. doi: 10.1525/bio.2011.61.3.4
Martin, A. R., Cadotte, M. W., Isaac, M. E., Milla, R., Vile, D., and Violle, C. (2019). Regional and global shifts in crop diversity through the Anthropocene. PLoS ONE 14:e0209788. doi: 10.1371/journal.pone.0209788
Martin, A. R., and Isaac, M. E. (2018). Functional traits in agroecology: advancing description and prediction in agroecosystems. J. Appl. Ecol. 55, 5–11. doi: 10.1111/1365-2664.13039
Massawe, F., Mayes, S., and Cheng, A. (2016). Crop diversity: an unexploited treasure trove for food security. Trends Plant Sci. 21, 365–368. doi: 10.1016/j.tplants.2016.02.006
Matios, E., and Burney, J. (2017). Ecosystem services mapping for sustainable agricultural water management in California's Central Valley. Environ. Sci. Technol. 51, 2593–2601. doi: 10.1021/acs.est.6b05426
McDaniel, M. D., Tiemann, L. K., and Grandy, A. S. (2014). Does agricultural crop diversity enhance soil microbial biomass and organic matter dynamics? A meta-analysis. Ecol. Appl. 24, 560–570. doi: 10.1890/13-0616.1
Meinshausen, N. (2017). quantregForest: Quantile Regression Forests R Package 1241 Version 1.3–7. Available online at: https://CRAN.R-project.org/package=quantregForest (accessed May 14, 2020).
Pebesma, E. J., and Bivand, R. S. (2005). Classes and Methods for Spatial Data in R. R News 5, 9–13.
Pervez, M. S., and Brown, J. F. (2010). Mapping irrigated lands at 250-m scale by merging MODIS data and national agricultural statistics. Remote Sens. 2, 2388–2412. doi: 10.3390/rs2102388
Plourde, J. D., Pijanowski, B. C., and Pekin, B. K. (2013). Evidence for increased monoculture cropping in the Central United States. Agric. Ecosyst. Environ. 165, 50–59. doi: 10.1016/j.agee,.2012.11.011
PRISM Climate Group (2018). PRISM 4km Gridded Daily Temperature and Precipitation Data. Corvallis, OR: Oregon State University.
R Core Team (2019). R: A Language and Environment for Statistical Computing. Vienna: R Foundation for Statistical Computing.
Ramcharan, A., Hengl, T., Nauman, T., Brungard, C., Waltman, S., WIlls, S., et al. (2018). Soil property and class maps of the conterminous United States at 100-meter spatial resolution. Soil Sci. Soc. Am. J. 82, 186–116. doi: 10.2136/sssaj2017.04.0122
Reiss, E. R., and Drinkwater, L. E. (2018). Cultivar mixtures: a meta-analysis of the effect of intraspecific diversity on crop yield. Ecol. Appl. 28, 62–77. doi: 10.1002/eap.1629
Reitsma, K. D., Clay, D. E., Clay, S. A., Dunn, B. H., and Reese, C. (2016). Does the U.S. Cropland Data Layer provide an accurate benchmark for land-use change estimates? Agron. J. 108, 266–272. doi: 10.2134/agronj2015.0288
Sanderson, M. A., Goslee, S. C., Soder, K. J., Skinner, R. H., Tracy, B. F., and Deak, A. (2007). Plant species diversity, ecosystem function, and pasture management: a perspective. Can. J. Plant Sci. 87, 479–487. doi: 10.4141/P06-135
Spawn, S. A., Lark, T. J., and Gibbs, H. K. (2019). Carbon emissions from cropland expansion in the United States. Environ. Res. Lett. 14:045009. doi: 10.1088/1748-9326/ab0399
Tayyebi, A., Meehan, T. D., Dischler, J., Radloff, G., Ferris, M., and Gratton, C. (2016). SmartScape™: a web-based decision support system for assessing the tradeoffs among multiple ecosystem services under crop-change scenarios. Comput. Electron. Agricult. 121, 108–121. doi: 10.1016/j.compag.2015.12.003
USDA (2006). Land Resource Regions and Major Land Resource Areas of the United States, the Caribbean, and the Pacific Basin. Washington, DC: United States Department of Agriculture Handbook, 296.
USDA (2019). 2017 Census of Agriculture. Washington, DC: United States Department of Agriculture. Available online at: https://www.nass.usda.gov/Publications/AgCensus/2017/index.php (accessed May 14, 2020).
Wang, A., Goslee, S. C., Miller, D. A., Sanderson, M. A., and Gonet, J. M. (2017). Topographic variables improve climatic models of forage species abundance in the northeastern United States. Appl. Veget. Sci. 20, 84–93. doi: 10.1111/avsc.12284
Weigel, R., Koellner, T., Poppenborg, P., and Bogner, C. (2018). Crop diversity and stability of revenue on farms in Central Europe: an analysis of big data from a comprehensive agricultural census in Bavaria. PLoS ONE 13:e0207454. doi: 10.1371/journal.pone.0207454
Wickham, H. (2016). ggplot2: Elegant Graphics for Data Analysis. New York, NY: Springer-Verlag. doi: 10.1007/978-3-319-24277-4_9
Wright, M. N., and Ziegler, A. (2017). ranger: a fast implementation of Random Forests for high dimensional data in C++ and R. J. Stat. Softw. 77, 1–17. doi: 10.18637/jss.v077.i01
Keywords: agricultural diversity, Cropland Data Layer, ecosystem services, irrigation, Random Forest
Citation: Goslee SC (2020) Drivers of Agricultural Diversity in the Contiguous United States. Front. Sustain. Food Syst. 4:75. doi: 10.3389/fsufs.2020.00075
Received: 12 September 2019; Accepted: 28 April 2020;
Published: 27 May 2020.
Edited by:
Fardausi Akhter, Agriculture and Agri-Food Canada (AAFC), CanadaReviewed by:
Sotirios Archontoulis, Iowa State University, United StatesMauro Centritto, Institute for Sustainable Plant Protection (CNR), Italy
Copyright © 2020 Goslee. This is an open-access article distributed under the terms of the Creative Commons Attribution License (CC BY). The use, distribution or reproduction in other forums is permitted, provided the original author(s) and the copyright owner(s) are credited and that the original publication in this journal is cited, in accordance with accepted academic practice. No use, distribution or reproduction is permitted which does not comply with these terms.
*Correspondence: Sarah C. Goslee, c2FyYWguZ29zbGVlQHVzZGEuZ292