 Derek Hunt
 Shabtai Bittman
 Martin Chantigny2
- 1Agriculture and Agri-Food Canada, Agassiz, BC, Canada
- 2Agriculture and Agri-Food Canada, Quebec, QC, Canada
- 3Agriculture and Agri-Food Canada, Saskatoon, SK, Canada
Dairy farms need to improve their environmental performance to justify continued consumption of dairy products. Previous studies have demonstrated improved re-use of dairy slurry nitrogen (N) and phosphorous (P) by separating solid and liquid fractions. This study was conducted to examine the long-term effects of applying whole dairy slurry (WS), separated liquid fraction (SLF), and mineral fertilizer on emission of nitrous oxide (N2O) from a grass sward in a moderate climate, and to identify methods to mitigate emissions. The results show that emission occurs in sharp spikes within a week of N application as well as after some wet/dry cycles and freeze/ thaw cycles even in this moderate climate. Greatest emissions occurred from late spring and summer applications. At the high application rate of total-N emissions were similar for WS and SLF, at the lower rate SLF exceeded WS, whereas at equivalent mineral-N, emissions were greater from WS than SLF. On the basis of crop N-uptake, SLF had similar or lower emissions than WS at comparable N rates, and the same was true on basis of yield except for lower emissions with WS than SLF at the low total-N rate (400 kg ha−1). By not finding pollution swapping, the study helps to support the use of slurry manure separation for its agronomic and environmental benefits. This multi-year field study supports current IPCC default values as cautious emission factors (EF) for dairy slurry and commercial fertilizer on intensively managed grass, though a lower EF may be justified for lower input grassland (<50 kg mineral-N ha−1 per dose). Our results suggest that N2O emissions can be reduced by transferring summer slurry application to early spring but on farms where this is not possible, mitigating summertime peaks should be targeted, possibly with the use of a nitrification inhibitor.
Introduction
Several recent reports have argued that food derived from livestock contributes disproportionately to environmental degradation compared to plant derived food (Westhoek et al., 2014; Sheppard and Bittman, 2015). Hence reducing consumption of meat, milk, and eggs has been proposed to improve several environmental indicators relating to water, soil, and air. The recently drafted food guidelines in Canada recommend lowering of consumption of meat and dairy products for both health and environmental reasons (https://food-guide.canada.ca/en/healthy-food-choices/). Paradoxically, the Canadian dairy industry is protected by national government policy in recognition of its importance to food security. Under this policy, dairy production in each province is directly linked to consumption in that province. In contrast, only about half the beef produced in Canada is consumed domestically. Among the animal sectors, dairy production has shown particular environmental improvement thanks to a rising milk yield per lactation cycle, resulting from improvements in feed formulation, genetics and other production factors (Gourley et al., 2012). In medium and large Canadian dairy farms, most lactating cows are housed year-round in free-stall barns, although replacement heifers are often grazed during the growing season provided that there is sufficient land available. Bedding in the barns is composed mostly of straw in grain-growing regions and sawdust in regions where straw is scarce, such as south-coastal British Columbia (BC), while a smaller proportion of farms across Canada use sand or separated manure solids as bedding (Husfeldt et al., 2012). In Canada, as in many industrialized countries, most dairy manure is handled as a slurry which is stored beneath the barns, or in uncovered below-grade pits, above ground tanks, or large lagoons (Sheppard et al., 2011).
Efficient re-use of slurry manure nutrients is one of the foremost economic and environmental challenges facing dairy farmers. While slurry manure is generally rich in nutrients, the elements are not well-balanced, most notably there is an excess quantity of phosphorus (P) relative to the nitrogen (N) needs of plants. This imbalance is exacerbated because of gaseous N losses, mostly as ammonia, during slurry handling and to P supplementation in feed rations. A further complication is that about half the N in cattle slurry (more in farmyard manure, FYM) is in the organic form and not readily available for crop uptake until it is mineralized, thus lowering the immediate value and adding uncertainty of manure N relative to an equivalent amount of N in commercial fertilizer (Schröder et al., 2007). The efficacy of manure N in the field is difficult to predict due to gaseous losses (especially ammonia) and net mineralization which is controlled by soil, weather, and manure attributes, especially its C:N ratio. Loss of ammonia from applied slurry is a complex process which occurs mostly at the slurry-atmosphere interface and is governed by slurry pH and moisture concentration, and environmental factors such as temperature, wind-speed, and rainfall and are quite difficult to predict (Søgaard et al., 2002; Hafner et al., 2019). Hence, farmers may resort to excessive rates of manure or to adding unneeded mineral fertilizer so as not to forego yield, digestible nutrients, and crude protein.
To improve the efficacy of slurry nutrients for crops it can be helpful to separate the high-P high-solids fraction from the high-N liquid fraction (Bittman et al., 2011, 2012; Neufeld et al., 2017). The fractions can be separated by various filtration methods or by more efficient but costly centrifugation (Hjorth et al., 2010). A low-cost method with intermediate efficiency for separating N- and P- rich fractions is allowing the solid particles to settle as a sludge in the bottom of a tank or in the first of a two-stage lagoon system and decanting the liquid fraction. The P-rich sludge fraction may be precision-injected at planting to both replace commercial starter fertilizer and to provide adequate season-long P for a corn crop (Bittman et al., 2012). The separated liquid fraction has higher N use efficiency than whole slurry and can be applied at agronomic rates with reduced excess P (Bittman et al., 2011; Neufeld et al., 2017; Zhang et al., 2018). The liquid fraction is less viscous than the whole slurry hence infiltrates more rapidly into the soil, thereby reducing opportunity for ammonia loss (Sommer et al., 2006), although results are sometimes inconsistent (Bhandral et al., 2009). Applying the liquid fraction in this manner may reduce the need for costly injection devices which are often difficult to use and destructive in grass sward.
Even where there are evident benefits, technologies need to be evaluated carefully to identify possible synergies and unintended consequences, the latter referred to as manure swapping. For example, separated slurry may provide less long-term gain in soil organic N compared to whole slurry. Also, the deeper soil penetration of the separated liquid fraction, where there is less oxygen, may favor denitrification and release of N2O as occurs with injection. Earlier N2O studies on filtered or centrifuged slurry have been relatively short term (often less that 1 year) and are inconclusive with regards to effect of separation on emissions of N2O (e.g., Fangueiro et al., 2008; Holly et al., 2017). Because of the increasing interest in the benefits of slurry separation, the long term effects of applications on grassland of whole and decanted liquid fraction on year-round N2O emissions needs to be assessed.
The objectives of this 5 year field study, conducted on long term grass- slurry manure plots (described by Bittman et al., 2011; Neufeld et al., 2017; Zhang et al., 2018), were to (1) quantify N2O emissions after multiple slurry applications on grass over the growing season, (2) quantify emission spikes due to wet/dry and freeze/thaw events, (3) compare emissions from applications of whole slurry (WS), separated liquid fraction (SLF), and mineral fertilizer (FERT) at comparable rates of mineral and total N, 4) identify methods that may mitigate N2O emissions from intensively fertilized grassland.
Materials and Methods
Site and Experiment Description
A study was conducted from 2 April 2008 to 7 March 2013 on a silty loam soil at the Agriculture and Agri-Food Canada Research Center in southwestern BC, Canada (latitude 49°25 N, longitude 121°77 W). The soil is in the Monroe series which is classified as an Eluviated Eutric Brunisol (Luttmerding, 1981) with a slope of <3%. The soil is moderately well to well-drained consisting of medium-textured Fraser River deposits (190 g kg−1 sand, 630 g kg−1 silt, and 180 g kg−1 clay). The 0–15 cm soil layer has 34.0 g kg−1 organic C, 3.0 g kg−1 total-N (TN), pH 6.3, and a bulk density of 1.15 g cm−3. Total soil C and N were analyzed using the dry combustion method (CNS analyzer, LECO Corp., Saint Joseph, MI, USA) (Neufeld et al., 2017). Soil bulk density was determined in August 2014 by collecting one undisturbed core (2.5 cm diameter), per plot to a depth of 15 cm (Blake, 1986). The site receives 1,663 mm of precipitation annually, most of it falling in winter, and has a mean daily air temperature of 5.2°C in January and 20.2°C in July (Figure 1). The trial was conducted on a grass sward consisting of mainly tall fescue (Festuca arundinacea Schreb.) which was established in 2002 and again in 2007 after a year of corn (Zea mays L.).
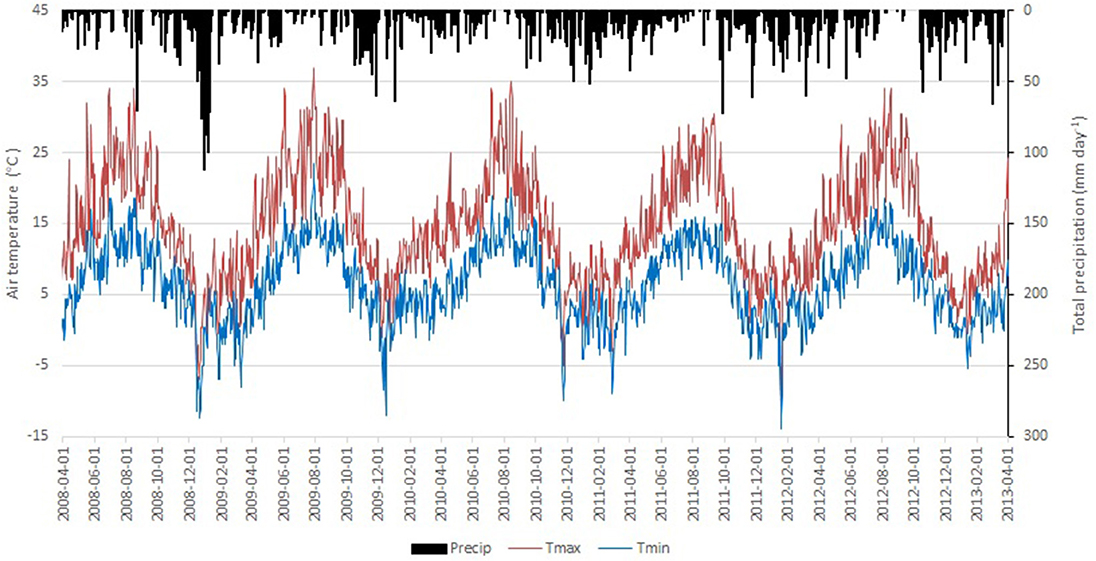
Figure 1. Daily minimum and maximum temperature (°C) and precipitation between April 2008 and March 2013.
Six nutrient treatments were applied every year to the grass (plots measured 3 × 45 m) but no nutrients were applied to the corn (2006) or the newly established grass (2007). The nutrient treatments were arranged in a randomized complete block design with four replicates. The nutrient treatments included: unfertilized control (CTRL); two whole slurry (WS) treatments at 404 (WS400), 587 (WS600) kg ha−1 yr−1 of total-N, two separated liquid fraction (SLF) treatments at 434 (SLF400) and 588 (SLF600) kg ha−1 yr−1 of total-N; and ammonium nitrate fertilizer at 400 (FERT400) kg N ha−1 yr−1. Phosphorous (P), potassium (K), sulfur (S), and lime were applied to the FERT400 plots according to soil tests to mimic typical farm practices. Rates of total-N applied as both WS and SLF had CVs of about 10–15% due to slight differences between in situ and lab analyses and to limitations in controlling the travel rates of the tractor used in slurry application. The nutrient treatments were applied in four equal doses annually beginning in early spring and after cuts 1, 2, and 3 as detailed in Table 1. Before spreading, the slurry was tested for ammonium-N in situ with a “Nova Meter” (Stergatan 29, SE-53132 Lidkoping, Sweden) in order to set target application rates, assuming that ammonium-N = 0.5 and 0.67 of total -N for WS and SLF, respectively. Both WS and SLF were surface banded using a trailing shoe applicator to ensure precise application and low N loss by ammonia emission (Webb et al., 2010; Bittman et al., 2011). There was no slurry runoff from plot areas due to minimal slope (<3%), grass cover, and scheduling of spreading to avoid rainfalls exceeding 0.5 cm.

Table 1. Dates of slurry applications on forage grass and mean number of days from an application to next application.
Both slurries were obtained from local commercial dairy farms feeding 60% home-grown grass and corn silages, 30% concentrate supplements, and 10% grass or alfalfa hay. The bedding materials consisted mainly of sawdust. The WS was collected from typical uncovered below-ground pits. The SLF was obtained from the second stage of a two-stage lagoon system connected through a weeping wall as described by Mukhtar et al. (2011).
The forage grass was harvested (11 m2) with a sickle bar mower four times per year to about 8 cm height as described in Neufeld et al. (2017). The harvested herbage was weighed fresh, and a subsample of at least 500 g was dried at 60°C for 48 h to determine total dry mass harvested. The dried samples were ground through a 2 mm screen and analyzed for tissue N concentrations using the dry combustion method (FP428, LECO Corp., Saint Joseph, MI, USA). Uptake of N (kg N ha−1) was calculated as % N × crop yield × 0.01.
Slurry Analysis and Properties
The total N in WS and SLF was determined by the Kjeldahl method, while total ammoniacal nitrogen (TAN) was determined by steam distillation followed by titration (McGill and Figueiredo, 1993). Dry matter content of the slurry was determined after oven drying at 105°C for 24 h, and pH was measured on a 1:2.5 slurry to water mixture (w/w) (Miller and Curtin, 2008) using a pH meter (Model 810; Fisher Scientific, Ottawa, ON, Canada). Our slurry analyses were routinely verified with commercial laboratories. The chemical properties and application rates of WS, SLF, and fertilizer are listed in Table 2.
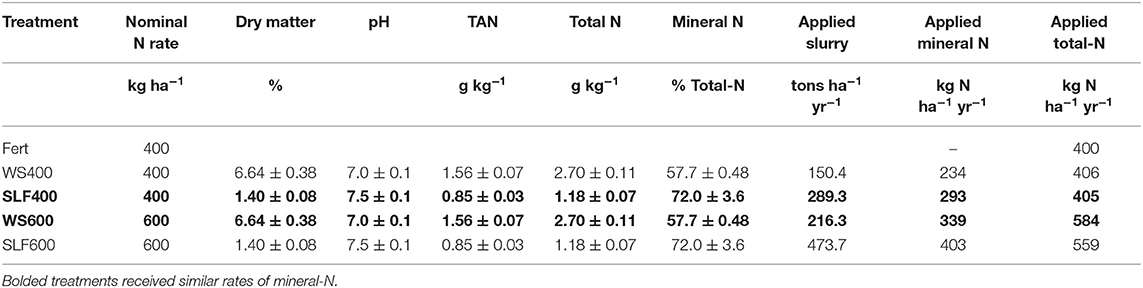
Table 2. Mean composition (±SD) and annual rates of whole dairy slurry (WS) and separated liquid fraction (SLF) and ammonium nitrate fertilizer (FERT) applied in four equal doses.
Nitrous Oxide Measurements
Emissions of N2O were monitored between March 2008 and April 2013 (~60 months). During the first week after each fertilization, N2O emission measurements were made on alternate days to capture expected rapid changes in N2O emissions (Van der Weerden et al., 2013). Measurements were then taken twice a week for the next 2 weeks, and less frequently thereafter. A similar schedule was followed after freeze/thaw and dry/wet cycles which were expected to result in emission spikes (Whitehead, 1995; Wagner-Riddle and Thurtell, 1998). Measurements were generally taken between 10:00 and 14:00 h as suggested by Van der Weerden et al. (2013).
Fluxes of N2O from the soil were measured using vented square (60 × 60 cm) aluminum chambers (one per plot). The chamber collars (12 cm high) with water channel seals were installed in the soil (5–6 cm depth). Collars were removed for field operations, namely harvesting and nutrient application, and quickly reinstalled in the same location. Measurements were made by carefully placing the vented lid (5 cm high) on the collar and drawing 20 mL samples from the (~40 L) headspace inside the chamber using a 30-ml syringe. The gas sample in the syringe was transferred into a 12 ml pre-evacuated vial (101 × 15.5 mm soda glass flat bottomed vials, Labco Limited, Lampeter, UK). Gas samples were collected at 0, 15, 30, and 45 min after chamber was sealed. After sample collection, the covers were removed and the collars were left uncovered.
The gas samples were analyzed using a Varian CP-3800 gas chromatograph (Varian Inc., Palo Alto, CA) which is equipped with a 63Ni-electron capture detector. Samples were checked frequently against standard gases which were compared against one another and against standards from other government laboratories. Nitrous oxide flux was calculated by linear regression of the sampling points; linear regression minimizes the effect of variability of the N2O concentrations in the chamber over sampling time (Rochette, 2011). Moles of air in the chamber were calculated using ideal gas law (n = PV/RT; where n = number of moles of air, P = atmospheric pressure, T = temperature in Kelvin, R = molar gas constant and V = volume of chamber in liters). The flux values were then converted to daily N2O emissions (g N2O-N ha−1 d−1) assuming that the measurements were representative of average daily N2O flux. Cumulative annual N2O emissions were estimated by linear interpolation between sampling dates. Treatment emission factors (EF) were determined for each year using values for annual N2O-N emissions from treated plots minus emissions from the CTRL plot in that replicate and divided by the total-N applied, then multiplying by 100. Emissions were calculated relative to values of crop yield and crop N uptake, which were partially reported in Bittman et al. (2011) and Zhang et al. (2018). Measurements taken of soil temperature, soil moisture, bulk density, water-filled pore space and soil mineral N will be reported in a future manuscript.
Statistical Analysis
The treatment effects on daily and cumulative N2O emissions were tested by analysis of variance in each year, and the mean emissions over 5 years, using the randomized complete block model with nutrient applications as a fixed effect and replicates as random effects (PROC GLIMMIX; SAS 9.4, SAS Institute, Inc., 2014). Letter display and LSD values were generated with the SAS macro %MULT (Piepho, 2012). The emission data obviously varied over years, so that analysis was done for each year and for the mean over years. Emission data were tested for normality using the Shapiro-Wilk test prior to ANOVA and a logarithmic transformation was applied to non-normal data; only the untransformed data are shown. Differences among means were tested with the Fisher Protected LSD. Significance levels were set a priori at P < 0.05.
Results and Discussion
Emissions were observed year-round for all treatments including the CTRL except for relatively brief periods (<about 3 wk) in winter when no measurements were taken because the soil was frozen or snow-covered (Figures 1, 2). Emissions from the CTRL plots with no added N for 6–11 years were generally <5 g N2O-N ha−1 day−1, year-around, with winter peaks similar to summer peaks. In both seasons, CTRL peaks occasionally reached 10 g N2O-N ha−1 day−1, and ~12 times over 5 years, emissions exceeded this value.
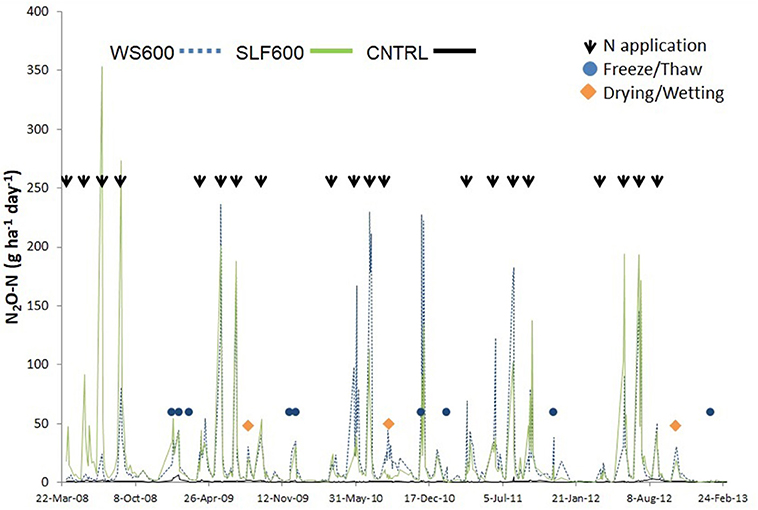
Figure 2. Daily nitrous oxide (N2O-N) emissions measured between 10 April 2008 and 6 March 2013 (~59 months) on replicated perennial grass plots treated with whole and separated slurry (WS600 and SLF600, respectively) applied nominally at 600 kg N ha−1 yr−1, in four equal doses. Day of manure applications and of freeze/thaw and dry/wet cycles are indicated.
For both WS600 and LSF600 treatments, the four annual slurry applications (Figure 2) are associated with emission spikes which occurred within a few days of application. These spikes typically peaked from ~100 to 350 g N2O-N ha−1 day−1 contributing substantially to the cumulative emissions (Figure 3). On four occasions, 3 after the third slurry application, 9 July 2008 (SLF600), 12 July 2010 (WS600) and 16 July 2012 (FERT400), and one after the fourth, 29 August 2008 (SLF600), the spikes exceeded 500 g N2O-N ha−1 day−1. These large spikes were associated with high maximum daily temperatures (27–34°C) on slurry application days (July 2008, 2010, and 2012) or very high summer rainfall in the week before (113 mm) and after (46 mm) slurry application (August 2008) (Figures 1, 2). The data in Figure 2 illustrates the extreme temporal variation in N2O emissions from N-treated grassland, especially in summer, which is consistent with previous reports (e.g., Bhandral et al., 2009). This observation underlines the importance of accurately tracking amplitude and duration of emission peaks over multiple seasons. With manually operated static chambers, it is difficult to perfectly track all emission peaks, leading to underestimates of accumulated N2O values, but the daytime measurements tend to overestimate emissions compared to more frequent automated chambers or near continuous micro-meteorological techniques. However, the latter techniques are very costly and typically deployed over much shorter time periods than in this study, and are also less suitable for larger multi-treatment experiments (Rochette and Eriksen-Hamel, 2008; Fassbinder et al., 2013). To enhance the accuracy of our estimates, we took frequent samples during all expected high emission events which included N applications, dry/wet cycles and freeze/thaw cycles.
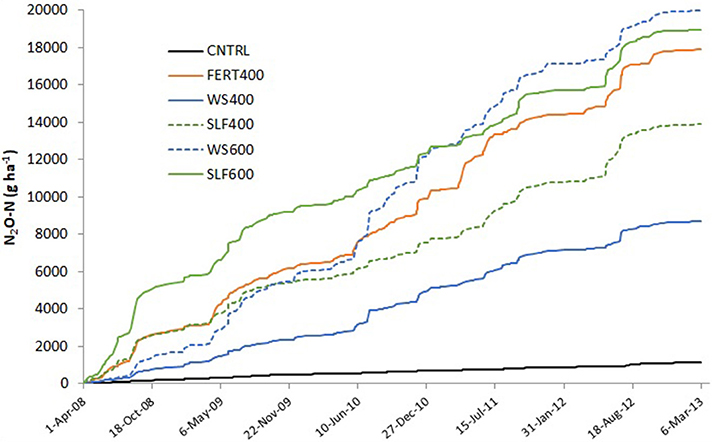
Figure 3. Cumulative nitrous oxide emissions (N2O-N g ha−1) between 10 April 2008 and 6 March 2013 (~59 months) on replicated perennial grass plots treated with whole (WS) and separated liquid slurry (SLF), and mineral fertilizer (FERT) at contrasting rates of total-N and control (CTRL). Dashed line treatments received similar rates of mineral-N.
For all slurry treatments, emission spikes were generally greater after the 2nd, 3rd, and 4th slurry applications than after the 1st application of the year, even though the same amount of N was administered at each application (Figure 2). This is despite the likely greater loss of N as ammonia after applications two to four than application one, due to higher maximum daily temperatures (17.5–27.2°C vs. 12.0°C, respectively) (Søgaard et al., 2002). Conditions in the weeks immediately after application two and four were relatively similar (temperature of 15.9 and 16.0°C, respectively, and precipitation 23.5 and 15.7 mm, respectively) in contrast to 52.0 and 7.5 mm for applications 1 and 3, respectively. There is no clear seasonal pattern regarding the relative size of peaks between WS and SLF; at equivalent rates of total-N, WS600 generally had higher post application peaks than SLF600 in 2009 to 2011, whereas SLF600 generally had higher peaks in 2008 and 2012 (Figure 2). Exceptionally high peaks for SLF in 2008 may be related to the 2 prior years with no N application, but there are no clear annual trends for peaks over the 5 study years with the exception of rising emissions by WS600 relative to SLF600 from April 2010 to Sept 2011 (Figure 3). The results suggest broad seasonal trends relating to precipitation and mineral N as often reported, but the magnitude of the spikes seems to result from nuanced and transient interactions of multiple soil and climatic factors.
Due to the sharp N2O emission spikes after slurry applications, it is evident that much of the slurry -associated emissions occurred in the week following application. This was especially pronounced after the third and second applications when 66.4 and 61.1%, respectively, of the total emissions during those intervals (application to harvest) occurred in the first week after application (Figure 4). The proportions were lower for applications one (29.6%) and four (48.1%). The high relative emissions in the week after the 2nd and 3rd applications, when conditions were relatively dry, are consistent with previous reports suggesting that emissions under aerobic conditions are associated with nitrification of ammonium to nitrate which may be aided in the dry soils by the moisture contained in these liquid manures (Figure 1). In contrast, there was likely a greater proportion of N2O from denitrification than nitrification after the first application due to higher precipitation in the week after spreading (52.0 mm) relative to the later applications (<23.5 mm) and, with lower temperatures, likely also less evapotranspiration. At the 1st application, the proportions of N2O emitted in week 1 were similar for FERT400 and the WS treatments (Figure 4). In contrast, for all the later applications, the proportions of first week emissions were lower for FERT400 than any of the slurry treatments. The difference was greatest at the 3rd application and may be related to the addition of water and carbon to the dry soil by the slurry treatments and to the legacy slurry N from previous applications. The importance of the first week underlines the transitory nature of N2O emissions and that daily emissions are so difficult to accurately model and predict as suggested above. It is suggested that under our conditions improvements in models of N2O emissions after slurry application, modeling should focus most on the week or two after application especially for slurry applied in warm weather.
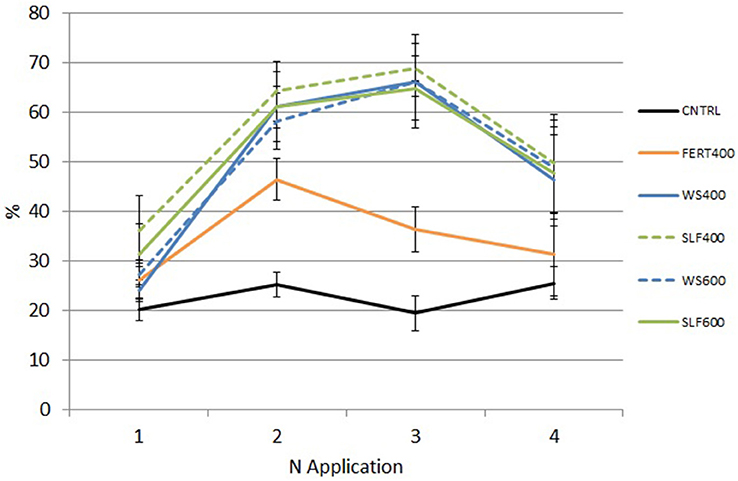
Figure 4. Mean emissions of N2O in the week following each of four annual applications of N as whole slurry (WS), separated liquid fraction (SLF) and mineral fertilizer (FERT), expressed as a percent of the cumulative emissions in the interval between application and harvest. Average over 5 years 2008–2012. Dashed line treatments received similar rates of mineral-N.
Averaged over slurry treatments, cumulative emissions during the intervals between applications and harvests were 10, 30, 38, and 22% of total summertime emissions for applications one to four, respectively (Figure 5). In contrast, with no added N, CTRL emission were much less varied across the season, and the somewhat higher proportion of CTRL (31%) than treated plots (<23%) in the fourth interval might be due to more N mineralization with abundant precipitation (170 mm) during this interval than intervals two and three (109 and 70 mm, respectively). We speculate that greater cumulative emissions in the second and third intervals for the N treated plots was likely due to warmer air temperatures, longer days and probably warmer soils as discussed above. Among the N treatments, FERT400 produced a greater proportion of its summertime emissions after applications 1 and 2 compared to applications 3 and 4 and this may again be due to lack of water and C in the soil. Among the slurry treatments, SLF tended to have proportionately somewhat higher emissions after applications 1 and 2 while WS tended to have higher emissions after applications 3 and 4. This response may be due to more readily available N early in the season from SLF and more mineralized N later in the season from the WS organic-N fraction (Table 1).
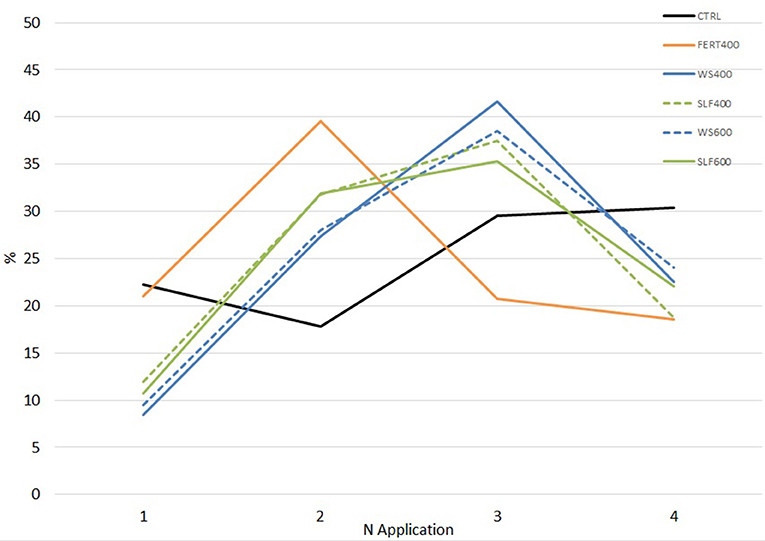
Figure 5. Five year average emissions during 4 intervals between nutrient application and harvest relative to total summer emissions for WS, SLF, and FERT and CTRL treatments. Dashed line treatments received similar rates of mineral-N.
These results suggest the possibility that N2O emission from intensively managed grass can be mitigated by applying more slurry in early spring and less during warm periods. There would also be direct co-benefits in lower ammonia emissions and lower secondary N2O emissions. The IPCC attributes a 1% N2O emission factor for volatilized ammonia since that N2O is missed when measuring direct emission. Shifting more slurry application to spring has been previously proposed (Bourdin et al., 2014). However, heavy spring applications may be in excess to crop need and can lead to N losses by leaching under high rainfall and runoff in a sloping landscape. Also, summer and early fall applications of slurry may be required to support grass growth in the mid and late growing season. Moreover, farmers often do not have sufficient slurry storage (or application capacity) to defer applying summer slurry to the following spring. An alternative approach would be to mix a nitrification inhibitor with slurry that is applied in warm weather (Li, 2019). However, this practice needs to be tested to ensure that it does not lead to increased leaching as suggested for corn systems (Carneiro et al., 2012).
In addition to peaks following slurry applications, there were smaller peaks on 10 Aug 2009, 31, Aug 2010, and 12 Oct 2012 that appeared to follow dry/wet cycles (Figures 1, 2). These peaks can be attributed to release of nitrate into the soil after dry spells as previously reported (Davidson, 1992; Whitehead, 1995). Peaks associated with freeze/thaw events occurred on 12 Jan 2009 to 1 Mar 2009, 17 Dec 2009, 27 Nov 2010, 2 Feb 2011, 20 Nov 2011, and 20 Jan 2013. All the peaks were less than about 50 g N2O-N ha−1 day−1 except the 27 Nov 2010 peak which exceeded 100 N2O-N ha−1 day−1 for most treatments. Freeze thaw peaks are related to intensity of soil freezing and have often been reported in cold regions such as Ontario but are infrequently reported in maritime climates with less intensive freezing (e.g., Wagner-Riddle et al., 2008, Canada).
The intermittent peaks and the low-level emissions between peaks combined to give mean slurry emissions of 0.59 kg N2O-N ha−1 over the 163 day winter period (Table 3). In contrast, cumulative summertime emissions for the slurries over 202 days, which included all of the spreading peaks, averaged about 3.5 times greater. Previously, Rochette et al. (2008) proposed that about 40% of annual emissions can be emitted in winter in cold parts of Canada. Nonetheless, at 22% of the annual totals in this milder region, winter-time emissions should not be overlooked, as this relatively small signal is hard to discern from background noise but lasts for several months. In fact, wintertime emissions could be detected from the CTRL plots, totalling only 0.07 kg N2O-N ha−1, values that are indicative of vast areas of unfertilized grasslands in Canada (Bittman et al., 2016). The winter emissions in CTRL plots demonstrate ongoing low-level microbial activity, including mineralization, nitrification, and denitrification, in cold soils (Tatti et al., 2014). Winter emission were much greater after summertime applications of N suggesting mineralization of organic N from slurry and dead plant tissue. We found greatest winter-time emission from the WS600 treatments which suggests that these additional emissions came from the high doses of organic N. However, the next largest treatment was FERT400 with no organic N input, which could be due to ammonium adsorption and mineralization of plant and microbial N.
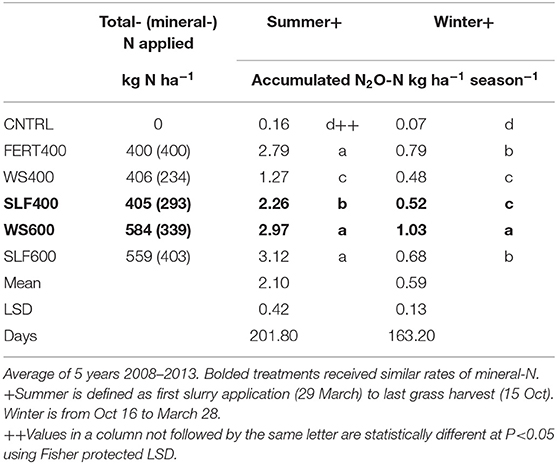
Table 3. Accumulated summer and winter emissions of N2O (N2O-N kg ha−1 season−1) from grass plots treated with different sources and rates of N.
Over the summer period, highest emissions were from treatments SLF600, WS600, and FERT400 (3.12–2.79 kg ha) with significantly lower emissions from SLF400 (2.26) and lower still from WS400 (1.27) (Table 3). At similar mineral N rates, summer emission was significantly greater for WS600 than SLF400 likely due to the greater total N in the WS. At similar total-N rates, WS400 emissions were lower than SLF400 in summer but not in winter, whereas WS600 was greater than SLF 600 in winter but not in summer.
Total annual emissions, averaged across treatments, were similar over years ranging from 2.40 kg N2O-N ha−1 in 2012–13 to 3.14 kg N2O-N ha−1 in 2010–11 whereas the CTRL was consistently low at 0.17–0.30 kg N2O-N ha−1 or about 6–13% of the slurry treatments (Table 4). The high mean emission in 2010–11 year can be attributed in part to the double emission spikes occurring in 27 Nov 2010 and 2 Dec 2010 associated with freeze/thaw events (Figures 1, 2). Despite the clear treatment differences over years (Table 4, Figure 3), relative emissions of the treatments were somewhat variable among the years. For example, WS400 was lowest of the N treatments across years but was similar to WS600 in years 1 and 5, to SLF400 in years 2 and 3 and to SLF600 in year 3. However, WS400 was always significantly lower than FERT400, despite similar applications of total-N. We found about a 50% difference between Fert400 and WS400 whereas Velthof et al. (1997) reported larger differences between cattle slurry and calcium ammonium nitrate. The two highest emitting treatments over years, WS600 and LSF600, were significantly greater than other treatments in only one of 5 years. Shorter term studies have reported inconsistent or no effect of manure slurry separation on N2O emissions (Fangueiro et al., 2008; Bhandral et al., 2009; Holly et al., 2017). Our long-term, year-round measurements show that despite annual variations among treatments, it is possible to identify clear overall separation effects.
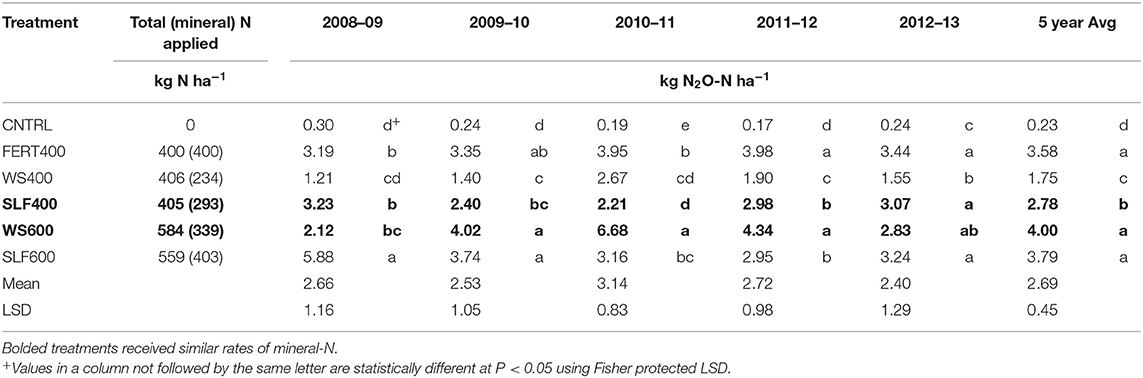
Table 4. Annual N2O-N emissions from perennial grass plots treated with whole slurry, separated liquid fraction, mineral fertilizer, and untreated control over a 5 year period in south coastal BC.
Emission factor (EF) across treatments averaged 0.63 with a range of 0.54 to 0.66 except for 2010–2011 when the EF was 0.80 due to the high winter peaks in Nov–Dec 2010 described above (Table 5). The mean emission factor for FERT400 (0.84) was significantly higher than any of the slurry treatments. In contrast, at a similar dose of total-N, mean EF of WS400 (0.38) was about a third of FERT400 and significantly less than SLF400 (0.63). Our estimate for FERT400 was slightly higher than the uncorrected (for control) EF of 0.62 reported for mineral fertilizer applied at 360 kg N ha−1 on grass in Scotland (Smith et al., 1998), and the EF value (0.57) reported by Chadwick et al. (2011) for whole cattle slurry in the UK. The UK study suggested an EF of 1.06 for readily available (mineral) N. In our experiment, which included the effects of legacy N from previous applications, the EF based on available N (not total-N) was 0.87 for SLF400 and 1.12 for WS600, both receiving about ~300 kg mineral N ha−1. The EFs for SLF600, WS600, and SLF400 were similar at 0.63–0.65. It is interesting that EF of WS was affected by N application rates, as previously reported (e.g., Schils et al., 2008) but the EF of SLF was not affected by the contrasting application rates used in this trial, possibly due to inter-year variation. Overall, the EF factors here are lower than the general IPCC values of 1% and much lower than the 2 and 2.5% for manure and fertilizer recently proposed by Davidson (2009). The EF values here are greater than estimated values (across arable crops) for the semi-arid Canadian prairies, but lower than values (1.7) reported for colder/moister conditions in Eastern Canada (Rochette et al., 2008). Previous N2O studies in coastal BC were short duration and did not report emission factors (Bhandral et al., 2008, 2009). The EF may be lower for this well-drained soil, and the perennial grass tends to have a tighter N cycle than arable crops. The low emission factors in the LFV may also be due to opposing factors for N2O emissions during slurry spreading: low temperatures when moisture is high in spring; low moisture when temperatures are high in summer; and in wintertime there is low soil nitrate due to leaching and limited freeze/thaw events due to mild temperatures.
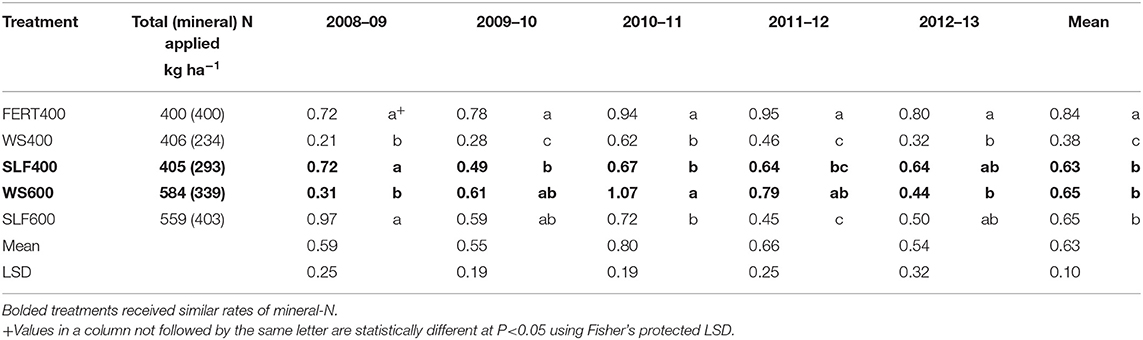
Table 5. Mean N2O-N emission factors for whole slurry, separated liquid fraction, and mineral fertilizer applied to perennial grass over a 5 year period in south-coastal BC, Canada.
How dependable are our EFs? Our study, unlike most others, captured seasonal variations over multiple years, including the multi-year slurry manure effects. The daytime measurements averaged over 24 h would tend to overestimate emissions, while intermittent measurements are likely to miss some peak values thereby somewhat underestimating emission. The linear regression used to calculate emission rate in the chambers tends to slightly underestimate emissions, though provide more stable readings. Therefore, overall, our estimates are likely quite robust and support the use of the IPCC value default as a cautious emission factor for intensively managed grasslands receiving multiple doses of 100 kg available N ha−1 each year. A lower EF (0.5) is warranted for less intensively managed grasslands with multiple slurry doses of 50 kg available N ha−1. Also, a 50% reduction in N2O emissions can be achieved by either rescheduling slurry spreading from summer to early spring, or with effective use of a nitrification inhibitor, particularly in summer (Li, 2019). If these practices can be demonstrated with farm practices surveys, a lower emission factor can be considered for grassland manuring in Canada under the conditions of this study.
It is important to understand N2O intensity in terms of crop production. Despite low values for yield and N uptake, emissions relative to these agronomic factors were significantly lower for the CTRL than all N treatments (Table 6). In contrast, FERT400 treatment had the highest emissions per production of feed and was similar to only the high WS treatments (WS600) when N2O was considered on the basis of crop N uptake. At the low rate of total N, emission per N uptake was similar for WS400 and SLF400 though SLF took up about 79.7 more N, but emissions based on yield were higher for SLF400. At equivalent available N, SLF produced more dry matter and took up more N while emitting less N2O on the basis of both dry matter yield and N-uptake. At the high rate of total N, SLF600 had higher yield and N-uptake than WS600 while emitting less N2O per N-uptake and similar N2O per yield. Thus, slurry manure separation produced better overall agronomic performance with generally no penalty in terms of N2O emissions. These results support the use of slurry manure separation for managing slurry N and P nutrients (Bhandral et al., 2009; Bittman et al., 2011, 2012).
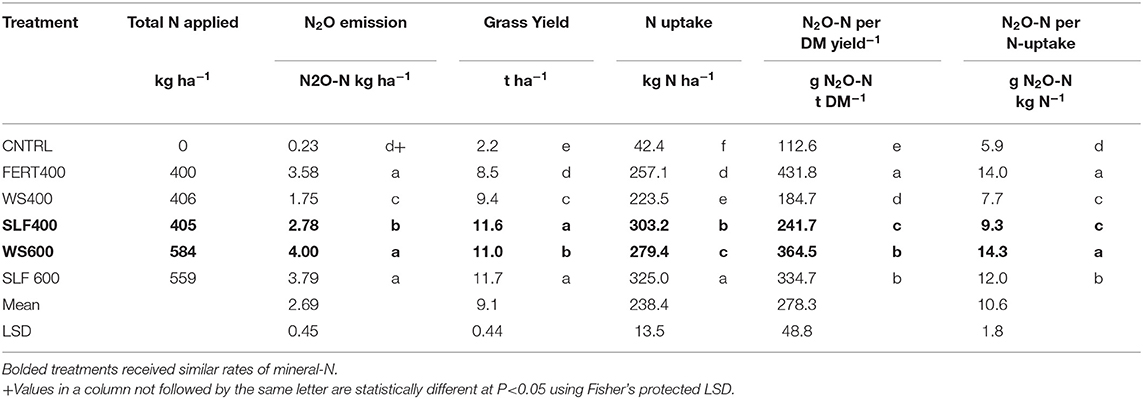
Table 6. Mean annual N2O emissions per ha, per DM yield, and per N uptake from perennial tall fescue grass treated with whole slurry (WS), separated liquid fraction (SLF), and mineral fertilizer at different rates of N.
Conclusion
This study evaluated year-round N2O emission from grassland fertilized with whole slurry (WS), separated liquid fraction (SLF) and mineral fertilizer over multiple years in a maritime climate. The results supported the observation that emissions occur very rapidly after slurry manure application as well as after some wet/dry and freeze/ thaw cycles, even in this rather moderate climate. Manure liquid fraction, which has been shown to improve yield and N uptake, did not increase emission at high N application rates on the basis of application rates or on the basis of crop yield and N uptake, and emissions by SLF were lower at the low doses of available N. By not finding pollution swapping, the study helps to support the use of slurry manure separation for its agronomic and environmental benefits for intensively managed grassland. Our multi-year field study supports current IPCC default values as cautious emission factors for slurry manure on intensively managed grass, though a lower value may be justified for grassland with relatively low input. Our results also suggest that N2O emissions can be reduced by transferring summer slurry application to early spring but on farms where this is not possible, mitigating summertime peaks should be targeted, possibly with the use of a nitrification inhibitor, although this must be tested to ensure there is no pollution swapping as leached N.
Data Availability Statement
The datasets generated for this study are available on request to the corresponding author.
Author Contributions
DH: project concept, grant preparation, data collection and interpretation, lead data analysis, and manuscript preparation. SB: project concept, grant preparation, data interpretation, and lead manuscript preparation. MC: project concept, grant preparation, and manuscript preparation. RL: data collection and manuscript preparation.
Funding
Funding was provided by Agriculture and Agri-Food Canada.
Conflict of Interest
The authors declare that the research was conducted in the absence of any commercial or financial relationships that could be construed as a potential conflict of interest.
Acknowledgments
The authors thank Anthony Friesen, Frédéric Bounaix, Xiao Wu, Maureen Schaber, and many students for their technical support.
References
Bhandral, R., Bittman, S., Kowalenko, C. G., Friesen, A., and Hunt, D. E. (2008). Emissions of nitrous oxide after application of dairy slurry on bare soil and perennial grass in a maritime climate. Can. J. Soil Sci. 88:517527. doi: 10.4141/CJSS07103
Bhandral, R., Bittman, S., Kowalenko, G., Buckley, K., Chantigny, M. H., Hunt, D. E., et al. (2009). Enhancing soil infiltration reduces gaseous emissions and improves N uptake from applied dairy slurry. J. Environ. Qual. 38, 1372–1382. doi: 10.2134/jeq2008.0287
Bittman, S., Hunt, D. E., Kowalenko, C. G., Chantigny, M., Buckley, K., and Bounaix, F. (2011). Removing solids improves response of grass to surface-banded dairy manure slurry: a multiyear study. J. Environ. Qual. 40, 393–401. doi: 10.2134/jeq2010.0177
Bittman, S., Liu, A., Hunt, D. E., Forge, T. A., Kowalenko, C. G., Chantigny, M. H., et al. (2012). Precision placement of separated dairy sludge improves early phosphorus nutrition and growth in corn (Zea mays L.). J. Environ. Qual. 41, 582–591. doi: 10.2134/jeq2011.0284
Bittman, S., Sheppard, S., Amiro, B., and Ominski, K. (2016). “Nitrogen budget estimated for beef operations across Canada,” in 19th Nitrogen Workshop: Efficient Use of Different Sources of Nitrogen in Agriculture–From Theory to Practice. Department of Soil and Environment, Swedish University of Agricultural Sciences, SLU, Skara (Sweden), 107.
Blake, G. (1986). “Chapter 30: bulk density,” in Methods of Soil Analysis Part 1. Physical and Mineralogical Methods, 2nd Edn, ed E. A. Klute (Madison: American Society of Agronomy and Soil Science Society of America, 374–390.
Bourdin, F., Sakrabani, R., Kibblewhite, M. G., and Lanigan, G. J. (2014). Effect of slurry dry matter content, application technique and timing on emissions of ammonia and greenhouse gas from cattle slurry applied to grassland soils in Ireland. Agric. Ecosyst. Environ. 188, 122–133. doi: 10.1016/j.agee.2014.02.025
Carneiro, J. P., Coutinho, J., and Trindade, H. (2012). Nitrate leaching from a maize × oats double-cropping forage system fertilized with organic residues under Mediterranean conditions. Agric. Ecosyst. Environ. 160, 29–39. doi: 10.1016/j.agee.2011.09.001
Chadwick, D., Sommer, S., Thorman, R., Fangueiro, D., Cardenas, L., Amon, B., et al. (2011). Manure management: implications for greenhouse gas emissions. Anim. Feed Sci. Technol. 166, 514–531. doi: 10.1016/j.anifeedsci.2011.04.036
Davidson, E. A. (1992). Sources of nitric oxide and nitrous oxide following wetting of dry soil. Soil Sci. Soc. Am. J. 56, 95–102.
Davidson, E. A. (2009). The contribution of manure and fertilizer nitrogen to atmospheric nitrous oxide since 1860. Nat. Geosci. 2:659. doi: 10.1038/ngeo608
Fangueiro, D., Senbayran, M., Trindade, H., and Chadwick, D. (2008). Cattle slurry treatment by screw press separation and chemically enhanced settling: effect on greenhouse gas emissions after land spreading and grass yield. Bioresour. Technol. 99, 7132–7142. doi: 10.1016/j.biortech.2007.12.069
Fassbinder, J. J., Schultz, N. M., Baker, J. M., and Griffis, T. J. (2013). Automated, low-power chamber system for measuring nitrous oxide emissions. J. Environ. Qual. 42, 606–614. doi: 10.2134/jeq2012.0283
Gourley, C. J., Dougherty, W. J., Weaver, D. M., Aarons, S. R., Awty, I. M., Gibson, D. M., et al. (2012). Farm-scale nitrogen, phosphorus, potassium and sulfur balances and use efficiencies on Australian dairy farms. Anim. Prod. Sci. 52, 929–944. doi: 10.1071/AN11337
Hafner, S. D., Pacholski, A., Bittman, S., Carozzi, M., Chantigny, M., Génermont, S., et al. (2019). A flexible semi-empirical model for estimating ammonia volatilization from field-applied slurry. Atmos. Environ. 199, 474–484. doi: 10.1016/j.atmosenv.2018.11.034
Hjorth, M., Christensen, K. V., Christensen, M. L., and Sommer, S. G. (2010). Solid–liquid separation of animal slurry in theory and practice. A review. Agron. Sustain. Dev. 30, 153–180. doi: 10.1051/agro/2009010
Holly, M. A., Larsona, R. A., Powell, J. M., Ruarkcm, M. D., and Aguirre-Villegaset, H. (2017).Greenhouse gas and ammonia emissions from digested and separated dairy manure during storage and after land application. Agric. Ecosyst. Environ. 239, 410–419. doi: 10.1016/j.agee.2017.02.007
Husfeldt, A. W., Endres, M. I., Salfer, J. A., and Janni, K. A. (2012). Management and characteristics of recycled manure solids used for bedding in Midwest freestall dairy herds. J. Dairy Sci. 95, 2195–2203. doi: 10.3168/jds.2011-5105
Li, Y. (2019). Forage crop nitrogen recovery and nitrogen field-losses determined on semi-virtual dairy farms under integrated nutrient and crop management scenarios (MSc thesis). Vancouver, BC: University of British Columbia.
Luttmerding, H. (1981). Soils of the Langley-Vancouver Map Area. Technical Data: Soil Profile Descriptions and Analytical Data, Vol. 6. Province of British Columbia, Ministry of Environment, Assessment and Planning Division.
McGill, W. B., and Figueiredo, C. T. (1993). Chapter 22 “Total nitrogen,” in Soil Sampling and Methods of Analysis, ed M. R. Carter (Boca Raton, FL: Canadian Society of Soil Science; Lewis Publishers, CRC Press), 201–211.
Miller, J. J., and Curtin, D. (2008). “Electrical conductivity and soluble ions,” in Section 15 Soil Sampling and Methods of Analysis, 2nd Edn, eds M. R. Carter and E. G. Gregorich (Boca Raton, FL: Canadian Society of Soil Science CRC Press; Taylor and Francis Group), 161–172.
Mukhtar, S., Borhan, M. S., and Beseda, J. II. (2011). Evaluation of a weeping wall solid-liquid separation system for flushed dairy manure. Appl. Eng. Agric. 27, 135–142. doi: 10.13031/2013.36223
Neufeld, K. R., Grayston, S. J., Bittman, S., Krzic, M., Hunt, D. E., and Smukler, S. M. (2017). Long-term alternative dairy manure management approaches enhance microbial biomass and activity in perennial forage grass. Biol. Fertil. Soils 53, 613–626. doi: 10.1007/s00374-017-1204-2
Piepho, H.-P. (2012). A SAS macro for generating letter displays of pairwise mean comparisons. Commun. Biometry Crop Sci. 7, 4–13.
Rochette, P. (2011). Towards a standard non-steady-state chamber methodology for measuring soil N2O emissions. Anim. Feed Sci. Technol. 166, 141–146. doi: 10.1016/j.anifeedsci.2011.04.063
Rochette, P., and Eriksen-Hamel, N. S. (2008). Chamber Measurements of Soil Nitrous Oxide Flux: Are Absolute Values Reliable? Soil Sci. Soc. Am. J. 72, 331–342. doi: 10.2136/sssaj2007.0215
Rochette, P., Worth, D. E., Lemke, R. L., McConkey, B. G., Pennock, D. J., Wagner-Riddle, C., et al. (2008). Estimation of N2O emissions from agricultural soils in Canada. I. Development of a country-specific methodology. Can. J. Soil. Sci. 88, 641–654. doi: 10.4141/CJSS07025
Schils, R. L. M., Van Groenigen, J. W., Velthof, G. L., and Kuikman, P. J. (2008). Nitrous oxide emissions from multiple combined applications of fertiliser and cattle slurry to grassland. Plant Soil 310, 89–101. doi: 10.1007/s11104-008-9632-2
Schröder, J. J., Uenk, D., and Hilhorst, G. J. (2007). Long term nitrogen fertilizer replacement value of cattle manures applied to cut grassland. Plant Soil 299, 83–99. doi: 10.1007/s11104-007-9365-7
Sheppard, S., Bittman, S., Swift, M., Beaulieu, M., and Sheppard, M. (2011). Ecoregion and farm size differences in dairy feed and manure nitrogen management: a survey. Can. J. Anim. Sci. 91, 459–473. doi: 10.4141/cjas2010-004
Sheppard, S. C., and Bittman, S. (2015). Linkage of food consumption and export to ammonia emissions in Canada and the overriding implications for mitigation. Atmos. Environ. 103, 43–52. doi: 10.1016/j.atmosenv.2014.12.023
Smith, K. A., McTaggart, I. P., Dobbie, K. E., and Conen, F. (1998). Emissions of N 2 O from Scottish agricultural soils, as a function of fertilizer N. Nutr. Cycl. Agroecosyst. 52, 123–130. doi: 10.1023/A:1009781518738
Søgaard, H. T., Sommer, S. G., Hutchings, N. J., Huijsmans, J. F. M., Bussink, D. W., and Nicholson, F. (2002). Ammonia volatilization from field-applied animal slurry—the ALFAM model. Atmos. Environ. 36, 3309–3319. doi: 10.1016/S1352-2310(02)00300-X
Sommer, S. G., Jensen, L. S., Clausen, S. B., and Sogaard, H. T. (2006). Ammonia volatilization from surface-applied livestock slurry as affected by slurry composition and slurry infiltration depth. J. Agric. Sci. 144, 229–235. doi: 10.1017/S0021859606006022
Tatti, E., Goyer, C., Chantigny, M., Wertz, S., Zebarth, B. J., Burton, D. L., et al. (2014). Influences of over winter conditions on denitrification and nitrous oxide-producing microorganism abundance and structure in an agricultural soil amended with different nitrogen sources. Agric. Ecosyst. Environ. 183, 47–59. doi: 10.1016/j.agee.2013.10.021
Van der Weerden, T. J., Clough, T. J., and Styles, T. M. (2013). Using near-continuous measurements of N2O emission from urine-affected soil to guide manual gas sampling regimes. N. Zeal. J. Agric. Res. 56, 60–76. doi: 10.1080/00288233.2012.747548
Velthof, G. L., Oenema, O., Postma, R., and Van Beusichem, M. L. (1997). Effects of type and amount of applied nitrogen fertilizer on nitrous oxide fluxes from intensively managed grassland. Nutr. Cycl. Agroecosyst. 46, 257–267. doi: 10.1007/BF00420561
Wagner-Riddle, C., Hu, Q. C., van Bochove, E., and Jayasundara, S. (2008). Linking nitrous oxide flux during spring thaw to nitrate denitrification in the soil profile. Soil Sci. Soc. Am. J. 72, 908–916. doi: 10.2136/sssaj2007.0353
Wagner-Riddle, C., and Thurtell, G. W. (1998). Nitrous oxide emissions from agricultural fields during winter and spring thaw as affected by management practices. Nutr. Cycl. Agroecosyst. 52, 151–163. doi: 10.1023/A:1009788411566
Webb, J., Pain, B., Bittman, S., and Morgan, J. (2010). The impacts of manure application methods on emissions of ammonia, nitrous oxide and on crop response—a review. Agric. Ecosyst. Environ. 137, 39–46. doi: 10.1016/j.agee.2010.01.001
Westhoek, H., Lesschen, J. P., Rood, T., Wagner, S., De Marco, A., Murphy-Bokern, D., et al. (2014). Food choices, health and environment: effects of cutting Europe's meat and dairy intake. Glob. Environ. Change 26, 196–205. doi: 10.1016/j.gloenvcha.2014.02.004
Keywords: emission factor, fertilizer, whole slurry, separated liquid fraction, crop N uptake, freeze-thaw cycles, dry-wet cycles, grassland
Citation: Hunt D, Bittman S, Chantigny M and Lemke R (2019) Year-Round N2O Emissions From Long-Term Applications of Whole and Separated Liquid Dairy Slurry on a Perennial Grass Sward and Strategies for Mitigation. Front. Sustain. Food Syst. 3:86. doi: 10.3389/fsufs.2019.00086
Received: 18 June 2019; Accepted: 19 September 2019;
Published: 18 October 2019.
Edited by:
Rachel E. Thorman, ADAS, United KingdomReviewed by:
José L. S. Pereira, Instituto Politecnico de Viseu, PortugalJoão Coutinho, University of Trás-os-Montes and Alto Douro, Portugal
David Fangueiro, University of Lisbon, Portugal
Copyright © 2019 Hunt, Bittman, Chantigny and Lemke. This is an open-access article distributed under the terms of the Creative Commons Attribution License (CC BY). The use, distribution or reproduction in other forums is permitted, provided the original author(s) and the copyright owner(s) are credited and that the original publication in this journal is cited, in accordance with accepted academic practice. No use, distribution or reproduction is permitted which does not comply with these terms.
*Correspondence: Shabtai Bittman, c2hhYnRhaS5iaXR0bWFuQGNhbmFkYS5jYQ==