 Uta Priegnitz
 Willemien J. M. Lommen
 Stephen Onakuse
 Paul C. Struik
- 1Centre for Crop Systems Analysis, Wageningen University and Research, Wageningen, Netherlands
- 2Food Business and Development and the Centre for Sustainable Livelihoods, University College Cork, Cork, Ireland
In Uganda, low productivity of potato might be associated with poor and diverse adoption of innovative crop management practices. This paper aims to identify the potato farm typologies in southwestern Uganda, i.e., collections of farms that are homogeneous in uptake of innovations (use of fertilizer, organic input, fungicides, pesticides, seed selection methods, seed refreshment by using quality declared seed, and sole cropping), and to analyse these typologies based on socio-economic characteristics, access to agricultural extension services, memberships of farmers' groups, yield levels of potato and return rates. A farm household survey (n = 270) was carried out and principal component analysis and cluster analysis were used to identify types of farms differing in adoption of innovations. Four farm types were identified that demonstrated significant differences in uptake of innovation practices; despite the small differences in yield among farm types, differences in uptake were associated with significant differences in the yield and further in land ownership, availability of laborers and cash, economical return, and access to knowledge. The farm type with relatively high frequencies of using organic input, fungicide input, pesticide input, seed plot technology or positive selection, quality declared seed, and sole cropping achieved highest potato productivity; the farm type with relatively frequent use of fungicide input and no use of pesticides was associated with the lowest potato yield. The findings emphasize associations between innovation uptake and farm characteristics. Opportunities for improvement through extension services and shared knowledge can achieve wider adoption, enhance potato productivity and increase income for smallholder farmers.
Introduction
The agricultural sector in Uganda plays a vital role in food security, poverty reduction, economic development, and income generation (Diao et al., 2010; Salami et al., 2010; Benin et al., 2012; Proctor, 2014). Uganda is dominated by small-scale farms with an average size of 0.97 ha (Food and Agriculture Organization of the United Nations, 2018). In the agro-ecological zone montane system in southwestern Uganda, potato (Solanum tuberosum L.) is important for food security and cash income for the smallholder farmers (Wortmann and Eledu, 1999; Gildemacher et al., 2009b; Okoboi et al., 2014). Introduced already in the early 20th century by colonial administrators (International Potato Center, 2006), the potato has multiple agronomic advantages above other traditional food crops, including a short cropping cycle, high production per unit area and per unit of water, and a highly nutritious produce (Woldegioris et al., 2013; Haverkort and Struik, 2015). Potato often serves as a hunger breaking crop during food shortages, especially in Eastern Africa (Gildemacher, 2012; Haverkort and Struik, 2015).
The districts Kabale and Kisoro, located in the Kigezi highlands (1,500–3,000 m a.s.l.) in southwestern Uganda where potato is traditionally grown, are the most important production areas of potato (Kaguongo et al., 2008; Bonabana-Wabbi et al., 2013). Kabale produced more than 45,578 Mg of potato tubers and Kisoro more than 25,617 Mg of potato tubers in the year 2008/09 (census from July 2008 until September 2009; Ugandan Bureau of Statistics, 2017). Together, this comprised more than 46% of the total national potato production in Uganda (Ugandan Bureau of Statistics, 2017). The local environmental conditions of the mountainous districts are favorable for potato cultivation, with mild temperatures, abundant rainfall, and deep volcanic soils (Ferris et al., 2002). However, the national mean potato yield was ~7 Mg ha−1 in the years 1999–2007 (Food and Agriculture Organization of the United Nations, 2018), and since 2008 it has been in decline to <5 Mg ha−1 in 2016 (Food and Agriculture Organization of the United Nations, 2018). This yield is low in comparison to the production statistics of many other countries and considering that a yield of 25 Mg ha−1 is attainable (International Potato Center, 2011). In the neighboring country Rwanda, with similar agro-ecological conditions, the average yield is found to be 14.2 Mg ha−1 (Knoema, 2016).
In Uganda several major constraints are causing these low yields for smallholder farmers: lack of adoption of proper soil fertility management, lack of adoption of pesticides and fungicides to combat pests and diseases, lack of use of clean and improved seed tubers, and lack of sole potato cropping (Manrique, 1993; Struik and Wiersema, 1999; Gildemacher et al., 2009a,b; International Potato Center, 2011; Schulte-Geldermann et al., 2013; Wang'ombe and van Dijk, 2013; Thomas-Sharma et al., 2016). A study from 2005 by Gildemacher (2012) showed that only 4.7% of the farmers used chemical fertilizer, and only 17.7% used farmyard manure. Okoboi et al. (2014) found in their study from 2008/09 that in the Kigezi region 18.1% of the farmers used fertilizers, 29.2% of the farmers used fungicides, and 0.5% of the farmers used quality seed. Supply of seed to farmers by private and semi-public sector institutions is rare in East-African countries (Tadesse et al., 2016). Moreover, sole potato cropping can lead to significantly higher yields and an increase in tuber yield per plant compared to intercropping (Manrique, 1993). These yield constraints can be summarized as inadequate agricultural practices related to poor adoption of innovative management practices to enhance the yield of the potato crop. Innovations are defined here as “an idea, practice, or object that is perceived as new by an individual or other unit of adoption” (Rogers and Everett, 1983).
To produce quality seed potatoes for improving potato yield, two innovative applications of low-cost technologies have been promoted by extension officers, namely positive selection (PS) and the seed plot technology (SPT)1 (Kakuhenzire et al., 2005; Gildemacher et al., 2007). The common way in Uganda of choosing seed tubers for the next season consists of selecting tubers from the bulk of the harvest from the ware potato crop. Furthermore, farmers can buy quality declared seed tubers from the seed grower association UNSPPA (Ugandan National Seed Potato Production Association) or from KAZARDI (Kachwekano Zonal Agriculture Research and Development Institute).
Although programmes and initiatives from the agricultural extension service promote the use of innovations (Okoboi et al., 2014), little research has been undertaken to assess their uptake. Variation in adoption of innovative management practices which enhance potato yield and economical crop return, is associated with differences in socio-economic characteristics of the farm households and in their access to agricultural extension services (Bidogeza et al., 2009; Tadesse et al., 2017). All farm resources (e.g., land, labor, cash for investment) are the foundation of a farmer's wealth and the economic capacity of his farming system (Tittonell et al., 2010) and are classified in socio-economic characteristics and potato farming attributes. Agricultural extension services, either public or private, as well as farmer groups, act as advisors, providing valuable knowledge and information with regards to the use and adoption of innovative management practices (Ortiz et al., 2013). Rogers and Everett (1983) also demonstrated that farmers having contacts outside their local community were more open to adopting new management techniques.
To increase potato production for improved food and cash security it is critical to understand the complexity of smallholder farms in Uganda and to understand the use of appropriate technological innovations (Tittonell et al., 2010; Giller et al., 2011). To get insights in the diverse and specific farm types it is necessary to evaluate the uptake of innovations in the potato production system in combination with the socio-economic characteristics (cf. Kuivanen et al., 2016), the access to extension services and the variation in yield among potato farmers. Farmers in southwestern Uganda are faced with limitations like shortage of land for crop production (Salami et al., 2010; Whitney et al., 2018); potato was specifically promoted for land scarce farm households (Aliguma et al., 2007). Additionally, land degradation due to soil nutrient depletion contributes to a decrease in agriculture production in Uganda (Pender et al., 2004; Nkonya et al., 2008; Kirui and Mirzabaev, 2014).
Therefore, the development of farm typologies is a first but pivotal step to analyse the adoption of innovative farm management practices in smallholder farms. Such typologies could help to support more robust policy interventions and advisory programmes to enhance the adoption of techniques to increase potato yields (Banerjee et al., 2014). They can also be used to help develop more suitable agricultural policies for less-favored regions (Ruben and Pender, 2004).
This study explores the uptake of innovative management practices of smallholder potato production in southwestern Uganda and the packages of practices in which farmers have adopted them. Adoption of innovative agricultural management is defined here in terms of the following improved practices: (i) use of chemical fertilizer, (ii) use of organic inputs, (iii) use of fungicides, (iv) use of pesticides, (v) use of either SPT and/or PS, (vi) use of KAZARDI and/or UNSPPA seed, and (vii) use of sole cropping of potato. These improved practices were used to form clusters of farms based on how innovations were taken up by farmers. For these clusters, differences in their socio-economic characteristics, additional potato farming practices and access to extension services were assessed. The final result is the identification of potato farm typologies with different potato productivity and returns for the southwestern Ugandan region.
The main objective of this research is to define farm typologies based on the uptake of innovative farm management practices in potato cultivation. Specific objectives of this paper are (i) to assess the variation in the uptake of innovative farm management for potato cultivation; (ii) to identify relevant packages of innovations (clusters) taken up by various farm types using Principal Component Analysis (PCA) and Cluster Analysis (CA), and (iii) to generate farm types with different production systems thereby exploring how yields, economical return, socio-economic characteristics, and access to extension services differ among the typologies.
Based on this analysis, the adoption of specific agronomic management practices in different farm types can be better understood. This can then be used to help implement policies, which could better support potato farmers in the Kabale and Kisoro districts of Uganda. Our analysis identifies farm-specific constraints and opportunities for agricultural development and interventions.
Materials and Methods
This study assessed and characterized the adoption of innovative farm management practices and explored associated potato yields and farm types in southwestern Uganda in three steps. First, general potato production and management characteristics were assessed through literature review, field observations, and discussions with key informants, including farmers and personnel from the Kachwekano Zonal Agriculture Research and Development Institute (KAZARDI), Uganda. The second step included the use of a semi-structured questionnaire to collect detailed information from smallholder potato farmers in the region. In the third step, the collected data were analyzed using PCA and CA to identify homogeneous groups differing in uptake of innovations and in farm type.
Study Area and Survey
A semi-structured questionnaire was used in the districts Kabale and Kisoro (southwestern highlands of Uganda) to collect data on potato production practices by smallholder potato farmers. These districts were selected because they represent the major potato cropping areas in Uganda (Kaguongo et al., 2008; Bonabana-Wabbi et al., 2013; Ugandan Bureau of Statistics, 2017; Figure 1). The districts are located close to the borders of Rwanda and the Democratic Republic of Congo, and about 340 km west of the capital Kampala (distance Kampala to Kabale town). Kabale and Kisoro are located at altitudes ranging from 1,500–3,000 m a.s.l. (Bonabana-Wabbi et al., 2013) and belong to the agro-ecological zone montane system (Kabeere and Wulff, 2008). The annual rainfall in the montane system zone varies between 1,000 and 1,500 mm, mainly distributed over two rainy seasons, from March to May and from September to November (Low, 2000; Ferris et al., 2002).
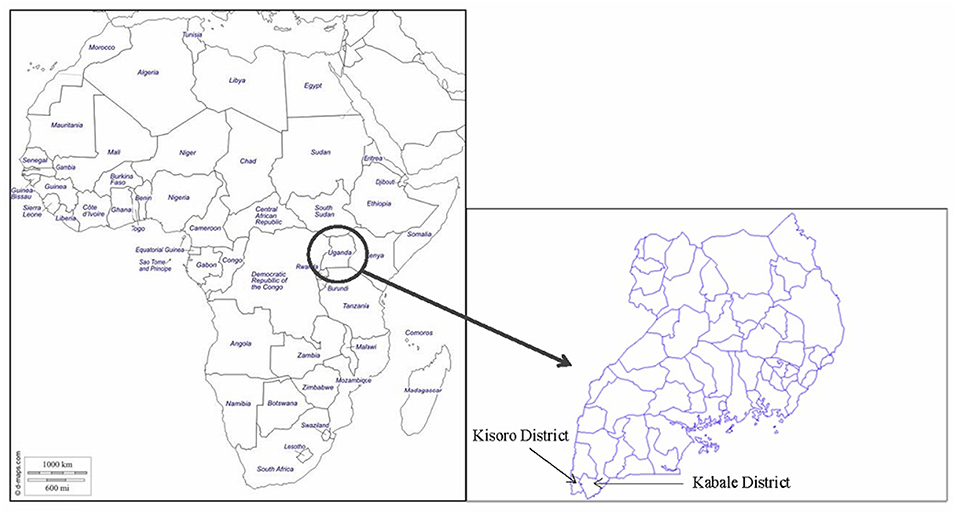
Figure 1. Geographic location of the study site.
The semi-structured questionnaire was pre-tested in December 2013 and April 2014 with 15 farmers in Kabale and Kisoro districts. The questionnaire was then refined and revised with closed and open-end questions to enhance further discussion. In total, 270 farmers were interviewed face-to-face in the local language by specifically trained enumerators in June 2014, 141 farmers in Kabale district and 129 farmers in Kisoro district (Appendix, Table A1). A district represents the administrative division by the local government and is further divided into counties, sub-counties, parishes, and finally into villages. Four sub-counties per district (Appendix, Table A1) were randomly selected from the 19 sub-counties in Kabale district and the 14 sub-counties in Kisoro district. Per sub-county, the National Agricultural Advisory Service (NAADS) agents mobilized potato farmers to gather at a meeting point; from there, farmers were randomly selected for the interviews. Farmers from 16 parishes in the four sub-counties of the Kabale district and from 11 parishes in the four sub-counties in the Kisoro district were present. From the 270 interviews, 11 surveys were excluded in the analysis because the respondents were not the household head or spouse. Therefore, 259 interviews were retained in the analysis.
The information collected (Table 1) included characteristics of the farm household head or spouse (name, gender, age, education, household size, and occupation), of the farm (total crop area, crop diversity), information on hired and family farm labor, access to advisory service and farmer groups, and on the potato crop on the farm (area for potato production, production season, potato management practices (including adoption of innovations, potato varieties grown, seed source), occurrence of pests and diseases in the potato crop, yield, market price, and awareness of the existence of seed selection techniques). Cropping area was recorded in acres (1 ha is equal to 2.47 acres) and derived from the farmers' estimation by using equivalent known areas, i.e., a soccer pitch. All costs were reported and calculated in Ugandan Shillings (UGX) and finally converted to US Dollar (exchange rate 30th June 2014: 1 USD = 2,600 UGX).
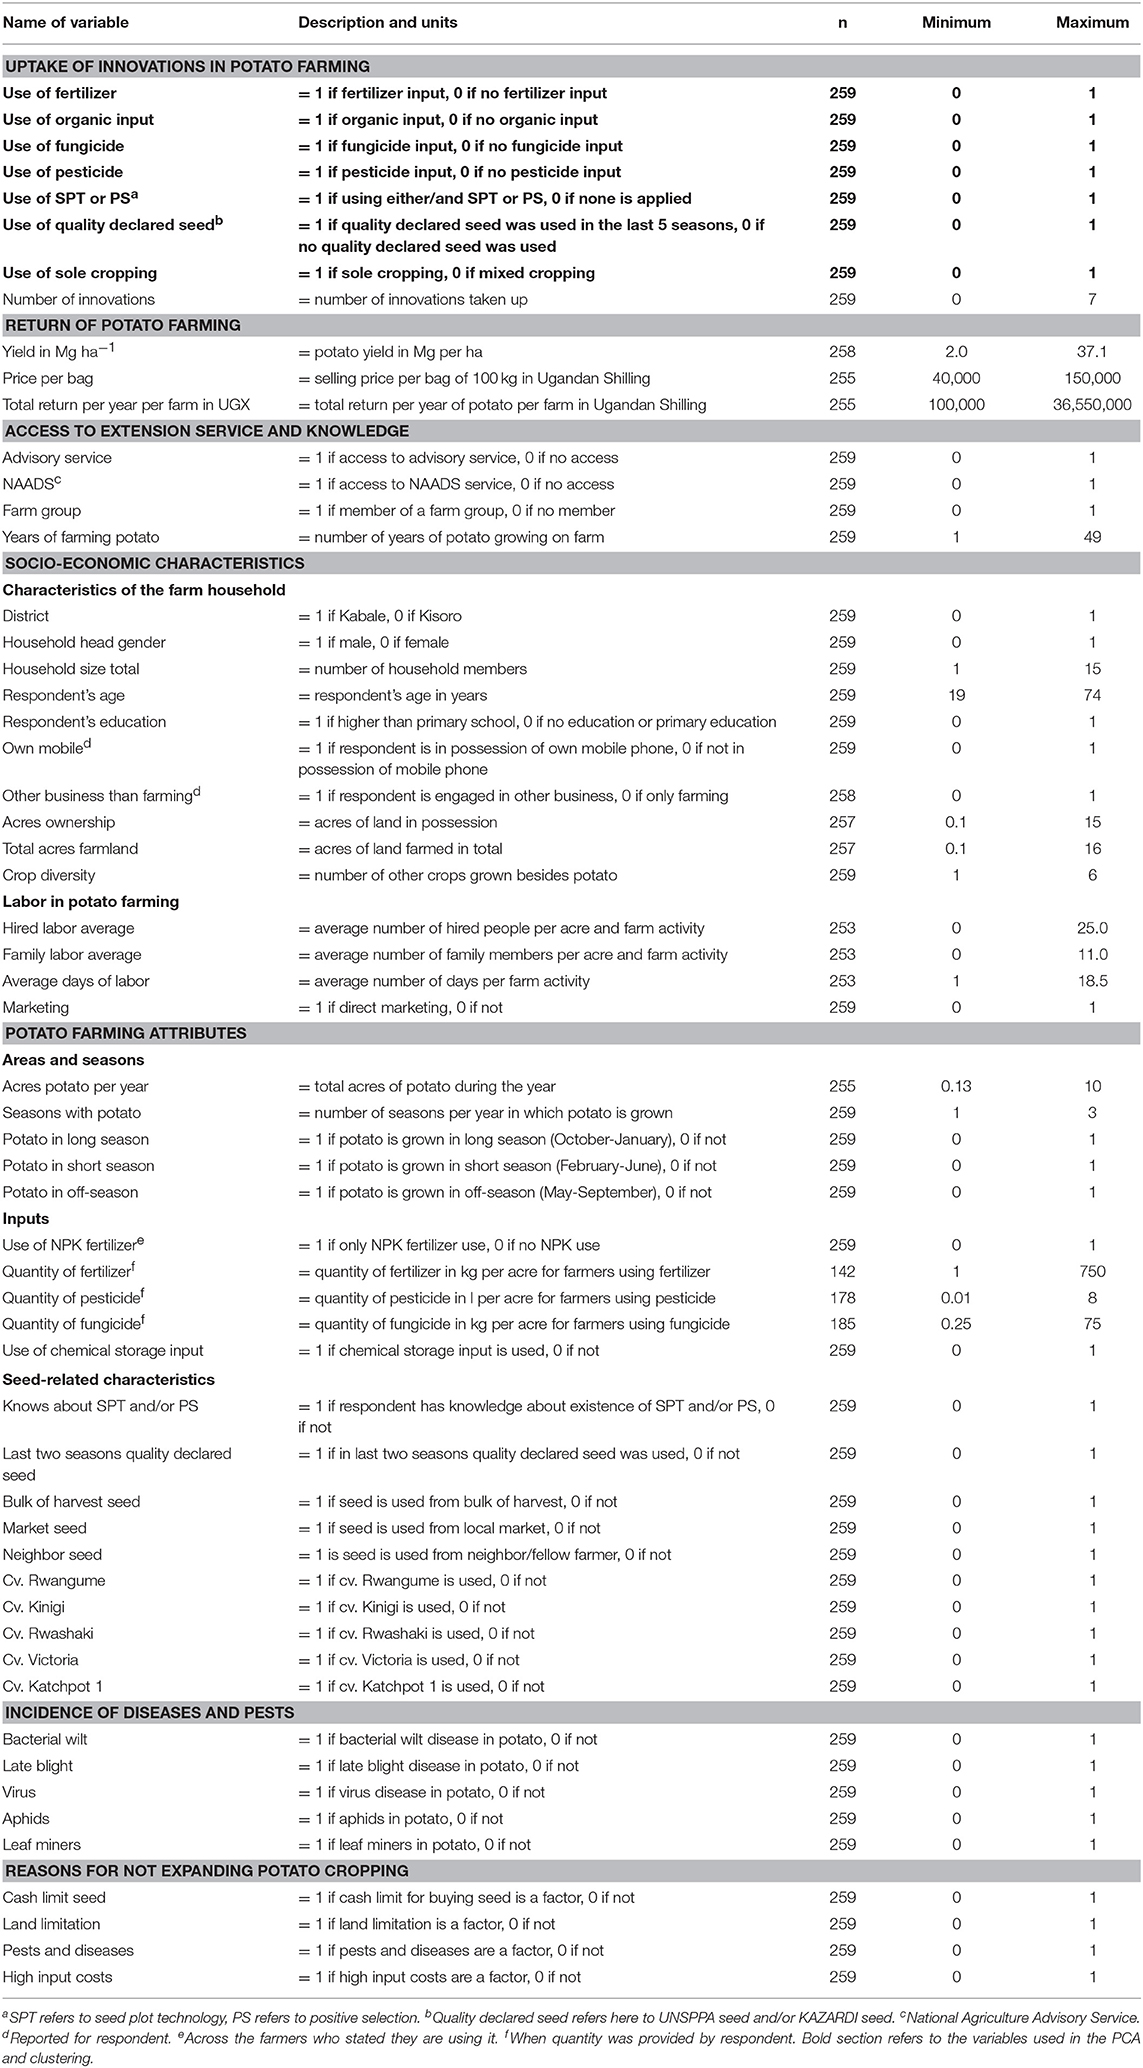
Table 1. Description of the variables, units, number of respondents, and minimum and maximum values of the variables used in the principal component analysis and cluster creation (variables in bold), and the subsequent characterization of farm types.
Our research was carried out with informed oral consent by all participants. Confidentiality of all information from all respondents was secured. Research protocols guaranteed that it was impossible to link published, aggregated data to individuals. We followed the applicable guidelines and regulations for ethics that are common for surveys as reported in this paper. Based on consultation with the applicable ethical committee of Wageningen University and specialists in Uganda, we were assured that under such conditions, special permission from the Wageningen University ethical committee was not required.
Data Analysis
Data analysis was done using SPSS (Statistical Package for Social Science), version 23.0. A multivariate approach was used to construct farm typologies. First, a principal component analysis (PCA) was used to reduce the number of variables into a new set of components. Seven variables regarding uptake of innovative farm management practices were chosen for the PCA (use of fertilizer, use of organic input, use of fungicide, use of pesticide, use of SPT and/or PS, use of quality declared seed (in the last five seasons) and use of sole cropping of potato (vs. intercropping it). Four principal components exceeding, according to Kaiser's criterion, an eigenvalue of 1.00 were retained (Table 2). The Kaiser-Meyer-Olkin (KMO) measure for sampling adequacy indicated a relatively low value of 0.4; however, Bartlett's test of sphericity with an associated p-value of <0.001 indicated that the analysis would be valid. Evaluating the correlations between the factors and the four components, a loading of >0.50 was considered for deciding of how many components to be used. With the identified components, a hierarchical, agglomerative cluster analysis (CA) was carried out using Ward's method to minimize the variance within a cluster and squared Euclidean distance for measuring the distances. The agglomeration process leading to clusters of farms that differed in the uptake of innovations is presented in the dendrogram (Figure 2).
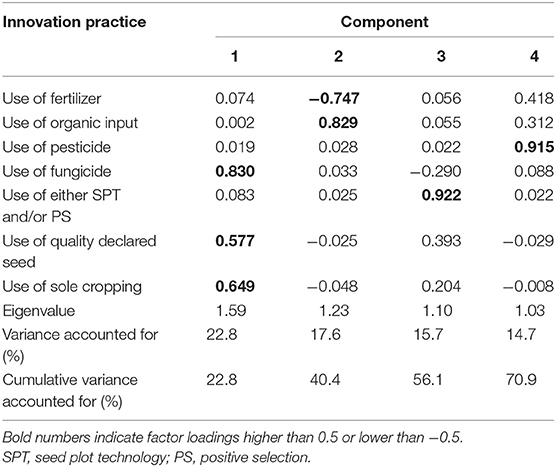
Table 2. Factor loadings from the four components resulting from the Principal Component Analysis with eigenvalues and percentages variance explained.

Figure 2. Dendrogram for the Cluster Analysis. On top are the codes “1” for “use” or “0” for “non-use” of innovations (Fert, Fertilizer input; Org, Organic input; Fung, Fungicide input; Pest, Pesticide input; SPT_PS, use of SPT and/or PS; QDS, use of quality declared seed; Sole, use of sole crop) which lead to the clustering. The dashed line represents the agglomeration coefficient (the distance between the clusters) and the selected cut-off point for forming the four cluster solutions.
After clustering based on the uptake of innovations, one-way ANOVA was used to test for significant differences between clusters for all variables in the categories “uptake of innovations,” “socio-economic characteristics,” “potato farming attributes,” “access to extension service and knowledge,” and “returns of potato farming”. The variables from the first four categories that differed significantly between clusters were used to characterize the farm type of a cluster, the variables from the last class were used to describe the returns of that farm type. Fisher's LSD test was used for mean separation between the clusters. Finally, based on the analysis distinguished characteristics were used for determining the wealth of the farm type.
Results
General Characteristics
Socio-economic Characteristics
Characteristics of the farm and farm households
Of the respondent's households, 88% were male headed (Table 3); the average respondent age was 42.6 years and 25% of the respondents had an education higher than primary school. Total household size was on average 6.7 people. Farmers had on average 2.66 acres of farmland, of which they owned on average 2.30 acres. Only 23% of the respondents were engaged in businesses other than farming. Other crops grown on the farm beside potato were maize, beans, sorghum, sweet potato, and other crops (data not shown).
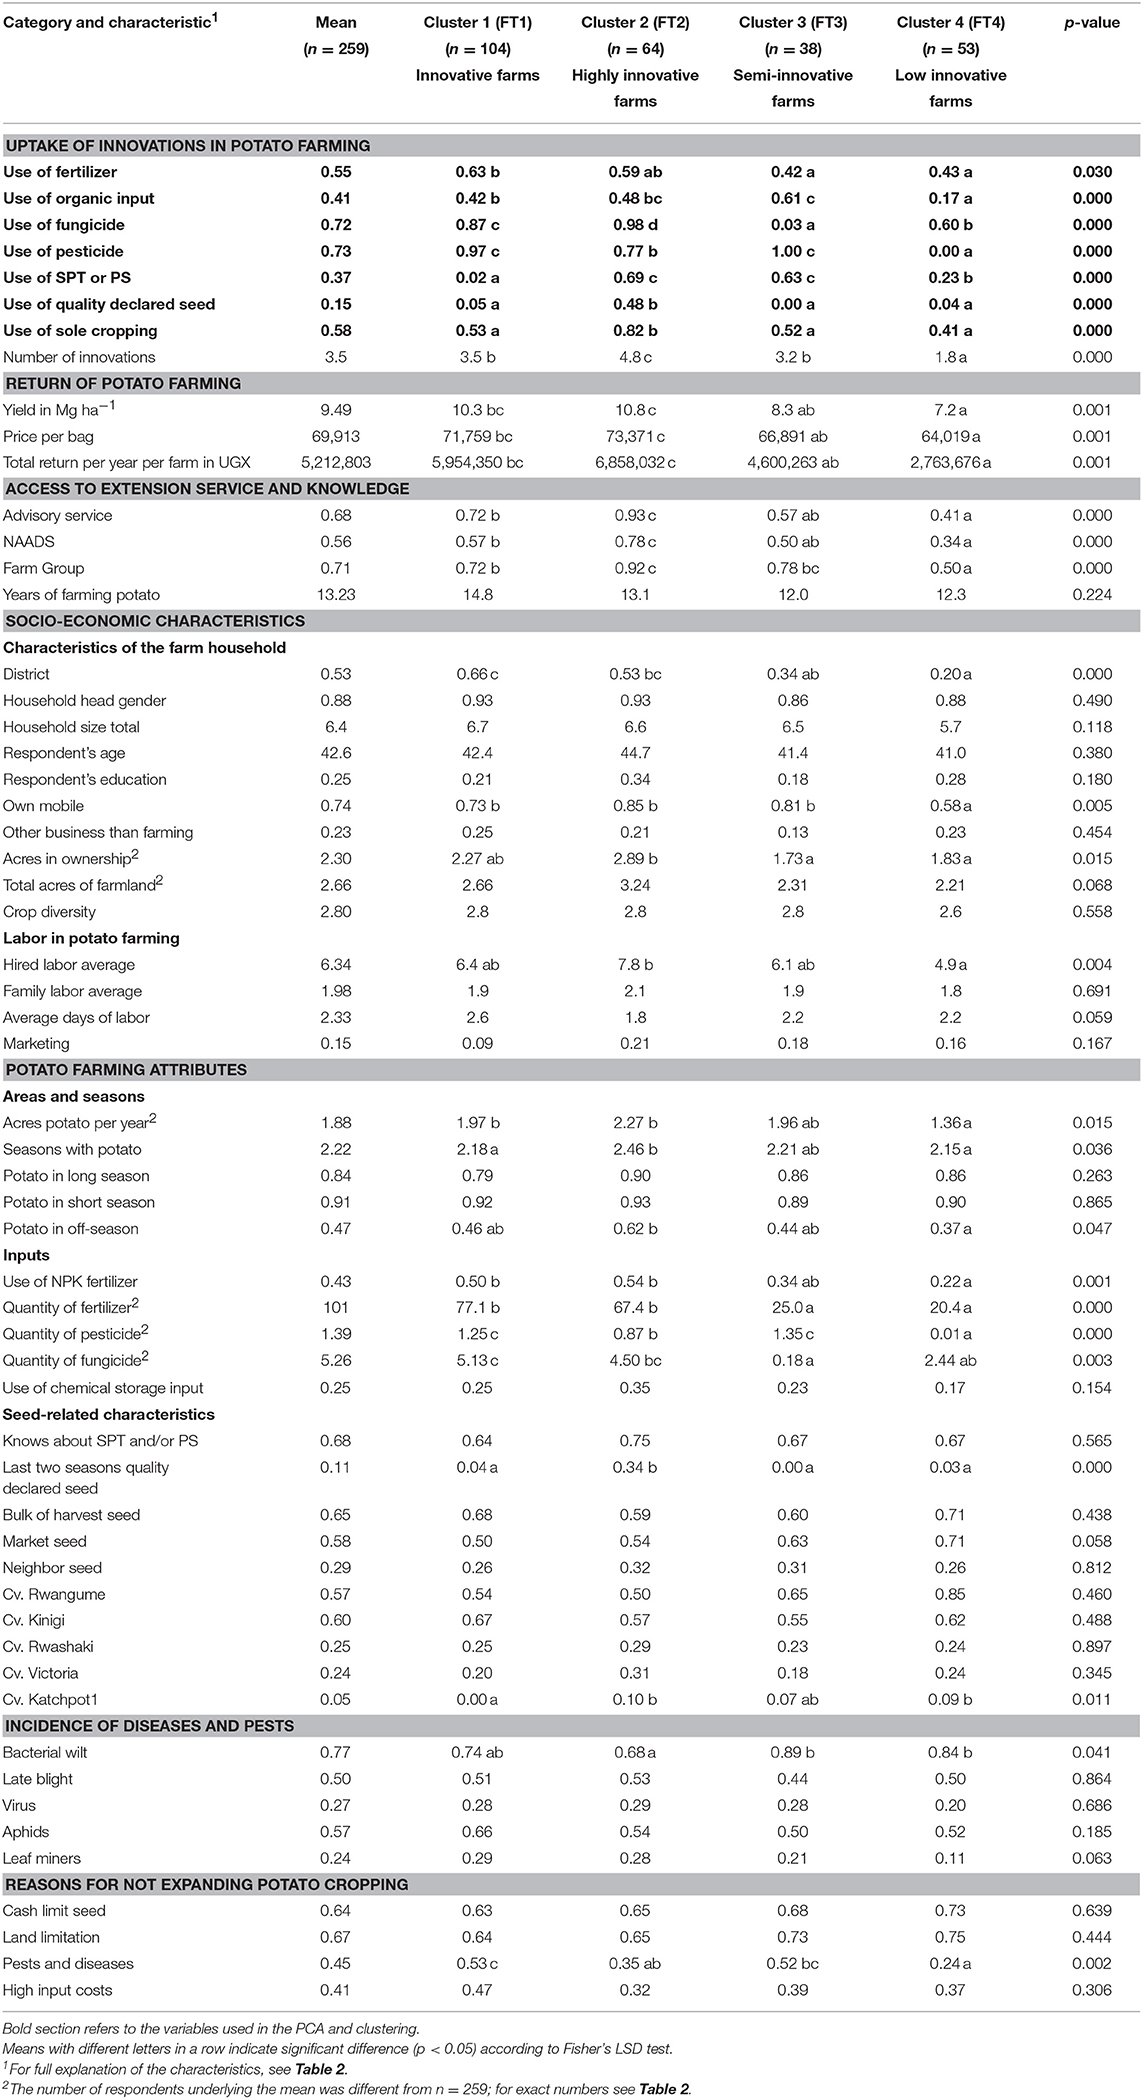
Table 3. Characteristics of the farm households and the four identified farm typologies including the p-value of one-way analysis of variance of differences between farm types.
Labor in potato farming
Per management practice (1st land plowing, 2nd land plowing, planting, weeding, spraying, harvesting), on average 6.3 laborers per acre were hired. Family labor input was on average 1.9 people per acre. The average number of days per management practice was 2.3 days.
Potato Farming Attributes
Areas and seasons
The potato farming attributes (Table 3) show that potato was grown in three seasons; 84% of the farmers grew potato in the long season (October–January), 91% in the short rainy season (February–June), and 47% in the off-season (May–September). Per year, per farm an average of 1.88 acres of land were dedicated to potato farming.
Seed-related characteristics
Most farmers planted seed tubers that were selected from the bulk of their own harvest (65%), and/or bought on the market (58%); seed was also obtained from neighbors and/or fellow farmers (29%) (Table 3, potato farming attributes). In the last two seasons, 11% had been using quality declared seed (Table 3, potato farming attributes). Of all farmers, 68% stated they knew about SPT and/or PS (Table 3, potato farming attributes). The most frequently grown cultivars were Kinigi (grown by 60% of the farmers), Rwangume (grown by 57%), Rwashaki (25%), and Victoria (grown by 24%) (Table 3, potato farming attributes).
Incidence of diseases and pests, reasons for not expanding potato cropping
Major diseases reported were bacterial wilt (77%) and late blight (50%). Aphids (57%) were reported as the major pest (Table 3, potato farming attributes). The main reasons for not expanding potato cropping was land scarcity (67%) or not enough cash to buy seed potatoes (64%) (Table 3, potato farming attributes).
Uptake of Innovations in Potato Farming
Regarding uptake of innovations (Table 3), 55% of the farmers used fertilizer on potato, 41% used organic inputs, 72% used fungicides, and 73% used pesticides. Fertilizer was applied with an average amount of 101.2 kg/acre (Table 3, potato farming attributes). Farmers who used fertilizer were mostly using NPK fertilizer (42% of the farmers). Pesticide was applied with an average of 1.4 liter/acre, and fungicide with 5.2 kg/acre. Quality declared seed, like seed from UNSPPA or KAZARDI, was used in the last five seasons only by 15% of the farmers (Table 3, uptake of innovations). Of the farmers, 68% knew about PS and/or SPT (Table 3, potato farming attributes), whereas 37% of all farmers stated they actually used it (Table 3, uptake of innovations). Potato was sole cropped by 58% of the farmers. The rest of them used potato in a mixed cropping system, mainly mixing potato with beans and/or maize. On average, farmers had taken up 3.5 innovations out of the seven, in different packages (Table 3).
Return of Potato Farming
In relation to return of potato farming (Table 3), farm households achieved an average yield of 9.5 t/ha, with a selling price per 100 kg bag of around 29 USD (69,913 UGX). Yield and selling price were variable: reported yield varied between 2.0 and 37.1 Mg ha−1 (8–150 bags of 100 kg per acre) and selling price varied between 40,000 and 150,000 UGX per bag (equates to 15.38 USD to 57.70 USD per bag of 100 kg).
Access to Extension Services and Knowledge
Of the farm households, 68% had access to any of the agricultural extension services (NAADS, Africa 2000 Network, International Fertilizer Development Center or A2N) (Table 3) and 56% of all farm households had access to NAADS; 71% stated they were member of a farm group. The farm household had between 1 and 49 years of experience with growing potato, with an average of 13 years (Table 3).
Principal Component Analysis Results and Clustering of Farms Based on Uptake of Innovative Potato Practices
The PCA on the seven variables regarding uptake of innovations resulted in the extraction of four principal components, accounting together for 70.9% of the total variance (Table 2). The first component accounted for the greatest share of the variance with 22.8%. This correlated positively with use of fungicide, use of quality declared seed potatoes, and with sole cropping of potato suggesting the uptake of these practices was related. The second component explained 17.6% of the variance; it correlated positively with organic input use and negatively with chemical fertilizer application, suggesting the uptake of these practices was, to some extent mutually exclusive. The third component accounted for 15.7% of the variance; it correlated positively with adoption of PS and/or SPT. This suggests that the uptake of these particular practices could be used to identify farms that fall into a cluster. Finally, the fourth component explained 14.7% of the variance; it correlated with the adoption of use of pesticides, again suggesting the possibility of identifying farms in a cluster through use of pesticides alone.
The clustering procedure resulted in the agglomeration schedule and the four-cluster-cut-off points in the dendrogram (Figure 2). Based on studying innovation use the uptake or no uptake is shown in the dendrogram with code “1” for uptake, and code “0” for no uptake. In the dendrogram (Figure 2), it is shown that Cluster 4 separates from all other clusters largely based on the non-use of pesticides, while in the other clusters (especially 1 and 3) they are used widely. This is in line with PC4 showing significant correlations with the use of pesticides (Table 2). After Cluster 4, Cluster 1 separates from Cluster 2 and 3, largely based on the almost non-use of SPT and/or PS, which is related to PC3 in Table 2. Finally, Cluster 2 separates from Cluster 3, likely based on the use of the factors showing correlations with PC1 (use of sole cropping, use of quality declared seed, and use of fungicides). The innovations correlating to PC2 (use of fertilizer and organic input) will explain differences between the higher order of branches seen within the dendrogram within a cluster. The farm households thus were grouped into four clusters for which the farm types were assessed. These four typologies were grouped based on the uptake of innovations. Then they were characterized for the different characteristics with respect to use of innovations, socio-economic features, access to extension services, and returns of potato farming.
Farm Type Characterization From Clusters
Table 3 shows the resulting four different clusters described as farm types (FT) with their characteristics. For naming the farm types, distinctive characteristics of the innovation uptake were used that are based on number of innovation (Table 3, Figure 3). The characterization of the innovations taken up in the different farm types was based on the significant differences, where values not differing significantly from the lowest value were eliminated as characterizing a specific farm type (Figure 3).
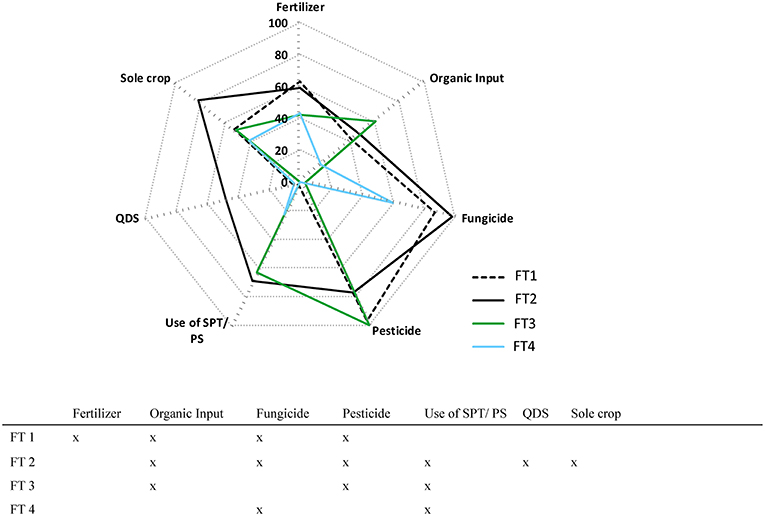
Figure 3. Percentages of farm households in each Farm Type (FT) which are using the individual innovations; the table underneath represents the package of innovation use for each Farm Type (FT).
Cluster 1: Innovative farms was the largest cluster with 40.1% (n = 104) of the farms. Of the farmers in this group, 63% used fertilizer, 97% used pesticides, and 87% used fungicides. Only 2% used PS and/or SPT, and only 5% used quality declared seed. Of all farmers in this group, 53% stated that they planted potato as sole crop. The average number of innovations taken up was 3.5; fertilizer and/or organic input, fungicide and pesticide were used frequently. Average yield was the second highest among the four FTs with 10.3 Mg ha−1. Regarding the selling price of one potato bag, farmers in this FT ranked also second; they earned 71,759 UGX (around 27.60 USD) per 100 kg bag. They possessed the second highest access to advisory service (72%), NAADS (57%) and average membership to a farm group (72%). Land size owned was second largest with 2.27 acres on average.
Cluster 2: Highly innovative farms represented 24.3% (n = 63) of the farms. Regarding input use, they scored second on adoption of fertilizer use (59%) and organic input use (48%) and had the highest adoption of fungicide use (98%). They had high adoption of PS and/or SPT with 69% and the highest adoption of quality declared seed with 48% of the farm households. In this cluster, potato was largely grown as a sole crop. The average number of innovations taken up was 4.8 and highest of all farm types; the frequent use of organic input, fungicide, pesticide, SPT/PS, quality declared seed and sole cropping were prevailing. This farm type received the highest amount of money per potato bag sold (73,371 UGX = 28.22 USD per 100 kg bag) and had the highest yield with 10.8 Mg ha−1 although both were not significantly higher than in Cluster 1. The relative uptake of distinctive innovation practices like organic input, fungicide use, pesticide use, use of SPT/PS, quality declared seed and sole cropping is in line with the highest yield. This group presented the highest use of hired labor, with 7.8 people on average per acre, per season and per farm practice. Main characteristics were the largest proportions of having access to advisory service (93%) or NAADS (78%) and involvement in a farm group (92%). This group possessed the most land (2.89 acres on average), farmed also the largest area with potato per year (2.27 acres) and included the largest percentage farmers growing potato in the off-season (62%). Only 68% of the farmers in this group stated they had bacterial wilt in the crop, which was the lowest incidence of the four farm types.
Cluster 3: Semi-innovative farms accounted for 14.7% (n = 38) of the farms and can be described also as medium innovative farms (but differed from Cluster 1 in the using seed selection and not using fungicides). Referring to organic inputs, farmers in this typology had the highest adoption percentage with 61%, but the lowest adoption of fertilizer use with 42%. They were all using pesticides, but only 3% used fungicides. Over the last five seasons, they had not used any quality declared seed. However, 63% used PS and/or SPT. The average number of innovations taken up was 3.2, with frequent use of organic input and pesticide and use of SPT/PS. The yield was the second lowest with 8.3 Mg ha−1. The selling price of potato was also the second lowest with an average price of 66,891 UGX (around 25.73 USD) per bag of 100 kg. Their access to advisory service (57%), NAADS (50%) and farm group membership (78%) was the second lowest of all clusters. They possessed the least amount of land with 1.73 acres on average. Additionally, 89% stated they had bacterial wilt in the crop, which was the highest incidence and significantly different to farms in Cluster 2.
Cluster 4: Low innovative farms comprised 20.5% (n = 53) of the farm households. Farmers' adoption of fertilizer use (43%) was second lowest among the four FTs; besides, the percentage farms using organic input was lowest with only 17%. The farms did not use any pesticides, but 60% used fungicides. Regarding seed quality, 23% used PS and/or SPT and 4% used quality declared seed. Intercropping potato was done by 59% of the farmers. The average number of innovations taken up was 1.8 and the lowest of all farm type groups, with frequent use of fungicides and SPT/PS. In this farm type, yield was lowest (7.2 Mg ha−1). Besides, their return for one bag of potato was also lowest with an average price of 64,019 UGX (around 24.62 USD per 100 kg bag). Respondents from the farms in this group had the lowest possession of own mobile phone devices (58%). Moreover, this group had the lowest access to advisory service (41%) and lowest membership of a farm group (50%). This group grew the smallest acreage of potato per year (1.92 acres), whereas ownership of land was on average 1.83 acres. Hired labor was lowest in this group with on average 4.9 people per acre, per farm practice and per potato season.
Discussion
The objectives of this paper were to define the uptake of innovations in potato production in different farm households in southwestern Uganda, by assessing the variations and relevant packages of improved practices (typologies), and how the farm types in these clusters differ in socio-economic characteristics, access to extension services, yield and economical return. The dissimilarities in characterization of the typologies exposed one farm type with higher innovation uptake (FT 2: highly innovative farms), two farm types with medium innovation uptake (FT 1: innovative farms and FT 3: semi-innovative farms) and one farm types with low innovation uptake (FT 4: low innovative farms).
Uptake of Agricultural Innovations
Farmers are using different packages of innovations: no innovation package was commonly used by all FTs (Figure 3). Summarizing, the relative frequent use of organic input, fungicide input, pesticide input, SPT and/or PS, quality declared seed and sole cropping (FT 2) led to a higher potato yield than the relative frequent use of fungicide input and PT and/or PS (FT 4), which resulted in the lowest potato yield. FT 1 showed low innovation in seed input (little use of SPT and/or PS, and little use of quality declared seed) and also less used sole cropping compared to FT 2. No farm household in FT 4 used pesticides, which might be explained by low financial resources. In general, organic input, fungicide input, pesticide input and use of SPT and/or PS were adopted in three out of four FTs in different packages and can be seen as relevant for farmers (Figure 3, Table 3). The uptake of fertilizer might be related to the financial resources available to the farm households. It can be assumed that innovations like fertilizer input, quality declared seed, and sole crop are too expensive or do not fit in the current production systems of the farmers. We further like to mention trade-offs in using agro-chemicals in an inappropriate way which can harm humans and the natural environment; some farmers might choose the traditional way of not using any agro-chemicals. Interventions to increase potato production is never a “one size fits all” approach, it is more a “basket of options” (Ronner, 2018) where farmers can and are able to choose what works best for them to increase sustainable crop production.
Interestingly, all groups showed similar awareness of PS and/or SPT (Table 3), but the lowest adoption was found in FT 1. PS and/or SPT are generally practices advised for resource-poor farmers to adopt, due to their lack of financial capital to buy quality seed. However, these were also found to have a very high adoption rate in the highly innovative farms (FT 2). This might also show that FT 2 is more aware of the importance of planting good quality seed tubers.
A larger percentage of the highly innovative farmers (FT 2) used quality declared seed than of the low innovative farmers (FT 4) and medium innovative farmers (FT 1 and 3), where adoption was only 0–5%. This finding is in line with the idea that only wealthier farmers could afford the quality declared seed (Gildemacher et al., 2011). Sole cropping of potato was done most by FT 2, which might be related to the possession of more land and following the recommendations of extension personnel.
Socio-economic Characteristics Determining Wealth of Farm Types
FT 1 and FT 2 were classified as wealthier farm types than FT 3 and FT 4 because of significantly more capacity to hire labor, higher yield and selling price characteristics; more farmers in those two groups belonged to Kisoro district. Land ownership was more dominant in FT 2 than in FT3 and FT 4; more acres of land were owned, and more potato was grown throughout the year in FT 1 and 2 than in other FTs. This is reflected also in labor availability: more laborers were hired on FT 2 farms than on FT 4 farms, likely because those farm households could afford to hire labor. FT 4 had the lowest possession of mobile phones; mobile phones play a crucial role in coordination and communication among all stakeholders, access to necessary information and production inputs (Ortiz et al., 2013).
Unexpected results regarding characteristics of the farm households were the findings that gender and education level of the household head were not different among farm types (Table 3). Total acres of farmland and crop diversity were also not important in characterizing the different farm types. There were also no differences in experience in growing potato among farm types. Most farmers in all FTs grew potato in the long-rainy and short-rainy season, but more farmers in FT 2 than in FT 4 grew potato in the off-season, with intermediate values for the other FTs; growing more potato throughout the year might gain more profit. The FTs also showed the same incidence in using informal seed sources (seed from own bulk of harvest, market, and neighbors). Quality declared seed was significantly more used in FT 2, which is in line with more wealth or purchasing power. There was no difference in prevalence of most potato cultivars between the FTs; an exception was found for Katchpot 1 that was found especially in FT 2 and FT 4, but this cultivar was not grown frequently. Farm types did not differ in incidence of pests and diseases, except for bacterial wilt, which was lower in FT 2 than in FT 3 and 4. Every farm type also had largely the same reasons for not expanding potato cultivation: cash limitation for buying seed, land limitation and high input costs; only pests and diseases were more frequently mentioned in FT 1 and FT 3 than in FT 4. Many features of the farm households were actually very similar among farm types.
Access to Extension Services and Knowledge
Access to extension services plays an increasingly important role in innovation with respect to adoption, productivity and income (Ortiz et al., 2013). This is in line with FT 4 having the lowest access to extension services and having the lowest adoption rate of innovative practices, and the lowest productivity and income from potato. Okoboi et al. (2014) specified that continuous information from extension services leads to higher uptake of innovation. Therefore, resource-poor farmers should be enabled and empowered to seek assistance and support from multi-stakeholder initiatives to take up other agricultural practices for yield productivity and bargaining power.
Yield and Economical Return of Potato Farming
While FT 2 is the most innovative farm type (high innovation adoption, high hired labor input, and highest access to extension services), the output regarding potato yield and the selling price of potato were also the highest. Comparing this with FT 4 as low innovative group (low innovation adoption, lowest hired labor input, lowest access to extension services), the yield of potato for this FT4 was the lowest and this also applied for the selling price of a potato bag (Table 3). More adoption of innovative farm management practices leads to higher yield. It can be argued that especially the frequent adoption of planting good quality seed (either quality declared seed or using SPT or PS) led to an improved potato yield in FT 2. A lower selling price for low innovation farmers may be explained by poorer quality of the potato tubers, or by growing potato mainly when supply is high (i.e., not the off-season, Table 3). Other contributing factors are probably a lower bargaining power of these farmers, which can further be explained by low access to extension services, such as farmer cooperatives (cf. Bonabana-Wabbi et al., 2013). Poorer quality of the produce is also demonstrated by the fact that in FT 3 and FT 4 the highest incidence of bacterial wilt in the potato crop occurred; this can be regarded as a weakness.
Conclusions
Our approach to use multivariate statistical methods proved to be practical and functional in identifying farm types with characteristics that hinder or enhance the adoption of innovations. The main findings in our study are (i) farm households differ from high (FT 2) to low (FT 4) adoption of innovation practices and innovation packages, with intermediate adoption rates in FT 1 and FT 3; (ii) farm households with highest innovation adoption (FT 2) have (a) more access to extension services and knowledge, and (b) possess more land, labor and cash; and (iii) farm households with strong adoption in innovation practices (FT 1 and FT 2) generate a higher potato yield and more income. The innovation package characterized by using organic input, fungicide input, pesticide input, SPT and/or PS, quality declared seed and sole cropping was related with the highest potato yield and more income, compared to the package using only relatively frequently fungicide input and SPT/PS which was associated with the lowest potato yield and lowest income. Exploring why some farmers have a lower adoption rate than other farmers, we acknowledge that farmers' choose according to their managerial abilities what is most relevant and possible; also actual benefit and risk perception play important roles in the rate of uptake of innovations (Wigboldus et al., 2016). Nevertheless, poor farm types require improvement and support in many areas, like access to extension services and shared knowledge, bargaining power, productivity and innovation, to become empowered to enhance productivity in a sustainable way.
Data Availability
The raw data supporting the conclusions of this manuscript will be made available by the authors, without undue reservation, to any qualified researcher.
Ethics Statement
Oral informed consent was obtained from all individuals included in the study. Information was gathered and processed in such a way that it was impossible to harm the interests of the interviewees. All identifying data were anonymized in the resulting data set.
Author Contributions
UP, WL, SO, and PS conceived, designed the study, designed the household surveys, and wrote the manuscript. UP collected the data, organized the database, descriptive statistics, principal component analysis, and cluster analysis and interpretation of results. All authors reviewed and approved the final manuscript.
Funding
This work has been conducted as part of a Ph.D. thesis project supported by the Agricultural Transformation by Innovation (AGTRAIN) Erasmus Mundus Joint Doctorate Program (grant number 3183300054), funded by the EACEA (Education, Audio-visual and Culture Executive Agency) of the European Commission.
Conflict of Interest Statement
The authors declare that the research was conducted in the absence of any commercial or financial relationships that could be construed as a potential conflict of interest.
Acknowledgments
The authors are grateful to Dr. Alex Barekye, Gerald Baguma, Ambrose Aheisibwe, the enumerators, and farmers for their support in carrying out the survey.
Footnotes
1. ^In carrying out positive selection, healthy-looking plants in ware potato crops are pegged just before flowering, to potentially serve as sources of seed for the next season. In this way, the healthiest tubers from the farmer's field are planted in the next season and can produce healthy plants and tubers with increased yield. In the seed plot technology, a separate plot of tubers is grown by the farmer for production of seed tubers. Within this plot, positive selection is applied and tubers from the pegged plants are used to establish the next-season seed plot, whereas the remaining tubers are used to grow the ware crop. Both methods may improve the availability of healthy seed tubers to the farmers.
References
Aliguma, L., Magala, D., and Lwasa, S. (2007). Uganda: Connecting Small-Scale Producers to Markets: The Case of the Nyabyumba United Farmers Group in Kabale District, Regoverning Markets. London: Innovative Practice series, IIED.
Banerjee, H., Goswami, R., Chakraborty, S., Dutta, S., Majumdar, K., Satyanarayana, T., et al. (2014). Understanding biophysical and socio-economic determinants of maize (Zea mays L.) yield variability in eastern India. NJAS Wageningen J. Life Sci. 70, 79–93. doi: 10.1016/j.njas.2014.08.001
Benin, S., Thurlow, J., Diao, X., Kebba, A., and Ofwono, N. (2012). “Chapter 10: Uganda,” in Strategies and Priorities for African Agriculture: Economywide Perspectives From Country Studies, Vol. 9 (Washington, DC: International Food Policy Research Institute (IFPRI)), 1–42. Available online at: http://ebrary.ifpri.org/cdm/ref/collection/p15738coll2/id/127049
Bidogeza, J. C., Berentsen, P. B. M., Graaff, J., and Oude Lansink, A. G. J. M. (2009). A typology of farm households for the Umutara Province in Rwanda. Food Security 1, 321–335. doi: 10.1007/s12571-009-0029-8
Bonabana-Wabbi, J., Ayo, S., Mugonola, B., Tayler, D. B., Kirinya, J., and Tenywa, M. (2013). The performance of potato markets in South Western Uganda. J. Dev. Agric. Econ. 5, 225–235. doi: 10.5897/JDAE12.124
Diao, X., Hazell, P., and Thurlow, J. (2010). The role of agriculture in African development. World Dev. 38, 1375–1383. doi: 10.1016/j.worlddev.2009.06.011
Ferris, R. S., Okoboi, G., Crissman, C., Ewell, P., and Lemaga, B. (2002). Performance and Growth Prospects of Irish Potato as a Component for the Development of Strategic Exports in Uganda. Ibadan: ASARECA/IITA Monograph.
Food Agriculture Organization of the United Nations (2018). FAO Stat. Retrieved from: http://faostat3.fao.org/browse/Q/QC/E (July 19, 2018).
Gildemacher, P. (2012). Innovation in Seed Potato Systems in Eastern Africa (PhD Thesis). Wageningen University, Wageningen.
Gildemacher, P., Demo, P., Kinyae, P., Wakahiu, M., Nyongesa, M., and Zschocke, T. (2007). Select the Best: Positive Selection to Improve Farm Saved Seed Potatoes. Trainers Manual. Lima: International Potato Center.
Gildemacher, P. R., Demo, P., Barker, I., Kaguongo, W., Woldegiorgis, G., Wagoire, W. W., et al. (2009a). A description of seed potato systems in Kenya, Uganda and Ethiopia. Am. J. Potato Res. 86, 373–382. doi: 10.1007/s12230-009-9092-0
Gildemacher, P. R., Kaguongo, W., Ortiz, O., Tesfaye, A., Woldegiorgis, G., Wagoire, W. W., et al. (2009b). Improving potato production in Kenya, Uganda and Ethiopia: a system diagnosis. Potato Res. 52, 173–205. doi: 10.1007/s11540-009-9127-4
Gildemacher, P. R., Schulte-Geldermann, E., Borus, D., Demo, P., Kinyae, P., Mundia, P., et al. (2011). Seed potato quality improvement through positive selection by smallholder farmers in Kenya. Potato Res. 54, 253–266. doi: 10.1007/s11540-011-9190-5
Giller, K. E., Tittonell, P., Rufino, M. C., van Wijk, M. T., Zingore, S., Mapfumo, P., et al. (2011). Communicating complexity: integrated assessment of trade-offs concerning soil fertility management within African farming systems to support innovation and development. Agric. Syst. 104, 191–203. doi: 10.1016/j.agsy.2010.07.002
Haverkort, A. J., and Struik, P. C. (2015). Yield levels of potato crops: recent achievements and future prospects. Field Crops Res. 182, 76–85. doi: 10.1016/j.fcr.2015.06.002
International Potato Center (2006). Uganda. Retrieved from https://research.cip.cgiar.org/confluence/display/wpa/Uganda (August 19, 2016).
International Potato Center (2011). Roadmap for Investment in the Seed Potato Value Chain in Eastern Africa. Lima.
Kabeere, F., and Wulff, E. (2008). Seed sector country profile: Uganda. Volume I: Overview of seed supply systems and seed health issues. Department of Plant Biology and Biotechnology, Faculty of Life Sciences, University of Copenhagen, DK-1871 Frederiksberg C, Copenhagen, Denmark.
Kaguongo, W., Gildemacher, P., Demo, P., Wagoire, W., Kinyae, P., Andrade, J., et al. (2008). “Farmer practices and adoption of improved potato varieties in Kenya and Uganda,” in Social Sciences Working Paper 2008–5. Lima.
Kakuhenzire, R., Musoke, C., Olanya, M., Kashzija, I., Smith, J., Wagoire, W., et al. (2005). “Validation, adaptation and uptake of potato small seed plot technology among rural, resource-limited households in Uganda,” in African Crop Science Conference Proceedings, Vol. 7 (Kakuhenzire: African Crop Science Society), 1355–1361.
Kirui, O. K., and Mirzabaev, A. (2014). “Economics of land degradation in Eastern Africa,” in ZEF Working Paper Series No. 128 (Bonn: University of Bonn).
Knoema (2016). Production Statistics—Crops. Retrieved from: https://knoema.com/FAOPRDSC2015Feb/production-statistics-crops-crops-processed-february-2015?tsId=1239980 (September 23, 2016).
Kuivanen, K. S., Alvarez, S., Michalscheck, M., Adjei-Nsiah, S., Descheemaeker, K., Mellon-Bedi, S., et al. (2016). Characterising the diversity of smallholder farming systems and their constraints and opportunities for innovation: a case study from the Northern Region, Ghana. NJAS Wageningen J. Life Sci. 78, 153–166. doi: 10.1016/j.njas.2016.04.003
Low, J. (2000). “Prospects for sustaining potato and sweetpotato cropping systems in the densely populated highlands of southwest Uganda,” in Social Science Working Paper 2000-1 (Lima: International Potato Center (CIP)).
Manrique, L. A. (1993). Constraints for potato production in the tropics. J. Plant Nutri. 16, 2075–2120. doi: 10.1080/01904169309364677
Nkonya, E., Pender, J., Kaizzi, K. C., Kato, E., Mugarura, S., Ssali, H., et al. (2008). Linkages between Land Managment, Land Degradation, and Poverty in Sub-Saharan Africa: The Case of Uganda. Washington, DC: International Food and Policy Research Institute.
Okoboi, G., Kashaija, I., Kakuhenzire, R., Lemaga, B., and Tibanyendera, D. (2014). “Rapid assessment of potato productivity in Kigezi and Elgon highlands in Uganda,” in Challenges and Opportunities for Agricultural Intensification of the Humid Highland Systems of Sub-Saharan Africa, eds B. Vanlauwe, P. Van Asten, and G Blomme (Switzerland: Springer International Publishing), 29–37. doi: 10.1007/978-3-319-07662-1_3
Ortiz, O., Orrego, R., Pradel, W., Gildemacher, P., Castillo, R., and Otiniano, R. (2013). Insights into potato innovation systems in Bolivia, Ethiopia, Peru and Uganda. Agric. Syst. 114, 73–83. doi: 10.1016/j.agsy.2012.08.007
Pender, J., Nkonya, E., Jagger, P., Sserunkuuma, D., and Ssali, H. (2004). Strategies to increase agricultural productivity and reduce land degradation: evidence from Uganda. Agric. Econ. 31, 181–195. doi: 10.1111/j.1574-0862.2004.tb00256.x
Proctor, F. J. (2014). “Rural economic diversification in sub-Saharan Africa,” in IIED Working Paper (London: IIED). Retrieved from: http://pubs.iied.org/14632IIED
Ronner, E. (2018). From targeting to tailoring (PhD Thesis). Wageningen University and Research, Netherlands. Retrieved from: http://library.wur.nl/WebQuery/wurpubs/536080 (accessed June 4, 2018).
Ruben, R., and Pender, J. (2004). Rural diversity and heterogeneity in less-favoured areas: The quest for policy targeting. Food Policy 29, 303–320. doi: 10.1016/j.foodpol.2004.07.004
Salami, A., Kamara, A. B., and Brixiova, Z. (2010). “Smallholder agriculture in East Africa: trends, constraints and opportunities,” in African Development Bank Group Working Paper No. 105 (Tunis).
Schulte-Geldermann, E., Wachira, G., Ochieng, B., and Barker, I. (2013). “Effect of field multiplication generation on seed potato quality in Kenya,” in Seed Potato Tuber Production and Dissemination Experience, Challenges and Prospects (Bahir Dar: Ethiopian Institute of Agriculture Research, Amhara Regional Agricultural Research Institute), 81–90.
Struik, P. C., and Wiersema, S. G. (1999). Seed Potato Technology. Wageningen: Wageningen Academic Publishers. doi: 10.3920/978-90-8686-759-2
Tadesse, Y., Almekinders, C. J. M., Schulte, R. P. O., and Struik, P. C. (2016). Tracing the seed: seed diffusion of improved potato varieties through farmers' networks in Chencha, Ethiopia. Exp. Agric. 1, 1–16. doi: 10.1017/S001447971600051X
Tadesse, Y., Almekinders, C. J. M., Schulte, R. P. O., and Struik, P. C. (2017). Understanding farmers' potato production practices and use of improved varieties in Chencha, Ethiopia. J. Crop Improv. 31, 673–688. doi: 10.1080/15427528.2017.1345817
Thomas-Sharma, S., Abdurahman, A., Ali, J., Andrade-Piedrad, J. L., Bao, S., Charkowski, A. O., et al. (2016). Seed degeneration in potato: the need for an integrated seed health strategy to mitigate the problem in developing countries. Plant Pathol. 65, 3–16. doi: 10.1111/ppa.12439
Tittonell, P., Muriuki, A., Shepherd, K. D., Mugendi, D., Kaizzi, K. C., Okeyo, J., et al. (2010). The diversity of rural livelihoods and their influence on soil fertility in agricultural systems of East Africa – a typology of smallholder farms. Agric. Syst. 103, 83–97. doi: 10.1016/j.agsy.2009.10.001
Ugandan Bureau of Statistics (2017). Statistical Abstract 2017, Vol. 1. Kampala: Uganda Bureau of Statistics Statistics.
Wang'ombe, J., and van Dijk, M. (2013). Low potato yields in Kenya: do conventional input innovations account for the yields disparity? Agric. Food Security 2:14. doi: 10.1186/2048-7010-2-14
Whitney, C. W., Luedeling, E., Tabuti, J. R. S., Nyamukuru, A., Hensel, O., Gebauer, J., et al. (2018). Crop diversity in homegardens of southwest Uganda and its importance for rural livelihoods. Agric. Hum. Values 35, 399–424. doi: 10.1007/s10460-017-9835-3
Wigboldus, S., Klerkx, L., Leeuwis, C., Schut, M., Muilerman, S., and Jochemsen, H. (2016). Systemic perspectives on scaling agricultural innovations. a review. Agronomy Sustain. Dev. 36:46. doi: 10.1007/s13593-016-0380-z
Woldegioris, G., Schulz, S., and Berihun, B. (Eds.). (2013). Seed Potato Tuber Production and Dissemination Experiences, Challenges and Prospects. Bahir Dar: Ethiopian Institute of Agriculture Research, Amhara Regional Agricultural Research Institute, 338.
Wortmann, C. S., and Eledu, C. S. (1999). Uganda‘s Agroecological Zones: A Guide for Planners and Policy Makers. Kampala: Centro Internacional de Agricultura Tropical.
Appendix
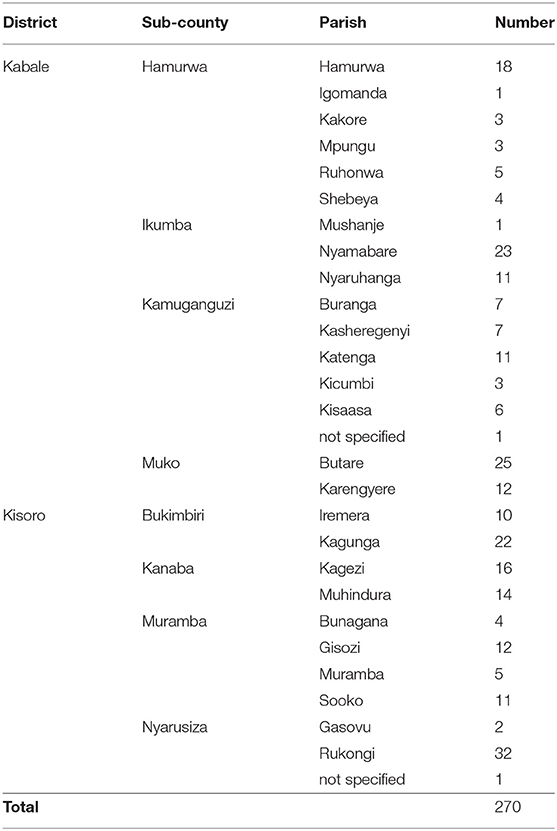
Table A1. Number of potato producing farm households surveyed per potato cropping district, sub-county, and parish.
Keywords: extension services, improved practices, multivariate analysis, socio-economic factors, Solanum tuberosum, yield increase
Citation: Priegnitz U, Lommen WJM, Onakuse S and Struik PC (2019) A Farm Typology for Adoption of Innovations in Potato Production in Southwestern Uganda. Front. Sustain. Food Syst. 3:68. doi: 10.3389/fsufs.2019.00068
Received: 15 February 2019; Accepted: 07 August 2019;
Published: 11 September 2019.
Edited by:
Ademola Braimoh, World Bank, United StatesReviewed by:
Gabriel da Silva Medina, University of Brasilia, BrazilSarah Lubega Mayanja, International Potato Center, Uganda
Copyright © 2019 Priegnitz, Lommen, Onakuse and Struik. This is an open-access article distributed under the terms of the Creative Commons Attribution License (CC BY). The use, distribution or reproduction in other forums is permitted, provided the original author(s) and the copyright owner(s) are credited and that the original publication in this journal is cited, in accordance with accepted academic practice. No use, distribution or reproduction is permitted which does not comply with these terms.
*Correspondence: Uta Priegnitz, dXRhLnByaWVnbml0ekB3dXIubmw=