 Sari Luostarinen
 Juha Grönroos2
- 1Natural Resources Institute Finland (Luke), Jokioinen, Finland
- 2Finnish Environment Institute SYKE, Helsinki, Finland
- 3Natural Resources Institute Finland (Luke), Seinäjoki, Finland
Data on manure quantity and quality is a prerequisite for planning manure management and regulation. It is the basis for directing manure use into more efficient and environmentally sound actions and for fulfilling the targets of nutrient recycling in a circular economy. Manure data is often scarce, old or badly documented. Some collect it by sampling and analysis, others with calculation systems/models. In Finland, both options are used. The farmers need to have their manure analyzed at least every 5 years. The resulting analyzed data from the farms can be combined into a statistical report on manure quality. However, this dataset has major shortcomings, such as difficulty to identify different animal categories. Thus, a model called the Finnish Normative Manure System was developed. Technically the system works well and its biggest challenges are related to the vast amount of background data needed. There are still data gaps e.g., in bedding use and cleaning water additions and a need to update the excretion calculations. To assist development of such models, international harmonization of the methods would be beneficial. As such manure data is usually the basis for emission inventories and burden sharing, harmonization would also place farms and countries in a more equal position in international contracts on emission reduction. In this paper, the challenges related to manure data provision are discussed in reflection to the experiences gained during the development of the Finnish Normative Manure System.
Introduction
Circular economy is being promoted worldwide and e.g., the European Union has a dedicated strategy and stakeholder platform for its increased implementation (COM/2014/0398 final/2, 2014). One important aspect in a circular economy is nutrient recycling. Instead of focusing on mining phosphorus and fixing atmospheric nitrogen as mineral fertilizers, the nutrients already in use should be recovered and reused efficiently.
The main user of nutrients is agriculture. Fertilizers are needed to ensure high yields in crop production which in turn enables efficient food production. Manure has always been used as a recycled fertilizer in agriculture. However, in the developed world, farms usually specialize into either animal or crop production and manure reuse as a fertilizer becomes mainly restricted to animal farms alone. While animal production has simultaneously often concentrated on certain areas and crop production on others, manure reuse has further been limited to only some regions. Excess areas for manure have been established, based on the ratio between production animals and available land at the farm or based on high phosphorus levels in field soils due to excessive fertilization in the past. Such hot spots contain an increased risk for manure-related harmful environmental impacts. In case such regional concentration of animal farms continues, manure should be transported from these areas to those in need of recycled nutrients to effectively replace mineral fertilizers.
To plan efficient manure management and use on farms and to drive manure use into a more sustainable direction on regional, national and international scales, information on manure quantity and quality is needed. Still, data on manure quantity, quality, regional location and management practices are scarcely systematically collected, reported and updated in many countries. Furthermore, if such data are even partially available, it is usually reported in national languages only. Clear documentation of the data collection methods and results is rarely available and international databases do not exist. There are no joint international guidelines for the methods of collecting such manure data, except for some parameters related to gaseous nitrogen and greenhouse gas emissions and nutrient balances (IPCC, 2006; Eurostat, 2013; EMEP/EEA, 2016). This results in a situation in which some countries have sophisticated methods to measure and/or to calculate national manure quantity and quality, while others continue to use outdated values or do not have much data at all (e.g., Luostarinen and Kaasinen, 2016).
In Finland, a more systematic data collection on manure was initiated in 2008. The growing attention to the need to reuse manure more efficiently led to a situation in which the previously used, oldish and largely expert-estimated information did not suffice. The two governmental research institutes, Natural Resources Institute Finland (Luke, formerly MTT Agrifood Research Finland) and Finnish Environment Institute (SYKE), responsible e.g., for national emission inventories and nutrient balances, took action on several levels.
Firstly, the information on analyzed manure samples from farms were obtained from two important commercial laboratories and new average values for manure nutrient content were drawn. This information (so-called table values) is now an option to farm-specific manure analysis for planning manure fertilizer use as regulated in the national decree (1250/2014/FI) executing the EU Nitrates Directive (91/676/EEC). Secondly, a survey to determine the current manure management practices on farms was developed and implemented in 2013–2014 (e.g., Grönroos et al., 2017). Thirdly, the manure storage capacity requirements per animal category were roughly re-calculated and updated to the national decree of 1250/2014/FI.
During these tasks, the need for a proper calculation system to provide systematically updated manure data for all manure-related regulation and activities became apparent. Luke and SYKE decided to develop a calculation model for manure quantity and quality called the Finnish Normative Manure System. The development of the large model was and still is a challenging task, but the system has already proved its usefulness in providing versatile manure data needed in several contexts from regulation of manure management to national and regional plans of enhancing manure use. In the future, the use of the system as a basis of manure fertilization will also be discussed.
In this paper, we summarize the basics of the Finnish Normative Manure System, give some results as an example of what kind of data it can deliver, and discuss the challenges and strengths of the approach. We also proceed to the need of international dialogue on how such models should be built and used to ensure equality between farmers and countries under the increasing obligations to promote nutrient recycling and to control agricultural emissions. The goal of the paper is to raise discussion on whether harmonized methods for modeling manure quantity and quality are needed and how the scientific community using such models could better learn from each other.
Materials and Methods
A short overview of the Finnish Normative Manure System is presented here. For more detailed information, two documentation reports are available online (cattle, pigs, poultry, horses, and goats in English: Luostarinen et al., 2017a; fur animals in Finnish: Luostarinen et al., 2017b).
The Finnish Normative Manure System comprises five interlinked units, all built in MS Excel® (Figure 1). Unit 1 calculates excretion, i.e., the quantity and quality of feces and urine excreted by each animal category included. Unit 2 collects data on the additions such as bedding and water into manure, and the losses of dry matter and water. Unit 3 calculates gaseous losses from manure during housing and storage for each animal category and manure type considered. Unit 4 is responsible for the actual mass balance calculation for each animal category and manure type, the results of which are organized into clear tables and graphs in Unit 5.
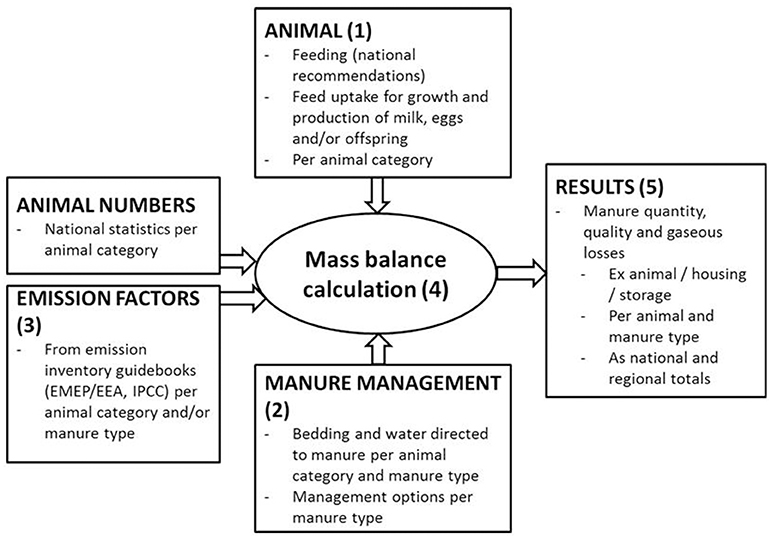
Figure 1. The structure of the Finnish Normative Manure System.
The most important animal categories (Table 1) are calculated e.g., for agricultural emission inventories. More specific animal categories are also included (Table 2) to serve the needs for more detailed information. This may be required e.g., in case of a farm specifically focused on rearing indigenous cattle which are smaller and produce less manure than high-yielding or even average Finnish cattle.
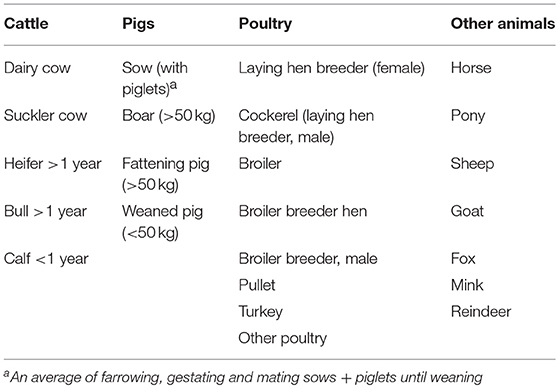
Table 1. The main animal categories in the Finnish Normative Manure System and used in the emission inventories.
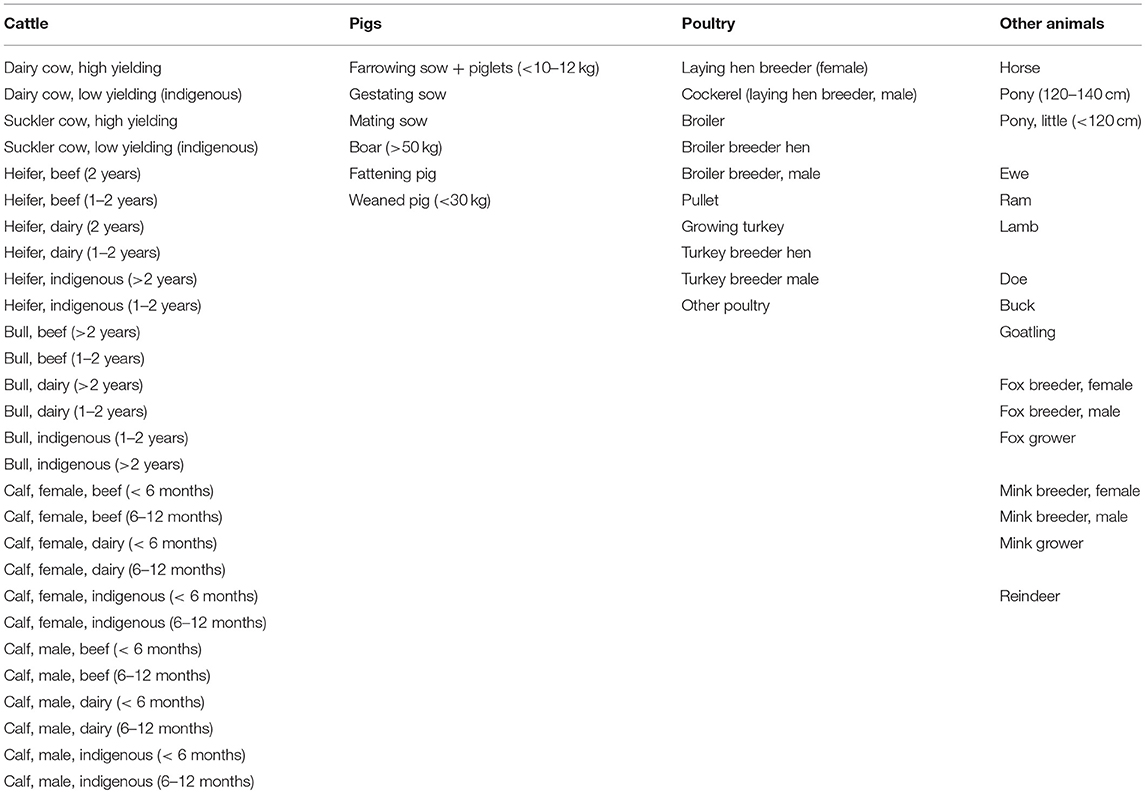
Table 2. Detailed animal categories included into the Finnish Normative Manure System.
Furthermore, to enable calculation of manure quantities and their nutrient content per certain region or the whole nation, the calculated manure data are multiplied by annual statistics on animal numbers also containing the information on the geographic location of the farms. The results presented in this paper are based on 2016 animal statistics (Finnish Fur Breeders' Association, 2016; Suomen Hippos/Finnish Trotting Breeding Association, 2016; Luke Statistics, 2017).
The calculations proceed as a mass balance (see an example of its main components as a flow chart of slurry; Figure 2). Firstly, excretion is calculated as animal feed minus retention in animal, resulting in the amount of excreted feces and urine and their composition regarding nitrogen and the share of total ammoniacal nitrogen (TAN), phosphorus, potassium, dry matter, organic matter. Animal growth, reproduction, genetic type, and product yield (milk, meat, eggs, pelt) are averaged for the production conditions in Finland and according to national feeding recommendations (Luke Statistics, 2014a,b,c,d; Finnish Fur Breeders' Association, 2016; Luke Feed Tables, 2016). The excretion presented here is based on the production and feeding data from 2014 (Luostarinen et al., 2017a), except those of fur animals which are based on data from 2016 (Luostarinen et al., 2017b).
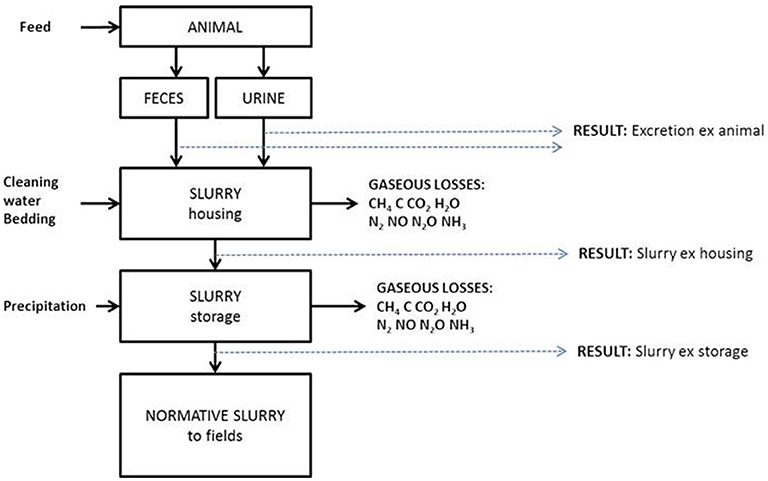
Figure 2. Flow chart of the mass balance calculation of slurry as calculated in the Finnish Normative Manure System. The additions and gaseous losses are named, other components (esp. P, K) are assumed to remain in the manure. Separately collected urine follows the same principle, while solid manure types (deep litter, farmyard manure, separately collected dung) do not receive cleaning water, but may receive feces from outdoor yards (see: flow charts per manure type in Luostarinen Luostarinen et al., 2017a).
Secondly, the additions of bedding materials and cleaning water during animal housing are considered per manure type (Luostarinen et al., 2017a,b). The manure types calculated include slurry, farmyard manure, deep litter and separately collected dung and urine. Slurry means a mixture of feces and urine into which cleaning waters of the animal house (and milking equipment) are directed and very little bedding is used. Its dry matter content is low (<12%). Farmyard manure is a solid mixture of feces and bedding into which all urine is adsorbed. It is removed from the animal house regularly (daily). Deep litter is also a solid manure with an even higher content of bedding as it is removed from the animal house only after a production batch (e.g., broilers) or once a year. All urine is adsorbed into the bedding which is added regularly on top of the manure bed. In a housing unit with separately collected dung and urine, some bedding is used and part of the urine may be adsorbed into it producing thus a solid manure type called dung. Most of the urine is, however, collected into a separate storage tank using tilted flooring and urine channels.
The share of these manure types differs between different animal categories (Table 3) and is considered when calculating e.g., national manure data. Further, the calculation considers the shares of grazing affecting the amount of manure collected in-house (Table 3). It also uses the shares of manure storage options (different covering) affecting the gaseous losses during manure storage (Table 4).
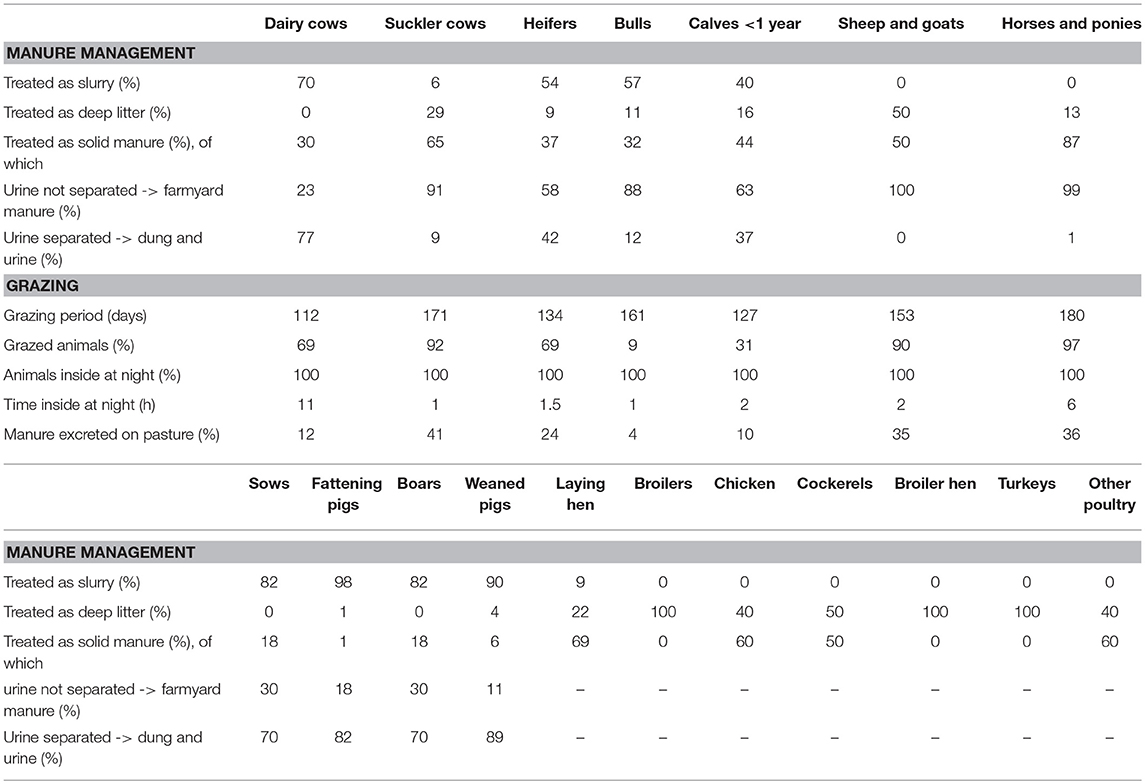
Table 3. The share of different manure types produced and grazing data in Finland (% of manure per each manure type and animal category; Grönroos et al., 2017).
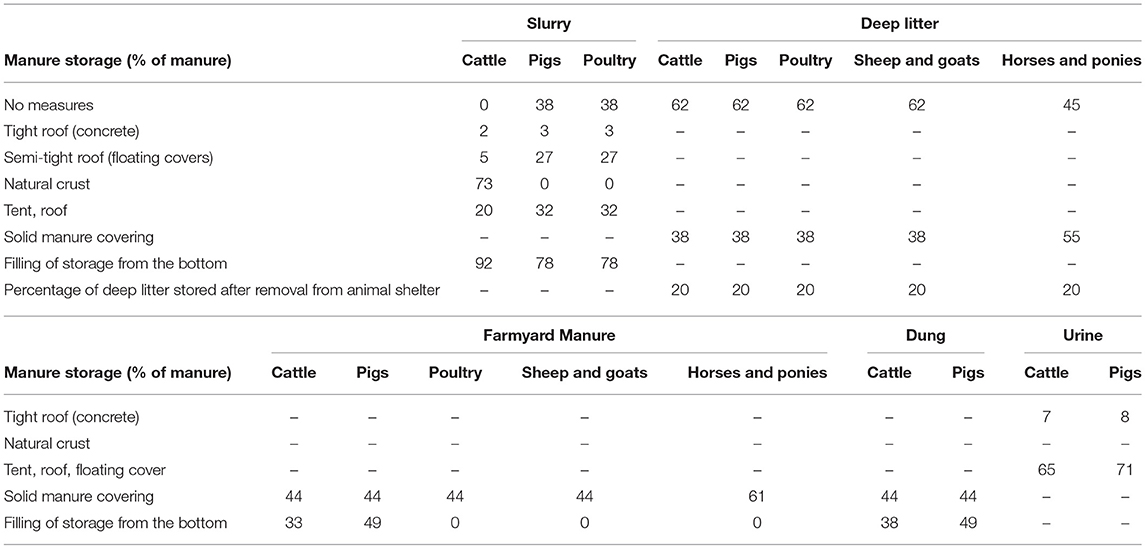
Table 4. The shares of different storage types and measures used in Finland (Grönroos et al., 2017).
Further, rainwater addition to open manure storages is considered as the annual average precipitation in Finland of 600 mm. Evaporation of water from the storages is considered as the mean annual evaporation rate, being 300 mm for open storages and 100 mm for slurry storages with floating covers. For solid manures (farmyard manure, deep litter, dung), evaporation of water is adjusted according to nationally analyzed dry matter content of manures, as suggested by Poulsen and Kristensen (1998). Also, 10% of dry matter is assumed to be lost due to conversion of organic matter in housing with deep litter systems (Poulsen and Kristensen, 1998) and 10% during storage of all manure types, except urine. For fur animals, 5% of dry matter is assumed lost under the open sheds and 15% during storage. Mineralization and immobilization of nitrogen are also included into the calculation as described in Grönroos et al. (2017).
The loss of gaseous nitrogen (NH3, NOx, N2O, N2) is calculated using the Finnish model for agricultural emissions of gaseous nitrogen and non-methane volatile organic compounds (Grönroos et al., 2017). The calculation follows the instructions of EMEP/EEA (2016) using the total ammoniacal nitrogen (TAN) excreted by each animal as the starting point. Calculation of nitrous oxide and methane emissions follow the principles of IPCC (2006). The amount of carbon dioxide released during manure management is estimated with the method developed by Hamelin (2013).
The reporting unit offers several types of results, examples of which are given in the next section of this paper. Specific results per animal or animal place give values for manure ex animal (excretion), manure ex housing (manure leaving the housing unit in different manure types) and manure ex storage (manure leaving storage and to be applied on fields; Figures 2, 3). Results ex animal include the quantity of feces and urine, and the quantity of nitrogen, phosphorus, potassium, dry matter and organic matter in them [kg/animal(place)/year]. Results ex housing and ex storage include the quantity of the relevant manure types per animal category [t/animal(place)/year], the quantity of nitrogen, ammonium-nitrogen, phosphorus, potassium, dry matter and organic matter (t/animal(place)/year). These results are also presented as concentrations (kg/t of manure). Results per chosen animal population, e.g., all animals in Finland, can also be calculated by multiplying the animal-specific results with animal statistics.
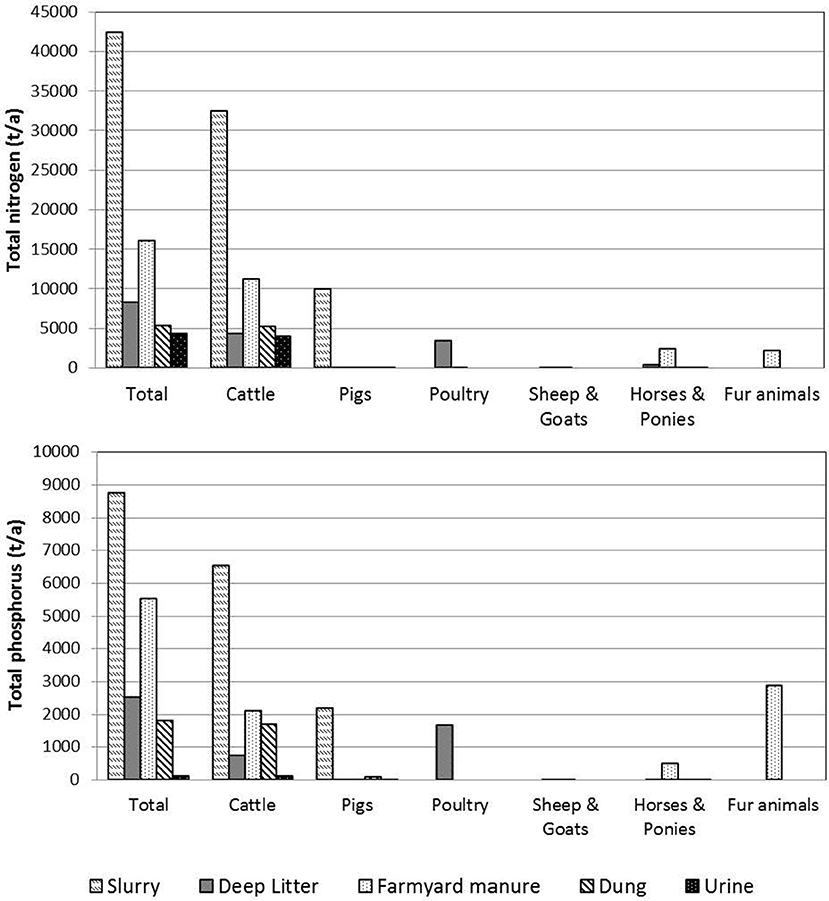
Figure 3. Total nitrogen (above) and phosphorus (below) in all manures ex storage in Finland as calculated with the Normative Manure System and animal statistics of 2016. Manure excreted on pasture is excluded.
Results
In this section, some results are presented as an example of what kind of data the Finnish Normative Manure System produces and how the data can be used. For all current datasets per animal category available, the readers should download the documentation reports (cattle, pigs, poultry, horses, and goats in English: Luostarinen et al., 2017a; fur animals in Finnish: Luostarinen et al., 2017b). It is stressed that the development and data collection processes for the system are still ongoing and these are only the first results provided. During this development, more comparisons to analyzed manure data will be made to further validate the model. Some comparisons can be found in the documentation reports (Luostarinen et al., 2017a,b).
Examples of the animal-specific results are given here for an average Finnish dairy cow (Table 5) and broiler (Table 6). Similar result tables have been published for most of the animal categories listed in Table 1 (Luostarinen et al., 2017a,b). The results with more detailed animal categories (Table 2) are also available but not yet published.
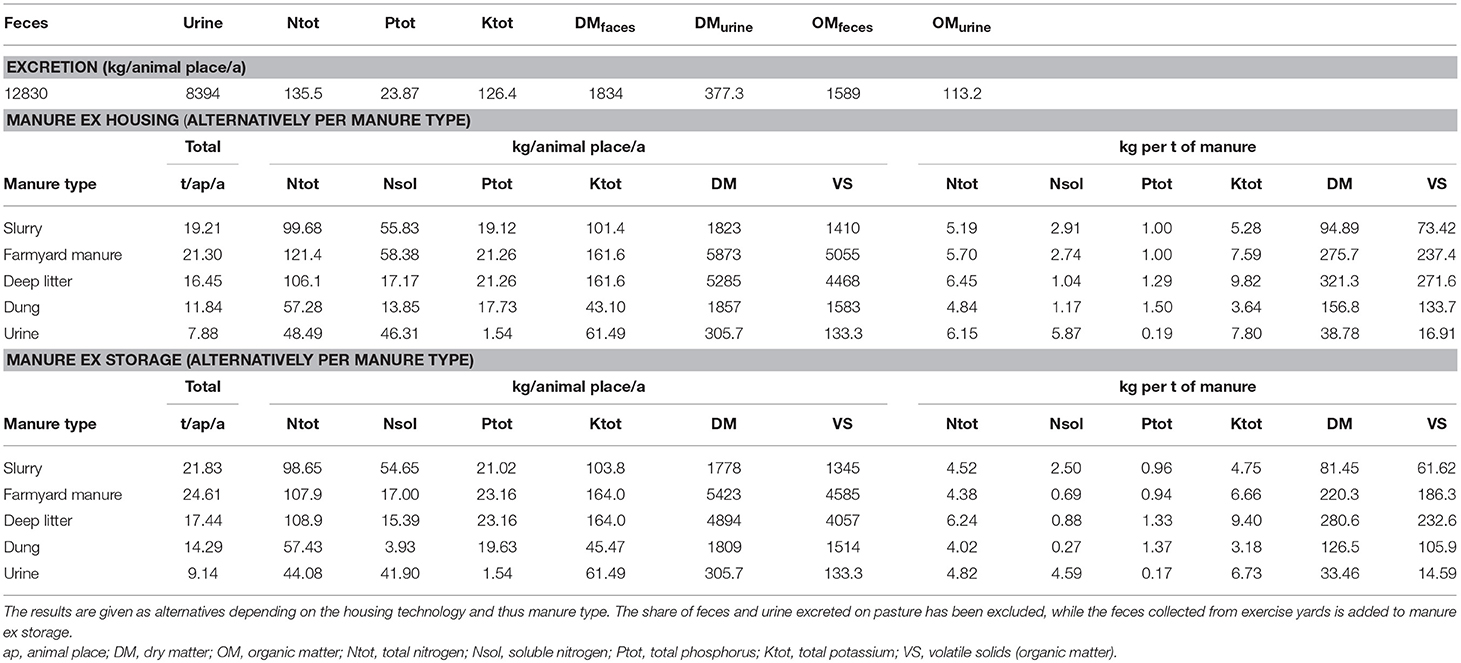
Table 5. Manure data for an average Finnish dairy cow (all breeds accounted for according to their numbers; milk yield 8,463 kg, live weight 640 kg in 2014) as calculated by the Finnish Normative Manure System.
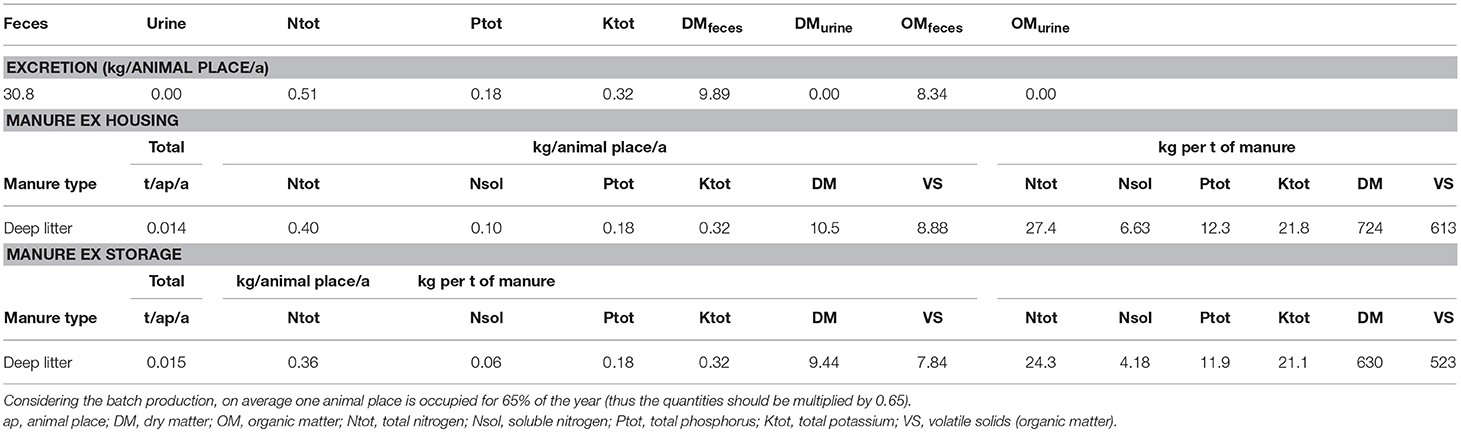
Table 6. Manure data for an average Finnish broiler (animal place fully occupied per year) as calculated by the Finnish Normative Manure System.
The results are given per animal place and per year (Tables 5, 6). For cattle, the animal places are usually occupied all year (Table 5). However, in case of animals reared in production batches, such as broilers, it should be noticed that the animal place is not occupied all year and the result calculated per full year should be multiplied by 0.65 to consider production pauses (Table 6).
While with broilers the only manure type produced is deep litter (Table 6), the results for dairy cow (Table 5) are given as alternatives per different manure types as all, excluding deep litter, are produced in Finland (Table 3). Deep litter is still calculated to compare to other cattle categories. Furthermore, the dairy cow feces collected from exercise yards is added to the manure ex storage, while the share of feces and urine excreted on pasture (Table 3) is excluded from the results.
It should also be noted that with dairy cow, bedding materials are added to all manure types during housing (Luostarinen et al., 2017a) and they add to the manure quantity and alter the content of dry matter, organic matter and nutrients. Also cleaning waters from housing and milking equipment dilute slurry and increase its quantity. Similar changes due to bedding addition can be noticed with broiler deep litter. Changes also occur due to addition of rain water in manure ex storage, evaporation of water from deep litter during housing and loss of dry matter and nitrogen during manure management.
National totals of manure quantities are also available, calculated here with the animal statistics of 2016 (ex housing: Table 7, ex storage: Table 8). Similarly, e.g., total nitrogen and total phosphorus can be calculated for all manures in Finland (example of manure ex storage in Figure 3). Such results can also be produced for certain regions, such as provinces and municipalities. The information provided offers an insight into the practical shares of different manure types, and their nutrient content and locations. This supports the planning of their more efficient utilization as such or with processing into new organic fertilizers.

Table 7. The manure quantity ex housing in Finland based on the manure data of the Finnish Normative Manure System and animal statistics of 2016.
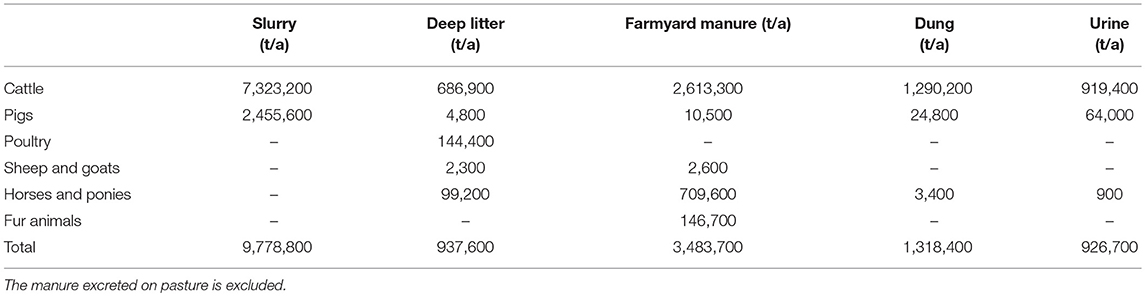
Table 8. The manure quantity ex storage in Finland based on the manure data of the Finnish Normative Manure System and animal statistics of 2016.
The calculation system functions well. The results on different levels are easily recovered, a function which has not been available in Finland previously. The information provided is based on the best and most updated background data available, thus merging large amounts of data into the type of results which can be used in several different manure-related activities in a harmonized form.
The changes in manure quantity and quality along the manure management chain are easily recognized when comparing the results ex animal, ex housing, and ex storage. Such data has not previously been available in Finland. The information is important e.g. when planning manure processing plants into which manure is usually fed as fresh as possible. Thus, the results ex housing should be used as the basis of all planning. The losses of organic matter and nitrogen in the manure management chain deserve special attention to highlight the need to minimize them with the right actions and to ensure as high a dose of both into the fields as possible to maintain soil organic matter and offer nitrogen for crop growth. By altering the calculation e.g., by implementing a higher share of covered storage than actually used at the moment, the difference in manure nitrogen content can be determined.
Discussion
The first published version of the Finnish Normative Manure System (Luostarinen et al., 2017a,b) is discussed here in relation to its original need, experiences during its construction and its ongoing development. Additionally, comparison between using sampled and analyzed manure data and calculated manure data in different functions is considered. Ultimately, the need to develop international guidelines for more harmonized methodologies for providing manure data is discussed.
The Finnish Normative Manure System and its Uses
The first version of the Finnish Normative Manure System has proved to easily provide the manure data needed in many actions from policymaking to farming. Technically it works well and can be updated fairly simply. However, the requirement for rather detailed background data, existence of some important data gaps and the rather complex MS Excel® structure still call for development. Some phenomena appearing during manure management, such as loss of dry matter, is also on the development list.
The data provided by the system has already been used in several functions in Finland. It is coupled with the inventory of air pollutant emissions from agriculture. It is also the best available information on manure quantity, quality and location (when combined with animal statistics), a dataset which is used as the basis for planning more effective manure use including e.g., different manure processing options. It provides manure data for an open data source about different organic wastes and by-products from agriculture, forestry, municipalities and industries in Finland called Biomass Atlas (https://www.luke.fi/biomassa-atlas/en/) and for a planning tool for regional nutrient recycling to be used by regional authorities (ready for use in 2018).
In the future, the system will provide manure data for national nutrient balance calculations and updated information e.g., for the requirements of manure storage capacity and animal-specific coefficients determining the threshold number of animals for environmental permitting of animal farms. Further uses could include being the basis for manure fertilization plans (instead of current values derived from large datasets of analyzed manures). The ultimate aim is to harmonize the national manure data used by policymakers, authorities, research, business, education, agricultural advisors, and farmers.
Development Needs of the Finnish Normative Manure System
At the time of writing, the most important development need in the system is the excretion calculation. Excretion has the largest effect on manure quantity and quality within the system. Yet, there are no harmonized guidelines on how it should be calculated. The need for harmonizing excretion calculation has also been noted elsewhere, especially in relation to nitrogen excretion (Velthof et al., 2015). Also, the difficulty of such harmonization has been noted as it may not be possible to simply copy the calculation system of one country to another. The calculation procedure must always reflect the country-specific animal production. Thus, the role of background data on feeding, growth, product yield, reproduction etc. becomes integral.
In Finland, excretion calculation is the responsibility of Natural Resources Institute Finland (Luke). Before the development of the Finnish Normative Manure System, basically only excretion of nitrogen, phosphorus and organic matter was needed. With the introduction of the Normative Manure System, the parameters to be calculated were increased to quantity of feces and urine and the quantity of total nitrogen, total phosphorus, total potassium, dry matter and organic matter in both. It soon became apparent that the national excretion calculation requires a larger reorganization which is now proceeding in Luke. The task is large and will take some time. Thus, the first results given by the Normative Manure System are not fully documented and subject to change due to introducing the updated excretion calculation.
During the update of excretion calculation, the background data concerning animal production, including actual animal numbers reared and their feeding, growth, and reproduction will all be updated in cooperation with farmers' representatives, feed producers and food industry. It is vital that the information used relates to the actual current practices on farms. This calls for comparisons between using feeding recommendations (Luke Feed Tables, 2016) and feeding information collected on farms. There have been concerns over whether using feeding recommendations as the background data really represents the feeding used on farms in practice. This is of special interest especially for cattle, the feeding of which is not quite as controlled and coming largely from the feed industry than e.g., with poultry. A separate research project to study this will be conducted during 2018–2019.
Also the animal categories to be calculated will be checked to enable all relevant types of animals to be included. Further, the actual calculation procedure with its algorithms will be re-evaluated and updated. Necessary documentation in English will also be prepared.
A large data gap in the Finnish Normative Manure System is the information on bedding materials and cleaning waters added into different manure types under different housing systems. This information has not been collected for years and the attempt to collect it mostly failed during the 2013 manure management survey on animal farms, due to the farms having problems with estimating their bedding use, Clearer data on bedding use in poultry production and horse stables were received from separate data collections with simplified questions (horses) or direct contact with the farms and their representatives (poultry). An important obstacle for the data collection was that the farms rarely document their bedding use. It may also change depending on bedding material availability and price. Similarly, cleaning water use and its direction to slurry is not usually measured. For the calculation, this is a major shortcoming.
Losses of nitrogen, methane and carbon dioxide are rather straightforward to calculate due to them being based on the international guidelines (IPCC, 2006; EMEP/EEA, 2016). However, the loss of dry matter is currently based on a very rough estimation for deep litter during housing and for all manure types except urine during storage. Better solutions have not been found, but might call for international discussion on how this should be taken into account in manure-related mass balance calculations. Further, the evaporation of water from solid manure types is currently estimated based on manure analysis results as suggested by Poulsen and Kristensen (1998). This method should also be subjected to further discussion and potentially also measurements.
Use and Limitations of Manure Data Collected by Manure Analysis
In Finland, farmers are required to take manure samples minimum every 5 years and have it analyzed according to methods approved in national legislation (1250/2015/FI). Analyses are done in commercial, accredited laboratories. One of the laboratories have compiled and published averages over 5 year periods (Eurofins Agro Finland, 2017). However, the dataset has not been subjected to statistical analysis. It gives the average, minimum, maximum, and number of samples. From these, it is usually obvious that there are outliers that should be removed from the data set. If, e.g., a slurry maximum for dry matter is 50%, it clearly is not slurry at all. Such statistical analysis would improve the quality of the data set.
The dataset is also not a particularly accurate generalization of manure quality in Finland. The samples are often poorly named by the farmers, which makes it often impossible to distinguish from which animals the sample derives from. It makes a big difference whether a sample is named “poultry manure” or “broiler manure” or even just “manure.” Further, there is often inconsistent or no data on the manure type, either. At the time of writing, the laboratories do ask whether the manure sample is from slurry, deep litter, solid manure (meaning farmyard manure or dung) or urine. Categorization of the data into cattle slurry, solid manure and urine, pig slurry, solid manure and urine, poultry manure, horse manure, fur animal manure, and sheep and goat manure should thus be possible in the future. The differences between e.g., dairy and beef cattle, fattening pigs and sows, and horses and ponies still cannot be distinguished.
The ratio between different animal categories on the farms is not collected. Even if the sample would be named as accurately as “dairy cattle slurry,” there is no information on how many dairy cows, heifers and calves there were on the farm. All of these animals produce different types of manure depending on their feeding, growth, yield and housing solutions. Also, no data on animal breed, feeding, product yield, bedding material and cleaning water use are connected to the samples. Such background data would improve the usability of the data in different contexts e.g., from official table values for manure nutrient content to different models for manure use and manure-related emissions.
At the time of writing, there are three commercial laboratories analyzing manure samples in Finland. They use somewhat different analysis methods. It is unclear whether this affects the results and whether some method would be more suitable for manure samples than others. During the development of the Finnish Normative Manure System, some manure samples were taken by the researchers involved and sent to two different laboratories for analysis of dry matter and nutrients. Most results were similar, but e.g., the phosphorus content in pig slurries differed between the two laboratories notably. They were on average 0.6 g P/kg in laboratory 1 and 0.3 g P/kg in laboratory 2 for sows and 1.0 and 0.8 g P/kg, respectively, for fattening pigs (data not shown). With solid manures the difference in sow manure was smaller (laboratory 1: 4.7 g P/kg; laboratory 2: 4.5 g P/kg). A more in-depth analysis of the reasons for such differences was not then made, but it appeared that both the analysis method and the manure type can affect the results. For phosphorus, laboratory 1 used a method described in Plaami and Kumpulainen (1991) and laboratory 2 used standard methods (ISO 5516:1978).
Another factor affecting the analysis results is the heterogeneous nature of manure. As the sample volume used in the measurements is small, the possibility for unrepresentative sampling during both analysis and farm sampling is always present. In Finland, the farmers take the samples themselves. They are offered instructions for sampling by the commercial laboratories, but it is not really known how well the guidance is followed. Poor sampling may thus affect the results per farm and subsequently also the datasets drawn from a larger amount of analysis results.
All in all, manure sampling and analysis may provide feasible data for the farms, if sampling and analysis are representative. Still, it describes only that moment in time on that specific farm. Manure collected e.g. over the winter period and stored for months is inevitably different from the manure collected over a month or two in-between spring and summer spreading. Also, changes in bedding use, manure collection frequency and cleaning water use change the manure. The Finnish required minimum frequency of analysis, every 5 years, may be too long to respond to changes in farm practices. Furthermore, to use such analyzed data for the purposes of emission inventories or other manure data aiming at generalizing the manure management in all Finland is inevitably difficult. The uncertainties listed and the lack of separate data for the specific animal categories render the analysis results unfeasible. It may help in validating the manure calculation so that the results provided can be accepted in their uses.
Uses of the Data Produced by the Normative Manure System
The data produced by the Finnish Normative Manure System is not exactly the manure produced on individual farms. It uses background information which is an average of the animal production in Finland per animal category. Manure data is needed in many other actions than planning and reporting manure fertilization on specific farms. Due to the challenges in analyzed manure data stated above, not all required data can be collected with sampling and analysis. More useful average national manure data is received via the calculation system.
One important aspect for manure management and use is manure quantity per animal or animal place. This is usually not measured on farms, yet the information is needed when planning and building sufficient storage capacity for the farms. The storage capacity requirements are part of regulation for manure management on farms and set according to a calculated estimation of manure quantity per animal category and manure type.
Further, to distinguish between the different manure types per animal category and to couple this information with animal statistics and animal locations in emission inventories and nutrient balance calculations can only be accomplished via a calculation model. The model also needs manure data from different stages of the manure management chain. They often start from excretion, thus needing the data ex animal. The inventories for gaseous emissions estimate the losses happening afterwards along the manure management chain under average national production conditions per animal category. Thus, they actually already make up part of the mass balance system for calculating also other manure parameters.
Many countries are setting targets for improved nutrient recycling including enhanced manure use. Finland declared its goal to become a model country for nutrient recycling already in 2011 (Ministry of Agriculture and Forestry, 2011). This is also part of the Government Programme of the Finnish Prime Minister Juha Sipilä (Prime Minister's Office Finland, 2015) as one of the key projects aims at a breakthrough to a circular economy and adoption of clean solutions.
To strive toward reaching these targets, information on how much nutrient-rich, recyclable wastes and by-products are produced in Finland, what is their nutrient content and where they are located, is required. To produce this information for manure, the Finnish Normative Manure System has proved a feasible tool. In the spring of 2017, a background paper was made on the current situation of nutrient recycling in Finland (Marttinen et al., 2017). The manure data was derived from the Normative Manure System. The significance of the system and the information it provides becomes clear when comparing the volumes of nutrients to be recycled in different wastes and by-products. Manure makes up over 80% of the fresh mass and approximately 75% of phosphorus and 90% of nitrogen in the different wastes and by-products available (including also unused grass biomasses, sewage sludge, municipal and industrial biowaste). This clearly outlines the need for updated national manure data which should be produced in a controlled, official system using the latest information available.
Further, there are regions in Finland to which much of the animal production and thus also manure is concentrated (Ylivainio et al., 2015; Marttinen et al., 2017). To fully understand the situation in these regions regarding the availability of manure nutrients and the need for fertilizing, the data provided by the Normative Manure System becomes necessary. The information is the basis for planning potential actions in manure management and evaluating the necessity of processing manure into new fertilizer products which can be more cost-efficiently transported to the regions in need of the nutrients.
There are also a lot of research and development projects on nutrient recycling going on in Finland at the time of writing. They often need manure data due to manure being the most important nutrient-rich material to be recycled. To produce information which can be even to some extent compared and compiled into larger entities, the manure data used should be uniform. This is another very important use of the calculated data. Only in studies focusing on case farms may manure analysis provide more accurate information.
Need for Harmonized Guidelines for Calculation Methods
Many countries have their own calculation systems for manure-related data (e.g., Luostarinen and Kaasinen, 2016). Such systems or at least their results are available e.g., in Denmark (Poulsen and Kristensen, 1998)1, Sweden (e.g., Gustafson et al., 2007), Germany (DLG, 2005, 2014; BMELV, 2007), Estonia (Põllumajandusministerium, 2014) and the Netherlands (Statistics Netherlands, 2012). Often the systems are based on mass balances. The challenge is that the calculation systems are usually not thoroughly, if at all, documented. This makes their comparison difficult and leaves little room for learning from each other. To develop more harmonized manure data and to ensure equality between countries and farmers e.g., with regard to emission targets and their surveillance, such harmonization is needed. One step toward this would be to document the calculations better and subsequently facilitate discussion between those organizations responsible for the national systems. This is a task that might be good for a RAMIRAN task group to also take forward.
An attempt to find and build more harmonized methods for manure mass balance calculations is being conducted at the time of writing in a project called Manure Standards. It is an Interreg project (Baltic Sea Region Programme, project duration 2017–2019) deriving from the ministerial level decision to produce manure nutrient standards for the Baltic Sea Region as part of the work of Baltic Marine Environment Protection Commission—Helsinki Commission (HELCOM). The project is led by Natural Resources Institute Finland (Luke) and its partnership comprises of 19 organizations either working on research or representing state authorities, farmers and agricultural advisors in all Baltic Sea countries (Finland, Sweden, Denmark, Germany, Poland, Lithuania, Latvia, Estonia, and Russia).
The project aims at testing and developing both manure analysis and manure calculation by producing joint guidelines on (i) how to take representative manure samples and which analysis methods are the most suitable for different types of manure, (ii) how to make basic manure mass balance calculation ex animal, ex housing and ex storage, and (iii) how to use manure data in nutrient bookkeeping as the basis of manure fertilization and which methods for accounting nutrients can be recommended for following up on manure use on national and transnational levels. The methods are developed in international cooperation and tested with the pilot farms in each country, including assessments of economic and environmental impacts of updating manure data. The policymakers in each Baltic Sea country are also closely involved via cooperation with the HELCOM group on Sustainable Agricultural Practices (Agri). The Agri group has members from the relevant ministries dealing with agriculture and the environment in the Baltic Sea Region, DG Environment of the European Commission and also representation of farmers' unions and environmental NGOs.
The Finnish Normative Manure System is also subjected to commenting by the other experts in the project Manure Standards and to comparison to the systems available in other participating countries. This is seen as an important opportunity to discuss the solutions in the calculation and to improve and harmonize the existing calculation systems. Simultaneously a jointly agreed basic calculation tool will be constructed in MS Excel® to be used in those countries which currently do not have any tools for manure mass balances and may also otherwise have rather old or incomprehensive manure data. This tool will also be clearly documented and its use instructed. In the future, the harmonizing work of manure calculation systems should be advanced to an even larger reach than the Baltic Sea Region covered in Manure Standards.
Author Contributions
SL is the main author of this article. She led the development of the Finnish Normative Manure System, participated in the required data collection, and was the main author of the documentation reports. She is now responsible for its further development and annual updating and communication. She also coordinates excretion calculation in Finland. JG was responsible for developing the Excel®-based calculation system for the Finnish Normative Manure System and manages the Finnish calculation model for gaseous nitrogen emission from agriculture. He also participated in the required data collection and co-authored this article and the related documentation reports. MH participated in data collection and overall development of the Finnish Normative Manure System as an expert on livestock housing and manure management. She co-authored the related documentation reports and this article. JN was responsible for the excretion calculations. JM participated in the technical development of the Excel®-based calculation system for the Finnish Normative Manure System.
Conflict of Interest Statement
The authors declare that the research was conducted in the absence of any commercial or financial relationships that could be construed as a potential conflict of interest.
Acknowledgments
The authors wish to thank the Finnish Ministry of the Environment for funding the development of the Finnish Normative Manure System. We are also grateful for the Finnish Ministry of Agriculture and Forestry for supporting the work and leading the project steering group. We extend the thanks also to the Finnish Farmers' representatives and food companies who cooperated with us and offered their expertise to the background data collection.
Footnotes
1. ^Normtal, 2018 Available online at: http://anis.au.dk/forskning/sektioner/husdyrernaering-og-fysiologi/normtal/ (Accessed February 12, 2018).
References
BMELV (2007). Verordnung über Die Anwendung von Düngemitteln, Bodenhilfsstoffen, Kultursubstraten und Pflanzenhilfsmitteln nach den Grundsätzen der Guten Fachlichen Praxis Beim Düngen. Bekanntmachung der Neufassung der Düngeverordnung (in German), BMELV.
COM/2014/0398 final/2 (2014). Communication from the Commission to The European Parliament, The Council, The European Economic and Social Committee and the Committee of the Regions. Towards a Circular Economy: A Zero Waste Programme for Europe. Available online at: https://eur-lex.europa.eu/legal-content/EN/TXT/?uri=celex%3A52014DC0398 (Accessed February, 2018).
DLG, (2005). Bilanzierung der Nährstoffausscheidungen Landwirtschaftlicher Nutztiere. Arbeiten der DLG 199. Frankfurt: DLG-Verlag.
DLG, (2014). Bilanzierung der Nährstoffausscheidungen Landwirtschaftlicher Nutztiere, 2nd Edn. Arbeiten der DLG 199. Frankfurt: DLG-Verlag.
EMEP/EEA (2016) EMEP/EEA Air Pollutant Emission Inventory Guidebook 2016. 3.B Manure Management. EEA Report No 21/2016. Copenhagen: European Environment Agency.
Eurofins Agro Finland (2017). Compilations of Manure Analysis Results Available by Request. Available Online at: https://www.eurofins.fi/agro/tietosivut/tilastoja/
Eurostat (2013). Nutrient Budgets–Methodology and Handbook. Version 1.02. Eurostatand OECD: Luxembourg.
Finnish Fur Breeders' Association (2016) Statistics of Fur Animal Numbers and Feeding. Finnish Fur Breeders' Association.
Grönroos, J., Munther, J., and Luostarinen, S. (2017) Calculation of Atmospheric Nitrogen NMVOC Emissions from Finnish Agriculture - Description of the Revised Model. Reports of the Finnish Environment Institute 37/2017. ISBN: 978-952-11-4902-3. Finnish Environment Institute: Helsinki. Available online at: http://hdl.handle.net/10138/229364
Gustafson, G., Salomon, E., and Jonsson, S. (2007). Barn balance calculations of Ca, Cu, K, Mg, Mn, N, P, S and Zn in a conventional and organic dairy farm in Sweden. Agric. Ecosys. Environ. 119, 160–170. doi: 10.1016/j.agee.2006.07.003
Hamelin, L. (2013). Carbon Management and Environmental Consequences of Agricultural Biomass in a Danish Renewable Energy Strategy. Ph.D. thesis, University of Southern Denmark, Department of Chemical Engineering, Biotechnology and Environmental Technology, Faculty of Engineering.
IPCC (2006). IPCC Guidelines for National Greenhouse Gas Inventories. Japan, Institute for Global Environmental Strategies (IGES). Available online at: https://www.ipcc-nggip.iges.or.jp/public/2006gl/
Luke Feed Tables (2016). Feed Tables and Nutrient Requirements of Farm Animals Used in Finland. Available online at: https://portal.mtt.fi/portal/page/portal/Rehutaulukot/feed_tables_english
Luke Statistics (2014a). Total Milk Production in Finland. Available online at: http://statdb.luke.fi/PXWeb/pxweb/fi/LUKE/LUKE__02%20Maatalous__04%20Tuotanto__02%20Maito-%20ja%20maitotuotetilasto/03_Maidon_kokonaistuotanto.px/table/tableViewLayout1/?rxid=7f5072f1-95b6-4063-977a-3c5e618a61a2
Luke Statistics (2014b). Annual Milk Production in Dairies in Finland. Available online at: http://statdb.luke.fi/PXWeb/pxweb/fi/LUKE/LUKE__02%20Maatalous__04%20Tuotanto__02%20Maito-%20ja%20maitotuotetilasto/02_Meijerimaidon_tuotanto_v.px/table/tableViewLayout1/?rxid=21e38463-29ab-4674-a639-06e6cd96d065
Luke Statistics (2014c). Annual Meat Production in Finland. Available online at: http://statdb.luke.fi/PXWeb/pxweb/fi/LUKE/LUKE__02%20Maatalous__04%20Tuotanto__06%20Lihantuotanto/02_Lihantuotanto_teurastamoissa_v.px/table/tableViewLayout1/?rxid=43e5de99-8d1b-463c-b9ad-0ea3f6861f68
Luke Statistics (2014d). Annual Egg Production in Finland. Available online at: http://statdb.luke.fi/PXWeb/pxweb/fi/LUKE/LUKE__02%20Maatalous__04%20Tuotanto__10%20Kananmunien%20tuotanto/02_Kananmunien_kokonaistuotanto.px/table/tableViewLayout1/?rxid = d5a4b4c6-9e1e-4508-b095-407488ce48b1
Luke Statistics (2017). Annual Animal Numbers in Finland. Available online at: http://statdb.luke.fi/PXWeb/pxweb/fi/LUKE/LUKE__02%20Maatalous__04%20Tuotanto__12%20Kotielainten%20lukumaara/09_Kotielainten_lukumaara.px/table/tableViewLayout1/?rxid=6563ccde-2745-492b-9c08-54aa808863eb
Luostarinen, S., Grönroos, J., Hellstedt, M., Nousiainen, J., and Munther, J. (2017a) Finnish Normative Manure System: System Documentation and First Results. Natural Resources Bioeconomy Studies 48/2017. Natural Resources Institute Finland, Helsinki. Available online at: http://urn.fi/URN:ISBN:978-952-326-443-4
Luostarinen, S., and Kaasinen, S. (eds.) (2016). Manure Nutrient Content in the Baltic Sea Countries. Natural Resources and Bioeconomy Studies 40/2016. Natural Resources Institute Finland, Helsinki. Available online at: http://urn.fi/URN:ISBN:978-952-326-272-0
Luostarinen, S., Perttilä, S., Nousiainen, J., Hellstedt, M., Joki-Tokola, E., and Grönroos, J. (2017b) Turkiseläinten Lannan Määrä ja Ominaisuudet: Tilaseurannan ja Lantalaskennan Tulokset (Quantity and Quality of fur Animal Manure: Results of Farm Surveillance and Manure Calculation). Luonnonvara- ja Biotalouden Tutkimus 46/2017. Natural Resources Institute Finland: Helsinki. Available online at: http://urn.fi/URN:ISBN:978-952-326-439-7 (in Finnish).
Marttinen, S., Venelampi, O., Iho, A., Koikkalainen, K., Lehtonen, E., Luostarinen, S., et al. (2017). Kohti Ravinnekierrätyksen Läpimurtoa – Nykytila ja Suositukset Ohjauskeinojen Kehittämiseksi Suomessa (Towards A Breaktrough in Nutrient Recycling – state-of-the-art and Recommendatoins to Develop Policy Tools in Finland). Natural Resources and Bioeconomy Studies 45/2017. Natural Resources Institute Finland; Helsinki; Finland. Available online at: http://urn.fi/URN:ISBN:978-952-326-437-3 (in Finnish).
Ministry of Agriculture Forestry (2011). Suomesta Ravinteiden Kierrätyksen Mallimaa (Finland to a Model Country for Nutrient Recycling). Report of a working group. MMM 2011:5. Helsinki. Available online at: http://mmm.fi/documents/1410837/1724539/trm2011_5.pdf/6ce8eaf4-63d0-4f1d-9379-60ff6896214d (Accessed February 17, 2018) (in Finnish).
Plaami, S., and Kumpulainen, J. (1991). Determination of phytic acid cereals using ICP-OES to determine phosphorus. J. Assoc. 74, 32–36.
Põllumajandusministerium (2014). Eri Tüüpi Sõnniku Toitainete Sisalduse Arvestuslikud Väärtused, Sõnnikuhoidlate Mahu Arvutamise Metoodika ja Põllumajandusloomade Loomühikuteks Ümberarvutamise Koefitsiendid. Available online at: https://www.riigiteataja.ee/akt/116072014008 (Accessed February 12, 2018) (in Estonian).
Poulsen, H. D., and Kristensen, V. F. (1998). Standard Values for Farm Manure. A Revaluation of the Danish Standard Values concerning the Nitrogen, Phosphorus and Potassium Content of Manure-DIAS Report No. 7. Ministry of Food, Agriculture and Fisheries. Danish Institute of Agricultural Science.
Prime Minister's Office Finland (2015). Finland–A Land of Solutions. Strategic Programme of Prime Minister Juha Sipilä's Government 29.5.2015. Government Publications 12/2015. Edita Prima: Helsinki.
Statistics Netherlands (2012). Standardised Calculation Methods for Animal Manure and Nutrients. Standards Data 1990-2008. Statistics Netherlands: Hague/Heerlen.
Suomen Hippos/Finnish Trotting and Breeding Association (2016). Statistics of Horses and Ponies in Finland. Suomen Hippos/Finnish Trotting and Breeding Association.
Velthof, G., Hou, Y., and Oenema, O. (2015). Nitrogen excretion factors of livestock in the European Union: a review. J. Sci. Food Agric. 95, 3004–3014. doi: 10.1002/jsfa.7248
Ylivainio, K., Sarvi, M., Lemola, R., Uusitalo, R., and Turtola, E. (2015). Regional P stocks in Soil and in Animal Manure as Compared to P Requirement of plants in Finland. Natural resources and bioeconomy studies 62/2015. Natural Resources Institute Finland: Helsinki. Available online at: http://urn.fi/URN:ISBN:978-952-487-505-9
Keywords: manure, manure data, mass balance, model, normative
Citation: Luostarinen S, Grönroos J, Hellstedt M, Nousiainen J and Munther J (2018) Modeling Manure Quantity and Quality in Finland. Front. Sustain. Food Syst. 2:60. doi: 10.3389/fsufs.2018.00060
Received: 22 February 2018; Accepted: 24 August 2018;
Published: 19 September 2018.
Edited by:
Tom Misselbrook, Rothamsted Research (BBSRC), United KingdomReviewed by:
Theun Valentijn Vellinga, Wageningen University and Research, NetherlandsHarald Menzi, Federal Office for the Environment, Switzerland
Copyright © 2018 Luostarinen, Grönroos, Hellstedt, Nousiainen and Munther. This is an open-access article distributed under the terms of the Creative Commons Attribution License (CC BY). The use, distribution or reproduction in other forums is permitted, provided the original author(s) and the copyright owner(s) are credited and that the original publication in this journal is cited, in accordance with accepted academic practice. No use, distribution or reproduction is permitted which does not comply with these terms.
*Correspondence: Sari Luostarinen, c2FyaS5sdW9zdGFyaW5lbkBsdWtlLmZp