 Brad G. Peter
95% of researchers rate our articles as excellent or good
Learn more about the work of our research integrity team to safeguard the quality of each article we publish.
Find out more
ORIGINAL RESEARCH article
Front. Remote Sens. , 21 June 2024
Sec. Remote Sensing Time Series Analysis
Volume 5 - 2024 | https://doi.org/10.3389/frsen.2024.1042624
Measuring agricultural productivity is a multiscale spatiotemporal problem that requires multiscale solutions. In Vietnam, rice comprises a substantial portion of the cultivated area and is a major export crop that supplies much of the global food system. Understanding the when and where of rice productivity is vital to addressing changes to yields and food security, yet descriptive summarizations will vary depending on the spatial or temporal scale of analysis. This paper explores rice trends across Vietnam over a 19-year period, giving specific attention to modifiable spatiotemporal unit problems by evaluating productivity across multiple time periods and administrative levels. A generalizable procedure and tools are offered for visualizing multiscale time-series remote sensing data in matrix and map form, not only to elucidate the effects of modifiable spatiotemporal unit problems, but also to demonstrate how these problems serve as a useful research framework. Remote sensing indices (e.g., LAI and EVI) were evaluated against national and provincial estimates across Vietnam during multiple crop production periods using the Pearson Correlation Coefficient (PCC) to establish a relationship. To overcome challenges posed by long-term observations masking emerging phenomena, time-series matrices and multi-spatial and multi-temporal maps were produced to show when, where, and how rice productivity across Vietnam is changing. Results showed that LAI and EVI are favorable indices for measuring rice agriculture in Vietnam. At the province scale, LAI compared to nationally reported production estimates reached a Pearson’s r of 0.960; 0.974 for EVI during the spring crop production period. For questions such as, “What portion of Vietnam exhibits a negative linear trend in rice production?”, the answer depends on how space and time are organized. At the province scale, 25.4% of Vietnam can be observed as exhibiting a negative linear trend; however, when viewed at the district scale, this metric rises to 45.7%. This research contributes to the discussion surrounding ontological problems of how agricultural productivity is measured and conveyed. To better confront how agriculture is assessed, adopting a multiscale framework can provide a more holistic view than the conventional single spatial or temporal selection.
Everything occurs somewhere, some time, and the effects of scale ubiquitously underpin geographic research (Harris, 2006). The modifiable areal unit problem (MAUP) is the phenomenon that spatial aggregations and observations will vary depending on the locations of sampling, the scale of analysis, and the areal delineations used (Haggett, 1965; Openshaw, 1983). Prominent examples of MAUP are described with respect to scale and zone (Fotheringham and Wong, 1991; Jelinski and Wu, 1996; Wong, 2004). Zone effects are observed when the scale is constant, but different methods of demarcation are used to organize space (e.g., aggregating across a uniform grid or as political boundaries such as counties). The scale effect is observed when aggregating takes place at one or multiple levels (e.g., regional, local, or focal scales—examples being census tract, county, state, or ecological zones).
The way space is organized also influences cartographic presentation and interpretation, i.e., data organized and aggregated by different zones will give differing views of spatial phenomena (Bird, 1989). Raster structure data and raster geoprocessing decisions are also subject to the effects of MAUP (Lechner et al., 2012). As with vector-based areal unit selections, raster masking based on geographic constraints (e.g., masking to a particular land-cover type) fundamentally alters what is sampled when aggregating across a raster (Openshaw, 1983). Temperature and precipitation data masked to agricultural land will render different descriptive statistics than if no masking had taken place. In turn, cartographic presentation and interpretation can vary depending on the geographic data alterations made and the scale of analysis (Bird, 1989). During map production, the minimum and maximum range and color scale used for symbolizing a dataset will change post-masking, and areas that were formerly not highlighted at the low or high end can become more apparent, influencing the conclusions drawn and subsequent decisions made (Figures 1A–C).
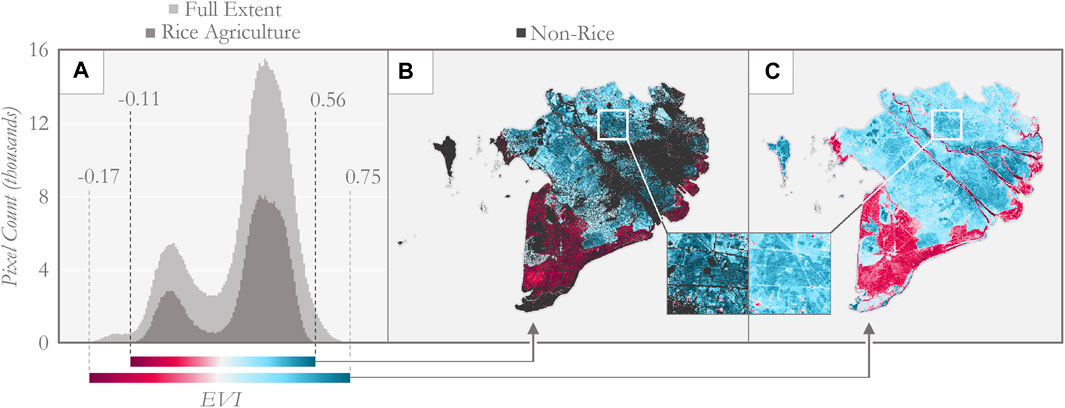
Figure 1. Demonstration of how geoprocessing steps impact the cartography and perception of a map product. (A) Histograms of 2019 mean EVI across the full extent of the MRD, as well as mean EVI masked to rice agriculture only. Dashed lines indicate the min and max of each histogram and the corresponding color ramps across each range of values. (B) Mean EVI of rice agriculture across the MRD for 2019. (C) Mean EVI across the full extent of the MRD for 2019. In this example, pixel values are consistent across (B,C), but masking has changed the data distribution, thus the color ramp is “mapped” to the pixel values differently.
Problematically, as scholars have attested, issues of scale often go ignored by geographers and geographic information systems/science (GIS) practitioners (Haggett, 1965; Cao and Lam, 1997). Additionally, literature at the nexus of agriculture and MAUP is relatively scant. A Web of Science (WOS) search for documents mentioning the “modifiable areal unit problem” or “MAUP” returned 406 articles as of 7 May 2024 (WOS, 2024). In a co-occurrence analysis of all keywords (N = 2,245) using VOSviewer (van Eck and Waltman, 2010), agriculture occurs as a keyword only twice. Rice and Vietnam do not appear as keywords. For comparison, health and land-use occur as keywords 32 and 26 times, respectively.
One approach to managing MAUP, though not always implemented and often not feasible due to various limitations, such as data availability, is by using spatial statistics or data mining to determine the optimal areal units for a specific analysis (Chen et al., 2019; de Andrade et al., 2021). However, while coined as a problem, modifiable areal unit phenomena that are elucidated by multiscale frameworks can be used to construct meaningful geographic representations (Stone, 1972; Larsen, 2000; Kolaczyk and Huang, 2001; Nelson and Brewer, 2017; Manley, 2021). Openshaw (1983) notably remarked that MAUP occurs when boundaries are drawn at the “whims and fancies” of whoever did the aggregating. Indeed, data can be arbitrarily or purposefully arranged; however, in contrast to Openshaw’s remarks, MAUP can be leveraged to enhance geographic representation when the producer has intimate knowledge of the data and the spatial context.
Parallel to MAUP is the modifiable temporal unit problem (MTUP), which describes the phenomena of data aggregations and observations varying depending on the time of observation, the temporal granularity, or the temporal range of analysis (Çöltekin et al., 2011; Cheng and Adepeju, 2014). Differences in metrics generated from data of varying temporal granularity and temporal range selections are commonly known as the temporal aggregation and temporal boundary problems, respectively. Temporal selections of the same length but shifted laterally (e.g., January to April vs. February to May) are characterized as the temporal segmentation problem in MTUP. The temporal aggregation, temporal segmentation, and temporal boundary problems associated with MTUP are comprehensively summarized by Cheng and Adepeju (2014). As is the case with MAUP, literature at the nexus of agriculture and MTUP is also relatively scant. The WOS search for documents mentioning the “modifiable temporal unit problem” or “MTUP” returned 20 articles as of 7 May 2024 (WOS, 2024). In a co-occurrence analysis of all keywords (N = 160) using VOSviewer (van Eck and Waltman, 2010), agriculture does not occur as a keyword.
One common metric—annual accumulated rainfall—can be an uncharacteristic summary when the tail end of one rainy season and the start of another are summed, such as when the crop production and rainy periods cross over the calendar year. Techniques to detrend time-series data, such as Fourier transformations, have been used to counter the effects of MTUP related to seasonality (de Jong and de Bruin, 2011); however, temporal sums and other descriptive statistics remain prominent methods for managing temporal phenomena like seasonal rainfall. In one example of MTUP, Montanher et al. (2018) demonstrated the temporal “boundary” problem while evaluating suspended sediment transport in the Amazon River. Their long-term study spanning 1984–2015 showed a negative linear trend of suspended sediment transport, while an earlier study that spanned 1995–2007 showed a positive linear trend (Martinez et al., 2009). The incongruent findings of studies such as these can result in ineffective or contradictory policy to address changes in suspended sediment transport along the Amazon River, such as imposing restrictions on deforestation and other types of land-use/land-cover (LULC) change. Even with multi-decade data, a negative trend has the potential to flip positive after a short time frame, or vice versa.
With varying temporal ranges comes different averages, minimums, maximums, and trend summaries, though while temporal selections can introduce bias, such selections can also be useful. Pertaining to rice in the Mekong River Delta (MRD), Clauss et al. (2018) provide evidence that remote sensing (RS) data, in this case Synthetic Aperture Radar (SAR), can be used to simulate rice yields per crop production period, offering temporally explicit analytics that match agricultural production cycles, rather than adopting an annual approach, which can often be a semi-arbitrary decision. Neglecting to recognize crop production cycles while monitoring agricultural productivity can result in MTUP errors, notably in regions where the crop production period crosses over the calendar year.
MAUP and MTUP are both subject to the ecological fallacy problem (EFP), which states that the characteristics of a group cannot be used to assume the characteristics of an individual (Openshaw, 1983; Piantadosi, 1988). In a time-series, a single year within a decade may not be indicative of any other single year or the decade as a whole. In spatial aggregations, summary data within polygons cannot be used to assume the characteristics of a data point or subregion within those bounds. Similarly, depending on spatial resolution, the classification of a pixel does not ensure that a point within that pixel will match the overall classification (Hsieh et al., 2001). This is the case in majority-based resampling or classification where a pixel of 1-km spatial resolution classified as agriculture may contain many other land-cover types, especially in landscapes that are complex mosaics with mixed use.
Despite well-known research addressing problems such as MAUP and MTUP, the scope of many studies consists of a singular temporal range and singular geographic extent, sometimes as an arbitrary decision, and multi-spatial and multi-temporal analytics are seldom produced (Watson, 1978; Meentemeyer, 1989; Cao and Lam, 1997). While understandable due to various constraints, any geographic and temporal selection can be a source of bias. However, rather than focusing on MAUP and MTUP as sources of bias, knowledge of the phenomena can serve to enhance or uncover a broader, more comprehensive narrative. Bird (1989) argues that understanding and giving considerations to MAUP/EFP are necessary conditions for a geographic analysis (Harris, 2006), and Stone (1972) notes that a multiscale perspective is a hallmark of the geographer’s craft and contribution to the sciences.
This paper uses the case of rice production in Vietnam to demonstrates how consideration of EFP, MAUP, and MTUP in a multiscale framework can enhance our understanding of time-series agriculture, as the case reveals that whether rice production across the country is increasing depends on both when and where the observations take place. It is critical that production estimates and spatiotemporal trends that drive policy and resource allocation are accurate and reliable. Geographers and decision-makers responsible for resource distribution and policy must be mindful of multi-scalar challenges and opportunities presented by MAUP, MTUP, and EFP. In the case study presented here, production trends are measured across Vietnam over a 19-year period, giving specific attention to modifiable spatiotemporal unit problems. Rice production estimates presented are drawn from both the Vietnam General Statistics Office (GSO) and an RS model to highlight the spatiotemporal variability across the country at multiple administrative levels and at the pixel scale. RS-based data are spatially continuous and offer finer granularity than estimates produced at the province or national scales, and RS methods facilitate generalizable models that scale across geographies, which is particularly valuable where survey data and proximal measurements are scarce. While due consideration was given to estimating rice production accurately, the primary contribution of this work is on the subject of modifiable spatiotemporal unit problems and new openly accessible tools to address them.
Furthermore, this paper demonstrates a procedure for visualizing multiscale time-series RS data in matrix and map form with rice production in Vietnam as the subject. Time-series matrices were developed here not only to demonstrate the effects of MTUP, but also to extract multi-temporal-scale information by visualizing the linear trend of every possible range of years between the full temporal extent. Multiscale maps were also constructed to highlight the fact that varying conclusions can be drawn depending on the geographic scale of analysis. It is argued here that assessing agricultural productivity through a multiscale framework provides a more holistic view of spatiotemporal variability and can serve to better tackle spatiotemporal problems.
Lastly, this paper is accompanied by two openly accessible tools for visualizing, summarizing, and communicating multi-spatial and multi-temporal phenomena. The first is a time-series matrix tool (referred to as TSMx) developed by Boumis and Peter (2021) and published to Harvard Dataverse as a script for the R Statistical Software (R Core Team, 2021). TSMx plots time-series trends and Mann-Kendall significance tests for all possible year combinations within a given temporal range (Mann, 1945; Kendall, 1975; Gilbert, 1987); the user only needs to supply a data table. Second is a multiscale mapping tool (referred to as MSZSI) published to Harvard Dataverse using JavaScript in Google Earth Engine (GEE; Gorelick et al., 2017), which processes user-selected input data and produces maps across multiple administrative levels over a user-selected time period (Peter et al., 2021). Links to these open access resources are supplied in the data availability statement.
Rice is a prominent subsistence and cash crop in Vietnam. Referred to locally as “white gold,” rice production accounts for half of all agricultural land in Vietnam and 30% of the nation’s total agricultural production value (Maitah et al., 2020). Vietnamese rice is a significant contributor to both regional and global food security; in 2019, Vietnam was the world’s third largest exporter of rice, both in export quantity (5.45 million tonnes) and value (2.43 billion USD), and the fifth largest producer of rice globally (FAOSTAT 2019). Beyond its role in global food security, rice is a significant contributor to the socioeconomic security of Vietnam. Two-thirds of Vietnam’s rural labor force is employed in rice cultivation (Shrestha et al., 2016), most of which takes place in the MRD, the country’s primary rice-producing region. Approximately 16% of Vietnam’s annual rice production is exported (Stuart et al., 2018), with rice grown in the MRD providing approximately 90% of rice exports (Tho and Umetsu, 2022) and employing approximately 2 million smallholder farmers (Brown et al., 2018).
Since the 1990s, the country has undergone agricultural intensification for the purposes of increased rice production. While yields have increased dramatically according to national statistics (from 36.9 q/ha in 1995 to 58.2 q/ha in 2019; GSO 2021), this intensification has also led to an over-reliance on inputs such as fertilizers and pesticides, leading to a number of both environmental and socioeconomic problems, such as soil degradation and rising input costs for agricultural productivity (Demont and Rutsaert, 2017; Tong, 2017; Tu, 2017; Stuart et al., 2018). The increasing production costs burden smallholder rice farmers who constitute a large proportion of the Vietnamese rice producers and hamper their ability to remain or become economically and environmentally sustainable (Stuart et al., 2018).
Moreover, the effects of climate change pose additional challenges to rice production, and overall crop production more generally. Vietnam is among 10 countries listed as the most affected from climate change between 1999 and 2018 (Eckstein et al., 2019), and impacts from climate change such as sea-level rise, flooding, and saline intrusion put rice farmers and their crops at risk, particularly those farming in delta regions (Sen and Bond, 2017; Brown et al., 2018). Vietnamese farmers have already begun experiencing negative environmental and socioeconomic impacts, all of which can have significant consequences for agricultural production and, in turn, the rural labor force (Ho and Shimada, 2019).
This study takes place at multiple spatial scales across Vietnam (Việt Nam): country, region, province, district, and pixel (Figure 2). National rice statistics were collected at the country, region, and province scale from the GSO (GSO 2021). RS and GSO data were used to construct a model to estimate rice production across each administrative level, including the district and pixel scales.
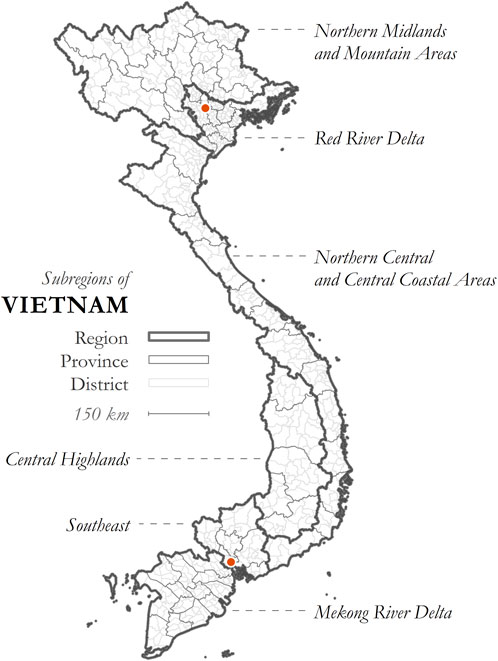
Figure 2. Subregions of Vietnam. Hanoi (North) and Ho Chi Minh City (South) are denoted with red dots on the map.
Rice is cultivated in all 6 subregions of Vietnam: (i) Northern Midlands and Mountain Areas (NMMA; Đông Bắc Bộ and Tây Bắc Bộ), (ii) Red River Delta (RRD; Đồng Bằng Sông Hồng), (iii) Northern Central and Central Coastal Areas (NCACCA; Bắc Trung Bộ and Duyên hải Nam Trung Bộ), (iv) Central Highlights (CH; Tây Nguyên), (v) Southeast (SE; Đông Nam Bộ), and (vi) MRD (Đồng Bằng Sông Cửu Long). The majority of rice production comes from MRD, RRD, and NCACCA, though each region covers considerably different geographic extents. In total, MRD produced 56% of Vietnam’s rice in 2019, RRD produced 14%, and NCACCA produced 16%; NMMA, CH, and SE accounted for 8%, 3%, and 3%, respectively (GSO 2021). Rice production trends from FAO and GSO are shown in Figure 3. According to the GSO, rice production and rice yield exhibited a positive linear trend between 2001 and 2019 (GSO 2021), but there are epochs in between that offer multidimensional information.
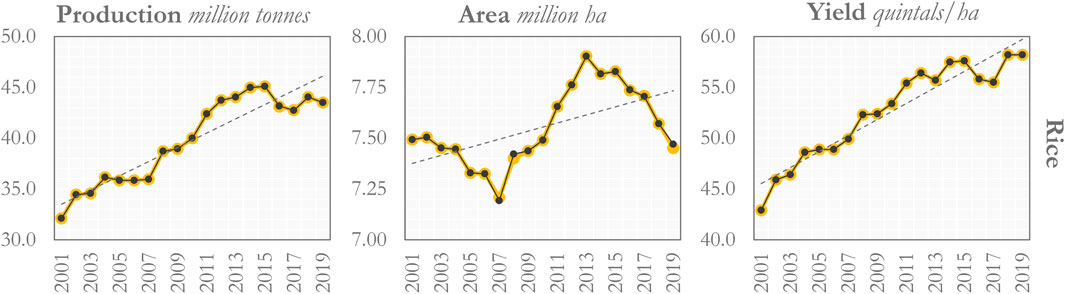
Figure 3. Rice production, area harvested, and yield across Vietnam between 2001 and 2019. Source: GSO and FAOSTAT.
To measure rice productivity, four NASA MODIS (moderate resolution imaging spectroradiometer) products were evaluated—NDVI (normalized difference vegetation index; Didan, 2015), EVI (enhanced vegetation index; Didan, 2015), LAI (leaf area index; Myneni et al., 2015), and GPP (gross primary productivity; Running et al., 2015) (Table 1). NDVI uses a ratio of the red and near-infrared (NIR) bands, i.e., (NIR—red)/(NIR + red), to evaluate vegetation health, vegetation density, and plant leaf structure (Tucker, 1979). EVI is similar to NDVI in principle, but is designed to reduce atmospheric interferences (Huete et al., 1994). LAI is a ratio of the leaf area to ground area and is estimated with MODIS using a surface reflectance and LUT (look-up-table) algorithm (Watson, 1947; Myneni et al., 2015). GPP is a function of photosynthesis and expresses the amount of carbon produced per unit area (Monteith, 1972; Running et al., 2015). These indices are commonly applied for monitoring and identifying rice agriculture in East/Southeast Asia (Xiao et al., 2006; Son et al., 2013a; Son et al., 2014; Zhang et al., 2014; Xin et al., 2020). The utility of spectral indices, namely, NDVI, LSWI (land surface water index), and EVI, to identify rice agriculture in Southeast Asia was shown in a notable publication by Xiao et al. (2006). Son et al. (2013a) demonstrated the effectiveness of LAI and EVI for monitoring rice yield in the MRD. In Son et al. (2014), it was shown that EVI performed well (and outperformed NDVI) in a large-scale yield estimation analysis in the MRD. Xin et al. (2020) used GPP from the Vegetation Photosynthesis Model (VPM) to monitor paddy rice production and planting area in Northeastern China (Zhang et al., 2017). Zhang et al. (2014) used two MOD17 products, GPP and Net Primary Production (NPP), to assess vegetation productivity more broadly following drought events in the Lower Mekong Basin.
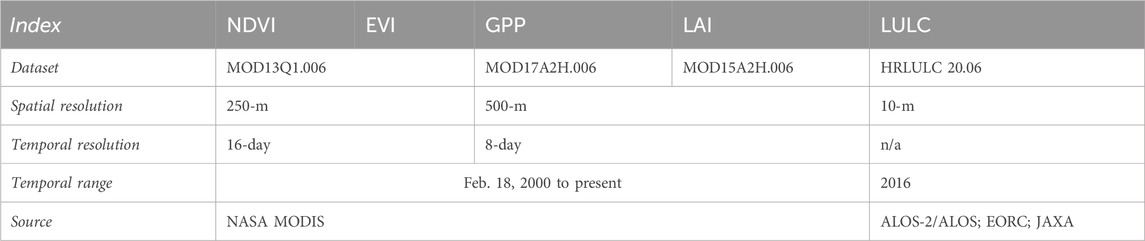
Table 1. RS indicators of rice productivity and LULC dataset used for masking RS indicators to rice agriculture.
The RS metrics are compared here to the national- and province-scale yield estimates from the GSO, and subsequently used to estimate production trends (i.e., spatiotemporal variability) at the sub-province and pixel scales. Indices were selected on the basis of demonstrated utility in monitoring rice productivity. Data were masked to rice agriculture using the High-Resolution Land Use and Land Cover (HRLULC) dataset of Vietnam provided by the ALOS Research and Application Project. Geoprocessing and data acquisition of the NASA MODIS products were conducted using GEE (Gorelick et al., 2017). Links to data used in this analysis are listed in the data availability section. The code used for extracting the RS-based indices and generating zonal statistics from GEE is openly available on Harvard Dataverse: https://doi.org/10.7910/DVN/M4ZGXP (Peter et al., 2021). The full procedure is outlined in Figure 4 and the following sections detail the workflow.
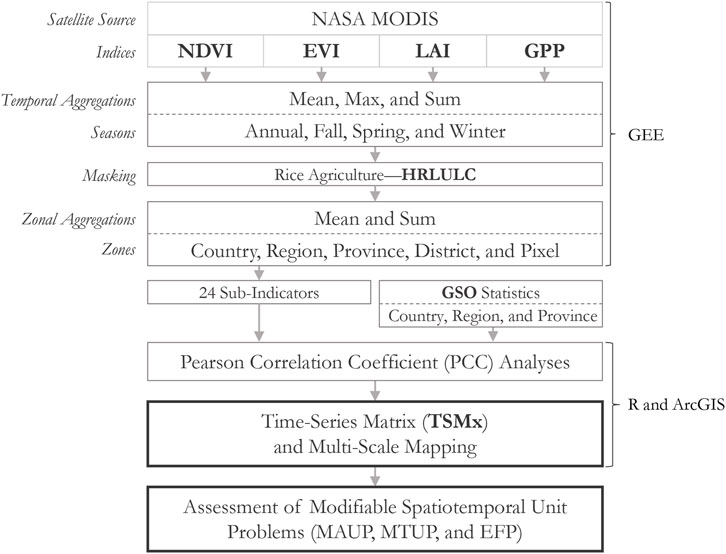
Figure 4. Workflow diagram showing the process of relating remote sensing-based indices to rice production estimates and constructing multi-spatial and multi-temporal products for evaluating modifiable spatiotemporal unit problems.
This study uses four primary indicators (NDVI, EVI, LAI, and GPP) and in total there are twenty-four sub-indicators. All sub-indicators were compared to both production and yield from the GSO database. The labeling structure follows the format: Indicator-TemporalAggregation-SpatialAggregation, e.g., LAI-X-S is LAI aggregated temporally using the maximum and spatially using the sum. In this labeling structure M = mean, X = max, and S = sum. All sub-indicators: (i) EVI-M-M, EVI-M-S, EVI-S-M, EVI-S-S, EVI-X-M, EVI-X-S, (ii) NDVI-M-M, NDVI-M-S, NDVI-S-M, NDVI-S-S, NDVI-X-M, NDVI-X-S, (iii) LAI-M-M, LAI-M-S, LAI-S-M, LAI-S-S, LAI-X-M, LAI-X-S, (iv) GPP-M-M, GPP-M-S, GPP-S-M, GPP-S-S, GPP-X-M, GPP-X-S.
This study adopts an approach by Clauss et al. (2018) who used time-series Sentinel-1 SAR to estimate rice production at the district scale for the MRD, achieving an R2 of 0.93 for the Winter-Spring production period, and R2 values of 0.86 and 0.87 for the Summer-Autumn and Autumn-Winter production periods, respectively. Data were aggregated annually and across three distinct temporal periods, which correspond with typical planting periods and regional rice production cycles: 1) Annual (total across the Fall, Spring, and Winter production periods), 2) Winter-Spring (Dong-Xuan; January to April; labeled here as Spring), 3) Summer-Autumn (He-Thu; May to August; labeled here as Fall), and 4) Winter (Lua Mua; July to October; labeled here as Winter); rice production periods selected are based on FAO (2002), Son et al. (2013b), and Phan et al. (2018). At the time of analysis, the official estimates of rice production/yield that overlapped with the MODIS data availability was 2001–2019. It is important to note that there is some overlap in the typical crop production periods due to variations in planting dates. A sophisticated model addressing this temporal problem might benefit from computing per-pixel planting dates; however, extracting the maximum value over the ranges is one way to isolate peak plant growth.
A Pearson correlation coefficient (PCC) test was conducted to evaluate which RS indicators were most strongly correlated with the GSO reported rice production and yield between 2001 and 2019. The PCC analysis was conducted in R using the “ggcorr” and “cor” functions in the “GGally” package (Schloerke et al., 2024); the code used is openly accessible on Harvard Dataverse (Peter and Messina, 2019). Pixel-scale temporal aggregations were calculated using the mean, max, and sum, then zonal aggregations calculated using the mean and sum across three administrative levels (country, region, and province). The number of records used for the PCC varied depending on the temporal and regional scales of assessment. At the country scale, 19 records were used per sub-indicator for the PCC; 114 at the regional scale (sans spring, where N = 76); and at the provincial scale the number of records varied depending on the time period (1,185, 574, 1,177, and 1,101 for the annual, fall, spring, and winter periods, respectively). Province-scale PCC was also conducted for the MRD (N = 157–244) and RRD (N = 209) individually (Table 2).
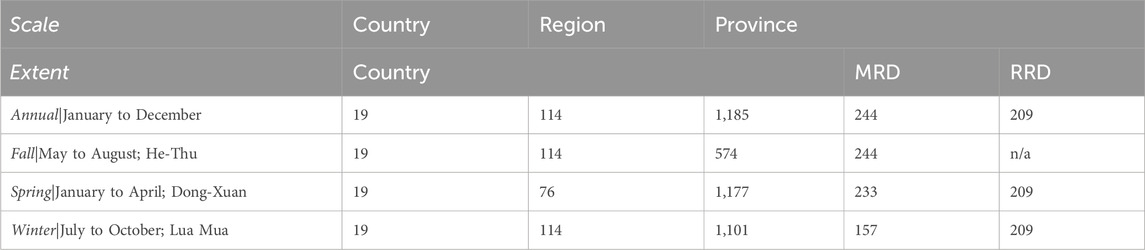
Table 2. Number of records used for calculating Pearson’s r.
After determining effective RS indicators at the province scale for relation to rice production, the closest estimations were mapped and time-series matrices produced. Maps include rice productivity (as measured via RS indicator, in this case LAI) at multiple spatial scales—province, district, and pixel (500-m spatial resolution). The geographic extent is for all of Vietnam with an additional focus on the MRD. To illustrate both types of modifiable spatiotemporal unit problems in concert, maps were produced to show 1) which areas exhibited positive or negative linear trends between 2001 and 2019, and 2) which areas experienced a flip from positive to negative, a flip from negative to positive, or no change between the decades of 2001–2010 and 2010–2019 (the full temporal range parsed into two equal epochs).
The TSMx output shows the start year on the y-axis and the end year on the x-axis; each cell stores the relevant information, in this case the slope of the linear regression line (positive or negative) for all possible year ranges within the study period. Raw slope or magnitude of change can also be plotted using a color gradient, rather than a binary categorization. The structure is similar to that of a correlation matrix, or a correlogram, such as the ones produced using the “GGally” package in R with the “ggpairs” function (Schloerke et al., 2024) or the “corrgram” package (Wright, 2021). The TSMx diagrams for the manuscript were prepared using slope calculations and conditional formatting options in Microsoft Excel; a sample template is provided on Harvard Dataverse at https://doi.org/10.7910/DVN/ZZDYM9 (Boumis and Peter, 2021). The structure can accommodate alternative time ranges with minimal modifications, though a programmatic version was also developed for use in the R Statistical Software (Boumis and Peter, 2021; R Core Team, 2021). The TSMx R script can be used to construct time-series matrices of the kind presented here and has the flexibility to accommodate any year range. In addition to the binary positive or negative slope classifications, slopes can be displayed as a gradient with Mann-Kendall significance calculated (Mann, 1945; Kendall, 1975; Gilbert, 1987). The script requires only a 2-column table of years and values as input.
One of the benefits of a TSMx over the conventional time-series plot is that it removes any visual ambiguity when determining whether a slope is increasing or decreasing over any particular time window. It also allows for immediate visual interpretation of epochs within a broader time-series that experienced a long-term trend or a short-term event, which will appear as large or small clusters in the matrix, respectively. TSMx serves as a supplemental tool alongside traditional time series charts for visualizing and interpreting multi-temporal problems. Furthermore, the matrix elucidates temporal clusters of positive or negative trends, i.e., long-term periods of increase or decrease, as well as individual anomalous incidents. Temporal trends displayed in this manner can be a useful tool for discerning short- and long-term trends and isolated incidents that can be linked to both biophysical and socioeconomic factors.
Overall, LAI and EVI sub-indicators most often exhibited the strongest correlation with GSO production and yield estimates across crop production periods and spatial scales (Table 3). This evidence is consistent with other studies, such as Son et al. (2014), who demonstrated a significant relationship between rice productivity and LAI and EVI. At the country scale, the Pearson’s correlation for production and yield were high (Pearson’s r > 0.770; except for winter rice production), though there were few data points available for testing. Country scale LAI and GSO rice metrics are plotted alongside each other in Figure 5.

Table 3. Sub-indicator with the maximum Pearson’s r for each crop production period and scale as compared to GSO production/yield estimates. A, annual; F, fall; S, spring; W, winter.
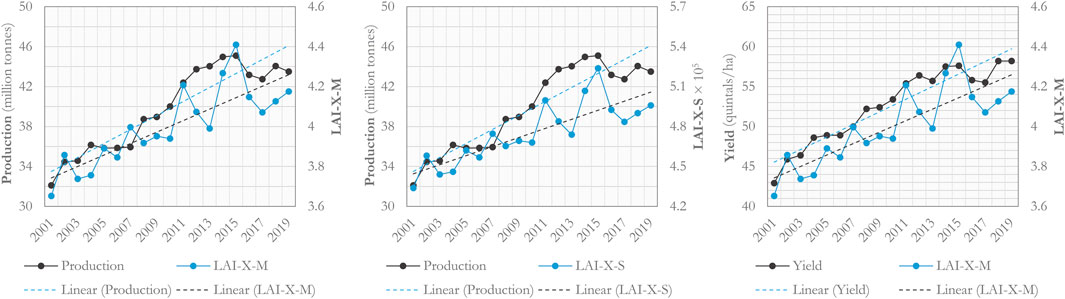
Figure 5. Time-series comparison of RS sub-indicators and rice production and yield at the country spatial scale and annual temporal scale.
The region and province scale evaluations show a contrast between the RS indicator correlations to yield and production, with Pearson’s r being substantially higher in the production comparisons. For example, the top performing RS indicator for rice production at the province scale (annual temporal scale) was LAI-X-S with a Pearson’s r of 0.960, whereas the top performing correlation to yield was EVI-X-M with a Pearson’s r of 0.443. The differences between RS indicator correlations to rice yield and production are consistent across crop production periods. This distinction is notable considering that zonal means are a common selection for aggregating indices across space, but this study supports using the zonal sum for estimating production.
Some variation in the relationship is due to variable planting/harvesting dates across regions. All of the top performing RS indicators across crop production periods, regions, and productivity metrics are presented in Table 3. Moving forward, LAI-X-S was selected as the primary indicator of rice production for the maps and matrices given that it performed consistently well; all LAI-X-S results with respect to rice production are listed in Table 3. Scatterplots of the RS indicators with GSO production and yield estimates are shown in Figures 6A–F. Stronger correlations exist between the RS indicators and production than with those compared to yield. At the annual temporal scale, LAI-X-S exhibits the strongest correlation with rice production across Vietnam (using province-scale data) with an R2 of 0.92. While this correlation presents strongly, it is important to note that the correlation can be attributed in part to large variations in the magnitude of rice production across Vietnam. For comparison, the correlation between LAI-X-S and rice production across Vietnam (using country-scale data; annual temporal scale) resulted in an R2 of 0.78. Furthermore, despite this analysis considering multiple time windows (i.e., annual, fall, spring, and winter), the annual production metrics tracked well with the RS data and were used for demonstrating MAUP/MTUP/EFP effects in the following sections (Table 3).
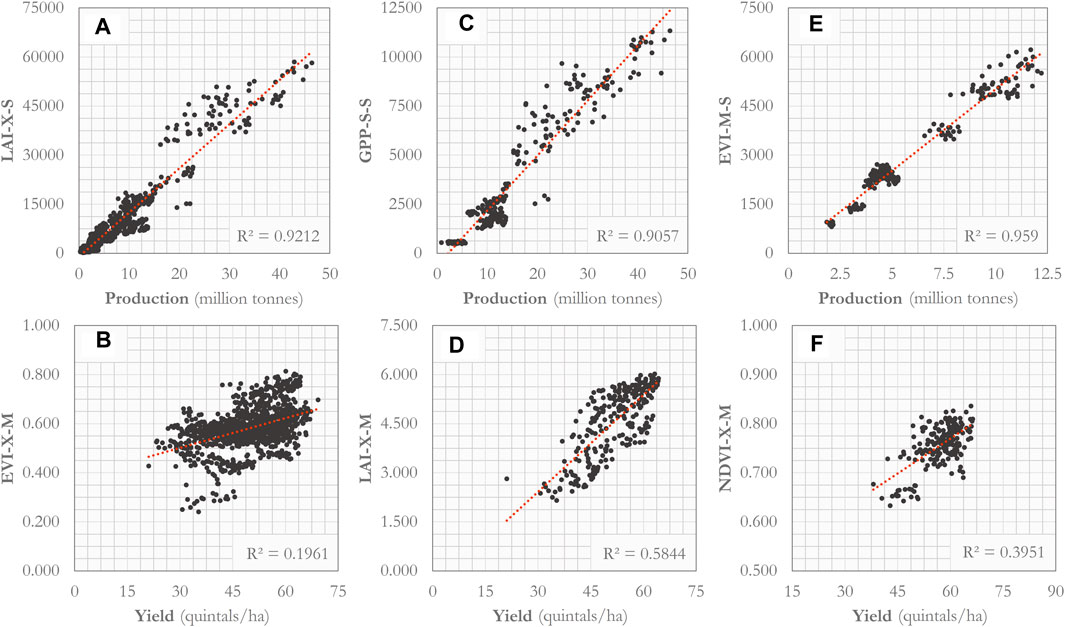
Figure 6. Top RS sub-indicators in relation to rice production and yield at the province spatial scale and annual temporal scale. (A) LAI-X-S related to production, (B) EVI-X-M related to yield, (C) GPP-S-S related to production, (D) LAI-X-M related to yield, (E) EVI-M-S related to production, and (F) NDVI-X-M related to yield.
Figure 7 shows the TSMx diagrams for the GSO production and rice yield, respectively. For the most part, both metrics have steadily increased over the 19-year period under study (gray cells marked with a plus symbol denote a time window with a positive slope); however, there are notable periods where a downshift took place (red cells with a minus symbol). Declines in rice productivity appear in 2012/2013, a trend which is mirrored by EVI-X-M and LAI-X-S in Figure 8. These declines may signal a projected decline in future years, but may only be a temporary change or plateau. That is, a time-series trend can shift positive or negative on an annual basis and an observed trend may only be relative to the temporal range under observation and not indicative of what is to come in the near or far future (Burke et al., 2022). EVI-X-M is also presented for illustration in Figure 8 since it is a common method for estimating rice productivity in Vietnam (Son et al., 2013a; Son et al., 2014). This TSMx depicts more compelling evidence of an emerging downward trend in rice production, and is consistent with observations (Chau 2021). Interestingly, this is a time period (2012/2013) in which Vietnam was contending with an oversupply of rice, which is noted by an export target reduction from 7.5 to 7.0–7.2 million tons by the Vietnam Food Association (VFA) due to trade competition (Tran, 2013); more context is given in the discussion section (4.1).
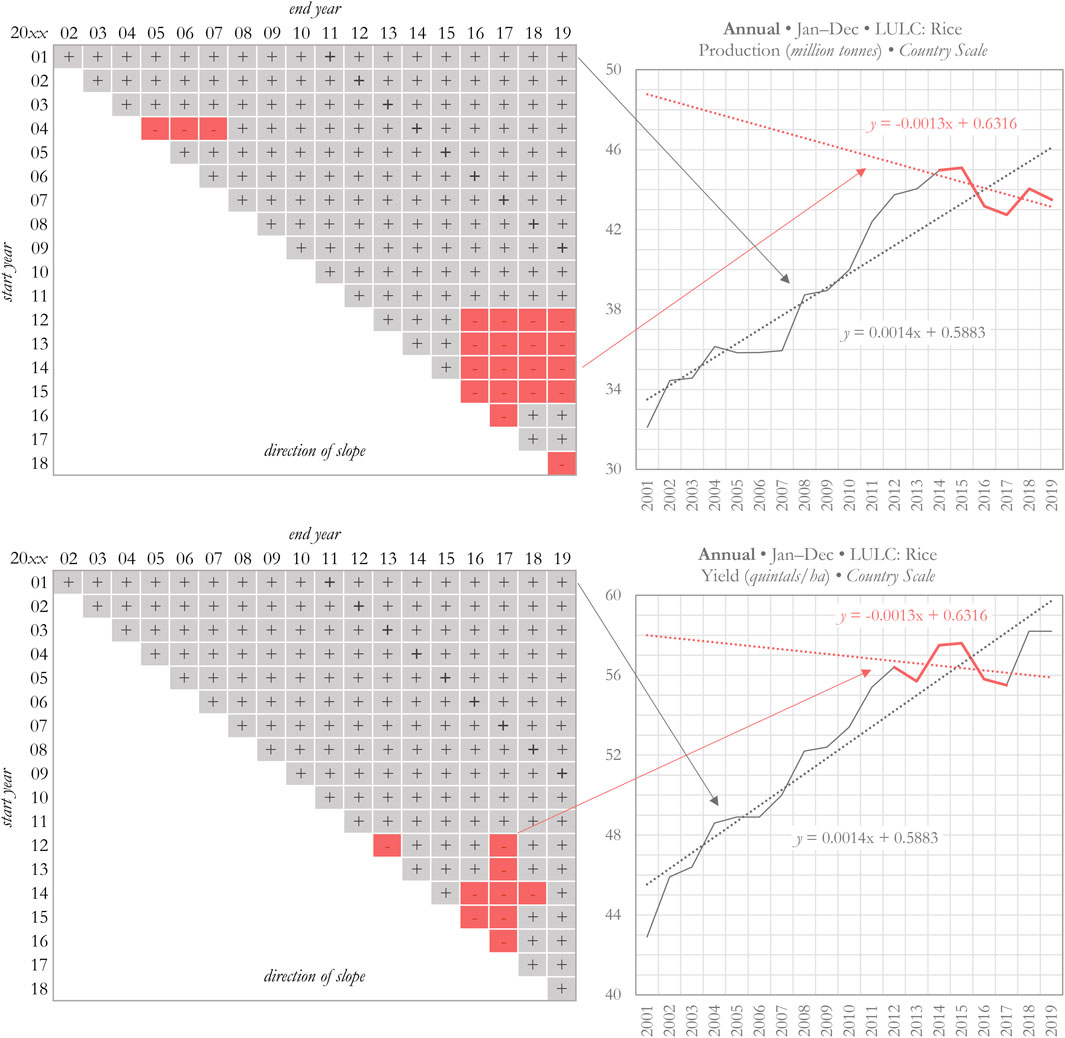
Figure 7. Top: GSO Rice production TSMx. Black: 2001–2019; red: 2012–2017. Bottom: GSO Rice yield TSMx. Black: 2001–2019; red: 2014–2019. Specific temporal range highlighted (in red) to demonstrate a contrasting trend (negative) to the complete time-series (positive) and show how it corresponds with the matrix.
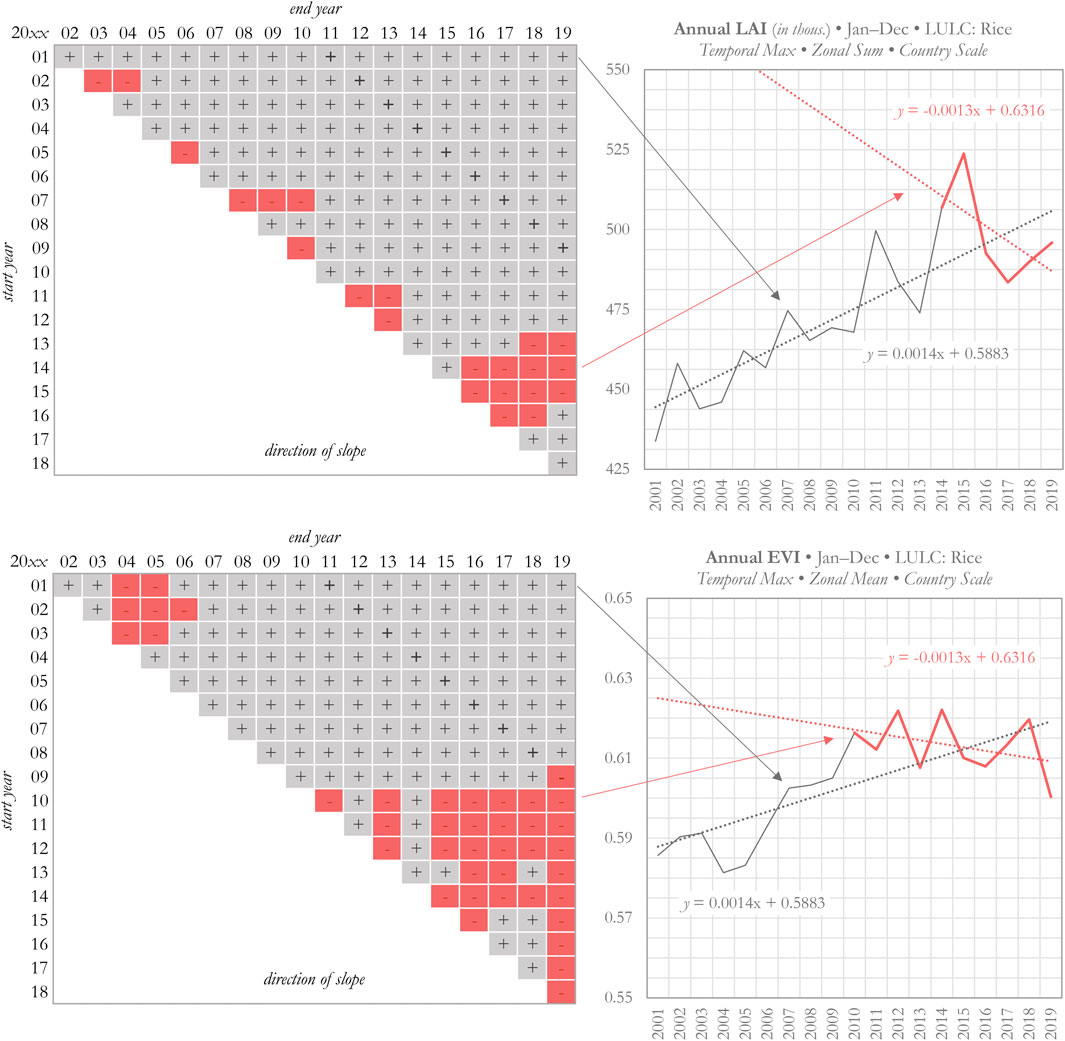
Figure 8. Top: LAI-X-S TSMx. Black: 2001–2019; red: 2014–2019. Bottom: EVI-X-M TSMx. Black: 2001–2019; red: 2010–2019. Specific temporal range highlighted (in red) to demonstrate a contrasting trend (negative) to the complete time-series (positive) and show how it corresponds with the matrix.
Overall, the RS indicators and GSO statistics are visually comparable. Across the temporal range (2001–2019) there is a general positive linear trend for the majority of the intra-temporal year ranges. Rice production shows a short-term negative trend in the years following 2004 (2004–2005, 2004–2006, 2004–2007) before flipping positive in 2008. In the last decade, the RS indicators and GSO statistics are consistent in depicting an emergent negative linear trend (Figures 7, 8). Additionally, to highlight the multi-spatial and multi-temporal scale results, a TSMx diagram is also presented for the MRD spring production period using LAI-X-M (Figure 9), which was the strongest yield correlation for the MRD (Pearson’s r of 0.731; R2 of 0.53).
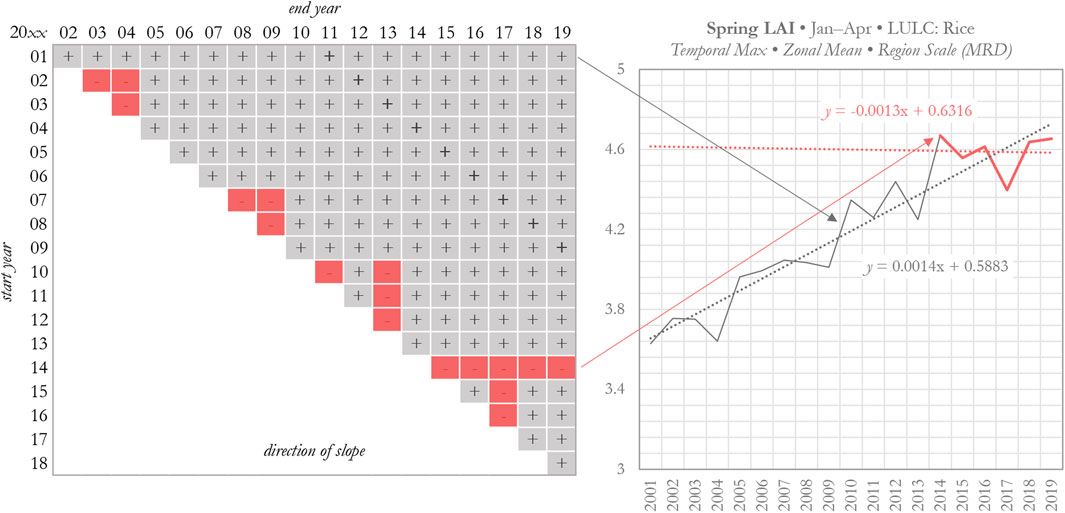
Figure 9. LAI-X-M TSMx for the MRD spring crop production period. Black: 2001–2019; red: 2014–2019. Specific temporal range highlighted (in red) to demonstrate a contrasting trend to the complete time-series (positive) and show how it corresponds with the matrix.
The following maps show the combined effects of MAUP and MTUP. Figures 10A–D show time-series trends at the province and district scales (continuous values representation) between 2001 and 2019 and Figures 11A–D illustrate binary positive or negative linear trends. The binary classification was used in the following summarizations to highlight the modifiable spatiotemporal unit problems. At the province scale, 16 of 63 (25.4%) exhibited a negative trend; at the district scale, 300 of 657 (45.7%) exhibited a negative trend (measured via LAI-X-S; Figures 10A, 11A). Of the HRLULC rice agriculture pixels across Vietnam, 34.7% exhibited a negative linear trend (2001–2019; maximum LAI). Figures 11B, C show linear trends between 2001 to 2010 and 2010 to 2019, respectively. These two time periods are an equal parsing of the complete temporal range and are used to demonstrate how temporal selections impact conclusions drawn. Focusing solely on a complete temporal range can mask the emergence of directional shifts; in some cases, assessing emerging trends may be more effective for policy than results driven largely by legacy data. Figure 11D compares 2 decades (2001–2010 and 2010–2019) to show which zones exhibited a trend direction switch. In the most recent decade, 12 provinces flipped negative (19.0%), 10 flipped positive (15.9%), and 41 (65.1%) showed no change (i.e., continued trajectory); 128 districts flipped negative (19.5%), 164 flipped positive (25.0%), and 365 (55.6%) showed no change (Table 4). To summarize, at the province, district, and pixel scales it could be stated the proportion of Vietnam exhibiting a negative trend is either 25.4%, 45.7%, or 34.7%, respectively.
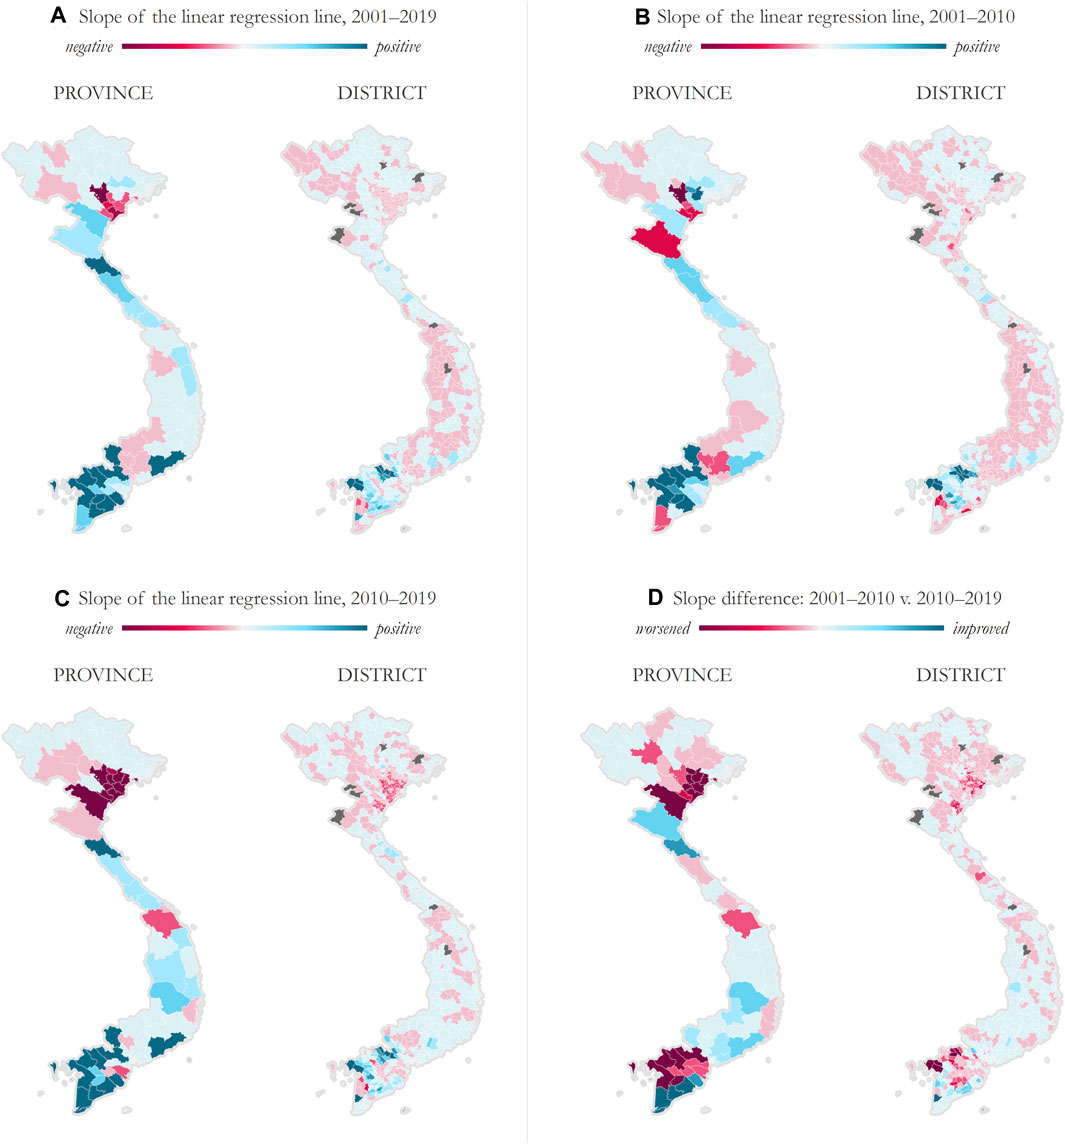
Figure 10. Temporal trends and decades comparison showing slope of the linear regression line (LAI-X-S) at the province and district scales. Symbology is based on a < −100 to >100 scale. Figure 11 shows the same data in binary form. (A) Slope of the linear regression line: 2001–2019, (B) Slope of the linear regression line: 2001–2010, (C) Slope of the linear regression line: 2010–2019, and (D) Slope Difference: 2001–2010 v. 2010–2019.
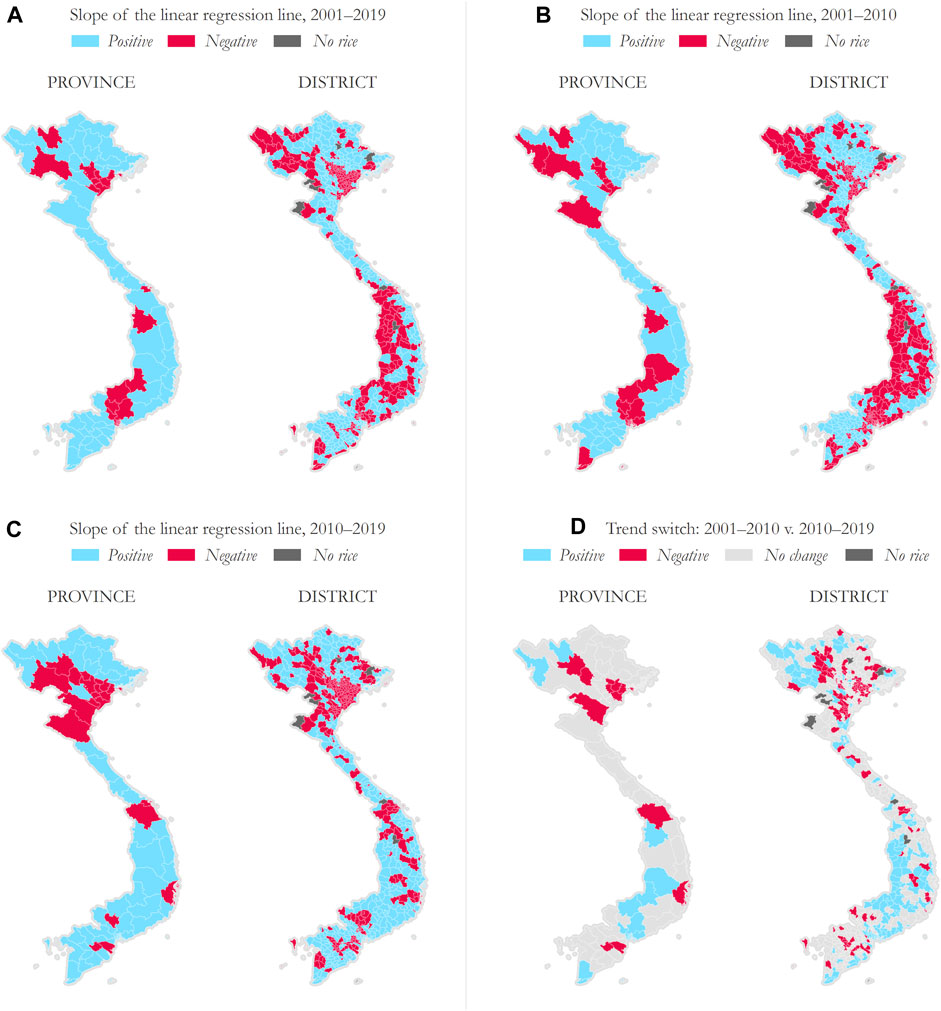
Figure 11. Temporal trends and decades comparison showing positive or negative trends and locations with a linear trend switch (LAI-X-S)—province and district scale. This is a binary reclassification of Figure 10. (A) Slope of the linear regression line: 2001–2019, (B) Slope of the linear regression line: 2001–2010, (C) Slope of the linear regression line: 2010–2019, and (D) Trend switch: 2001–2010 v. 2010–2019.
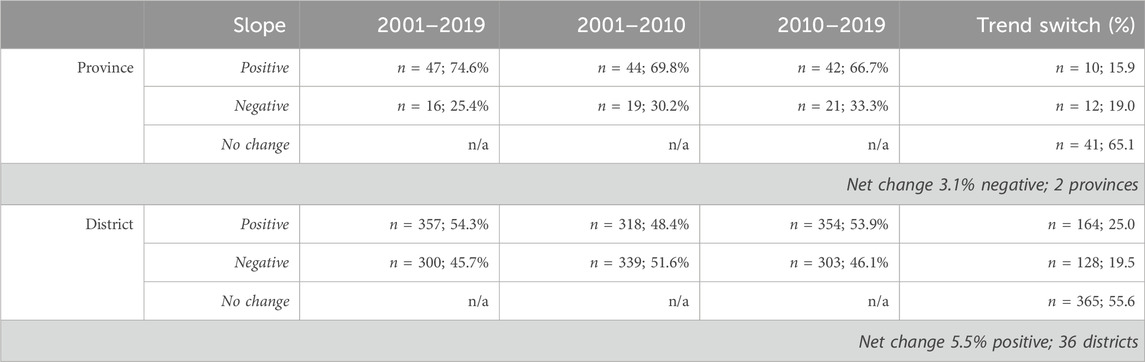
Table 4. Rice production summary of trends and slope flips for 2001–2019, 2001–2010, and 2010–2019 at the province and district scales across Vietnam.
At the pixel scale across all of Vietnam, between 2001 and 2010, 58.1% exhibited a positive trend and 41.9% exhibited a negative trend. Between 2010 and 2019, 56.0% exhibited a positive trend and 44.0% exhibited a negative trend. Across the full time-series, 2001–2019, 65.3% exhibited a positive trend and 34.7% exhibited a negative trend. Comparing the 2 decades (2001–2010 and 2010–2019) shows which pixels exhibited a trend direction switch. In the most recent decade, 25.8% of all pixels flipped negative, 23.7% flipped positive, and 50.6% showed no change (i.e., continued trajectory). Figure 12A again shows the combined effects of MAUP and MTUP, but at the pixel scale for the MRD. At the pixel scale, between 2001 and 2010, 64.2% exhibited a positive trend and 35.8% exhibited a negative trend. Between 2010 and 2019, 67.8% exhibited a positive trend and 32.2% exhibited a negative trend. Across the full time-series, 2001–2019, 77.4% exhibited a positive trend and 22.6% exhibited a negative trend. Figure 12B compares 2 decades (2001–2010 and 2010–2019) to show which zones exhibited a trend direction switch. In the most recent decade, 21.2% of all pixels flipped negative, 24.8% flipped positive, and 54.1% showed no change (Table 5).
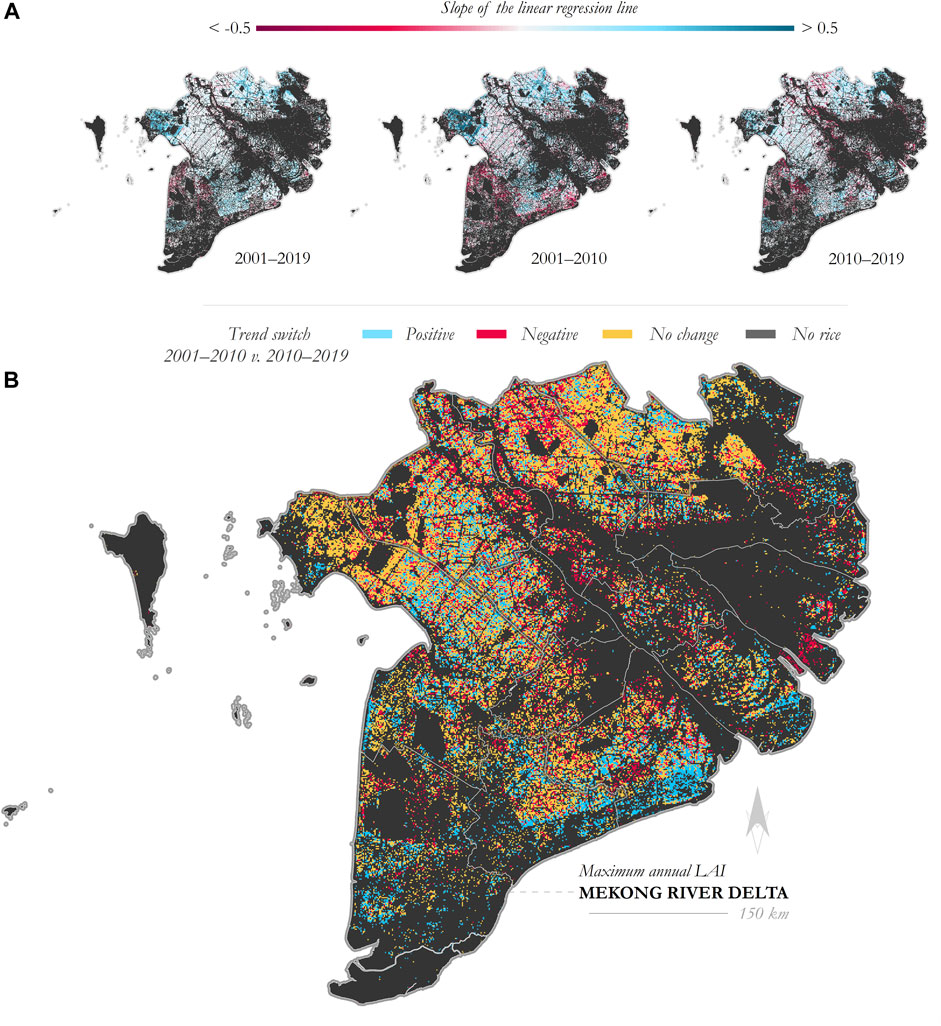
Figure 12. (A) Slope of the linear regression line for time periods 2001–2010, 2010–2019, and 2001–2019. (B) Linear trend switch (LAI-X-S)—pixel scale.
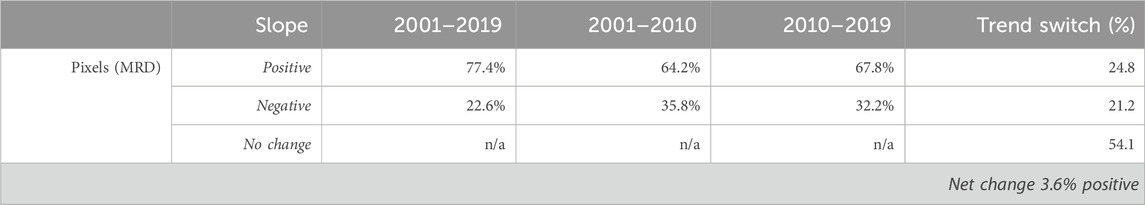
Table 5. Rice production summary of trends and slope flips for 2001–2019, 2001–2010, and 2010–2019 at the pixel scale across the MRD.
Table 6 shows a breakdown of trends across nested scales, i.e., country, RRD, and all the provinces within RRD. While the country exhibited a positive linear trend across the study range, RRD exhibited a negative trend; however, the province scale is more nuanced. At the annual temporal scale, 7 provinces exhibited a negative trend, which aligns with the regional trend, but 4 provinces within the area exhibited a positive trend. This is an example where a nested zone can exhibit a different or contrasting result and assuming that a zone exhibits the characteristics of a greater zone of which it is a part would be indicative of the EFP. Furthermore, this is not an uncommon phenomenon, which is why it is important to select a scale that is relevant to analysis, policy, or extension (Shariff et al., 2011; Peter et al., 2018). In Peter et al. (2021), there is an example of stark contrast across scales within the MRD—positive trend at the province scale (Sóc Trăng) and negative trend at the district scale (Cù Lao Dung).
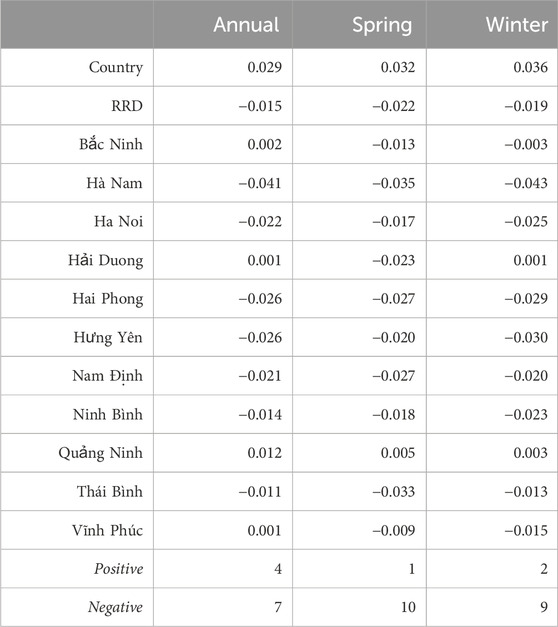
Table 6. Slope of the linear regression line (LAI-X-M) for the country, RRD, and each of the provinces within the RRD.
The recent negative trend in Vietnamese rice production has been noticed before, though without the nuance of scale demonstrated in this paper. Explanations for the downturn range from economic to ecological. Kompas et al. (2012) identified the start of the trend, while Pedroso et al. (2018) observed productivity decreases. Both theorized a downturn could be due to agricultural land fragmentation, a result of land allocation policies, as well as increasing urbanization. Yuen et al. (2021), after doing a review of literature around the factors affecting rice yields, notes that anthropogenic developments meant to improve agricultural productivity can create many unwanted environmental consequences such as an increase in flooding, saltwater intrusion, and land subsidence, which in turn decreases rice production and quality. In addition, they note that natural hazards may amplify the problems created by human activities (Yuen et al., 2021). Nguyen et al. (2019) also attributed impacts on Vietnamese agricultural productivity to rural-urban migration and urbanization. Laiprakobsup (2019) introduced a broader lens, focusing on the association between the reduction of tax and trade barriers and the growth of rice productivity. In 2013, Tran (2013) and various news outlets noted overproduction of rice and problems of lowered prices, so it is possible that a downturn in productivity can actually signal desired outcomes, both economic and environmental (Ives, 2013). In 2023, the Vietnam government announced its aim to reduce rice exports to 4 million tons by 2030 for the purposes of food security, climate change adaptation, and quality control (Vu, 2024).
In addition to political and economic factors, many scholars cite crop management decisions as potentially impactful. Chapman and Darby (2016), among others, suggest that the increase in dyke network heights (an infrastructure improvement process that began in the 2000s) to help mitigate flooding issues also excludes nutrient-rich sediment from the protected areas in the long-term. More than a decade out, recent negative trends could be a manifestation of the impacted soil. Similarly, the three-crop method that allows for intensified production requires high dykes to be implemented but has been criticized as unsustainable in the long-term (Tong, 2017). Other possible explanations include adaptation to climate change (or lack thereof) and the resulting salinity issues in the delta regions (Ho and Shimada, 2019). Vietnam is highly vulnerable to climate change, especially sea level rise (Dasgupta et al., 2009). Increasing salinity concentrations in river basins results in lower agricultural productivity (Pedroso et al., 2018). The pixel-scale analysis presented here of the MRD does indeed show recent declining trends throughout the region (Figure 12); however, contrasting evidence is illustrated by an apparent increase in productivity in much of the cultivated region along the MRD coast.
Rice farmers could also face a productivity plateau, where improvements in inputs and increasing fertilizer use now result in diminishing returns to scale. Tu (2017) surveyed farmers who reported decreasing returns to scale since the 2010s. Since 2003, the Vietnamese government has adopted policies to improve crop management practices, including the ‘One Must Do, Five Reductions’ (1M5R) model favored in 2006 (Stuart et al., 2018). The one “must do” of 1M5R is to use good-quality seeds, while reducing seed rates, pesticide use, fertilizer inputs, water use, and postharvest losses. Compliance with 1M5R is mixed; Connor et al. (2020) found that farmers struggled to reduce their fertilizer use, water use, and seed rate—all of which could contribute to a flattening or even decreasing productivity curve.
Realistically, the probable cause of decreasing rice production trends is a combination of the forces and factors listed above. Just as there is heterogeneity in production trends, so too is there in explanatory factors. The problems posed by agricultural intensification and climate change are not felt equally across regions and potential solutions for one area should not be assumed to be equally viable in another area. Variability in environmental conditions and constraints, as well as the extent of financial assets available to stakeholders, should be considered when addressing agricultural production across a country. This is why the MAUP/MTUP method is so useful—it can help pinpoint the temporal and spatial hotspots and serve as a constraint on theories of observed changes in production. For example, if productivity is decreasing in a region that has largely adopted 1M5R and does not display fragmented agricultural land, exploring climate and environmental factors could be more fruitful than focusing on agricultural or land-use policy.
The MAUP/MTUP method also highlights the need for data at multiple scales. Despite the preponderance of agriculture in Vietnam, rice in particular, agriculture, forestry, and fishing (AFF) receives disproportionately little in foreign direct investment (FDI) compared with manufacturing and real estate activities (GSO 2021). According to GSO (2021), between 2005 and 2019, FDI related to AFF was, on average, 134.4 million USD per year. While the overall monetary contribution of FDI toward AFF has trended positive between 2005 and 2019, the relative contribution (both the number of projects and the amount of capital) among all FDI has trended negative. In 2005, 39.1 million USD went toward AFF, and in 2020, 104.1 million USD went toward AFF, though with some interannual volatility (standard deviation of 60.9 million USD; maximum of 258 in 2015; minimum of 36.2 in 2010). In 2005, the proportion of projects related to AFF was at 2.0% and in 2019 dropped to 0.4%; in terms of capital, the proportion of money directed toward AFF was 0.7% in 2005 and 0.3% in 2019. However, at a national level, and aggregated to include all AFF projects, FDI data reveals little about the impact of FDI on Vietnam’s rice production. Even if all else remained the same, FDI disaggregated to the province or district level combined with the MAUP/MTUP method could be used to discern where and when FDI may be a positive driver in production and/or yield improvements.
What proportion of Vietnam is experiencing, or has experienced, a decrease or increase in rice production? The answer to this question varies depending on both the temporal and spatial scale. The results here demonstrate multiple ways the question can be addressed using the same underlying data, in this case LAI-X-S. 1) When data are aggregated by province, approximately 25.4% of the regions in Vietnam exhibit a negative linear trend between 2001 and 2019. 2) When data are aggregated by district, approximately 45.7% of the regions in Vietnam exhibit a negative linear trend between 2001 and 2019. On rice agriculture across Vietnam at the pixel scale (in this case LAI at a 500-m spatial resolution), 34.7% exhibited a negative linear trend from 2001 to 2019. All three scales produce a different metric when addressing the same question. These results demonstrate the impact that the spatial arrangement of data aggregations can have on data interpretation, both visually and quantitatively. The characteristics of individual districts within each polygon can greatly influence the way the province becomes characterized and it would be a fallacy (i.e., the EFP) to assume that any district within a province exhibits the characteristics of the whole. In one specific case, the province of Dak Lak presents as a positive linear trend (2001–2019); however, 7 of 13 districts within that region exhibit a negative linear trend. As for the MRD region, 39 of 124 districts exhibit a negative linear trend (2001–2019), yet at the province scale all 13 provinces exhibit a positive linear trend. Furthermore, this research shows that the optimal index and type of spatiotemporal aggregations differ across spatiotemporal scales, making a one-size-fits-all approach to measuring rice production across Vietnam a challenge, though it should be noted that LAI-X-S performed consistently well.
Answers to these types of questions also vary temporally. For example, what fraction of Vietnam is experiencing a negative linear trend in rice production? At the province scale, 33.3% of provinces exhibited a negative linear trend between 2010 and 2019, yet at the district scale, 46.1% of districts exhibited a negative linear trend between 2010 and 2019. The overarching trend from 2001 to 2019 is not indicative of the most recent decade (2010–2019) for many provinces and districts, which can impact how resources are distributed and potentially negatively impact the return on investment if resources are delivered to places that do not have a present need. While new data can and do update our knowledge, narratives drawn often persist beyond their scope. In some cases, there is not enough data to determine whether a trend shift will persist another year or into the future (Burke et al., 2022). Should a reversed trend continue, it can still take time for the scientific community and the literature to catch up and shift a longstanding narrative. This analysis serves as a reminder that long-term trends and “recent” metrics are not necessarily representative of current conditions.
As has been mentioned throughout this study, multiscale problems require multiscale solutions, and a geographically explicit multiscale framework offers unique insights (Stone, 1972). Section 4.1 discussed relationships between observational data and policy on the ground, but what value can multiscale mapping add? In view of the 2023 plan to limit rice production, where should agricultural investments focused on improved rice productivity be directed? It is argued here that one benefit of the multiscale perspective is that it offers a better framework for the resource/policy pipeline. In Vietnam, the agricultural extension (AE) sector is critical infrastructure for transferring knowledge and technologies to farmers, and each province has a center for AE, which extends down to the district and commune level (Truong, 2022). AE agencies are designed to serve multiple scales, thus multiscale maps can serve to aid such agencies in the decision making process (Shariff et al., 2011). For example, in Figure 1A, at the regional scale, the MRD exhibits an overall positive trend from 2001 to 2019, which holds at the province scale; however, at the district scale we can observe existing heterogeneity, with 31% of districts exhibiting a negative trend. The same framework can also be employed to disentangle the cross-scale spatial variability of rice production (in combination with trend data) to identify potential target areas for: 1) districts that exhibit a negative trend and are not meeting production needs, 2) districts that exhibit a negative trend but are meeting production needs, 3) districts that exhibit a positive trend but are not meeting production needs, and 4) districts that exhibit a positive trend and are meeting production needs. Scenario three, where districts exhibit a positive trend but are meeting (or exceeding) production needs may not need investments in agriculture. On the other hand, in scenario one, where districts exhibit a negative trend and are not meeting production needs would be candidates for agricultural improvement efforts. To summarize, agencies and institutions enacting policy or aid at the country, region, province, and district scales, may require intra-country, intra-region, intra-province, and intra-district scale spatial information, respectively, to more effectively address spatial problems (Figure 13).
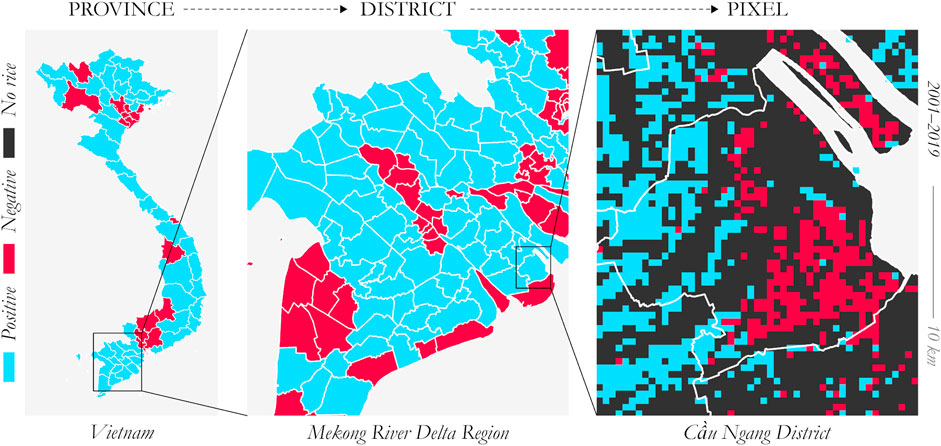
Figure 13. Multiscale pipeline—data presented at actionable administrative levels and disentangling heterogeneity across spatial scales. Shown are Vietnam (province scale), the MRD region (district scale), and Cầu Ngang District (pixel scale). Maps depict positive and negative slopes of the linear regression line from 2001 to 2019 as measured via LAI-X-S.
One challenge of a multiscale framework as proposed here is that it can complicate the process of selecting spatial and temporal boundaries. With all the different ways of organizing space and time, varied—sometimes even contradictory—“truths” can emerge (Peter et al., 2021; Burke et al., 2022). The challenges (or opportunities) of MAUP/MTUP are consistent with the philosophy of pluralism, which is the idea that multiple factual versions of reality can coexist simultaneously and that each version offers unique insights, whether complementary or contradictory (Martin, 2021). Considering this challenge, the onus on the researcher to disentangle a story that best represents reality is complex. While difficult, the alternative is that the researcher selects a single spatial and temporal boundary and is unaware of phenomena that exist across other spatiotemporal dimensions. This notion is echoed by Comber and Harris (2022), who refer to an abundance of literature exhibiting scale blindness. Additionally, Manley (2021) recognized a problematic tendency associated with multiscale studies, noting that “to acknowledge the MAUP, even informally raises questions on the validity of the analysis conducted and any conclusions reached” (p. 1713). Martin (2021) put forth a case for why pluralism is a useful concept to employ in economic geography. While a singular temporal/spatial selection is understandable, logical, and still useful, it is argued here that results of such an analysis should be presented as specific to the spatiotemporal selections made and not extrapolated more broadly (Tuson et al., 2019). That is, the scale selected should match the granularity of the subject being analyzed and the conclusions drawn should address that specific scale (Tuson et al., 2019; Comber and Harris, 2022). At the very least, researchers should recognize MAUP and communicate explicitly the spatial and temporal selections made (Manley, 2021).
Somewhat in contrast to what is suggested here—that a multiscale view can provide multiscale insights—Tuson et al. (2019) assert that geographic analyses should take place at the smallest possible scale. Though very reasonable from a data analytics standpoint, the smallest possible scale is often not relevant to policymakers who operate at coarser scales, e.g., county versus state, and multivariate studies may be limited by data availability spanning multiple scales (Shariff et al., 2011; Peter et al., 2018). MAUP is particularly important in policy- and decision-making, as results obtained from spatial analysis at one scale may not be generalizable to another scale (Hennerdal and Nielsen, 2017; Chen et al., 2022). Put into practice, policies derived from such analyses may have serious social, economic, and ecological implications (Nelson and Brewer, 2017; Cima et al., 2021).
An obvious limitation of this analysis is that the “best” indices, zones, and temporal selections are not identified; however, the multiscale framework offers tools to handle problems of aggregations across space and time (MAUP, MTUP, and EFP) and uncover multiscale perspectives of agricultural production. To suggest that there may not be an optimal scale of analysis may be an unsatisfying conclusion, especially considering that multiple outlooks can produce divergent findings; however, modifiable spatiotemporal unit problems might simply be inescapable realities with which research will continuously contend and any proposed “solutions” merely manage the problem. A viewpoint expressed here and supported by Manley (2021) is that there may not necessarily a single optimal scale for a given analysis and that multiple scales can offer unique utility. Future use of this study and the tools supplied will enable future researchers, as well as those who have previously published on agricultural trends, to recontextualize or interrogate their results. Moreover, while rice production is the trend discussed in this paper, these tools are of use to any multiscale trend study, e.g., monitoring deforestation in the Amazon, maize production in Sub-Saharan Africa, or wetland rehabilitation in the US.
1. Spatial and temporal selections have a substantial effect on the results of any geospatial analysis. Spatial resolution, spatial selections, and temporal selections should be explicitly stated and MAUP/MTUP acknowledged.
2. When multiscale data are available, a sensitivity or optimization analysis should be undertaken, or a multiscale analysis considered.
3. The resolution of the conclusions drawn should match the resolution/scale of both the data and analysis. Caution should be given when attempting to extrapolate results above or below the analysis scale.
4. Multiscale solutions serve to disaggregate homogeneity at coarser scales to reveal finer-scale heterogeneity. Conversely, multiscale solutions can serve to aggregate heterogeneity at fine scales and be coarsened to more general trends at actionable or data rich levels.
5. Challenges associated with MAUP/MTUP in the context of agriculture are underrepresented in the literature and should be an area of more focused research.
6. LAI and EVI are effective indices for monitoring rice agriculture in Vietnam across multiple scales. Alternative index and descriptive statistic selections (i.e., those other than defaulting to NDVI and mean summaries) should be considered for any remote sensing of agriculture analysis.
7. The annual timescale proved to be a useful aggregation unit for monitoring rice agriculture in Vietnam, despite there being multiple crop production periods; however, for period-specific assessments, alternative timescales need to be selected.
8. Open access geospatial tools facilitate the production of multiscale maps and multiscale time-series charts.
Global satellites and time-series spatial information can help in the evaluation of long-term resilience of agricultural systems (Haworth et al., 2018); however, statistical aggregations can vary depending on how data are distributed across both spatial and temporal scales. Assumptions of areal and temporal homogeneity are often erroneously applied to an individual pixel, region, or epoch based on aggregated data (Openshaw, 1983). As demonstrated here, results biased by MAUP and MTUP phenomena can lead to misrepresentation of spatiotemporally dependent problems. Conversely, these phenomena can also be exploited as a framework to understand agricultural production across spatiotemporal scales. In rice agriculture, for example, production viewed through one temporal scale can lead to investments that inadequately address long-term trends, short-term situations, or emerging long-term changes.
Making use of multiscale temporal and spatial aggregations for four indicators (LAI, NDVI, GPP, and EVI), this paper first establishes a relationship between RS data and national statistics on rice production in Vietnam. The best-performing LAI and EVI sub-indicators were then used to explore productivity trends across Vietnam at the province and district level, as well as the pixel scale. Of particular note is that the method used for organizing space changes the outcomes of summary statistics. One question that may be asked is, what fraction of Vietnam is experiencing a negative linear trend? There is more than one answer. Going by province-scale aggregations, 25.4% of Vietnam provinces exhibit a negative linear trend, yet simultaneously 45.7% of Vietnam districts exhibit a negative linear trend (based on estimations from LAI-X-S). At the pixel scale, 34.7% of rice agriculture across Vietnam exhibits a negative linear trend. In addition to the variations produced from differing methods of organizing space, this manuscript also shows how time plays a major role in quantifying agricultural productivity. In the MRD, 3.6% more of rice agriculture exhibited a positive linear trend between 2010 and 2019 as compared to 2001–2010; however, while many pixels flipped positive, many also flipped negative.
While there is an abundance of research evaluating agricultural production in Vietnam, studies seldom produce results at multi-spatial and multi-temporal levels. To evaluate the impact of MAUP and MTUP, this study proposed a framework to conduct multiscale analysis that incorporates the impacts of spatial and temporal scales, by using the rice production in Vietnam over a 19-year period as a case to illustrate the utility. The MAUP/MTUP analytics presented here offer researchers a framework for conducting multiscale analyses and giving due consideration to the impact that spatial and temporal scales have when assessing agricultural production. This study also supplies generalizable tools to map, visualize, and quantify the linear trend of all possible year combinations within a temporal range to track agricultural production variability and identify both long- and short-term epochs with distinct trajectories, which can then be linked to both biophysical and socioeconomic drivers.
The datasets presented in this study can be found in online repositories. The names of the repository/repositories and accession number(s) can be found in the article/Supplementary material.
BP and JM were responsible for manuscript conceptualization, framework development, and conducting the geoprocessing. VB and CF provided insights into the historic and present socioeconomic and environmental state of rice production in Vietnam. AK and PF contributed to the economic perspective of the manuscript and aided with data acquisition. All authors contributed to the article and approved the submitted version.
This project was made possible by the NASA Land-Cover/Land-Use Change Program (Grant #: 80NSSC20K0740). https://lcluc.umd.edu/projects/divergent-local-responses-globalization-urbanization-land-transition-and-environmental.
The authors declare that the research was conducted in the absence of any commercial or financial relationships that could be construed as a potential conflict of interest.
All claims expressed in this article are solely those of the authors and do not necessarily represent those of their affiliated organizations, or those of the publisher, the editors and the reviewers. Any product that may be evaluated in this article, or claim that may be made by its manufacturer, is not guaranteed or endorsed by the publisher.
Bird, J. H. (1989) The changing worlds of geography: a critical guide to concepts and methods. Oxford: Clarendon Press.
Boumis, G., and Peter, B. G. (2021). Time-series matrix (TSMx): a visualization tool for plotting multiscale temporal trends. Harv. Dataverse. doi:10.7910/DVN/ZZDYM9
Brown, P. R., Tuan, V. V., Nhan, D. K., Dung, L. C., and Ward, J. (2018). Influence of livelihoods on climate change adaptation for smallholder farmers in the Mekong Delta Vietnam. Int. J. Agric. Sustain. 16 (3), 255–271. doi:10.1080/14735903.2018.1472858
Burke, W. J., Snapp, S. S., Peter, B. G., and Jayne, T. S. (2022). Sustainable intensification in jeopardy: transdisciplinary evidence from Malawi. Sci. Total Environ. 837, 155758. doi:10.1016/j.scitotenv.2022.155758
Cao, C., and Lam, N. S. N. (1997). “Understanding the scale and resolution effects in remote sensing and GIS,” in Scale in remote sensing and GIS. Editors M. F. Goodchild, and D. A. Quattrochi (New York, NY: Routledge), 57–72. doi:10.1201/9780203740170
Chapman, A., and Darby, S. (2016). Evaluating sustainable adaptation strategies for vulnerable mega-deltas using system dynamics modelling: rice agriculture in the Mekong delta’s an giang province, Vietnam. Sci. Total Environ. 559, 326–338. doi:10.1016/j.scitotenv.2016.02.162
Chen, L., Gao, Y., Zhu, D., Yuan, Y., and Liu, Y. (2019). Quantifying the scale effect in geospatial big data using semi-variograms. PloS One 14 (11), e0225139. doi:10.1371/journal.pone.0225139
Chen, X., Ye, X., Widener, M. J., Delmelle, E., Kwan, M. P., Shannon, J., et al. (2022). A systematic review of the modifiable areal unit problem (MAUP) in community food environmental research. Urban Inf. 1 (1), 22. doi:10.1007/s44212-022-00021-1
Cheng, T., and Adepeju, M. (2014). Modifiable temporal unit problem (MTUP) and its effect on space-time cluster detection. PloS One 9 (6), e100465. doi:10.1371/journal.pone.0100465
Cima, E. G., Freire da Rocha-Junior, W., Uribe-Opazo, M. A., and Dalposso, G. H. (2021). Modifiable areal unit problem (MAUP): analysis of agriculture of the state of paraná-Brazil. AGRIS on-line Pap. Econ. Inf. 13 (2), 35–50. doi:10.7160/aol.2021.130203
Clauss, K., Ottinger, M., Leinenkugel, P., and Kuenzer, C. (2018). Estimating rice production in the Mekong delta, Vietnam, utilizing time series of sentinel-1 SAR data. Int. J. Appl. Earth Observation Geoinformation 73, 574–585. doi:10.1016/j.jag.2018.07.022
Çöltekin, A., De Sabbata, S., Willi, C., Vontobel, I., Pfister, S., Kuhn, M., et al. (2011) Modifiable temporal unit problem. Paris: University of Zurich. Available at: http://www.geo.uzh.ch/∼arzu/publications/coltekin-etal-icc-geovis2011.pdf.
Comber, A., and Harris, P. (2022). The importance of scale and the MAUP for robust ecosystem service evaluations and landscape decisions. Land 11 (3), 399. doi:10.3390/land11030399
Connor, M., de Guia, A. H., Quilloy, R., Van Nguyen, H., Gummert, M., and Sander, B. O. (2020). When climate change is not psychologically distant–Factors influencing the acceptance of sustainable farming practices in the Mekong river Delta of Vietnam. World Dev. Perspect. 18, 100204. doi:10.1016/j.wdp.2020.100204
Connor, M., Tuan, L. A., DeGuia, A. H., and Wehmeyer, H. (2021). Sustainable rice production in the Mekong River Delta: factors influencing farmers’ adoption of the integrated technology package ‘one must do, five reductions’(1m5r). Outlook Agric. 50 (1), 90–104. doi:10.1177/0030727020960165
Dasgupta, S., Laplante, B., Meisner, C., Wheeler, D., and Yan, (2009). The impact of sea level rise on developing countries: a comparative analysis. Clim. Change 93 (3), 379–388. doi:10.1007/s10584-008-9499-5
de Andrade, S. C., Estrada, C. R., Nunes, L. H., Rodriguez, C. A. M., Estrella, J. C., Delbem, A. C. B., et al. (2021). A multicriteria optimization framework for the definition of the spatial granularity of urban social media analytics. Int. J. Geogr. Inf. Sci. 35 (1), 43–62. doi:10.1080/13658816.2020.1755039
de Jong, R., and de Bruin, S. (2012). Linear trends in seasonal vegetation time series and the modifiable temporal unit problem. Biogeosciences 9 (1), 71–77. doi:10.5194/bg-9-71-2012
Demont, M., and Rutsaert, P. (2017). Restructuring the Vietnamese rice sector: towards increasing sustainability. Sustainability 9 (2), 1–15. doi:10.3390/su9020325
Didan, K. (2015). MOD13Q1 MODIS/terra vegetation indices 16-day L3 global 250m SIN grid V006. NASA EOSDIS Land Process. DAAC. doi:10.5067/MODIS/MOD13Q1.006
Eckstein, D., Künzel, V., Schäfer, L., and Winges, M. (2019). Global Climate Risk Index 2020: Who suffers most from extreme weather events? Weather-related loss events in 2018 and 1999–2018. Berlin: Germanwatch.
FAO (2002) Rice information. Rome, Italy: FAO. Available at: https://www.fao.org/3/y4347e/y4347e00.htm.
Fotheringham, A. S., and Wong, D. W. S. (1991). The modifiable areal unit problem in multivariate statistical analysis. Environ. Plan. A 23 (7), 1025–1044. doi:10.1068/a231025
Gilardelli, C., Stella, T., Confalonieri, R., Ranghetti, L., Taberner, M. C., Haro, F. J. G., et al. (2019). Downscaling rice yield simulation at sub-field scale using remotely sensed LAI data. Eur. J. Agron. 103, 108–116. doi:10.1016/j.eja.2018.12.003
Gilbert, R. O. (1987) Statistical methods for environmental pollution monitoring. John Wiley and Sons.
Gorelick, N., Hancher, M., Dixon, M., Ilyushchenko, S., Thau, D., and Moore, R. (2017). Google Earth engine: planetary-scale geospatial analysis for everyone. Remote Sens. Environ. 202, 18–27. doi:10.1016/j.rse.2017.06.031
Haggett, P. (1965). “Scale components in geographical problems,” in Frontiers in geographical teaching (New York, NY: Routledge), 164–185. doi:10.4324/9780429273308
Harris, T. M. (2006). “Scale as artifact: GIS, ecological fallacy, and archaeological analysis,” in Confronting scale in archaeology (Springer), 39–53. doi:10.1007/0-387-32772-3_3
Haworth, B. T., Biggs, E., Duncan, J., Wales, N., Boruff, B., and Bruce, E. (2018). Geographic information and communication technologies for supporting smallholder agriculture and climate resilience. Climate 6 (4), 97. doi:10.3390/cli6040097
Hennerdal, P., and Nielsen, M. M. (2017). A multiscalar approach for identifying clusters and segregation patterns that avoids the modifiable areal unit problem. Ann. Am. Assoc. Geogr. 107 (3), 555–574. doi:10.1080/24694452.2016.1261685
Ho, T. T., and Shimada, K. (2019). The effects of climate smart agriculture and climate change adaptation on the technical efficiency of rice farming—an empirical study in the Mekong delta of Vietnam. Agriculture 9 (5), 99. doi:10.3390/agriculture9050099
Holt, D., Steel, D. G., Tranmer, M., and Wrigley, N. (1996). Aggregation and ecological effects in geographically based data. Geogr. Anal. 28 (3), 244–261. doi:10.1111/j.1538-4632.1996.tb00933.x
Hsieh, P. F., Lee, L. C., and Chen, N. Y. (2001). Effect of spatial resolution on classification errors of pure and mixed pixels in remote sensing. IEEE Trans. Geoscience Remote Sens. 39 (12), 2657–2663. doi:10.1109/36.975000
Huete, A., Justice, C., and Liu, H. (1994). Development of vegetation and soil indices for MODIS-EOS. Remote Sens. Environ. 49 (3), 224–234. doi:10.1016/0034-4257(94)90018-3
Ives, M. (2013) Mekong delta, rice boom has steep environmental cost. New Haven, CT: Yale Environment 360. Available at: https://e360.yale.edu/features/in_mekong_delta_rice_boom_has_steep_environmental_cost (Accessed May 7, 2024).
Jelinski, D. E., and Wu, J. (1996). The modifiable areal unit problem and implications for landscape ecology. Landsc. Ecol. 11 (3), 129–140. doi:10.1007/BF02447512
Kolaczyk, E. D., and Huang, H. (2001). Multiscale statistical models for hierarchical spatial aggregation. Geogr. Anal. 33 (2), 95–118. doi:10.1111/j.1538-4632.2001.tb00439.x
Kompas, T., Che, T. N., Nguyen, H. T. M., and Nguyen, H. Q. (2012). Productivity, Net returns, and efficiency: land and market reform in Vietnamese rice production. Land Econ. 88 (3), 478–495. doi:10.3368/le.88.3.478
Laiprakobsup, T. (2019). The policy effect of government assistance on the rice production in Southeast Asia: comparative case studies of Thailand, Vietnam, and the Philippines. Dev. Stud. Res. 6 (1), 1–12. doi:10.1080/21665095.2019.1568900
Larsen, J. L. (2000) The modifiable areal unit problem: a problem or a source of spatial information?. Columbus, OH: The Ohio State University. Available at: http://search.proquest.com/docview/304635509.
Lechner, A. M., Langford, W. T., Jones, S. D., Bekessy, S. A., and Gordon, A. (2012). Investigating species–environment relationships at multiple scales: differentiating between intrinsic scale and the modifiable areal unit problem. Ecol. Complex. 11, 91–102. doi:10.1016/j.ecocom.2012.04.002
Maitah, K., Smutka, L., Sahatqija, J., Maitah, M., and Phuong Anh, N. (2020). Rice as a determinant of Vietnamese economic sustainability. Sustainability 12 (12), 5123. doi:10.3390/su12125123
Manley, D. (2021). “Scale, aggregation, and the modifiable areal unit problem,” in Handbook of regional science. Editors M. Fischer, and P. Nijkamp (Berlin, Heidelberg: Springer Berlin Heidelberg), 1711–1725. doi:10.1007/978-3-662-60723-7_69
Mann, H. B. (1945). Nonparametric tests against trend. Econ. J. Econ. Soc. 13, 245–259. doi:10.2307/1907187
Martin, R. (2021). Putting the case for a pluralistic economic geography. J. Econ. Geogr. 21 (1), 1–28. doi:10.1093/jeg/lbaa025
Martinez, J. M., Guyot, J. L., Filizola, N., and Sondag, F. (2009). Increase in suspended sediment discharge of the Amazon River assessed by monitoring network and satellite data. Catena 79 (3), 257–264. doi:10.1016/j.catena.2009.05.011
Meentemeyer, V. (1989). Geographical perspectives of space, time, and scale. Landsc. Ecol. 3 (3), 163–173. doi:10.1007/BF00131535
Montanher, O. C., Novo, E. M. L. M., and Filho, E. E. S. (2018). Temporal trend of the suspended sediment transport of the Amazon River (1984–2016). Hydrological Sci. J. 63 (13–14), 1901–1912. doi:10.1080/02626667.2018.1546387
Monteith, J. L. (1972). Solar radiation and productivity in tropical ecosystems. J. Appl. Ecol. 9 (3), 747–766. doi:10.2307/2401901
Myneni, R., Knyazikhin, Y., and Park, T. (2015). MOD15A2H MODIS/terra leaf area index/FPAR 8-day L4 global 500m SIN grid V006. NASA EOSDIS Land Process. DAAC. doi:10.5067/MODIS/MOD15A2H.006
Nelson, J. K., and Brewer, C. A. (2017). Evaluating data stability in aggregation structures across spatial scales: revisiting the modifiable areal unit problem. Cartogr. Geogr. Inf. Sci. 44 (1), 35–50. doi:10.1080/15230406.2015.1093431
Nguyen, D. L., Grote, U., and Nguyen, T. T. (2019). Migration, crop production and non-farm labor diversification in rural Vietnam. Econ. Analysis Policy 63, 175–187. doi:10.1016/j.eap.2019.06.003
Nguyen Chau, T. (2021) The dynamics of Vietnam agriculture under changing conditions. Hamilton, New Zealand: Doctoral dissertation, The University of Waikato.
Openshaw, S. (1983). “The modifiable areal unit problem,” in Concepts and techniques in modern geography (Norwich, UK: Geo Books), 1–41.
Openshaw, S. (1984). Ecological fallacies and the analysis of areal census data. Environ. Plan. A 16 (1), 17–31. doi:10.1068/a160017
Pedroso, R., Tran, D. H., Viet, T. Q., Le, A. V., Dang, K. T., and Le Khac, P. (2018). Technical efficiency of rice production in the delta of the vu gia thu bon river basin, central Vietnam. World Dev. Perspect. 9, 18–26. doi:10.1016/j.wdp.2017.12.001
Peter, B. G., and Messina, J. (2019). Linear workflow for relating multispectral remote sensing imagery with on-farm plant measurements. Harv. Dataverse. doi:10.7910/DVN/CW20DZ
Peter, B. G., Messina, J., Raney, A., Principe, R., and Fan, P. (2021). MSZSI: multi-scale zonal statistics [AgriClimate] inventory. Harv. Dataverse. doi:10.7910/DVN/M4ZGXP
Peter, B. G., Messina, J. P., and Snapp, S. S. (2018). A multiscalar approach to mapping marginal agricultural land: smallholder agriculture in Malawi. Ann. Am. Assoc. Geogr. 108 (4), 989–1005. doi:10.1080/24694452.2017.1403877
Phan, H., Le Toan, T., Bouvet, A., Nguyen, L. D., Duy, T. P., and Zribi, M. (2018). Mapping of rice varieties and sowing date using X-band SAR data. Sensors 18 (1), 316. doi:10.3390/s18010316
Piantadosi, S., Byar, D. P., and Green, S. B. (1988). The ecological fallacy. Am. J. Epidemiol. 127 (5), 893–904. doi:10.1093/oxfordjournals.aje.a114892
R Core Team (2021) R: a language and environment for statistical computing. Vienna, Austria: R Foundation for Statistical Computing. Available at: https://www.R-project.org/.
Running, S., Mu, Q., and Zhao, M. (2015). MOD17A2H MODIS/terra gross primary productivity 8-day L4 global 500m SIN grid V006. NASA EOSDIS Land Process. DAAC. doi:10.5067/MODIS/MOD17A2H.006
Schloerke, B., Cook, D., Larmarange, J., Briatte, F., Marbach, M., Thoen, E., et al. (2024). GGally: Extension to 'ggplot2'. R package version 2.2.1. Available at: https://github.com/ggobi/ggally
Sen, L. T. H., and Bond, J. (2017). Agricultural adaptation to flood in lowland rice production areas of central Vietnam: understanding the ‘regenerated rice’ ratoon system. Clim. Dev. 9 (3), 274–285. doi:10.1080/17565529.2016.1149440
Shariff, A. R. M., Mahmud, A. R., Yusof, N. M. Z. N., and Hishamuddin, M. A. (2011). Spatial data infrastructure for Malaysia land administration. Int. J. Spatial Data Infrastructures Res. 6, 388–409. doi:10.2902/1725-0463.2011.05.art17
Shrestha, S., Deb, P., and Bui, T. T. T. (2016). Adaptation strategies for rice cultivation under climate change in Central Vietnam. Mitig. Adapt. Strateg. Glob. Chang. 21, 15–37. doi:10.1007/s11027-014-9567-2
Son, N. T., Chen, C. F., Chen, C. R., Chang, L. Y., Duc, H. N., and Nguyen, L. D. (2013a). Prediction of rice crop yield using MODIS EVI–LAI data in the Mekong delta, Vietnam. Int. J. Remote Sens. 34 (20), 7275–7292. doi:10.1080/01431161.2013.818258
Son, N. T., Chen, C. F., Chen, C. R., Duc, H. N., and Chang, L. Y. (2013b). A phenology-based classification of time-series MODIS data for rice crop monitoring in Mekong delta, Vietnam. Remote Sens. 6 (1), 135–156. doi:10.3390/rs6010135
Son, N. T., Chen, C. F., Chen, C. R., Minh, V. Q., and Trung, N. H. (2014). A comparative analysis of multitemporal MODIS EVI and NDVI data for large-scale rice yield estimation. Agric. For. Meteorology 197, 52–64. doi:10.1016/j.agrformet.2014.06.007
Stone, K. H. (1972). A geographer’s strength: the multiple-scale approach. J. Geogr. 71 (6), 354–362. doi:10.1080/00221347208981686
Stuart, A. M., Devkota, K. P., Sato, T., Pame, A. R. P., Balingbing, C., Phung, N. T. M., et al. (2018). On-farm assessment of different rice crop management practices in the Mekong delta, Vietnam, using sustainability performance indicators. Field Crops Res. 229, 103–114. doi:10.1016/j.fcr.2018.10.001
Tho, L. C. B., and Umetsu, C. (2022). Sustainable farming techniques and farm size for rice smallholders in the Vietnamese Mekong Delta: a slack-based technical efficiency approach. Agric. Ecosyst. Environ. 326 (1), 107775. doi:10.1016/j.agee.2021.107775
Tong, Y. D. (2017). Rice intensive cropping and balanced cropping in the Mekong delta, vietnam—economic and ecological considerations. Ecol. Econ. 132, 205–212. doi:10.1016/j.ecolecon.2016.10.013
Tran, Q. (2013). Vietnam grain and feed update. GAIN Rep. (VM3050), USDA Foreign Agric. Serv. Glob Agric. Inf. Netw.
Truong, D. D. (2022). Farming households’ satisfaction with quality of agricultural extension services: a case study of quang binh province, Vietnam. Front. Sustain. Food Syst. 5, 779477. doi:10.3389/fsufs.2021.779477
Tu, V. H. (2017). Resource use efficiency and economic losses: implications for sustainable rice production in Vietnam. Environ. Dev. Sustain. 19 (1), 285–300. doi:10.1007/s10668-015-9724-0
Tucker, C. J. (1979). Red and photographic infrared linear combinations for monitoring vegetation. Remote Sens. Environ. 8 (2), 127–150. doi:10.1016/0034-4257(79)90013-0
Tuson, M., Yap, M., Kok, M. R., Murray, K., Turlach, B., and Whyatt, D. (2019). Incorporating geography into a new generalized theoretical and statistical framework addressing the modifiable areal unit problem. Int. J. Health Geogr. 18, 6–15. doi:10.1186/s12942-019-0170-3
van Eck, N., and Waltman, L. (2010). Software survey: VOSviewer, a computer Program for bibliometric mapping. Scientometrics 84 (2), 523–538. doi:10.1007/s11192-009-0146-3
Vietnam General Statistics Office (GSO) (2021) Agriculture, forestry and fishery. Available at: https://www.gso.gov.vn/en/agriculture-forestry-and-fishery/.
Vu, K. (2024) Vietnam to cut annual rice exports by 44% to 4 million tonnes by 2030. Toronto, Canada: Reuters. Available at: https://www.reuters.com/article/idUSKBN2XI01A/ (Accessed May 7, 2024).
Watson, D. J. (1947). Comparative physiological studies on the growth of field crops: I. Variation in Net assimilation rate and leaf area between species and varieties, and within and between years. Ann. Bot. 11 (41), 41–76. doi:10.1093/oxfordjournals.aob.a083148
Watson, M. K. (1978). The scale problem in human geography. Geogr. Ann. Ser. B, Hum. Geogr. 60 (1), 36–47. doi:10.1080/04353684.1978.11879429
Web of Science (WOS) (2024) ClarivateTM. Available at: https://www.webofscience.com/wos/woscc/basic-search (Accessed May 7, 2024).
Wright, K. (2021) Package 'corrgram'. R package version 1.14. Available at: https://kwstat.github.io/corrgram/.
Wong, W. S. (2004). “The modifiable areal unit problem (MAUP),” in WorldMinds: geographical perspectives on 100 problems: commemorating the 100th anniversary of the association of American geographers 1904–2004. Editors D. G. Janelle, B. Warf, and K. Hansen (Dordrecht: Springer Netherlands), 571–575. doi:10.1007/978-1-4020-2352-1_93
Xiao, X., Boles, S., Frolking, S., Li, C., Babu, J. Y., Salas, W., et al. (2006). Mapping paddy rice agriculture in south and Southeast Asia using multi-temporal MODIS images. Remote Sens. Environ. 100 (1), 95–113. doi:10.1016/j.rse.2005.10.004
Xin, F., Xiao, X., Dong, J., Zhang, G., Zhang, Y., Wu, X., et al. (2020). Large increases of paddy rice area, gross primary production, and grain production in northeast China during 2000–2017. Sci. Total Environ. 711, 135183. doi:10.1016/j.scitotenv.2019.135183
Yuen, K. W., Hanh, T. T., Quynh, V. D., Switzer, A. D., Teng, P., and Lee, J. S. H. (2021). Interacting effects of land-use change and natural hazards on rice agriculture in the Mekong and Red River deltas in Vietnam. Nat. Hazards Earth Syst. Sci. 21 (5), 1473–1493. doi:10.5194/nhess-21-1473-2021
Zhang, B., Zhang, L., Guo, H., Leinenkugel, P., Zhou, Y., Li, L., et al. (2014). Drought impact on vegetation productivity in the lower Mekong Basin. Int. J. Remote Sens. 35 (8), 2835–2856. doi:10.1080/01431161.2014.890298
Keywords: modifiable areal unit problem, modifiable temporal unit problem, ecological fallacy problem, remote sensing of agriculture, rice in Vietnam
Citation: Peter BG, Messina JP, Breeze V, Fung CY, Kapoor A and Fan P (2024) Perspectives on modifiable spatiotemporal unit problems in remote sensing of agriculture: evaluating rice production in Vietnam and tools for analysis. Front. Remote Sens. 5:1042624. doi: 10.3389/frsen.2024.1042624
Received: 12 September 2022; Accepted: 29 May 2024;
Published: 21 June 2024.
Edited by:
Jane Southworth, University of Florida, United StatesReviewed by:
Nicola Genzano, University of Basilicata, ItalyCopyright © 2024 Peter, Messina, Breeze, Fung, Kapoor and Fan. This is an open-access article distributed under the terms of the Creative Commons Attribution License (CC BY). The use, distribution or reproduction in other forums is permitted, provided the original author(s) and the copyright owner(s) are credited and that the original publication in this journal is cited, in accordance with accepted academic practice. No use, distribution or reproduction is permitted which does not comply with these terms.
*Correspondence: Brad G. Peter, bradp@uark.edu
†Present address: Peilei Fan, Department of Urban and Environmental Policy and Planning, Tufts University, Medford, MA, United States
Disclaimer: All claims expressed in this article are solely those of the authors and do not necessarily represent those of their affiliated organizations, or those of the publisher, the editors and the reviewers. Any product that may be evaluated in this article or claim that may be made by its manufacturer is not guaranteed or endorsed by the publisher.
Research integrity at Frontiers
Learn more about the work of our research integrity team to safeguard the quality of each article we publish.